SOP No: QAS-SOP-16...SOP No: QAS-SOP-16 Revision 7.0 Effective Date: “Approved by” date Page 7...
59
Transcript of SOP No: QAS-SOP-16...SOP No: QAS-SOP-16 Revision 7.0 Effective Date: “Approved by” date Page 7...


SOP No: QAS-SOP-16 Revision 7.0
Effective Date: “Approved by” date
Page 2 of 59
2
HISTORY OF REVISIONS
Revision Number Issue Date Action Description 6.0 March 2008 Original
7.0 March 2014 Reformatted document, action for TEF Sec 5.10
Revised format for compliance with QAS-
SOP-002

SOP No: QAS-SOP-16 Revision 7.0
Effective Date: “Approved by” date
Page 3 of 59
3
TABLE OF CONTENTS
1.0 Purpose ..................................................................................................................................................................... 4
2.0 Applicability ............................................................................................................................................................. 4
3.0 Precautions ............................................................................................................................................................... 4
4.0 Definitions ................................................................................................................................................................ 4
5.0 Procedural Steps ....................................................................................................................................................... 9
6.0 Qualifications.......................................................................................................................................................... 31
7.0 Health and Safety .................................................................................................................................................... 32
8.0 Interferences ........................................................................................................................................................... 32
9.0 Equipment and Supplies ......................................................................................................................................... 33
10.0 Data and Records Management .............................................................................................................................. 33
11.0 Quality Assurance and Quality Control .................................................................................................................. 33
12. References .............................................................................................................................................................. 34
Attachment ........................................................................................................................................................................... 34
I Primary Data Qualifiers .............................................................................................................................................. 34
II Element® Qualifier Definitions ................................................................................................................................... 35
III Data Review Summary Narrative ............................................................................................................................... 39
IV Summary of Problems and Comments ........................................................................................................................ 40
V Checklist for Task Order Compliance for Dioxin Data Packages delivered under DLM02.0 .................................... 46
VI Internal PCDD/PCDF Spreadsheet ............................................................................................................................. 52
VII Time Tracker .......................................................................................................................................................... 53
VIII Data Quality Assessment Report (non-CLP) .......................................................................................................... 54

SOP No: QAS-SOP-16 Revision 7.0
Effective Date: “Approved by” date
Page 4 of 59
4
1.0 Purpose
The objective of this Standard Operating Procedure (SOP) is to assist in the technical review of polychlorinated dibenzo-p-dioxin (PCDD) and polychlorinated dibenzofuran (PCDF) analytical data. This SOP is to help clarify and augment the review guidance of the National Functional Guidelines for Chlorinated Dioxin/Furan Data Validation, September 2005, to give guidance for areas of data review that require considerable professional judgment, and to specify procedures that are unique to the needs of Region 4. The document also defines the formats of data review reports and the data entered into the Region 4 LIMS (Element®). This document does not discuss risk assessment and the user must seek other assistance in this area. In addition, determining contract compliance is not the intended objective of these guidelines.
2.0 Applicability
This SOP is applicable to CDD/CDF data collected from environmental sample matrices using a high resolution gas chromatograph and high resolution mass spectrometry (HRGC/HRMS) method. This SOP is based on the quality assurance and quality control (QA/QC) requirements specified in Exhibit D of DLM02.0 of the USEPA Contract Laboratory Program, Statement of Work (SOW) for Analysis of Chlorinated Dibenzo-p-dioxins (CCDs) and Chlorinated Dibenofurans (CDFs), Multi-Media, Multi-Concentration, Solicitation Number PR-HQ-00-11943, May 2005, as well as the additional requirements for Region specified in the Dioxin Analytical Services Client Request Form submitted to the laboratories for the CDD/CDF projects. From time to time, Region 4 also reviews the data generated by EPA Method 1613B (October 1994) and EPA SW846 Method 8290A (February 2007). The specified QA/QC requirements in these methods, typically a subset of the requirements under the CLP protocols, will be used for data quality evaluation.
3.0 Precautions Not applicable
4.0 Definitions ANALYSIS DATE/TIME - The date and military time (24-hour clock) of the injection of the sample, standard, or blank into the High Resolution Gas Chromatography/High Resolution Mass Spectrometry (HRGC/HRMS). CALIBRATION STANDARD (CS) - A solution prepared from a secondary standard and/or stock solutions, and used to calibrate the response of the instrument with respect to analyte concentration.

SOP No: QAS-SOP-16 Revision 7.0
Effective Date: “Approved by” date
Page 5 of 59
5
CALIBRATION VERIFICATION STANDARD - The Mid-Point Calibration Standard that is used to verify the initial calibration of the system. CLEANUP STANDARD - A standard containing 37Cl4-2,3,7,8-TCDD that is added to all extracts prior to cleanup. The purpose of this standard is to measure the efficiency of the cleanup process. COLUMN PERFORMANCE SOLUTION (CPS) - When the Window Defining Mixture (WDM) and the Isomer Specificity Check solutions are combined, the solution is identified as the CPS. CONGENER - Individual compound belonging to a group or class of compounds with a similar general structure. CONTAMINATION - A component of a sample or an extract that is not representative of the environmental source of the sample. Contamination may stem from other samples, sampling equipment, while in transit, from laboratory reagents, laboratory environment, or analytical instruments. CONTRACT LABORATORY PROGRAM (CLP) – Supports USEPA’s Superfund effort by providing a range of state-of-the-art chemical analytical services of known quality. This program is directed by the Analytical Services Branch (ASB) of the USEPA Office of Superfund Remediation and Technology Innovation (OSRTI). CONTRACT REQUIRED QUANTITATION LIMIT (CRQL) – Minimum level of quantitation acceptable under the contract Statement of Work (SOW). DAY - Unless otherwise specified, day shall mean calendar day. ESTIMATED DETECTION LIMIT (EDL) - The concentration of an analyte required to produce a signal with peak height of at least 2.5 times the background signal level. The EDL is calculated for each 2,3,7,8-substituted isomer for which the response of the primary and secondary ions is less than 2.5 times the background level. ESTIMATED MAXIMUM POSSIBLE CONCENTRATION (EMPC) - The EMPC is calculated for 2,3,7,8-substituted isomers for which the quantitation and/or confirmation ion(s) has signal to noise in excess of 2.5, but does not meet identification criteria. EXTRACTABLE - A compound that can be partitioned into an organic solvent from the sample matrix, and is amenable to Gas Chromatography (GC). FIELD BLANK – Any sample that is submitted from the field and is identified as a blank. This includes trip blanks, rinsates, equipment blanks, etc. FIELD QC – Any Quality Control (QC) samples submitted from the field to the laboratory. Examples include, but are not limited to, field blanks, field duplicates, and field spikes.

SOP No: QAS-SOP-16 Revision 7.0
Effective Date: “Approved by” date
Page 6 of 59
6
FIELD SAMPLE – A portion of material obtained from an assigned site to be analyzed that is contained in single or multiple containers and identified by a unique EPA Sample Number. GEL PERMEATION CHROMATOGRAPHY (GPC) - A size-exclusion chromatographic technique that is used as a cleanup procedure for removing large organic molecules, particularly naturally occurring macro-molecules such as lipids, polymers, viruses, etc. HOLDING TIME – The elapsed time expressed in days from the date of receipt of the sample by the laboratory until the date of its analysis. HOMOLOGUE - A group of compounds that have the same molecular weight, but not necessarily the same structural arrangement. HPLC - High Performance Liquid Chromatography or High Performance Liquid Chromatography. HRGC - High Resolution Gas Chromatograph or Gas Chromatography. HRMS - High Resolution Mass Spectrometer or Mass Spectrometry. INITIAL CALIBRATION - Analysis of analytical standards for a series of different specified concentrations. It is used to define the linearity and dynamic range of the response of the Mass Spectrometer (MS) to the target compounds. INTEGRATION SCAN RANGE - Range from the scan number of the scan at the beginning of the area of integration to the scan number at the end of the area of integration. INTEGRATION TIME RANGE - The Retention Time (RT) at the beginning of the area of integration to the RT at the end of the area of integration. INTERNAL STANDARD - 13C12-1,2,3,4-TCDD and 13C12-1,2,3,7,8,9-HxCDD standards are added to every blank, Quality Control (QC) sample, and sample extract aliquot just prior to analysis. ISOMER - Chemical compounds that have the same molecular formula, but differ in structural arrangement and properties. For example, 1,2,3,4-TCDD and 2,3,7,8-TCDD are structural isomers. LABELED COMPOUNDS - Isotopically labeled compounds that are added to every sample and are present at the same concentration in every blank, Quality Control sample, and calibration solution. The labeled compounds (internal standards) are added to the sample before extraction and are used to measure the concentrations of the analytes. LABORATORY CONTROL SAMPLE (LCS) - Aliquot of a reference matrix fortified (spiked) with known quantities of specific compounds and subjected to the entire analytical procedure to determine the accuracy of the method by measuring recovery. LABORATORY RECEIPT DATE – The date on which a sample is received at the laboratory’s facility, as recorded on the shipper’s delivery receipt and Sample Traffic Report/Chain of Custody Record (TR/COC).

SOP No: QAS-SOP-16 Revision 7.0
Effective Date: “Approved by” date
Page 7 of 59
7
m/z - Mass-to-charge ratio, synonymous with "m/e". MATRIX - The predominant material of which the sample to be analyzed is composed. For the purpose of this SOP, a sample matrix is either water, soil, sediment, sludge, tissue, ash, oil, or oily matrices. Matrix is not synonymous with phase (liquid or solid). MATRIX EFFECT - In general, the effect of a particular matrix on the constituents with which it contacts. This is particularly pronounced for clay particles which may adsorb chemicals and catalyze reactions. Matrix effects may prevent extraction of target analytes. In addition, non-target analytes may be extracted from the matrix and cause interferences. METHOD BLANK - An analytical control consisting of reference material, labeled compounds, internal standards, and cleanup standards that is carried throughout the entire analytical procedure. The method blank is used to define the level of laboratory, background, and reagent contamination. NARRATIVE (SDG Narrative) - Portion of the data package which includes laboratory, contract, Case and Sample Number identification, and descriptive documentation of any problems encountered in processing the samples, along with corrective action taken and problem resolution. PERFORMANCE EVALUATION (PE) SAMPLE – A sample of known composition provided by USEPA for laboratory analysis. Used by USEPA to evaluate laboratory performance. REAGENT WATER - Water demonstrated to be free from the analytes of interest and potentially interfering substances. RELATIVE PERCENT DIFFERENCE (RPD) - As used in the method to compare two values, the RPD is based on the mean of the two values, and is reported as an absolute value (i.e., always expressed as a positive number or zero). RELATIVE RESPONSE (RR) - A measure of the relative mass spectral response of the native compound compared to its labeled compound analog. RRs are determined using the area responses of both the primary and secondary exact m/z's for each compound in each calibration standard. RELATIVE RESPONSE FACTOR (RRF) - The ratio of the response of a given compound to its corresponding internal standard. Response factors are determined using the area responses of both the primary and secondary exact m/z's for each compound in each calibration standard. RELATIVE STANDARD DEVIATION (%RSD) - The standard deviation times 100, divided by the mean. Also termed Coefficient of Variation. RESPONSE or INSTRUMENTAL RESPONSE - A measurement of the output of the High Resolution Gas Chromatograph/High Resolution Mass Spectrometer (HRGC/HRMS) detector in which the intensity of the signal is proportionate to the amount (or concentration) detected. Measured by peak area or peak height.
SOP No: QAS-SOP-16 Revision 7.0
Effective Date: “Approved by” date
Page 8 of 59
8
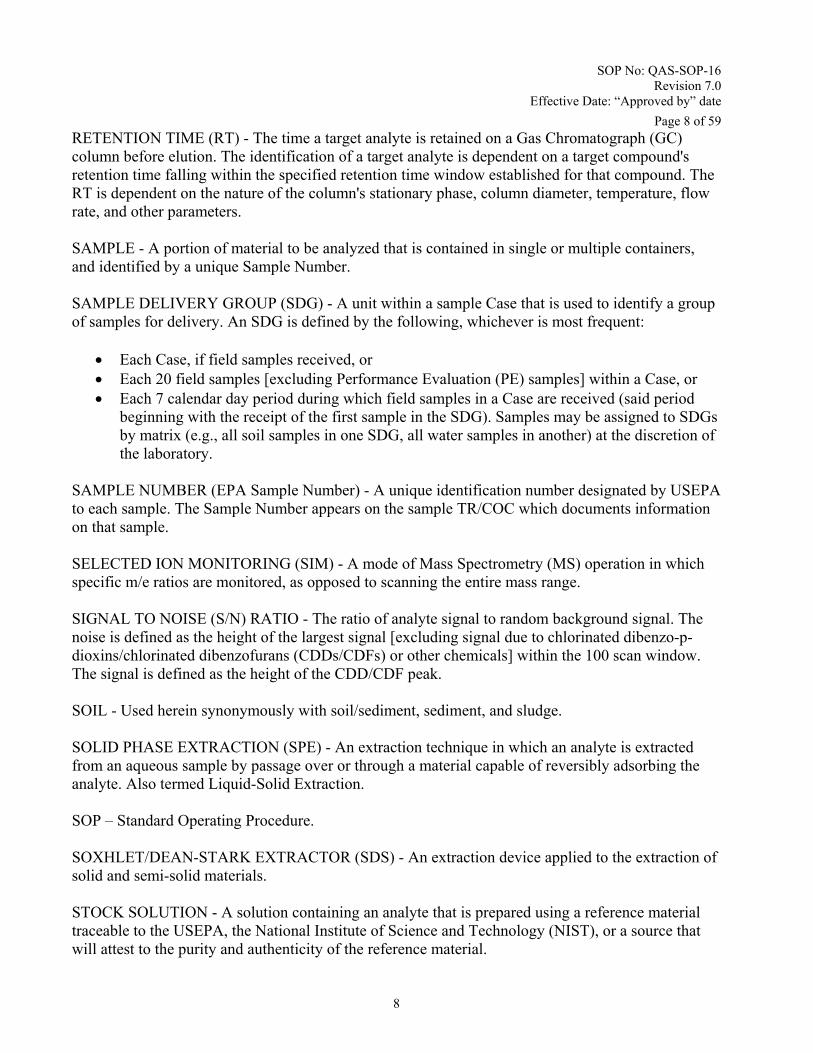
RETENTION TIME (RT) - The time a target analyte is retained on a Gas Chromatograph (GC) column before elution. The identification of a target analyte is dependent on a target compound's retention time falling within the specified retention time window established for that compound. The RT is dependent on the nature of the column's stationary phase, column diameter, temperature, flow rate, and other parameters. SAMPLE - A portion of material to be analyzed that is contained in single or multiple containers, and identified by a unique Sample Number. SAMPLE DELIVERY GROUP (SDG) - A unit within a sample Case that is used to identify a group of samples for delivery. An SDG is defined by the following, whichever is most frequent:
Each Case, if field samples received, or Each 20 field samples [excluding Performance Evaluation (PE) samples] within a Case, or Each 7 calendar day period during which field samples in a Case are received (said period
beginning with the receipt of the first sample in the SDG). Samples may be assigned to SDGs by matrix (e.g., all soil samples in one SDG, all water samples in another) at the discretion of the laboratory.
SAMPLE NUMBER (EPA Sample Number) - A unique identification number designated by USEPA to each sample. The Sample Number appears on the sample TR/COC which documents information on that sample. SELECTED ION MONITORING (SIM) - A mode of Mass Spectrometry (MS) operation in which specific m/e ratios are monitored, as opposed to scanning the entire mass range. SIGNAL TO NOISE (S/N) RATIO - The ratio of analyte signal to random background signal. The noise is defined as the height of the largest signal [excluding signal due to chlorinated dibenzo-p-dioxins/chlorinated dibenzofurans (CDDs/CDFs) or other chemicals] within the 100 scan window. The signal is defined as the height of the CDD/CDF peak. SOIL - Used herein synonymously with soil/sediment, sediment, and sludge. SOLID PHASE EXTRACTION (SPE) - An extraction technique in which an analyte is extracted from an aqueous sample by passage over or through a material capable of reversibly adsorbing the analyte. Also termed Liquid-Solid Extraction. SOP – Standard Operating Procedure. SOXHLET/DEAN-STARK EXTRACTOR (SDS) - An extraction device applied to the extraction of solid and semi-solid materials. STOCK SOLUTION - A solution containing an analyte that is prepared using a reference material traceable to the USEPA, the National Institute of Science and Technology (NIST), or a source that will attest to the purity and authenticity of the reference material.

SOP No: QAS-SOP-16 Revision 7.0
Effective Date: “Approved by” date
Page 9 of 59
9
TRAFFIC REPORT/CHAIN OF CUSTODY RECORD (TR/COC) - A USEPA sample identification form filled out by the sampler, that accompanies the sample during shipment to the laboratory and is used to document sample identity, sample chain-of-custody, sample condition, and sample receipt by the laboratory. TOXICITY EQUIVALENCE FACTOR (TEF) - A coefficient relating the risks from a particular compound to another compound. TWELVE-HOUR TIME PERIOD - For dioxin/furan analyses performed by High Resolution Gas Chromatography/High Resolution Mass Spectrometry (HRGC/HRMS), the 12-hour time period in the analytical sequence begins at the moment of injection of the Window Defining Mixture (WDM) that precedes sample analyses, and ends after 12 hours have elapsed according to the system clock. WINDOW DEFINING MIXTURE (WDM) - Prior to analyzing the calibration solutions, blanks, samples, and Quality Control (QC) samples, the Retention Time (RT) WDM is analyzed to define the beginning RTs for the dioxin and furan isomers and evaluate descriptor switching times.
5.0 Procedural Steps
5.1 Holding Times
The holding times for extraction/preparation presented in Exhibit D of DLM02.0, Section 8.3.1 are considered contractual holding times only and are not to be considered for technical qualification of analytical data.
Criteria:
The most recent guidance available (Method 1613B) indicates that there are no demonstrated maximum holding times associated with the extraction/preparation of CDDs/CDFs in aqueous, solid, semi-solid, tissues, and other sample matrices. If samples are stored properly, the holding times for extraction/preparation are up to one year. Aqueous, solid, semi-solid samples should be stored in the dark at 0-4 o C. Tissue samples should be stored in the dark at less than -10 o C and if properly stored in the dark at less than – 10 o C, sample extracts may be stored up to one year.
If residual chlorine is present in potable water and municipal waste water samples, dechlorination should be performed and documented.

SOP No: QAS-SOP-16 Revision 7.0
Effective Date: “Approved by” date
Page 10 of 59
10
Action: If the holding times specified in Method 1613B for extraction and/or for analysis of sample
extracts are exceeded, positive results are considered to be estimated (J flag) and non-detects are considered to be unusable (R flag). Temperature excursions during shipment of aqueous, solid, semi-solid or tissue sample matrices do not typically require action; however, use professional judgment if the temperature excursion is unusually high or is for an extended time.
5.2 System Performance
Demonstration of system performance is a fundamental requirement for any laboratory using DLM02.0 and other High Resolution Mass Spectrometry (HRMS) methods [e.g., Method 1613 (Revision B) or SW-846 Method 8290A (Revision 1)]. If mass calibration and resolution tuning is not correctly performed, interferences may degrade chlorinated dibenzo-p-dioxin and chlorinated dibenzofuran (CDD/CDF) identification and quantitation. Mass calibration and resolution is the first part of the three fundamental High Resolution Gas Chromatography/HRMS (HRGC/HRMS) system performance checks. The second fundamental performance check is the Window Defining Mixture (WDM) for the Mass Spectrometer Selected Ion Monitoring (SIM) scan descriptor switching times. The third fundamental performance check is Gas Chromatograph (GC) resolution. 1. Mass Calibration and Mass Spectrometer Resolution Criteria: Review the hardcopy of Mass Spectrometer resolution demonstration. Laboratories are required to provide evidence of Mass Spectrometer resolution > 10,000 at the beginning and end of each 12-hour analytical sequence. Documentation of Mass Spectrometer resolving power must include a hardcopy peak profile of a high-mass reference signal from PFK (e.g., m/z 380.9760) obtained during peak matching with another high-mass ion (e.g., m/z 304.9824). The selection of the low- and high-mass ions must be such that they provide the largest voltage jump in any of the five mass descriptors. The format of the peak profile representation must allow manual determination of Mass Spectrometer resolution [i.e., the horizontal axis must be a calibrated mass scale (amu or ppm per division)]. The result of the peak width measurement must appear on the hardcopy. Most laboratories include documentation of resolving power for each descriptor channel. The deviation between the exact m/z and the theoretical m/z monitored must be < 5 ppm. In other words, the maximum of the peak matching profile must be within the 5 ppm range shown at the top of the window. If there was not enough PFK in the system, the profile peaks may not fill the window, but should be Gaussian shaped and centered in the window. If the system is very noisy and the profile is covered with spikes, it may be very difficult to evaluate performance. If the laboratory has included information for all descriptors, examine each to determine whether only a single descriptor or the entire system is subject to noise.

SOP No: QAS-SOP-16 Revision 7.0
Effective Date: “Approved by” date
Page 11 of 59
11
Action: Mass Spectrometer resolution is critical to the success of this method of CDD/CDF analysis. In the event that Mass Spectrometer resolution is < 10,000, or there is evidence of system noise, the evidence provided must be carefully evaluated, and additional information requested as needed. If only one or two out of five descriptors show resolution < 10,000, the reviewer may consider qualifying all associated results as unusable (R flag). However, if the majority of the descriptors show significant system noise, or resolution < 10,000, qualify all associated data as unusable (R flag). 2. Window Defining Mixture
Review the Form(s) 5DFA (Form V-HR CDD-1). Prior to the calibration of the High Resolution Gas Chromatograph/High Resolution Mass Spectrometer (HRGC/HRMS) system, the laboratory must establish the appropriate switching times for the Selected Ion Monitoring (SIM) descriptors and verify the chromatographic resolution. The switching times are determined by the analysis of the Window Defining Mixture (WDM) which contains the first and last eluting isomers in each homologue. Chromatographic resolution is verified by analyzing one of two Isomer Specificity Check (ISC) solutions, depending on the Gas Chromatograph (GC) column used for analysis. The WDM and ISC can be combined in a single Column Performance Solution (CPS) analysis at the discretion of the analyst. The 12-hour time period begins with the injection of the WDM or CPS. Criteria: The WDM must be analyzed after the PFK tune and before any calibration standards on each instrument and GC column used for analysis, once at the beginning of each 12hour period during which standards or samples are analyzed and whenever adjustments or instrument maintenance activities are performed that may affect Retention Times (RTs). Different mixtures are used for various columns.
Verify that the WDM is analyzed at the required frequency. Examine the WDM chromatograms to determine when descriptor switching times are turned on and off. Note the RT of each first and last eluting isomer in each homologue for identification of switching times. Each positive dioxin and furan result (tetra- through hepta-) must have an RT within the limits established by the WDM for the corresponding homologue. The 2,3,7,8-substituted dioxins and furans must also meet the Relative Retention Time (RRT) limits in the SOW.

SOP No: QAS-SOP-16 Revision 7.0
Effective Date: “Approved by” date
Page 12 of 59
12
Action: If the WDM was not analyzed at the required frequency or correct adjustments in descriptor switching times are not evident, but the calibration standards met specifications the individual 2,3,7,8-substituted target analyte results may be usable without qualification. If the WDM fails and the laboratory did not take appropriate corrective action and/or chromatography for the calibration standards indicates a significant problem with descriptor switching times, qualify all associated data as unusable (R flag). Notify the Task Order Project Officer (TOPO) to decide if sample reanalysis is necessary.
3. Chromatographic Resolution Evaluate the ability of the Gas Chromatograph (GC) column to resolve the closely eluting dioxin and furan isomers by reviewing Form 5DFB (Form V-HR CDD-2), and the corresponding Selected Ion Current Profile (SICP) of each isomer and each of the analyses reported on Form 5DFB. An evaluation must be made for each column used in the analysis of samples. Criteria: For the DB-5 (or equivalent) column, the chromatographic peak separation between the 2,3,7,8-TCDD peak and the 1,2,3,8-TCDD peak must be resolved with a valley of ≤ 25% using the following equation:
Valley = x/y * 100
Where, x = The measurement from the baseline to the deepest part of the valley between 2,3,7,8-TCDD and 1,2,3,8-TCDD, and y = The peak height of 2,3,7,8-TCDD Chromatographic resolution criteria for the DB-225 (or equivalent) column are that the peak separation between the 2,3,7,8-TCDF peak and the 2,3,4,7-TCDF peak must be resolved with a valley of < 25% using the equation above.
Further analysis may not proceed until the GC resolution criteria have been met. The identical HRGC/HRMS conditions used for the analysis of the WDM, ISC, and CPS solutions must also be used for the analysis of the initial calibration and calibration verification solutions. Analysis on a single GC column (as opposed to situations requiring second column confirmation) is acceptable if the required separation of all of the 2,3,7,8-substituted isomers is demonstrated and the resolution criteria for both the DB-5 and DB-225 (or equivalent) columns are met, as stated above.
SOP No: QAS-SOP-16 Revision 7.0
Effective Date: “Approved by” date
Page 13 of 59
13
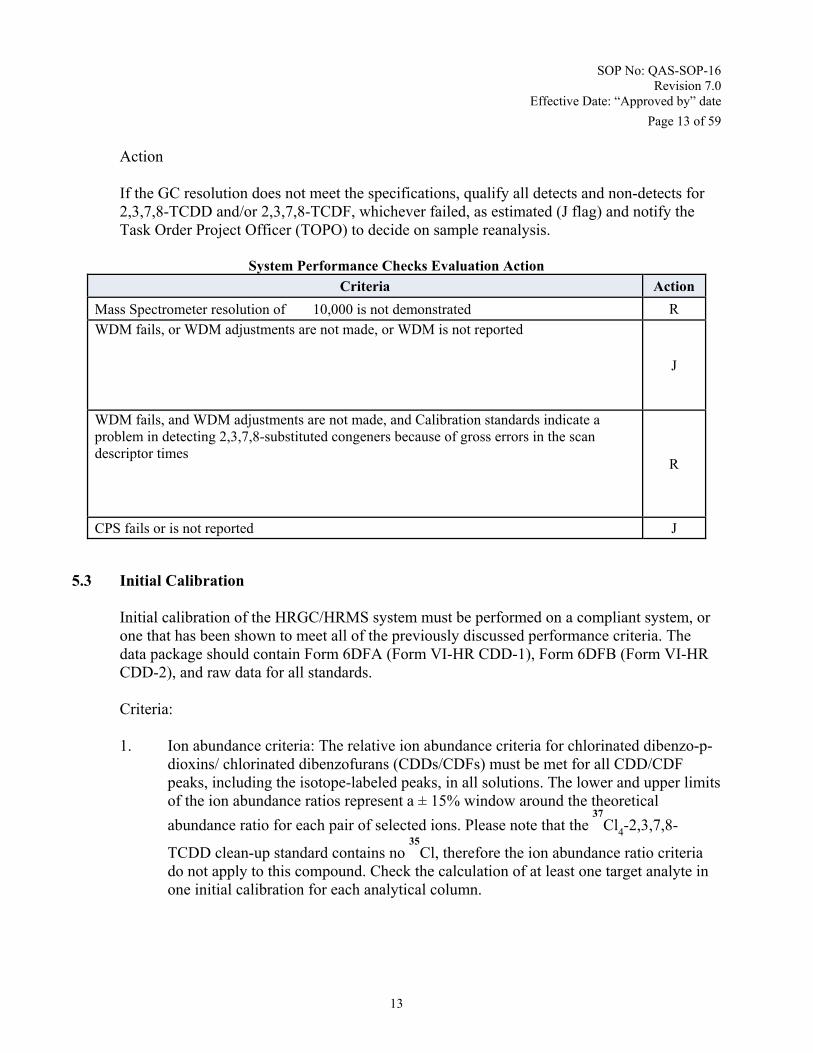
Action If the GC resolution does not meet the specifications, qualify all detects and non-detects for 2,3,7,8-TCDD and/or 2,3,7,8-TCDF, whichever failed, as estimated (J flag) and notify the Task Order Project Officer (TOPO) to decide on sample reanalysis.
System Performance Checks Evaluation Action
Criteria Action
Mass Spectrometer resolution of ��10,000 is not demonstrated R
WDM fails, or WDM adjustments are not made, or WDM is not reported
J
WDM fails, and WDM adjustments are not made, and Calibration standards indicate a problem in detecting 2,3,7,8-substituted congeners because of gross errors in the scan descriptor times
R
CPS fails or is not reported J
5.3 Initial Calibration Initial calibration of the HRGC/HRMS system must be performed on a compliant system, or one that has been shown to meet all of the previously discussed performance criteria. The data package should contain Form 6DFA (Form VI-HR CDD-1), Form 6DFB (Form VI-HR CDD-2), and raw data for all standards. Criteria: 1. Ion abundance criteria: The relative ion abundance criteria for chlorinated dibenzo-p-
dioxins/ chlorinated dibenzofurans (CDDs/CDFs) must be met for all CDD/CDF peaks, including the isotope-labeled peaks, in all solutions. The lower and upper limits of the ion abundance ratios represent a ± 15% window around the theoretical
abundance ratio for each pair of selected ions. Please note that the 37
Cl4-2,3,7,8-
TCDD clean-up standard contains no 35
Cl, therefore the ion abundance ratio criteria do not apply to this compound. Check the calculation of at least one target analyte in one initial calibration for each analytical column.
SOP No: QAS-SOP-16 Revision 7.0
Effective Date: “Approved by” date
Page 14 of 59
14
2. Retention Time (RT) criteria: For all calibration solutions, the RTs of the isomers
must fall within the appropriate RT windows established by the WDM analysis. In
addition, the absolute RT of the internal standard 13
C12-1,2,3,4-TCDD must exceed 25 minutes on the DB-5 (or equivalent) column and 15 minutes on the DB-225 (or equivalent) column.
3. Mass Spectrometer sensitivity criteria: For all calibration solutions, including the CS1
solution, the S/N ratio must be > 10:1. 4. Linearity criteria: The RRFs and Percent Relative Standard Deviation (%RSD) of the
five RRFs (CS1-CS5) for each compound applicable to RRF (internal standard) treatment is calculated. The %RSD of the five RRFs (CS1-CS5) must not exceed 35% for these compounds. Likewise, the RR and %RSD of the five RRs (CS1-CS5) for each compound applicable to RR (isotope dilution) treatment is calculated. The %RSD of the five RRs (CS1-CS5) must not exceed 20% for these compounds.
5. Concentration criteria: All initial Calibration Standards (CSs) must be analyzed at the
correct concentration levels (see SOW). 6. Frequency criteria: Each HRGC/HRMS system must be initially calibrated to meet the
terms of the contract whenever the laboratory takes corrective action which may change or affect the initial calibration criteria, or if the calibration verification (CS3 calibration verification) acceptance criteria cannot be met even after corrective action.
Action:
1. All initial calibration standards must be analyzed at the concentrations described in
the DLM02.0 SOW. Initial calibrations must be performed when the contract is awarded, whenever significant instrument maintenance is performed (e.g., ion source cleaning, GC column replacement, etc.), or if calibration verification criteria are not met.
2. If an analyte in a calibration standard failed the ion abundance ratio criteria, qualify
sample results analyzed immediately after that initial calibration using the RR, RRFs or values for quantitation as unusable (“R” flag) for that analyte, because both the RRF and RR values depend on the areas used in the ion abundance ratio. Failed ion abundance ratio criteria for any analyte is a cause for concern, and may indicate that the Mass Spectrometer is not tuned correctly, the zero point is not correctly adjusted, or other problems.

SOP No: QAS-SOP-16 Revision 7.0
Effective Date: “Approved by” date
Page 15 of 59
15
3. Use professional judgment for a more in-depth review to minimize the qualification of
data which may be accomplished by considering the following hypothetical examples:
a. If the ion abundance ratio is not within the limits for an analyte in the CS1 solution, qualify the low-end results for that analyte (below the CS2 concentration) as unusable (“R” flag). b. If the ion abundance ratio is not within the limits for an analyte in the CS5 solution, qualify the high-end results for that analyte (above the CS4 concentration) as unusable (“R” flag).
4. If failed resolution criteria involve tetrachlorinated dibenzo-p-dioxin (TCDD) isomers,
qualify only those isomers as estimated (“J” flag). Request a reanalysis for all samples following a failed resolution to ensure the quantity of isomers present. When GC resolution capability is lacking, assume that 2,3,7,8-TCDD is the only isomer present.
5. If the %RSD is not within ± 20% and ± 35% for the RR and RRF, respectively,
qualify the detects as estimated (“J” flag). The reviewer may discard either the CS1 or CS5 values for the initial calibration and recalculate the %RSD. If discarding either of these points brings the %RSD within the specified limits, qualify either the low- or high-end hits, depending on which point was discarded. Use professional judgment to request reanalysis if either of these scenarios affect a majority of the data.
6. The situation when the S/N ratio 10:1 sensitivity requirements are not met usually
occurs for the low standard (CS1). In these instances, consider dropping the lowest calibration point and qualifying any results less than the CS2 standard as estimated (J flag). If problems with noise affect more than the low level standard, reanalysis should be requested, or the associated data may need to be rejected (“R” flag).
7. If retention time criteria are not met for an initial calibration, all non-detect results
should be considered suspect and qualified as rejected (“R” flag). The TOPO should be contacted to request a re-analysis of the associated samples.
SOP No: QAS-SOP-16 Revision 7.0
Effective Date: “Approved by” date
Page 16 of 59
16
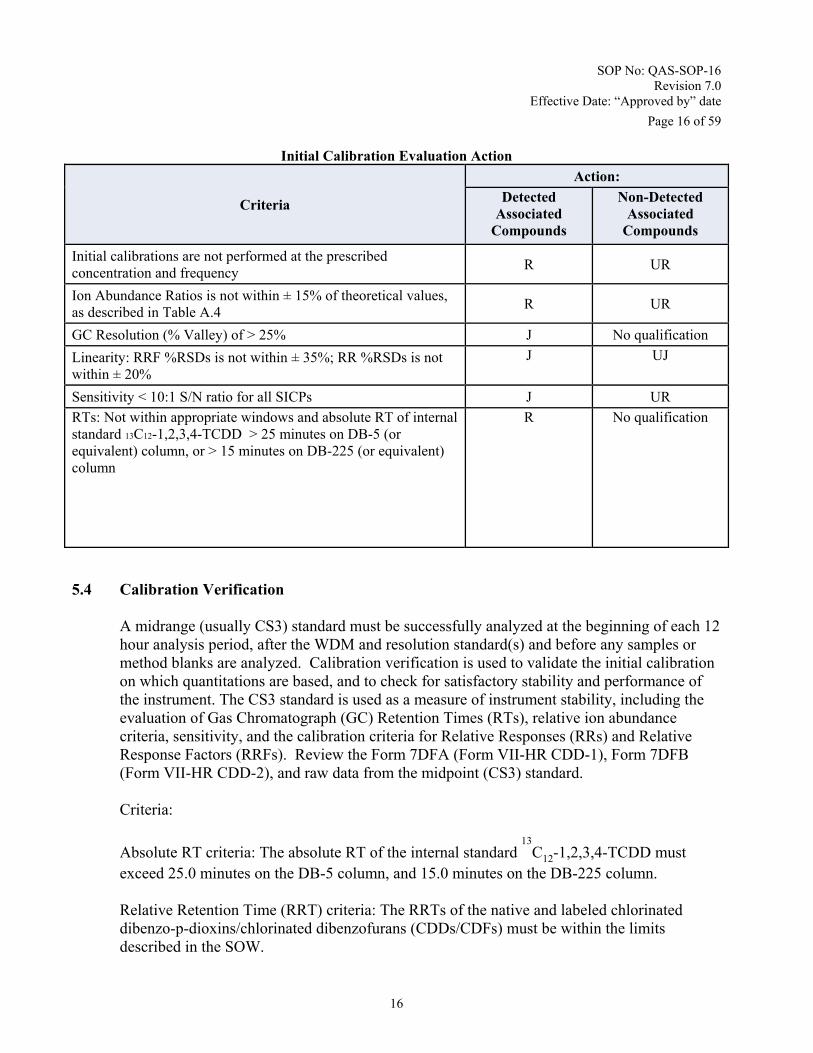
Initial Calibration Evaluation Action
Criteria
Action:
Detected Associated
Compounds
Non-Detected Associated
Compounds
Initial calibrations are not performed at the prescribed concentration and frequency
R UR
Ion Abundance Ratios is not within ± 15% of theoretical values, as described in Table A.4
R UR
GC Resolution (% Valley) of > 25% J No qualification
Linearity: RRF %RSDs is not within ± 35%; RR %RSDs is not within ± 20%
J UJ
Sensitivity < 10:1 S/N ratio for all SICPs J UR
RTs: Not within appropriate windows and absolute RT of internal standard 13C12-1,2,3,4-TCDD > 25 minutes on DB-5 (or equivalent) column, or > 15 minutes on DB-225 (or equivalent) column
R No qualification
5.4 Calibration Verification A midrange (usually CS3) standard must be successfully analyzed at the beginning of each 12 hour analysis period, after the WDM and resolution standard(s) and before any samples or method blanks are analyzed. Calibration verification is used to validate the initial calibration on which quantitations are based, and to check for satisfactory stability and performance of the instrument. The CS3 standard is used as a measure of instrument stability, including the evaluation of Gas Chromatograph (GC) Retention Times (RTs), relative ion abundance criteria, sensitivity, and the calibration criteria for Relative Responses (RRs) and Relative Response Factors (RRFs). Review the Form 7DFA (Form VII-HR CDD-1), Form 7DFB (Form VII-HR CDD-2), and raw data from the midpoint (CS3) standard. Criteria:
Absolute RT criteria: The absolute RT of the internal standard 13
C12-1,2,3,4-TCDD must exceed 25.0 minutes on the DB-5 column, and 15.0 minutes on the DB-225 column.
Relative Retention Time (RRT) criteria: The RRTs of the native and labeled chlorinated dibenzo-p-dioxins/chlorinated dibenzofurans (CDDs/CDFs) must be within the limits described in the SOW.

SOP No: QAS-SOP-16 Revision 7.0
Effective Date: “Approved by” date
Page 17 of 59
17
Ion abundance ratio criteria: All native and labeled CDDs/CDFs in the CS3 standard must be within their respective ion abundance ratio limits.
Instrument sensitivity criteria: The peaks representing both native and labeled analytes in the CS3 standard must have signal-to-noise (S/N) ratios �10:1.
Response criteria: The measured RRFs and RRs of each analyte and standard (labeled and internal) must be within ± 20% (RR) and ± 35% (RRF) of the mean values established during initial calibration. Check the calculation of at least one target analyte in a calibration verification standard for each analytical column used. Action:
Use professional judgment to qualify any analyte in samples associated with a calibration verification not meeting the RT and/or RRT criteria.
Any detect in samples associated with a calibration verification not meeting the ion abundance criteria is to be qualified as rejected (“R” flag) unless professional judgment determines the estimated flags (“J” flag) more appropriate.
If the S/N ratio �10:1 limit is not met in a calibration verification, qualify all detects as estimated (“J” flag) and all non-detects as unusable (“UR” flag).
Since the initial calibration is used to generate the RR and RRF values used for quantitation, the %D relative to the initial calibration’s Mean RR or Mean RRF is a crucial criterion for review. Qualify data associated with an analyte with a %D not within ± 20% (RR) and not within ± 35% (RRF) as estimated (“J” flag). Re-analysis of the samples may be requested.
Calibration Verification Evaluation Action
Criteria
Action
Detected Associated
Compounds
Non-Detected Associated
Compounds
Ion abundance ratios not within ± 15% window R or J UR or UJ
Absolute RT of internal standard 13C12-1,2,3,4-TCDD > 25 minutes on DB-5 (or equivalent) column, or > 15 minutes on DB-225 (or equivalent) column Use professional judgment
RRTs in the calibration verification not within the limits defined in SOW
Use professional judgment
Sensitivity: S/N < 10 for all compounds J UR
%D for RRs not within ± 20% %D for RRFs not within ± 35% J UJ

SOP No: QAS-SOP-16 Revision 7.0
Effective Date: “Approved by” date
Page 18 of 59
18
5.5 Method Blank Analysis
One or more method blanks should be extracted with each batch of samples. The matrix for the method blank should be similar to the associated samples. The blind blank should be evaluated for contamination.
Criteria:
Laboratory method blanks should not contain any 2,3,7,8-substituted CDDs/CDFs with the exception of OCDD/OCDF, in amounts greater than the CRQL. No OCDD/OCDF should be present in amounts greater than three times (3X) the CRQL.
Action:
Action in the case of blank contamination depends on the circumstances and origin of the blank. Qualification of the sample data should be based upon comparison with the associated blank having the highest concentration of a contaminant. The laboratory is required to analyze the method blank both on the DB-5 primary column and on the DB-225 confirmatory column whenever any associated samples require 2,3,7,8-TCDF confirmation (either a positive result or an EMPC value exceedes the CRQL). The reviewer should use the higher result to qualify data, regardless of column. Associated blanks include the extraction method blanks and the PES blind blank. Field and equipment blanks are not used for data qualification.
Any compound detected in the sample that was also detected in any associated blank is not reported if the sample concentration is less than five times (5X) the blank concentration. Typically, the calculated sample CDD/CDF amount above the CRQL is reported and flagged “U” with the secondary qualifier “B-4” in Element®. For results below the CRQL, report in Element® the actual laboratory results with the “U” qualifier only.
There may be instances where little or no contamination was present in the associated blanks, but qualification of the sample was deemed appropriate. Professional judgment should be used in these situations. One example would be where the method blank did not satisfy the 2.5X signal to noise ratio (S/N) requirement to report the analytes presence but the actual sample contained the analyte at slightly greater than 2.5X S/N. An explanation of the rationale used for this determination should be provided in the Summary of Problems and Comments and the Case Narrative.
If gross contamination exists (i.e., saturated peaks), all affected compounds in the associated samples should be considered to be unusable (R flag), due to interference. This is a contract issue and should be regarded as an action item to be reported to the Task Order /Project Officer (TOPO) for resolution with the contractor.

SOP No: QAS-SOP-16 Revision 7.0
Effective Date: “Approved by” date
Page 19 of 59
19
If an instrument blank was not analyzed following a sample analysis which contained an analyte(s) at high concentrations, sample analysis results after high concentration sample must be evaluated for carryover. Professional judgment should be used to determine if instrument cross-contamination has affected any positive compound identification(s).
Blanks or samples run after a Performance Evaluation Sample, Laboratory Control Sample or Calibration Verification should be carefully examined to determine the occurrence of instrument or syringe carry-over. Since the efficiency of sample transfer can vary dramatically according to apparatus and operator techniques, professional judgment should be used in each case to determine whether sample or blank results are attributable to carry-over.
When there is convincing evidence that contamination is isolated to a particular instrument, matrix, or concentration level, professional judgment should be used to determine if the 5X rule should only be applied to certain associated samples (as opposed to all of the associated samples).
5.6 Laboratory Control Sample
To provide data on the accuracy of the analytical method, prepare and analyze a sample of spiked reference matrix [the Laboratory Control Sample (LCS)] for each matrix analyzed. If a matrix is not represented in a SDG, no spiked LCS is required for that matrix. USEPA has identified a number of reference matrices to be used for the spiked LCS, and the laboratory must use an aliquot of that matrix for its own LCS work (see DLM02.X, Exhibit D). When a reference matrix that simulates the sample matrix under test is not readily available, USEPA retains the option to supply the laboratory with a reference matrix containing the expected interferences for a particular project.
Criteria:
a. For each sample Delivery Group (SDG), the laboratory must prepare a spiked LCS for all of the matrix types that occur in that SDG (see DLM02.X, Exhibit D).
b. The recovery of each spiked analyte must be in the range in Table A.6. c. The LCS must meet the technical acceptance criteria for sample analysis (see
DLM02.X, Exhibit D).
Confirm that the spiking solution was added to the LCS, and that the chlorinated-p-dioxin/chlorinated dibenzofuran (CDD/CDF) analytes were at their correct concentrations. Verify that calculations, and transcriptions from raw data, were performed correctly.
SOP No: QAS-SOP-16 Revision 7.0
Effective Date: “Approved by” date
Page 20 of 59
20
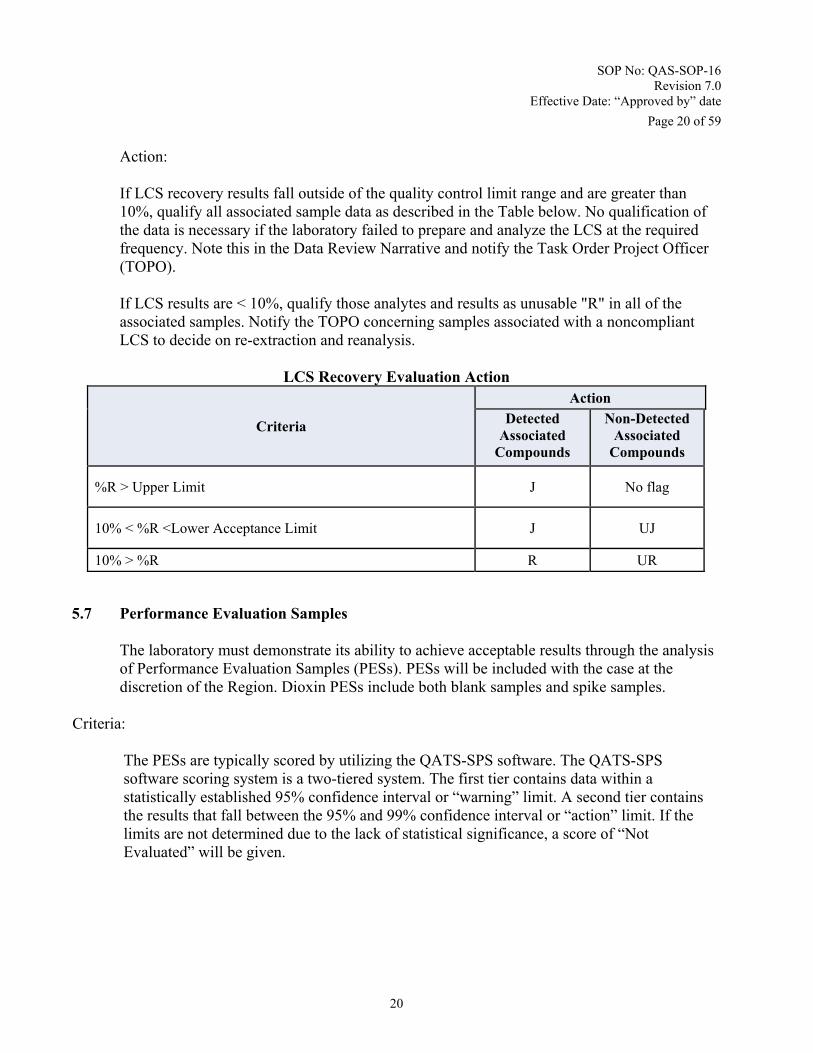
Action: If LCS recovery results fall outside of the quality control limit range and are greater than 10%, qualify all associated sample data as described in the Table below. No qualification of the data is necessary if the laboratory failed to prepare and analyze the LCS at the required frequency. Note this in the Data Review Narrative and notify the Task Order Project Officer (TOPO). If LCS results are < 10%, qualify those analytes and results as unusable "R" in all of the associated samples. Notify the TOPO concerning samples associated with a noncompliant LCS to decide on re-extraction and reanalysis.
LCS Recovery Evaluation Action
Criteria
Action
Detected Associated
Compounds
Non-Detected Associated
Compounds
%R > Upper Limit J No flag
10% < %R <Lower Acceptance Limit J UJ
10% > %R R UR
5.7 Performance Evaluation Samples
The laboratory must demonstrate its ability to achieve acceptable results through the analysis of Performance Evaluation Samples (PESs). PESs will be included with the case at the discretion of the Region. Dioxin PESs include both blank samples and spike samples.
Criteria: The PESs are typically scored by utilizing the QATS-SPS software. The QATS-SPS
software scoring system is a two-tiered system. The first tier contains data within a statistically established 95% confidence interval or “warning” limit. A second tier contains the results that fall between the 95% and 99% confidence interval or “action” limit. If the limits are not determined due to the lack of statistical significance, a score of “Not Evaluated” will be given.

SOP No: QAS-SOP-16 Revision 7.0
Effective Date: “Approved by” date
Page 21 of 59
21
Action:
SPS Web evaluation – If the analyte is scored by SPS Web as ”Within Limits” or “Not Evaluated,” no flags are required. If the analyte is scored by SPS Web as “Action Low” or as “Analyte Missed,” non-detects for that analyte are rejected (R flag) and positive results are considered estimated (J flag). If the analyte is scored by SPS Web as “Warning Low,” both non-detect and positive results for that analyte are considered estimated (J flag). If the analyte is scored by SPS Web as “Warning High” or “Action High,” non-detects are not qualified and positive results are considered to be estimated (J flag).
The results of the analysis of the PES blank sample are to be included with the method blank(s) to be used in evaluating potential contamination. The same rules for laboratory method blank rules should apply (see Section 8).
PES shall be logged into Element® and reported as routine samples. The following conventions apply for entering results into Element®:
Report the PES results on the internal PCDD/PCDF spreadsheet. Report all results regardless of comparison to any associated blanks. Report actual values of spiked compounds, using two significant digits but
score the three significant digits as reported by lab. Use the qualifiers reported by the lab. Neither Element® qualifiers nor
remarks are required for PES results. The TEQ values are not evaluated.
PE Sample Data Evaluation Actions
Criteria
Action
Detected Associated
Compounds
Non-Detected Associated
Compounds
Results ”within limits” or “not evaluated” No flag No flag
Results “warning low” J UJ
Results “action low” or “analyte missed” J UR
Results “warning high” or “action high” J No flag
5.8 Dilutions
If the concentration of the analyte exceeds the concentration of the highest standard of the initial calibration, except for OCDD/OCDF, a dilution should be performed.

SOP No: QAS-SOP-16 Revision 7.0
Effective Date: “Approved by” date
Page 22 of 59
22
Criteria:
Additional labeled extraction standard is added by Region 4 laboratories up to a 1:100 dilution, to bring the concentration up to the initial concentrations. Whenever additional labeled extraction standard was added, the dilution factor is not considered when calculating final results. Without this addition, the dilution factor must be used in the calculations. Whenever additional labeled extraction standard is added during dilution, recoveries reported in the original analysis should be used to qualify data but diluted results should be corrected for this recovery. Occasionally, the laboratory might be unable to report recoveries due to interferences from co-eluting target or nontarget compounds. All associated positive results will then be “J” qualified and all non-detected results will then be “UR” qualified along with the addition of the “QS-2” Element® qualifier.
The laboratory is required to report both the initial or neat analysis and one diluted analysis. Alternatively, the laboratory might re-extract a smaller aliquot of a sample to minimize the need for dilutions of the extracts. Combinations of results from the initial and diluted analyses for one sample on the internal PCDD/PCDF spreadsheet is permissible.
Action:
Verify that all reported sample values are within the calibration range by checking against the DL and Calibration Limit (CL) in samples on the PCDD/PCDF spreadsheet.
For Region 4 reporting purposes, the CRQL, and CL are calculated as follows: For water samples: CRQL (ng/L) = (CS1 x Ve x DF)/ Vs CL (ng/L) = (CS5 x Ve x DF)/ Vs
For solid samples: CRQL (ng/kg) = (CS1 x Ve x DF) / (Vs x (1- M/100) x 1000) CL (ng/kg) = (CS5 x Ve x DF) / (Vs x (1- M/100) x 1000) Where: CS1 = The lowest standard, ng/mL CS5 = The highest standard, ng/mL Ve = the volume of final extract, uL DF = Dilution Factor (where appropriate) Vs = Sample volume or amount, g or mL M = % moisture content Note: Check the nature of the solid samples used for extraction. If the laboratory uses an aliquot of the dried sample for extraction, no moisture content adjustment is needed.

SOP No: QAS-SOP-16 Revision 7.0
Effective Date: “Approved by” date
Page 23 of 59
23
If the laboratory performs a dilution and reports both the initial and diluted analyses, the data reviewer must report those congener values that are within the calibration range. If congener values in the initial analysis exceed the calibration range, report congener values from the diluted analysis. Indicate the congener values reported from the dilution analysis with the qualifier “D” on the PCDD/PCDF spreadsheet. Report non-detect results from the least diluted analysis with acceptable QC.
If any reported congener value is above the CRQL, qualify those results as estimated (J flag) with remark “CLP02.”
If any reported congener value is below the CRQL, qualify that result as estimated (J flag) with remark “CLP01.”
Element® requires the reported analyte concentration in water in ng/L, while the laboratories might report the units in either pg/L or ng/L. The unit for solid samples is ng/kg for all. Verify the units reported for waters, conversation to ng/L may be necessary. Caution must be taken in converting the units of results on the PCDD/PCDF spreadsheet.
5.9 Labeled Compound Recoveries Recoveries of the labeled compounds measure the extraction effectiveness of the method. Criteria:
The percent recovery of any labeled compound in the original sample, prior to any dilutions, must be within the limits specified in Exhibit D, Table 7, of DLM02.0. If the percent recovery is outside the limits, re-extraction and re-analysis of that sample should have been performed by the laboratory.
Action:
If the extract is diluted less than 20X with solvent and the concentrations of the labeled compounds are brought back to the initial levels, the dilution factor should be applied to the recoveries of labeled compounds. The recovery has no effect on qualitative identification of the native analyte.
If the labeled compound recovery exceeds the upper limit, a positive result of the associated native analyte in that sample is considered to be estimated (“J” flag with Element® qualifier QS-5).
If the labeled compound recovery is equal to or greater than 10% but is less than the lower limit, the result, both non-detect and positive, of the associated native analyte in that sample is considered to be estimated (“J” or “UJ” flag with Element® qualifier QS-3).

SOP No: QAS-SOP-16 Revision 7.0
Effective Date: “Approved by” date
Page 24 of 59
24
When the labeled compound recovery is less than 10%, quantitation is severely affected. A positive result of the associated native analyte in that sample is considered to be estimated (“J” flag with Element qualifier QS-4) and a non-detect is rejected (“UR” flag with Element qualifier QS-4).
5.10 Toxicity Equivalency Factors
The EPA initially adopted dioxin International Toxicity Equivalent Factors (I-TEF/89) for summarizing dioxin concentrations so information could be exchanged consistently within the international scientific community. The I-TEFs/89 are interim in character and may be replaced or modified after further research. Seventeen of the possible 210 chlorinated congeners of dioxin and furan are 2,3,7,8- substituted. The most toxic congener is 2,3,7,8-tetrachlorodibenzo-p-dioxin (2,3,7,8-TCDD). TEFs are used to convert the concentrations of any PCDD/PCDF congeners into an equivalent concentration of 2,3,7,8-TCDD. The congener specific data are multiplied by the appropriate TEFs (separate factors for mammals, birds, and fish) and, assuming the toxic effects are additive, the factors are totaled to obtain a Toxicity Equivalent Quantity (TEQ) for mammals, birds, and fish.
Action:
For each 2,3,7,8-substituted CDD/CDF congener positively identified in the sample, the TEQ (in the same concentration unit as the congener result) is recalculated by multiplying the laboratory result with the corresponding Region 4 adopted TEF (2005 WHO for mammals and 1998 WHO for avians and fish) and recorded on the PCDD/PCDF spreadsheet. The sum of all the individual TEQs are then reported as the TEQ for the sample.
The method of reporting TEQ values depends on the use of the data for toxicity risk evaluation and could vary from Region to Region. For Region 4, both the non-detect EDLs and all EMPCs will also be multiplied by the TEFs for the purpose of assigning a TEQ, but homologue totals will have no TEQ assigned.
For each sample, if more than ten percent of the congener results (EXCEPT for 2,3,7,8-TCDD and 1,2,3,7,8-PeCDD) are assigned the “J,” or “R” flag, report the total TEQ value with the “J” flag and Element qualifier D-5. EXCEPTION: Since 2,3,7,8-TCDD and 1,2,3,7,8-PeCDD both have Toxicity Equivalent Factors of 1.0 as assigned by the WHO, the validation qualifiers assigned to these two congeners will carry through to the TEQ calculated value at any concentration. For example, if 2,3,7,8-TCDD is qualified “R” for a specific quality assurance issue and is less that 10% of contribution to the calculated TEQ, the TEQ result will be qualified as rejected “R”.

SOP No: QAS-SOP-16 Revision 7.0
Effective Date: “Approved by” date
Page 25 of 59
25
5.11 Second Column Confirmation
Second column confirmation is required for any sample analyzed on a DB-5 (or equivalent) column in which 2,3,7,8-TCDF is reported, or where 2,3,7,8-TCDF is reported as an Estimated Maximum Possible Concentration (EMPC) at or above the Contract Required Quantitation Limit (CRQL). The laboratory may utilize one of the following options to achieve better isomer specificity than can be obtained on the DB-5 column alone.
The sample extract may be re-analyzed on a DB-225 (or equivalent) Gas
Chromatograph (GC) column to achieve better GC resolution and, therefore, better identification and quantitation of the individual 2,3,7,8-substituted isomers.
The sample extract may be analyzed on a GC column capable of resolving all of
the 2,3,7,8-substituted CDDs/CDFs from other isomers, but not necessarily capable of resolving all of the non-2,3,7,8-substituted isomers from one another.
Criteria:
Regardless of the GC column used, for a GC peak to be identified as a 2,3,7,8-substituted CDD/CDF isomer, it must meet all of the criteria listed in DLM02.X, Exhibit D, [ion abundance ratio, signal-to-noise (S/N) ratio, Retention Time (RT), etc.]. If using any GC column other than those specified (DB-5, DB-225), the laboratory shall clearly document in the Data Review Narrative, the elution order of all analytes of interest on any such column.
For any sample analyzed on a DB-5 (or equivalent) column in which 2,3,7,8-TCDF is reported as an EMPC, regardless of Toxicity Equivalency Factor (TEF)-adjusted concentration or matrix, analysis of the extract is required on a second GC column which provides better specificity for these two isomers.
Action:
Due to the resolution capabilities of the primary column for 2,3,7,8-TCDD/TCDF, the results from the confirmation for 2,3,7,8-TCDF are used for reporting on the PCDD/PCDF spreadsheet. However, other factors might also impact on the quality of the data from both columns. The actions taken are summarized in the following table:
SOP No: QAS-SOP-16 Revision 7.0
Effective Date: “Approved by” date
Page 26 of 59
26
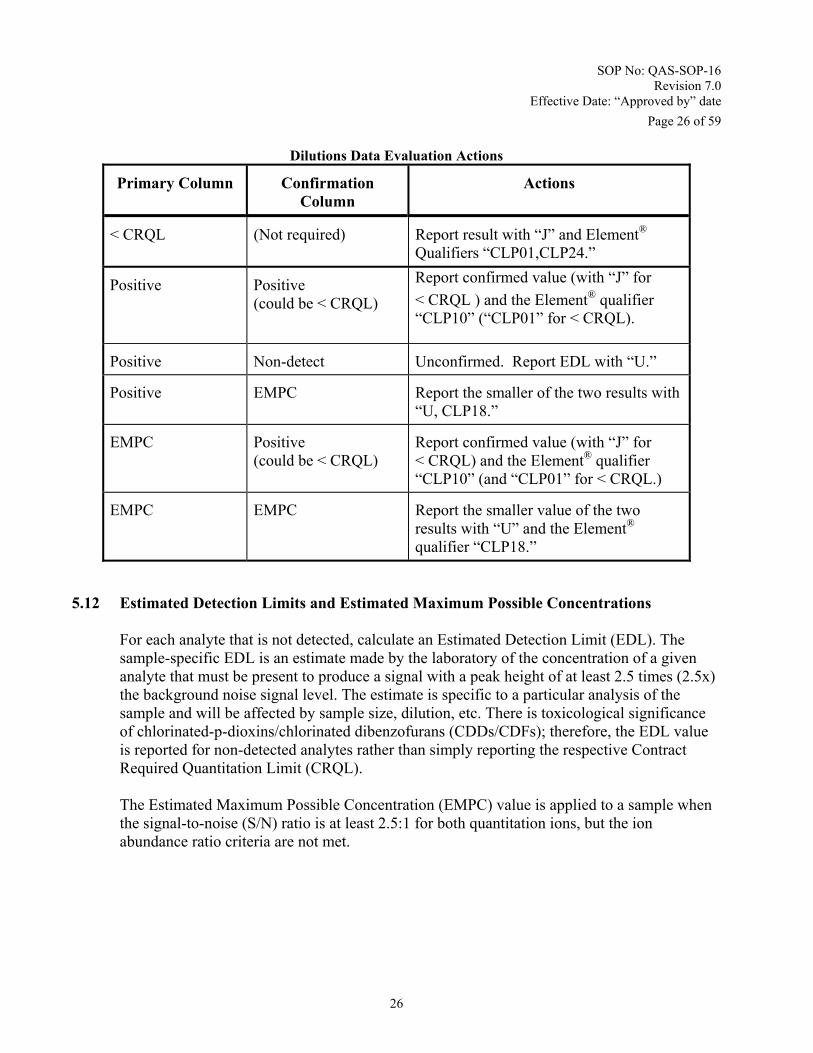
Dilutions Data Evaluation Actions
Primary Column Confirmation Column
Actions
< CRQL (Not required) Report result with “J” and Element® Qualifiers “CLP01,CLP24.”
Positive Positive (could be < CRQL)
Report confirmed value (with “J” for
< CRQL ) and the Element® qualifier “CLP10” (“CLP01” for < CRQL).
Positive Non-detect Unconfirmed. Report EDL with “U.”
Positive EMPC Report the smaller of the two results with “U, CLP18.”
EMPC Positive (could be < CRQL)
Report confirmed value (with “J” for < CRQL) and the Element® qualifier “CLP10” (and “CLP01” for < CRQL.)
EMPC EMPC Report the smaller value of the two results with “U” and the Element® qualifier “CLP18.”
5.12 Estimated Detection Limits and Estimated Maximum Possible Concentrations
For each analyte that is not detected, calculate an Estimated Detection Limit (EDL). The sample-specific EDL is an estimate made by the laboratory of the concentration of a given analyte that must be present to produce a signal with a peak height of at least 2.5 times (2.5x) the background noise signal level. The estimate is specific to a particular analysis of the sample and will be affected by sample size, dilution, etc. There is toxicological significance of chlorinated-p-dioxins/chlorinated dibenzofurans (CDDs/CDFs); therefore, the EDL value is reported for non-detected analytes rather than simply reporting the respective Contract Required Quantitation Limit (CRQL).
The Estimated Maximum Possible Concentration (EMPC) value is applied to a sample when the signal-to-noise (S/N) ratio is at least 2.5:1 for both quantitation ions, but the ion abundance ratio criteria are not met.

SOP No: QAS-SOP-16 Revision 7.0
Effective Date: “Approved by” date
Page 27 of 59
27
Criteria:
1. EDL - The EDL is calculated for each 2,3,7,8-substituted isomer that is not identified, regardless of whether or not any non-2,3,7,8-substituted isomers in that homologue are present. The EDL is also calculated for those 2,3,7,8-substituted isomers where responses for both of the quantitation ions are less than 2.5 times (< 2.5x) the background level, and therefore do not meet the identification criteria.
The formulas below are used to calculate an EDL for each absent 2,3,7,8-substituted CDD/CDF. The background level (Hx) is determined by measuring the height of the noise at the expected Retention Times (RTS) of both of the quantitation ions of the particular 2,3,7,8-substituted isomer. The expected RT is determined from the most recent analysis of the midpoint standard (CS3) performed on the same High Resolution Gas Chromatograph/High Resolution Mass Spectrometer (HRGC/HRMS) system that was used for the analysis of the samples that are associated with the EDL calculations. All Matrices Other than Aqueous:
Soil EDL (ng/kg) = 2.5 x QIS x (Hx1+Hx2) x D__ W x (HIS1 + HIS2) x Avg RR
Where,
EDL = Estimated Detection Limit for 2,3,7,8-substituted CDDs/CDFs
QIS = Quantity (pg) of appropriate internal standard added prior to sample extraction
Hx1,Hx2 = Peak heights of the noise for both quantitation ions of the CDD/CDF
HIS1,HIS2 = Peak heights of the internal standard ions
D = Dilution Factor
W = Weight extracted in grams
Avg RR = The Mean Relative Response for the isomer of interest from the initial calibration (see DLM02.X, Exhibit D)

SOP No: QAS-SOP-16 Revision 7.0
Effective Date: “Approved by” date
Page 28 of 59
28
Aqueous EDL (pg/L) = 2.5 x QIS x (Hx1+Hx2) x D__ V x (HIS1 + HIS2) x Avg RR
Where,
EDL = Estimated Detection Limit for 2,3,7,8-substituted CDDs/CDFs
QIS = Quantity (pg) of appropriate internal standard added prior to sample extraction
Hx1,Hx2 = Peak heights of the noise for both quantitation ions of the CDD/CDF
HIS1,HIS2 = Peak heights of the internal standard ions
D = Dilution Factor
V = Volume extracted in liters
Avg RR = The Mean Relative Response for the isomer of interest from the initial calibration (see DLM02.X, Exhibit D)
2. Estimated Maximum Possible Concentration - An EMPC is calculated for 2,3,7,8-substituted isomers that are characterized by a response with a S/N ratio of at least 2.5:1 for both of the quantitation ions, but that do not meet the ion abundance ratio criteria outlined in Section IX.
The EMPC is calculated according to one of the following formulas: All Matrices Other than Aqueous:
EMPC (ng/kg) = (CEX x D) WS
Where, D = Dilution Factor
WS = Sample dry weight in kg
CEX = The concentration of the active compound in the extract
SOP No: QAS-SOP-16 Revision 7.0
Effective Date: “Approved by” date
Page 29 of 59
29
Aqueous:
EMPC (pg/L) = (CEX x D) VS
Where, D = Dilution Factor
VS = Sample volume in liters
CEX = The concentration of the active compound in the extract
D. Evaluation: 1. Verify that EDLs and EMPCs are correctly calculated. 2. An EDL must be reported for each undetected analyte. The EDL must be < CRQL, except when increased due to dilution of the extract.
3.Analytes reported as EMPCs must meet all of the identification criteria, except for ion abundance ratios, as outlined in Section IX.
Action: Qualify all EDLs and EMPCs that were not correctly calculated as unusable "R".
5.13 Data Review Documentation
A Data Review Document should be prepared to document the CDD/CDF review findings. The document includes the Review Summary Narrative, Summary of Problems and Comments which includes the Blank Summary, the Internal PCDD/PCDF spreadsheet, copies of reviewer’s calculations, PE sample scoring results, memorandums detailing any phone conversations with the laboratory, and copies of any correspondence with Contracts Management Branch detailing any technical or contractual issues raised during review of the CDD/CDF data package. This documentation is maintained in the Project File.
Document Contents:
1. CDD/CDF Data Review Summary Narrative – This narrative is in a letter format to
summarize the information pertinent to the samples, methodologies, highlights of findings, and a brief assessment of the overall data quality. For an example, see Attachment III.

SOP No: QAS-SOP-16 Revision 7.0
Effective Date: “Approved by” date
Page 30 of 59
30
2. Summary of Problems and Comments – This document provides checks on the conformance of the QA/QC of the data package to method requirements. A detailed check list for each QA/QC item is included. For an example, see Attachment IV.
3. Checklist for Task Order Compliance – This form details the adherence to the
DLM02.0 contract requirements. For an example, see Attachment V.
4. Internal PCDD/PCDF spreadsheet – This form is generated by the data reviewer for data entry into the Element®. It includes the project information, sample information, laboratory data information, the analytes, sample results with appropriate qualifiers, TEQs, and percent moisture. In addition to the standard data qualifiers specified in DLM02.0, Element® qualifiers and remarks are used on this form for entry into Element® to provide more pertinent information for the sample results. In addition, the form includes the reporting limits and calibration ranges to assist data review to apply proper data qualifiers. Water and solid sample results are reported on separate forms. See Attachment VI
5. Copies of Reviewer’s Calibration Checks – This documents the checks of the relative
response factors (RRFs) for the initial calibrations performed on each primary and confirmation column. The data reviewer should conduct a minimum of one check for each data package.
6. Copies of Reviewer’s Sample Result Calculation Checks – This documents the check
of the sample results of selected samples in one data package. A minimum of one EMPC value, one EDL value, and one positive result from each of the primary and confirmation analysis should be checked and recorded.
7. PE Score (SPS-Web Form) – This form is generated by the QATS-SPS website
program to report the evaluation of the results of the performance evaluation samples (PES) associated with the data package.
8. Communication Documentation – Any and all communication(s) with the Contract
Laboratory regarding technical and/or contractual issues arising from the validation of the data package must be maintained in the Project File.
9. Data Review Time Tracker – This document is for recording the time line and efforts
at different stages of the data review process. When the data entry into the Element® is required, this form must be executed and included in the data review documents. For an example, see Attachment VI.I
10. Data Quality Assessment Report (DQAR) – This report is prepared for non-CLP
analysis or projects initiated by the Primary Responsible Parties (PRP). Typically, data for non-CLP and PRP project will not be entered into Element®; therefore, DQAR will replace the Summary of Problems and Comments (item 3), Internal PCDD/PCDF spreadsheet (item 4). In addition, no time tracker (item 9) is required. For an example, see Attachment VIII.

SOP No: QAS-SOP-16 Revision 7.0
Effective Date: “Approved by” date
Page 31 of 59
31
5.14 Data Reporting
Proper format of results, primary and Element® qualifiers with appropriate remarks should be used for importing the data on the PCDD/PCDF spreadsheet into Element®.
Action:
1. Report the numeric values for all analytes, individual toxicity equivalent quantities
(TEQs), and moisture content to 2 significant figures. Reporting units are ng/kg for soils (dry weight) and ng/L for water, respectively. Analytes reported below the CRQL will be considered to be estimated and assigned the “J” flag with the Element® remark “CLP01.”
2. Report the value in the scientific expression format “x.x E+ yy.” The number zero
(null) should be expressed as 0.0.
3. Report the toxicity equivalent value (TEQ) in the scientific expression format: “x.x E+ yy” except the values from 0.0 to 9.9 (included).
4. For each analyte that is not detected, an Estimated Detection Limit (EDL) is
calculated by the laboratory. For these analytes, report the EDL values and apply the “U” flag.
5. An Estimated Maximum Possible Concentration (EMPC) is calculated and reported
by the laboratory when a CDD/CDF has a response with a S/N of at least 2.5 and meets all of the identification criteria with the exception of the ion abundance ratio. For these analytes, report the EMPC value calculated by the laboratory and apply the “U” flag. Indicate that this is an EMPC on the internal CDD/CDF spreadsheet with the Element® qualifier (CLP18).
6. The positive results and non-detects for the homologue totals should be qualified “J”
and “UJ,” respectively.
7. The homologue totals will not be included in the TEQ for the sample.
6.0 Qualifications
Region 4 applies two sets of qualifiers for the CDD/CDF data: the primary and secondary (Element®) qualifiers. Primary qualifiers are those defined in the SOW DLM02.0, while the secondary (Element®) qualifiers are used in Region 4 data review documents to provide more assistance on the assessment of the data quality for future references. In addition, a set of remarks denoted by numbers is also applied to the spreadsheets imported into Element® to address additional Region 4 QA/QC requirements. The definitions and brief explanations of the qualifiers and remarks assigned to results in data validation process are presented in Attachments I and II.

SOP No: QAS-SOP-16 Revision 7.0
Effective Date: “Approved by” date
Page 32 of 59
32
7.0 Health and Safety Since there are no samples being analyzed associated with this SOP, this Section is not applicable.
8.0 Interferences During data review, the reviewer should be aware of these potential interferences that could affect sample results and require qualification of the data. Review of the QC blanks along with chromatography should be performed for signs of potential interferences.
Solvents, reagents, glassware and other sample processing hardware may yield discrete artifacts or elevated baselines that may cause misinterpretation of the chromatographic data. All of these materials must be demonstrated to be free from interferences under the conditions of the analysis by analyzing method blanks.
The use of high-purity reagents and pesticide-grade solvents helps to minimize interference
problems.
Interferants coextracted from the sample will vary considerably from matrix to matrix. PCDDs and PCDFs are often associated with other interfering chlorinated substances such as polychlorinated biphenyls (PCBs), polychlorinated diphenyl ethers (PCDPEs), polychlorinated naphthalenes, and polychlorinated alkyldibenzofurans, that may be found at concentrations several orders of magnitude higher than that of the analytes of interest. Retention times of target analytes must be verified using reference standards. While cleanup techniques are provided as part of the PCDD/PCDF method, unique samples may require additional cleanup steps to achieve the sensitivity described in this method.
High-resolution capillary columns are used in the analysis of PCDD/PCDFs, however, no
single column is known to resolve all 210 isomers. The 60-m DB-5 GC column is capable of 2,3,7,8-TCDD isomer specificity. In order to determine the concentration of the 2,3,7,8-TCDF (if detected on the DB-5 column), the sample extract must be reanalyzed on a column capable of 2,3,7,8-TCDF isomer specificity (e.g., DB- 225, SP-2330, SP-2331, or equivalent).

SOP No: QAS-SOP-16 Revision 7.0
Effective Date: “Approved by” date
Page 33 of 59
33
9.0 Equipment and Supplies Not applicable.
10.0 Data and Records Management Please refer to SOP "Data Processing and Final Production for Contract Laboratory Data in
Element®. The CLP data packages must be properly archived for future reference. For each data package, the form “Record Transfer Inventory” must be utilized to record the proper information pertinent to the content. All or the raw data, CADRE/EXES reports, and any communication records must be included. Multiple data packages from different projects may be stored in one single box if sufficient space is available. Data packages for one Case that are stored in multiple boxes must be clearly identified on the Record Transfer Inventory forms. An appropriate numbering system must be maintained to ensure that each box containing the data review supporting documentation has a unique archive number. A copy of the inventory form should be kept within the box and an additional copy filed in a centralized system. The data package boxes shall be maintained under the custody of SESD as described in the Data Package Audit and Data Entry/Validation SOP. The Data Package Inventory Form is provided in Attachment 5.
11.0 Quality Assurance and Quality Control
This SOP will be reviewed annually, and will be updated at any time in response to recommendations, complaints, and changes to the CLP method for PCDD/PCDFs. The Quality Assurance Manager in QAS shall be the responsible for the maintenance of this SOP. The goal of this SOP is to provide guidance for performing data validation of PCDD/PCDF analytical data.

SOP No: QAS-SOP-16 Revision 7.0
Effective Date: “Approved by” date
Page 34 of 59
34
12. References
USEPA Analytical Operations/Data Quality Center (AOC) National Functional Guidelines for Chlorinated Dioxin/Furan Data Review, OSWER 9240.1-51, EPA 540-R-05-001, September 2005.
USEPA Contract Laboratory Program Statement of Work For Analysis of Chlorinated Dibenzo-p-Dioxins (CDDs) and Chlorinated Dibenzofurans (CDFs), Multi-Media, Muli-Concentration, DLM02.0, May 2005.
USEPA Method 1613: Tetra- Through Octa- Chlorinated Dioxins and Furans by Isotope Dilution HRGC/HRMS, Revision B, October 1994.
USEPA SW846 Method 8290A: Polychlorinated Dibenzo-p-Dioxins (PCDDs) and Polychlorinated Dibenzofurans (PCDFs) by High-Resolution Gas Chromatography/High-Resolution Mass Spectrometry (HRGC/HRMS), Revision 1, February 2007.
Attachment
I Primary Data Qualifiers U The analyte was analyzed for, but was not detected above the Estimated Detection
Limit (EDL) as defined in DLM02.0, Exhibit D, Section 11.2.5.
J The analyte was positively identified, but the associated numerical value is an estimated concentration of the analyte in the sample based on its associated quality measures.
N The analysis indicates the presence of an analyte for which there is presumptive
evidence to make a “tentative identification.”
R The sample result is rejected due to serious deficiencies in the ability to analyze sample and meet quality control criteria. The presence or absence of the
analyte cannot be verified.

SOP No: QAS-SOP-16 Revision 7.0
Effective Date: “Approved by” date
Page 35 of 59
35
Attachment II
II Element® Qualifier Definitions A The analyte was analyzed in replicate. Reported value is an average value of the replicates.
B-1 Analyte is found in the associated blank as well as in the sample (CLP B-flag).
B-2 Reporting level elevated due to trace amounts of analyte present in the method blank.
B-3 Level in blank does not impact data quality
B-4 Level in blank impacts MRLs.
C-1 No sample container received
C-2 Improper sample container used
C-3 Sample container broken on receipt
C-4 Sample container broken in the lab
C-5 EnCore sampler received by the laboratory unlocked
C-6 Sample aliquot taken from VOA vial with headspace (air bubble greater than 5-6 mm diameter).
CL-1 BOD result estimated - Sample exhibited evidence of toxicity
CL-2 DOC result higher than TOC result
CL-3 Sample distillation not required for Ammonia
CLP01 Concentration reported is less than the lowest standard on calibration curve
CLP02 Concentration reported is greater than the highest standard on calibration curve
CLP03 Baseline instability in calibration or preparation blanks
CLP04 Analyte reported as potential false positive (% RSD > 20%, and result > MDL, but < CRQL)
CLP05 CLP ICP-MS method does not include: Al, Ca, Fe, Mg, K, & Na
CLP06 PE sample recovery less than control limits.
CLP07 PE sample recovery outside warning limits.
CLP08 PE sample recovery greater than control limits.
CLP09 MRL elevated due to baseline instability.
CLP10 2,3,7,8-TCDF confirmed by second column.
CLP11 Storage blank contaminant
CLP12 Difference between GC columns above method warning limit
CLP13 Difference between GC columns above method action limit
CLP14 The analysis did not indicate the presence of the analyte. The data is rejected and the reported value is the Reporting Limit.
Resampling and reanalysis are necessary to confirm or deny the presence of the analyte.
CLP15 TIC Results Reported as Identified by Lab - IDs Not Verified
CLP16 Initial Calibration Response Erratic
CLP17 Initial Calibration Relative Response Outside Method Control Limits
CLP18 Estimated Maximum Possible Concentration (EMPC) Reported
CLP20 Matrix Spike Recovery < 30%
CLP21 %RSD >20% for ICP Multiple Exposures
CLP22 Suspected interference from Al and/or Fe as noted in contractor ICSA solution
CLP23 Suspected over correction from Al and/or Fe as noted in contractor ICSA solution

SOP No: QAS-SOP-16 Revision 7.0
Effective Date: “Approved by” date
Page 36 of 59
36
CLP24 Result has not been confirmed by second column analysis
CLP41 Since 2,3,7,8-TCDD and 1,2,3,7,8-PeCDD both have Toxicity Equivalent Factors of 1.0 as assigned by the WHO, the R
qualifier assigned to these two congeners following data validation were carried through to the TEQ calculated value at any
concentration.
CR [Custom Value]
D-1 The analyte is determined to be present. The presence of the analyte was confirmed by GC/MS.
D-2 Due to Matrix Interference, the sample cannot be accurately quantified. The reported result is qualitative.
D-3 Sample diluted due to the presence of high levels of non-target analytes resulting in elevated reporting limits.
D-4 MRL elevated due to interferences.
D-5 Estimated quantitation for one or more individual constituents comprising >10% of the total.
F-1 No flash detected up to [Custom Value] °C
F-2 No flash detected up to 60 °C (140 °F).
F-3 Replicates not within method criteria
H-1 Recommended holding time exceeded
H-2 PT or QC sample. Holding time met when calculated from preparation of whole volume.
H-3 PT or QC Sample. Holding time met from beginning of prep.
H-4 Holding time expired prior to receipt by laboratory.
I-1 Ar1242 indistinguishable from 1248 - calculated as Ar1242
I-2 Ar1248 indistinguishable from 1242 - calculated as Ar1248
I-3 Ar1248 indistinguishable from 1254 - calculated as Ar1248
I-4 Ar1254 indistinguishable from 1248 -calculated as Ar1254
I-5 Mixture of Aroclors in sample; predominant Aroclors reported
I-6 Constituents or metabolites of technical chlordane.
J The identification of the analyte is acceptable; the reported value is an estimate.
K The identification of the analyte is acceptable; the reported value may be biased high. The actual value is expected to be less than the
reported value.
L The identification of the analyte is acceptable; the reported value may be biased low. The actual value is expected to be greater than
the reported value.
MRL-1 MRL verification for Potable Water matrix (Drinking Water)
MRL-2 MRL verification for Non-Potable Water matrix
MRL-3 MRL verification for Soil matrix
MRL-4 MRL verification for Tissue matrix
MRL-5 MRL verification for Air matrix
MRL-6 MRL verification for Waste matrix
MRL-7 MRL Verification for other matrices (bottle blanks, etc)
MRL-8 MRL verification result less than the LOD.
N There is presumptive evidence that the analyte is present; the analyte is reported as a tentativeidentification.
NA-1 Not Analyzed. Sample lost during preparation or analysis.
NA-2 Not Analyzed. Canister received at 760mm pressure.
NA-3 Not Analyzed. Insufficient sample received for analysis.
NA-4 Not Analyzed or Reported due to Interferences.
NA-5 Not Analyzed. Cannot exceed TCLP regulatory levels based on Total Scan analyses.

SOP No: QAS-SOP-16 Revision 7.0
Effective Date: “Approved by” date
Page 37 of 59
37
NA-6 Not Analyzed. Sample did not flash. Percent Water and Percent Alcohol determinations not required.
NA-7 Not Analyzed. Sample is not aqueous. Percent Alcohol determination not required.
NJ Presumptive evidence that analyte is present; reported as a tentative identification with an estimated value.
P-1 Sample improperly preserved
P-2 Sample at improper pH
P-3 Sample received unpreserved
Q-1 The original extraction of this sample yielded QC recoveries outside control limits. It was re-extracted after the recommended
maximum holding time.
Q-2 Result greater than MDL but less than MRL.
Q-3 Instrument not calibrated for all constituents of the total concentration result.
Q-4 Greater than 40 % difference between primary and confirmatory GC columns
Q-5 Serial dilution precision outside method control limits
Q-6 Appropriate QC not prepared and/or analyzed with this sample.
Q-7 Results reported below routine MRL.
QC-1 Analyte low in continuing calibration verification standard
QC-2 Analyte high in continuing calibration verification standard
QC-3 Analyte calibration criteria not met
QC-4 Result greater than the highest point on the calibration curve
QC-5 Calibration check standard less than method control limits.
QC-6 Calibration check standard greater than method control limits.
QI-1 Internal standard was outside of method control limits.
QL-1 Laboratory Control Spike Recovery less than method control limits
QL-2 Laboratory Control Spike Recovery greater than method control limits
QL-3 Laboratory Control Spike Precision outside method control limits
QL-4 Laboratory Control Sample recovery less than 10%
QL-5 Solid (matrix matched) LCS material
QM-1 Matrix Spike Recovery less than method control limits
QM-2 Matrix Spike Recovery greater than method control limits
QM-3 Matrix Spike Precision outside method control limits
QM-4 Matrix Precision outside method control limits
QM-6 Matrix Spike Recovery less than 10%
QM-7 The RPD and/or percent recovery for this QC spike analyte cannot be accurately calculated due to the high concentration of
coeluting organic compounds in the sample matrix.
QR-1 MRL verification recovery less than lower control limits.
QR-2 MRL verification recovery greater than upper control limits.
QS-1 Surrogate recovery not calculated due to sample dilution required by high analyte concentration.
QS-2 Surrogate recovery can't be accurately calculated due to interference from coeluting organic compounds.
QS-3 Surrogate recovery is lower than established control limits.
QS-4 Surrogate recovery less than 10%
QS-5 Surrogate recovery is higher than established control limits
R The presence or absence of the analyte can not be determined from the data due to severe quality control problems. The data are
rejected and considered unusable.

SOP No: QAS-SOP-16 Revision 7.0
Effective Date: “Approved by” date
Page 38 of 59
38
SP-1 The sample was filtered prior to analysis.
SP-2 Elevated Reporting Limits due to limited sample volume.
TC-2 Insufficient sample for TCLP extraction
TC-3 Results represent analysis of filtrate only
TC-6 Ambient lab temp. during TCLP dropped below method limits.
TC-7 Ambient lab temp. during TCLP exceeded method limits on the high side.
U The analyte was not detected at or above the reporting limit.
X-1 Non-target analyte
X-2 Matrix interference precludes recovery calculation
X-3 Co-eluting/interfering target analyte(s) preclude recovery calculation
X-4 Recovery not calculated due to CCV outside acceptance criteria
X-5 Spiked incorrectly.
X-6 Exclude value from QC data base. Refer to custom remark for details.
XB-1 Carryover from high level sample
XD-1 Duplicate results less than MRL
XD-2 Duplicate results less than 5X MRL
XM-1 Sample background/spike ratio higher than method evaluation criteria
XQ Data is not being reported or may not have been fully reviewed and qualified.
XS-1 Surrogate diluted out due to high analyte concentration
XS-2 Surrogate diluted out due to matrix interference
XS-3 Surrogate not reported due to matrix interference
Y-1 Data reported by memo
Y-2 Data should be limited to screening purposes only
Y-3 No compounds detected in the sample. Second column confirmation not required.

SOP No: QAS-SOP-16 Revision 7.0
Effective Date: “Approved by” date
Page 39 of 59
39
Attachment III
III Data Review Summary Narrative ________________________________________________________________________________
Mr. Jeffrey Hendel Environmental Protection Agency, Region 4 Science and Ecosystem Division 980 College Station Road Athens, GA 30605-2720 SUBJECT: Dioxin Data Review and Validation Project No. YRnnn ESAT TDF Nos. nnTnnnn EPA Sample Nos.: C083304-01-08 Sampling date(s): 08/01/08 With Reference to Site: Site XYZ.,
Camilla, GA PCDD/PCDF Analyses by: Contract Laboratory name, City, ST
Dear Mr. Hendel: The ESAT Work Team reviewed data for the project cited above consisting of six soil samples analyzed per CLP statement of work DLM02.0 for dioxins and furans in one sample delivery group (SDG). The laboratory was submitted both a blind spike and a blind blank PES. The samples were collected on 08/01/08, received by the laboratory on 08/07/08, and the data package was received by USEPA Quality Assurance Section, Region 4 SESD/MTSB on 08/22/08. An email supplement was received on 09/10/08 consisting of continuing calibration, resolution check, and PFK tuning verification to bracket dilutions performed found to be missing by the reviewer in the original submission. The laboratory prepared and analyzed all samples inside both the contractual and technical holding time limits. Please refer to the accompanying review document and to the attachments for further details. If you have any questions, please contact this office. Very Truly Yours: Approved: Name Name Sr. ESAT Data Reviewer Region 4 ESAT Team Manager ESAT Contractor ESAT Contractor
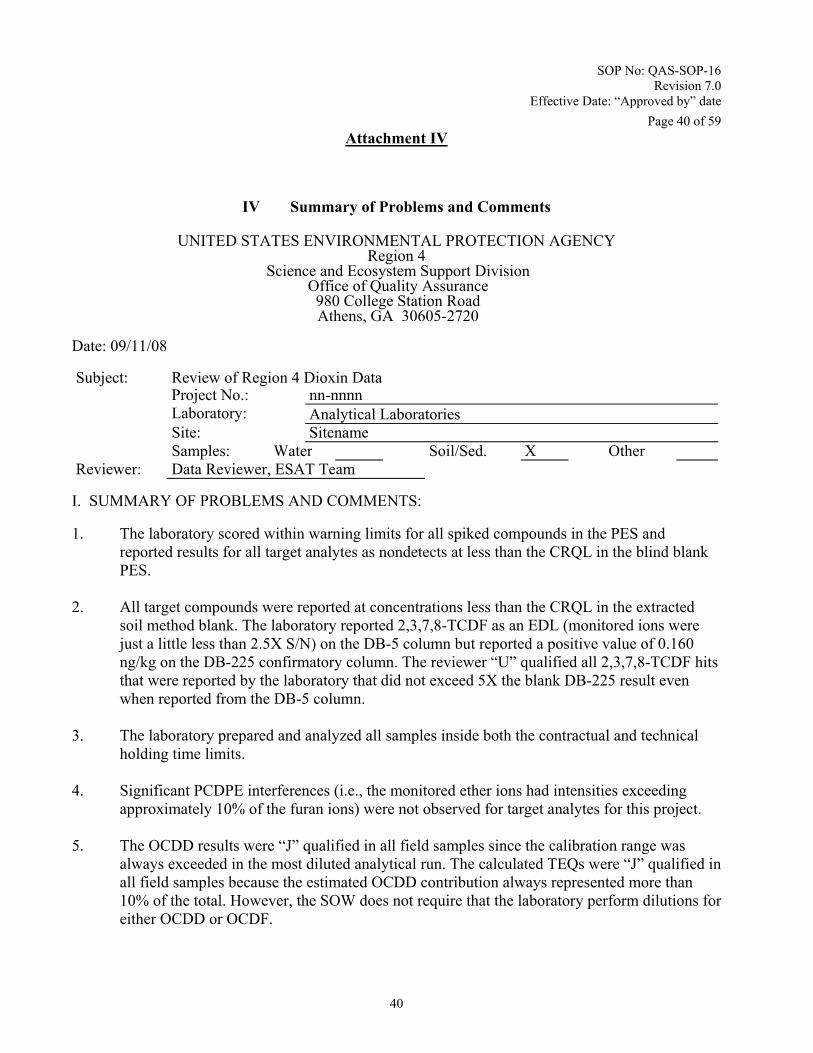
SOP No: QAS-SOP-16 Revision 7.0
Effective Date: “Approved by” date
Page 40 of 59
40
Attachment IV
IV Summary of Problems and Comments
UNITED STATES ENVIRONMENTAL PROTECTION AGENCY Region 4
Science and Ecosystem Support Division Office of Quality Assurance 980 College Station Road Athens, GA 30605-2720 Date: 09/11/08 Subject: Review of Region 4 Dioxin Data Project No.: nn-nnnn Laboratory: Analytical Laboratories Site: Sitename Samples: Water Soil/Sed. X Other Reviewer: Data Reviewer, ESAT Team I. SUMMARY OF PROBLEMS AND COMMENTS: 1. The laboratory scored within warning limits for all spiked compounds in the PES and
reported results for all target analytes as nondetects at less than the CRQL in the blind blank PES.
2. All target compounds were reported at concentrations less than the CRQL in the extracted
soil method blank. The laboratory reported 2,3,7,8-TCDF as an EDL (monitored ions were just a little less than 2.5X S/N) on the DB-5 column but reported a positive value of 0.160 ng/kg on the DB-225 confirmatory column. The reviewer “U” qualified all 2,3,7,8-TCDF hits that were reported by the laboratory that did not exceed 5X the blank DB-225 result even when reported from the DB-5 column.
3. The laboratory prepared and analyzed all samples inside both the contractual and technical
holding time limits. 4. Significant PCDPE interferences (i.e., the monitored ether ions had intensities exceeding
approximately 10% of the furan ions) were not observed for target analytes for this project. 5. The OCDD results were “J” qualified in all field samples since the calibration range was
always exceeded in the most diluted analytical run. The calculated TEQs were “J” qualified in all field samples because the estimated OCDD contribution always represented more than 10% of the total. However, the SOW does not require that the laboratory perform dilutions for either OCDD or OCDF.

SOP No: QAS-SOP-16 Revision 7.0
Effective Date: “Approved by” date
Page 41 of 59
41
SUMMARY OF DATA REVIEW FOR THIS CASE: II. ACTUAL SAMPLE HOLDING TIME Number of
Samples Analysis Late
6 0 REMARKS:
III. MASS RESOLUTION CHECK OVERALL: A FREQUENCY: A IONS MONITORED: m/z 304.9824: A m/z 380.9760: A A - Acceptable - All criteria met, static resolving power demonstrated
P - Provisional - All criteria not met U - Unacceptable - Criteria not met, static resolving power not demonstrated REMARKS:
IV. GC COLUMN PERFORMANCE CHECK OVERALL: A 2378-TCDD VALLEY: A 1289-TCDF/13468-PeCDF S/S: A A - Acceptable - All criteria met, separation/switching acceptable
P - Provisional - All criteria not met, separation/switching of reasonable quality; data usable. U - Unacceptable - Criteria not met, separation/switching of poor quality, data unusable REMARKS:
V. INITIAL CALIBRATION % RSD: A S/N RATIO: A ION RATIO: A A - Acceptable - All criteria met.
P - Provisional - Some criteria not met, data usable. U - Unacceptable - Criteria not met, data unusable.
REMARKS:

SOP No: QAS-SOP-16 Revision 7.0
Effective Date: “Approved by” date
Page 42 of 59
42
VI. BEGINNING CONTINUING CALIBRATION CHECK % D: A S/N RATIO: A ION RATIO: A A - Acceptable - All criteria met.
P - Provisional - Some criteria not met, data usable. U - Unacceptable - Criteria not met, data unusable.
REMARKS:
VII. ENDING CONTINUING CALIBRATION CHECK % D: A S/N RATIO: A ION RATIO: A A - Acceptable - All criteria met, static resolving power demonstrated
P - Provisional - All criteria not met U - Unacceptable - Criteria not met, static resolving power not demonstrated REMARKS:
VIII. BLANK ANALYSIS OVERALL: A FREQUENCY: A CONTAMINATION: A A - Acceptable - Contaminants present but below DL
P - Provisional - Contaminants present and above DL but minimal interference with sample results. U - Unacceptable - Gross contamination, too much interference to use data.
REMARKS: IX. LABORATORY CONTROL SAMPLE (LCS) % REC: A A - Acceptable - All criteria met.
P - Provisional - Some criteria not met, data usable. U - Unacceptable - Criteria not met, data unusable.
REMARKS:

SOP No: QAS-SOP-16 Revision 7.0
Effective Date: “Approved by” date
Page 43 of 59
43
X. DUPLICATE LABORATORY CONTROL SAMPLE (LCSD) % REC: A RPD: A A - Acceptable - All criteria met.
P - Provisional - Some criteria not met, data usable. U - Unacceptable - Criteria not met, data unusable.
REMARKS:
XI. BLIND SPIKE RESULTS PeacTOOLS Results: A No spike submitted A - Acceptable - % Recovery acceptable.
P - Provisional - % Recovery > warning limit, data usable. U - Unacceptable - % Recovery > action limit, data unusable.
REMARKS:
XII. SAMPLE ANALYSES
A. REPORTED ANALYTES
RET TIMES: A S/N RATIOS A ION MAX TIME: A ION RATIO: A CALCULATIONS: A PCDPE INT: A A - Acceptable - All criteria met.
P - Provisional - Some criteria not met, data usable. U - Unacceptable - Criteria not met, data unusable.
REMARKS:
B. INTERNAL STANDARDS % RECOVERY: A S/N RATIO: A ION RATIO: A A - Acceptable - All criteria met.
P - Provisional - Some criteria not met, data usable. U - Unacceptable - Criteria not met, data unusable. REMARKS:
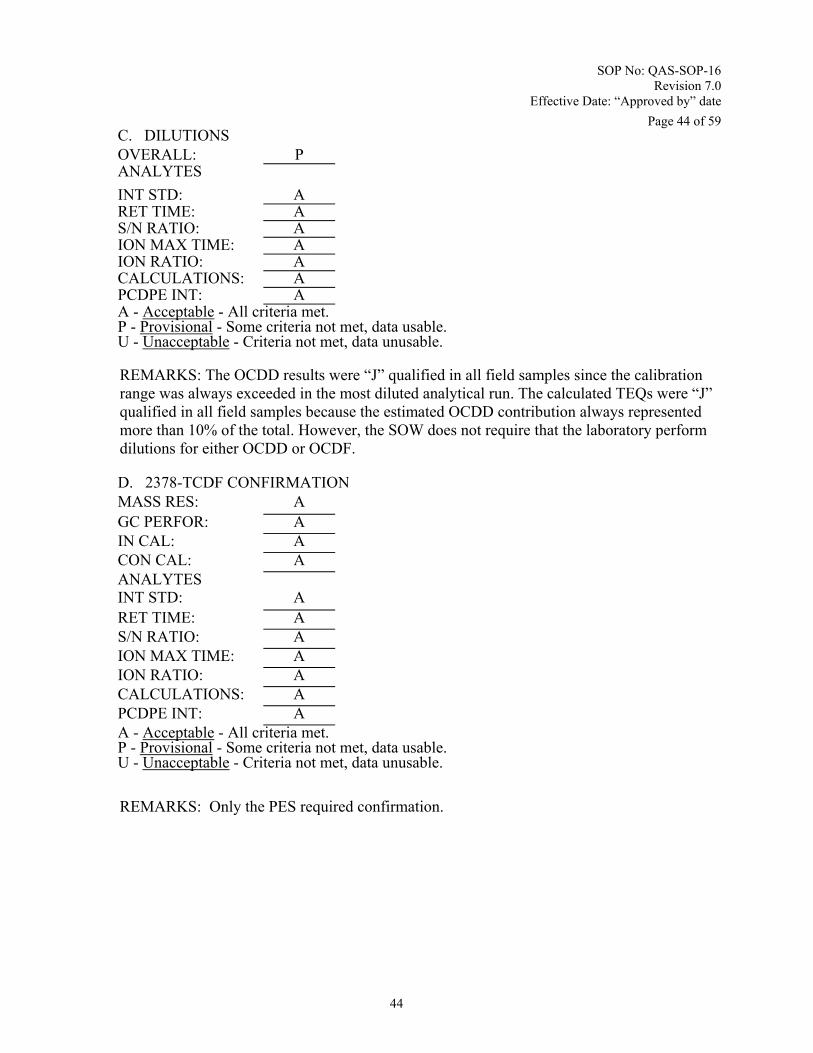
SOP No: QAS-SOP-16 Revision 7.0
Effective Date: “Approved by” date
Page 44 of 59
44
C. DILUTIONS OVERALL: P ANALYTES
INT STD: A RET TIME: A S/N RATIO: A ION MAX TIME: A ION RATIO: A CALCULATIONS: A PCDPE INT: A A - Acceptable - All criteria met.
P - Provisional - Some criteria not met, data usable. U - Unacceptable - Criteria not met, data unusable.
REMARKS: The OCDD results were “J” qualified in all field samples since the calibration range was always exceeded in the most diluted analytical run. The calculated TEQs were “J” qualified in all field samples because the estimated OCDD contribution always represented more than 10% of the total. However, the SOW does not require that the laboratory perform dilutions for either OCDD or OCDF.
D. 2378-TCDF CONFIRMATION MASS RES: A GC PERFOR: A IN CAL: A CON CAL: A ANALYTES INT STD: A RET TIME: A S/N RATIO: A ION MAX TIME: A ION RATIO: A CALCULATIONS: A PCDPE INT: A A - Acceptable - All criteria met.
P - Provisional - Some criteria not met, data usable. U - Unacceptable - Criteria not met, data unusable.
REMARKS: Only the PES required confirmation.

SOP No: QAS-SOP-16 Revision 7.0
Effective Date: “Approved by” date
Page 45 of 59
45
BLANK SUMMARY FORM
PCDD/PCDF Data Validation: Method DLM02.0Lab ID Description Extract Date Analysis Date Units
LMB16151 soil (DB-5) 08/13/08 08/15/08 ng/kg
LMB16151soil (DB-225) 08/13/08 08/20/08 ng/kg
2,3,7,8 TCDD ND TCDD Total ND 1,2,3,7,8 PCDD ND PCDD Total ND 1,2,3,4,7,8 HxCDD ND 1,2,3,6,7,8 HxCDD ND 1,2,3,7,8,9 HxCDD ND HxCDD Total ND 1,2,3,4,6,7,8 HpCDD ND HpCDD Total ND OCDD 0.950 J 2,3,7,8 TCDF ND 0.160 J TCDF Total 0.164 1,2,3,7,8 PeCDF ND 2,3,4,7,8 PeCDF 0.150 JE PeCDF Total ND 1,2,3,4,7,8 HxCDF 0.292 J 1,2,3,6,7,8 HxCDF ND 1,2,3,7,8,9 HxCDF ND 2,3,4,6,7,8 HxCDF ND HxCDF Total 0.484 1,2,3,4,6,7,8 HpCDF 2.14 J 1,2,3,4,7,8,9 HpCDF ND HpCDF Total 2.14 OCDF 4.16J
REMARKS: E represents EMPC (estimated most probable concentration), ion ratio out. * High IS recovery. ** Low IS recovery.

SOP No: QAS-SOP-16 Revision 7.0
Effective Date: “Approved by” date
Page 46 of 59
46
Attachment V
V Checklist for Task Order Compliance for Dioxin Data Packages delivered under DLM02.0
Regional Tracking Number: YR-0nnn SDG No.: GW-149-0908 Name of the Reviewer: ESAT team Laboratory Name: Lab abcd Region: 4 Task
Order Number: EP08W000877 Date of Review: month day, year 1. Task Order Compliance Check the task order for specific exceptions to the requirements set forth in DLM02.0 for data reporting and the methods of sample preparation, cleanup of sample extracts, and analysis. Check the Task Order (TO) and documentation related to sampling and lab receipt [Chain-of-Custody/Traffic Reports (COC/TR), CDD/CDF Sample Log-in Sheet (DC-1)] to determine the number and identity of the samples that should be present in the Complete Sample Delivery Group (SDG) File (CSF) package. Check the sample documentation to determine the number of matrices present, this should represent the minimum number of preparation batches present in the CSF, and thus the number of method blanks and Laboratory Control Samples (LCS) that should be present.
2. Data Turnaround
On Time? (Y/N)__N__
If No, Number of days late. _ 17 ___
3. All Forms
Are the following six pieces of information: Lab Name, Lab Code, Case No., Contract, TO No., SDG No., present on all forms?
(Y/N)__N__
Are the values reported for the six items consistent throughout the CSF? (Y/N)__Y__
Do the reported values agree with the values present on the Task Order and COC/TR documentation?
(Y/N)__Y__

SOP No: QAS-SOP-16 Revision 7.0
Effective Date: “Approved by” date
Page 47 of 59
47
4. Sample Data Summary (Form I-HR CDD-1, 1DFA)
Is a Form 1DFA present for every sample scheduled? (Y/N)__Y__
Is a Form 1DFA present for each dilution or re-analysis? (Y/N)_NA__
Is a Form 1DFA present for each DFBLK and LCS? (Y/N)__N__
Is all header information reported on Form 1DFA (Y/N)__Y__
Is a concentration or EMPC/EDL present for each target analyte? (Y/N)__Y__
Is a Peak RT present for each detected target analyte? (Y/N)__Y__
Is an Ion Ratio present for each target analyte? (Y/N)__Y__
Are Peak RT, Ion Ratio, and %REC present for each labeled compound? (Y/N)__Y__
Are all ion ratios and percent recoveries for the labeled compounds within the limits reported on the forms?
(Y/N)__Y__
5. Toxicity Equivalent Summary (Form I-HR CDD-2, 1DFB)
Is a Form 1DFB present for every sample scheduled? (Y/N)__Y__
Is a Form 1DFB present for each dilution or re-analysis? (Y/N)__Y__
Is a Form 1DFB present for each DFBLK and LCS? (Y/N)__N__
Is all header information reported on Form 1DFB (Y/N)__Y__
Is a concentration (or 0) present on Form 1DFB? (Y/N)__Y__
Are the TEF-adjusted concentrations present on Form 1DFB? (Y/N)__Y__
Is the total TEF-adjusted concentration on Form 1DFB? (Y/N)__Y__
6. CDF Second Column Confirmation (Form I-HR CDD-3, 1DFC)
Is a Form 1DFC present for each Form 1DFA which reports a concentration for 2,3,7,8-TCDF?
(Y/N)_NA__
Is all header information reported on Form 1DFC? (Y/N)_NA__
Is a concentration or EMPC/EDL present for each target analyte? (Y/N)_NA__
Is a Peak RT present for each detected target analyte? (Y/N)_NA__
Is an Ion Ratio present for each target analyte? (Y/N)_NA__
Are Peak RT, Ion Ratio, and %REC present for each labeled compound (Y/N)_NA__

SOP No: QAS-SOP-16 Revision 7.0
Effective Date: “Approved by” date
Page 48 of 59
48
7. Total Homologue Concentration Summary (Form II-HR, 2DF)
Is a Form 2DF present for every sample scheduled? (Y/N)__Y__
Is a Form 2DF present for each dilution and re-analysis? (Y/N)__Y_
Is a Form 2DF present for each DFBLK and LCS? (Y/N)__N__
Is all header information reported on Form 2DF? (Y/N)__Y__
Is the number of peaks present for each homologue? (Y/N)__Y__
Is a concentration or EMPC/EDL present for each homologue? (Y/N)__Y__
8. Laboratory Control Sample Summary (Form III-HR, 3DF)
Is a Form 3DF present for each matrix analyzed or preparation? (Y/N)__Y__
Is all header information reported on Form 3DF? (Y/N)__Y__
Is the Spike Added present? (Y/N)__Y__
Is the Amount Recovered present? (Y/N)__Y__
Is the Percent Recovery Present? (Y/N)__Y__
Was a LCS prepared and analyzed for each preparation batch? (Y/N)__Y__
Are less than four compounds outside the recovery limits? (Y/N)__Y__
9. Method Blank Summary Form (Form IV-HR, 4DF)
Is a Form 4DF present for each matrix analyzed or preparation? (Y/N)__Y__
Is all header information reported on Form 4DF? (Y/N) __Y__
Are [EPA Sample No., Lab Sample ID, Lab File ID, Date Analyzed] for each sample associated with the method blank present on Form 4DF?
(Y/N) __Y__
Was a DFBLK prepared and analyzed for each preparation batch? (Y/N)__Y__
Are all target compounds present in DFBLK at levels <CRQL? (Y/N)__Y__
10. Window Defining Mix (WDM) Summary (Form V-HR CDD-1, 5DFA)
Is a Form 5DFA present for each analysis of the WDM or the Column Performance Solution (CPS)?
(Y/N)__Y__
Are [GC Column, ID, Lab File ID, Instrument ID, Date Analyzed, Time Analyzed] present for each Form 5DFA?
(Y/N)__Y__
Is RT First Eluting present for each homologue? (Y/N)__Y__
Is RT Last Eluting present for each homologue? (Y/N)__Y__
Was the WDM analyzed at the required frequency (beginning and end of each analytical sequence)?
(Y/N)__Y__

SOP No: QAS-SOP-16 Revision 7.0
Effective Date: “Approved by” date
Page 49 of 59
49
11. Chromatographic Resolution Summary (Form V-HR CDD-2, 5DFB)
Is a Form 5DFB present for each analysis of the Isomer Specificity Check (ISC) or CPS? (Y/N)__Y__
Is [GC Column, ID, Lab File ID, Instrument ID, Date Analyzed, Time Analyzed] present for each Form 5DFB?
(Y/N)__Y__
Is Percent Valley present for each column used? (Y/N)__Y__
Was the ISC analyzed at the required frequency (beginning and end of each analytical sequence)?
(Y/N)__Y__
Was the Percent Valley for the ISC less than 25%? (Y/N)__Y__
12. Analytical Sequence Summary (Form V-HR CDD-3, 5DFC)
Is a Form 5DFC present for each run? (Y/N)__N__
Is [GC Column, ID, Instrument ID, Init. Calib. Date(s), Init. Calib. Times] present on each Form 5DFC?
(Y/N)__Y__
Is [EPA Sample No., Lab Sample ID, Lab File ID, Date Analyzed, Time Analyzed] present for each sample in the run?
(Y/N)__Y__
13. Initial Calibration Response Factor Summary (Form VI-HR CDD-1, 6DFA)
Is a Form 6DFA present for each initial calibration? (Y/N)__Y__
Is [GC Column, ID, Instrument ID, Init. Calib. Date(s), Init. Calib. Times] present on each Form 6DFA?
(Y/N)__Y__
Is RR/RRF present for each target analyte and each labeled compound for each calibration standard?
(Y/N)__Y__
Is the mean RR/RRF and %RSD present for each target analyte and each labeled compound? (Y/N)__Y__
14. Initial Calibration Ion Abundance Ratio Summary (Form VI-HR CDD-2, 6DFB)
Is a Form 6DFB present for each initial calibration? (Y/N)__Y__
Is [GC Column, ID, Instrument ID, Init. Calib. Date(s), Init. Calib. Times] present on each Form 6DFB?
(Y/N)__Y_
Is the Ion Abundance Ratio present for each target analyte, labeled compound, and internal standard?
(Y/N)__Y__

SOP No: QAS-SOP-16 Revision 7.0
Effective Date: “Approved by” date
Page 50 of 59
50
15. Initial Calibration
Was each HRGC/HRMS calibrated prior to analyzing samples? (Y/N)__Y__
Was calibration performed with at least five standards (Y/N)__Y__
Were the standards at the required concentrations? (Y/N)__Y__
Were the %RSD for the RR/RRF within limits? (Y/N)__Y__
Were the ion abundance ratios within limits? (Y/N)__Y__
16. Continuing Calibration Summary (Form VII-HR CDD-1, 7DFA)
Is Form 7DFA present for each cont. calibration analyzed? (Y/N)__Y__
Is [GC Column, ID, Instrument ID, Lab File ID, Date Analyzed, Time Analyzed, Init. Calib. Date(s), Init. Calib. Times] present on each Form 7DFA?
(Y/N)__Y__
Is [RR/RRF, Mean RR/RRF, %D, Ion Ratio] present for each target analyte, labeled compound, clean-up standard, and Internal Standard?
(Y/N)__Y__
17. Continuing Calibration Retention Time Summary (Form VII-HR CDD-2, 7DFB)
Is Form 7DFB present for each cont. calibration analyzed? (Y/N)__Y__
Is [GC Column, ID, Instrument ID, Lab File ID, Date Analyzed, Time Analyzed, Init. Calib. Date(s), Init. Calib. Times] present on each Form 7DFB?
(Y/N)__Y__
Are the RRT and RT present for each target analyte and labeled compound, and the RT present for the clean-up and Internal Standards?
(Y/N)__Y__

SOP No: QAS-SOP-16 Revision 7.0
Effective Date: “Approved by” date
Page 51 of 59
51
18. Continuing Calibration
Was the calibration monitored at the required frequency? (Y/N)__Y__
Was the required standard used to monitor the calibration? (Y/N)__Y__
Were all RRTs within the required limits? (Y/N)__Y__
Were all %D within the required limits? (Y/N)__Y__
Were all ion ratios within the required limits? (Y/N)__Y__
19. Selected Ion Current Profile (SICP) and Data System Reports
Are SICPs and Data System Reports present for each sample, including dilutions, and re-analyses?
(Y/N)__Y__
Are SICPs and Data System Reports present for each Initial Calibration Standard analyzed? (Y/N)__Y__
Are SICPs and Data System Reports present for each Continuing Calibration Standard analyzed?
(Y/N)__Y__
Are SICPs and Data System Reports present for each DFBLK and LCS analyzed? (Y/N)__Y__
20. Perfluorokerosene (PFK) Mass Resolution Data
Is PFK data present? (Y/N)__Y__
Was the PFK tune performed at required frequency? (Y/N)__Y__
21. Performance Evaluation (PE) Sample Data (if applicable)
Were PE samples analyzed by the laboratory? (Y/N)_NA_
Were all results within expected windows? (Y/N)_NA__
22. (3). Lab Code, Contract No. and SDG No. not on forms. (4)., (5)., and (7). Forms not included for LCS. (12). Not for DB-5 ICAL. (Dilutions and TCDF confirmation not required for this SDG).
23. Overall Data Package Acceptable for Payment Purposes Only (Y/N)__Y__
If Not Acceptable for Payment- summary of issues for non-payment.

SOP No: QAS-SOP-16 Revision 7.0
Effective Date: “Approved by” date
Page 52 of 59
52
Attachment VI
VI Internal PCDD/PCDF Spreadsheet
TCDD/TCDF Others OCDD/OCDF TCDD/TCDF Others OCDD/OCDF TCDD/TCDF Others OCDD/OCDF
No dilution:
(CS1) 0.50 2.50 5.0 ; DL(CS1)= 1.06E-02 5.31E-02 1.06E-01 4.25E+00 2.13E+01 4.25E+01
(CS5) 200 1000 2000
Sample wt. = ( 941.0 ml) %M or Lipids = ( 0 ) Extract Vol= ( 20 ) uL
Extract Diluted :
Dilution Factor= ( ) ; D1L(CS1)= 0.00E+00 0.00E+00 0.00E+00 0.00E+00 0.00E+00 0.00E+00
EPA LIMS Sample #: C083903-01 EPA Sample #: SDG: GW-149-0908 G611-126-17A
PROJECT NO.: Lab: SGS Env.Serv. 08-0734 GW-147-0908 a07oct08a_3-8
PROJECT NAME: 10/06/08
DATA REVIEWER: Method: CL DLM02.0 10/08/08
SAMPLE TYPE: Soil Waste Fish Water X
ng/KG ng/Kg ng/Kg ng/L
UNITS: ng/L
RESULT CODE Analysis Element CRQL (WHO-TEF) TEQ (WHO-TEF)TEQ (WHO-TEF) TEQDate Flag mammals mammals birds birds fish fish
401 1.6E-03 U 2,3,7,8 TCDD 10/8/08 1.1E-02 x U 1 = 1.6E-03 1 1.6E-03 1 1.6E-03
403 1.7E-03 U 1,2,3,7,8 PeCDD 10/8/08 5.3E-02 x U 1 = 1.7E-03 1 1.7E-03 1 1.7E-03
405 2.8E-03 U 1,2,3,4,7,8 HxCDD 10/8/08 5.3E-02 x U 0.1 = 2.8E-04 0.05 1.4E-04 0.5 1.4E-03
406 2.7E-03 U 1,2,3,6,7,8 HxCDD 10/8/08 5.3E-02 x U 0.1 = 2.7E-04 0.01 2.7E-05 0.01 2.7E-05
407 2.8E-03 U 1,2,3,7,8,9 HxCDD 10/8/08 5.3E-02 x U 0.1 = 2.8E-04 0.1 2.8E-04 0.01 2.8E-05
409 5.2E-03 U 1,2,3,4,6,7,8 HpCDD 10/8/08 CLP18 5.3E-02 x U,CLP18 0.01 = 5.2E-05 0.001 5.2E-06 0.001 5.2E-06
411 6.5E-02 J OCDD 10/8/08 CLP01 1.1E-01 x J,CLP01 0.0003 = 2.0E-05 0.0001 6.5E-06 0.0001 6.5E-06
412 1.2E-03 U 2,3,7,8 TCDF 10/8/08 1.1E-02 x U 0.1 = 1.2E-04 1 1.2E-03 0.05 5.9E-05
414 9.7E-04 U 1,2,3,7,8 PeCDF 10/8/08 5.3E-02 x U 0.03 = 2.9E-05 0.1 9.7E-05 0.05 4.9E-05
415 1.0E-03 U 2,3,4,7,8 PeCDF 10/8/08 5.3E-02 x U 0.3 = 3.0E-04 1 1.0E-03 0.5 5.1E-04
417 1.1E-03 U 1,2,3,4,7,8 HxCDF 10/8/08 5.3E-02 x U 0.1 = 1.1E-04 0.1 1.1E-04 0.1 1.1E-04
418 9.6E-04 U 1,2,3,6,7,8 HxCDF 10/8/08 5.3E-02 x U 0.1 = 9.6E-05 0.1 9.6E-05 0.1 9.6E-05
420 1.1E-03 U 2,3,4,6,7,8 HxCDF 10/8/08 5.3E-02 x U 0.1 = 1.1E-04 0.1 1.1E-04 0.1 1.1E-04
419 1.4E-03 U 1,2,3,7,8,9 HxCDF 10/8/08 5.3E-02 x U 0.1 = 1.4E-04 0.1 1.4E-04 0.1 1.4E-04
422 2.6E-03 U 1,2,3,4,6,7,8 HpCDF 10/8/08 CLP18 5.3E-02 x U,CLP18 0.01 = 2.6E-05 0.01 2.6E-05 0.01 2.6E-05
423 2.6E-03 U 1,2,3,4,7,8,9 HpCDF 10/8/08 5.3E-02 x U 0.01 = 2.6E-05 0.01 2.6E-05 0.01 2.6E-05
425 1.0E-02 J OCDF 10/8/08 CLP01 1.1E-01 x J,CLP01 0.0003 = 3.0E-06 0.0001 1.0E-06 0.0001 1.0E-06
402 1.6E-03 UJ TCDD Total 10/8/08 Q-3 1.1E-02 UJ,Q-3
404 1.7E-03 UJ PeCDD Total 10/8/08 Q-3 5.3E-02 UJ,Q-3
408 2.7E-03 UJ HxCDD Total 10/8/08 Q-3 5.3E-02 UJ,Q-3
410 4.5E-03 J HpCDD Total 10/8/08 Q-3 5.3E-02 J,Q-3
413 2.5E-03 UJ TCDF Total 10/8/08 Q-3 1.1E-02 UJ,Q-3
416 9.7E-04 UJ PeCDF Total 10/8/08 Q-3 5.3E-02 UJ,Q-3
421 9.6E-04 UJ HxCDF Total 10/8/08 Q-3 5.3E-02 UJ,Q-3
424 1.8E-03 UJ HpCDF Total 10/8/08 Q-3 5.3E-02 UJ,Q-3
430 5.1E-03 J TEQ (mammals from 2005 WHO-TEF 10/8/08 D-5 5.1E-03 J,D-5
428 6.5E-03 J TEQ (avian from 1998 WHO-TEF) 10/8/08 D-5 6.5E-03 J,D-5
429 5.8E-03 J TEQ (fish from 1998 WHO-TEF) 10/8/08 D-5 5.8E-03 J,D-5
9999 0 % moisture 10/8/08
% Lipids 10/8/08
DATE DATA ENTERED AND VERIFIED CR=Due to interferences introduced by the laboratory, neither presence nor absence can be confirmed.
Equivalent DL in Samples (see units below)
Dilution Date
SOLID Calibration Stds (pg/uL) Equivalent CL in Samples (see units below)
; CL (CS5)=
; C1L (CS5)=
GW-147-0908 LAB ID #:
F. Allen Analysis Date:
08-0734 SGS Env.Serv. Lab File:
Sonford Products, Flowood, MS Extraction Date:

SOP No: QAS-SOP-16 Revision 7.0
Effective Date: “Approved by” date
Page 53 of 59
53
Attachment VII
VII Time Tracker
VII TIME TRACKER
VERSION 4.0
CASE # : NA PROJECT #: 08-0657 TDF NO: 08Tnnnn
LAB METHOD(S): DLM02.0
LIMS METHOD CODE(S): XC299
NUMBER OF SAMPLES:
8
VALIDATED TIME OF SAMPLE RECEIPT (VTSR): 08/07/08 DUE DATE: 09/24/08
SITE NAME: Superfund Site Co.
SITE ID:
04QG
Box Inventory 08-122 PROGRAM: SARA
TASK ORDER: E123- 001 -42
STAGE OR PERSON INITIALS DATE ACCEPTED COMPLETION DATE
# Hours
1. Received by EPA OQADI 08/22/08
2. Evidentiary Audit TM 08/26/08 08/27/08 1.5
3. Data Reviewer MEK 09/08/08 09/11/08 12
4.
Data Entry
Initial Data Entry
electronic
Data and Qualifiers Corrections (if any)
5. LIMS Data Verification
Initial Data NA Corrections (if any)
6. Task Monitor (Overview /data di ib i )
Sample and Method Information
EPA Samples # (Separated by methods for
ith lti l l b
V SV Pest./
PCB
PCDD/ PCDF
Metals CN OTHERS (specified)
ICP/AE ICP/MS C083304-01-08 X
Notes/Comments

SOP No: QAS-SOP-16 Revision 7.0
Effective Date: “Approved by” date
Page 54 of 59
54
Attachment VIII
VIII Data Quality Assessment Report (non-CLP)
_________________________________________________________________________
Data Quality Assessment Record: PCDD/PCDF Review Date:
Analysis Date:
Matrix: Activity #:
Activity Name: Method: 8290 M23 CLP Other (specify) Signatures Analyst Reviewer
(or contract laboratory data reviewer) (An explanation for any "no" answer must be provided)
Yes No N/A
1. Holding Times: (§6.4, 8290) - PCDDs/PCDFs extracted within 30 days of sampling? ___ ___ ___ - Extracts analyzed within 40 days of extraction? ___ ___ ___ - Were all samples/extracts properly preserved? ___ ___ ___ 2. Laboratory Documentation - Sample Custody documented? ___ ___ ___ - Spiking Standards Traceable? ___ ___ ___ - Spiked amounts documented? ___ ___ ___ - Sample preparation steps documented, including all clean-up steps? ___ ___ ___ - Calibration standards traceable? ___ ___ ___ 3. GC/MS Tuning: (§7.6, 8290) - MS operated in SIM mode, �1 cycle/sec? ___ ___ ___
-At least all 48 ions in Table 6, in 4 or 5 groups? ___ ___ ___ (Tetra & Penta can be combined) - Same set of ions monitored for std and sample analyses? ___ ___ ___
-Tune to 10,000 resolution @ 10% valley,

SOP No: QAS-SOP-16 Revision 7.0
Effective Date: “Approved by” date
Page 55 of 59
55
using PFK ion @ 304.9824? ___ ___ ___ -Verify exact mass of m/z 380.9760?
Note whatever m/z's are chosen for tuning, m/z difference must be � the largest range in any of the descriptor groups. ___ ___ ___ 4. Initial Calibration: (§ 7.7, 8290) Instrument: ________ 3.1 Procedure: - Begun with column performance check sol (Table 7, 8290). ___ ___ ___ - Checks 1st and last ions in each descriptor, as well as TCDD isomer chromatographic resolution. ___ ___ ___

SOP No: QAS-SOP-16 Revision 7.0
Effective Date: “Approved by” date
Page 56 of 59
56
Yes No N/A
- Acquire data for 2 ul of each of 5 levels, as in Table 5, 8290. ___ ___ ___ - The ratio of integrated ion currents must be within limits of Table 8, 8290 (both labeled and non-labeled). ___ ___ ___ - Referring to Table 9, 8290, calculate RRFs for the 17 unlabeled target analytes relative to their ISs (Table 5, and for the 9 13C12-labeled ISs relative to the two recovery standards (Table 5). ___ ___ ___ - Calculate Mean RF and %RSD for each of 5 levels of standard (2,3,7,8-substituted isomers, as in Table 9). ___ ___ ___ - Calculate RRFs for total isomers in each homologous series according to 7.7.1.4.6. ___ ___ ___ - For series which contain only one isomer (i.e. OCDD, OCDF) or only one 2,3,7,8 isomer (i.e. TCDD, TCDF, PeCDD, & HpCDD), use the mean RRF calc'd in 7.7.1.4.5. ___ ___ ___ - For series which contain more than 1 2,3,7,8-substituted isomer, use the average of the RFs for the 2,3,7,8 isomers in that group (see 7.7.1.4.6.2). ___ ___ ___ - Calculate mean RFs for the nine ISs, rel. to the Recovery Stds from the 5 levels. ___ ___ ___ 4.2 Initial Cal Acceptance Criteria: - %RSDs for mean RFs of 17 unlabeled 2,3,7,8 ___ ___ ___ analytes �20%? - %RSDs for mean RFs of 9 labeled ISs �30%? ___ ___ ___ - S/N ratios for the GC signals in every std SICP �10? ___ ___ ___ - The ion abundance ratios (Table 8, 8290) within limits? ___ ___ ___ 5. Analysis (Refer to Figure 3, 8290): - Laboratory documentation should show that extracts were removed from storage and allowed to warm to room temp. ___ ___ ___ - Each daily run must begin with a MS resolution check, column performance check, a continuing cal, and a method blank. ___ ___ ___ - Column Performance Check (§ 8.2.1) - Chrom separation between 2,3,7,8 isomers �25% valley. ___ ___ ___
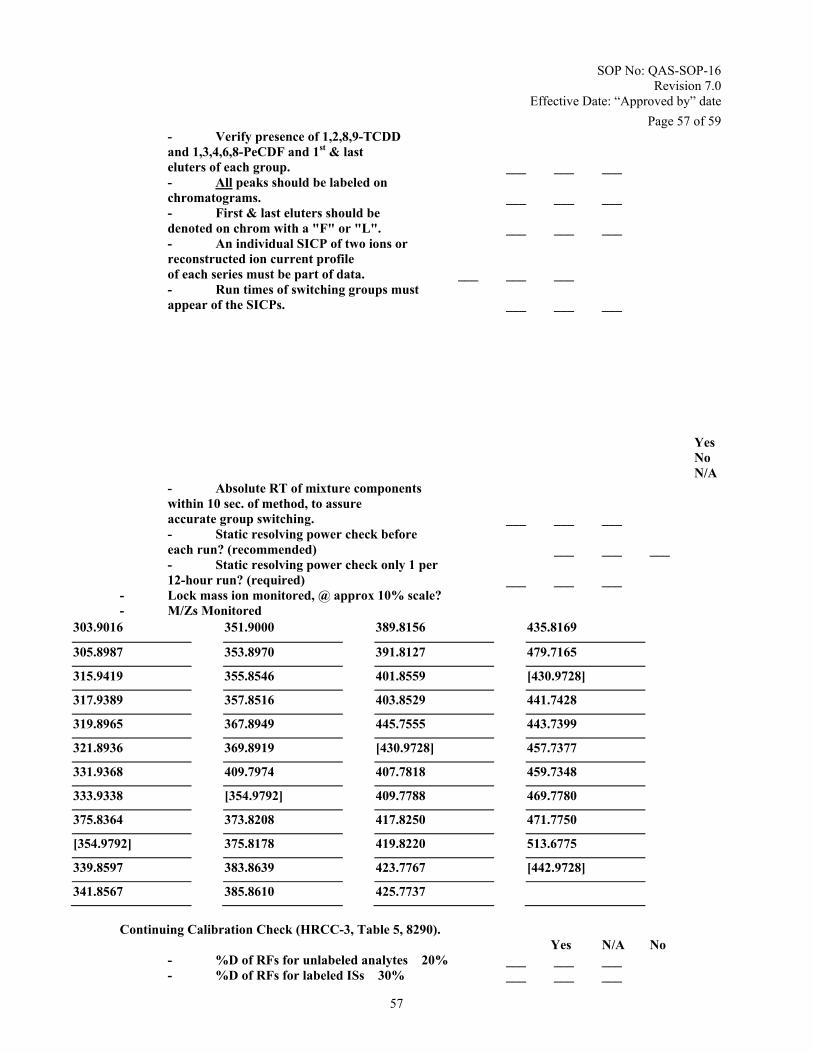
SOP No: QAS-SOP-16 Revision 7.0
Effective Date: “Approved by” date
Page 57 of 59
57
- Verify presence of 1,2,8,9-TCDD and 1,3,4,6,8-PeCDF and 1st & last eluters of each group. ___ ___ ___ - All peaks should be labeled on chromatograms. ___ ___ ___ - First & last eluters should be denoted on chrom with a "F" or "L". ___ ___ ___ - An individual SICP of two ions or reconstructed ion current profile of each series must be part of data. ___ ___ ___ - Run times of switching groups must appear of the SICPs. ___ ___ ___
Yes No N/A
- Absolute RT of mixture components within 10 sec. of method, to assure accurate group switching. ___ ___ ___ - Static resolving power check before each run? (recommended) ___ ___ ___ - Static resolving power check only 1 per 12-hour run? (required) ___ ___ ___ - Lock mass ion monitored, @ approx 10% scale? - M/Zs Monitored 303.9016 351.9000 389.8156 435.8169
305.8987 353.8970 391.8127 479.7165
315.9419 355.8546 401.8559 [430.9728]
317.9389 357.8516 403.8529 441.7428
319.8965 367.8949 445.7555 443.7399
321.8936 369.8919 [430.9728] 457.7377
331.9368 409.7974 407.7818 459.7348
333.9338 [354.9792] 409.7788 469.7780
375.8364 373.8208 417.8250 471.7750
[354.9792] 375.8178 419.8220 513.6775
339.8597 383.8639 423.7767 [442.9728]
341.8567 385.8610 425.7737
Continuing Calibration Check (HRCC-3, Table 5, 8290). Yes N/A No - %D of RFs for unlabeled analytes �20% ___ ___ ___ - %D of RFs for labeled ISs �30% ___ ___ ___

SOP No: QAS-SOP-16 Revision 7.0
Effective Date: “Approved by” date
Page 58 of 59
58
- Ion abundance ratios as per Table 8, 8290. ___ ___ ___ - If either %D criteria is not met, ___ ___ ___ repeat one time - Use judgement vs. project goals or ___ ___ ___ recalibrate. - Sample Analysis - S/N ratio �2.5? ___ ___ ___ - S/N ratio printed next to peak (with S/N <5:1). ___ ___ ___ - Retention time of analytes with accompanying spiked labeled congeners within -1 to +3 sec? ___ ___ ___ - Retention time of 2,3,7,8-substituted analytes with no labeled analog present within 0.005 RRT units? ___ ___ ___ - Retention time of non-2,3,7,8-substituted analytes within RT window of homologous series? ___ ___ ___ - Ion current maxima for both quant ions occurring within ±2 sec? (applies to labeled and unlabeled analogs). ___ ___ ___ - Ion abundance criteria met per Table 8? ___ ___ ___
Yes No N/A
- signal observed at same RT on diphenyl ether channel? (Table 6, 8290). ___ ___ ___ - Continuing Cal and Column MS resolution check run at end of each 12-hour period? ___ ___ ___ - If lab operates consecutive 12-hour periods, run col. perf. check between. ___ ___ ___ 6. Spikes: - Was a method spike analysis performed? ___ ___ ___ - Were matrix spike duplicate analyses performed? ___ ___ ___ - Were acceptable recoveries obtained? ___ ___ ___ 7. Laboratory Duplicate: - %RPD within limits? ___ ___ ___ 8. Blanks: - Were method blank analyses performed? ___ ___ ___ - Were any contaminants noted? ___ ___ ___ - If yes, were blank rules applied to the data? ___ ___ ___ 9. Performance Evaluation Sample: - Was a P.E. Sample analyzed with the samples? ___ ___ ___

SOP No: QAS-SOP-16 Revision 7.0
Effective Date: “Approved by” date
Page 59 of 59
59
- If yes, were acceptable results obtained? ___ ___ ___ 10. Internal Standard Response - % Recovery between 40% and 135%? ___ ___ ___ 11. Surrogates (Added at start of sample prep): - Were surrogate recoveries acceptable? ___ ___ ___
Additional Comments: