Sony Pictures Digital Productions Mid-Range Plan September 3, 2013.
Upload
curtis-davidsonCategory
view
214download
0
Sony PicturesDigital Productions
Mid-Range PlanSeptember 8, 2011

FY12 Mid-Range Plan Strategy
Overview
Sony Pictures Animation
Imageworks
Imageworks Interactive
MRP Financial Projections
Financial Appendix

StrategyOverview

Open Season Franchise Cloudy (9/18/09) Smurfs (7/29/11) -
10,000
20,000
30,000
40,000
50,000
60,000
70,000
80,000
90,000
7,440
45,555
76,700
26305
7640
Gross Profit, SPA Releases FY10 - Present ($000)
Digital ProductionsSignificant progress towards meeting strategic goals over the past three years SPA is executing on its objective of producing
financially successful films with franchise potential
4
Open Season 9/29/06
Open Season 2 (DTV) 1/27/09
Open Season 3 (DTV) 1/25/11
* Note: Cloudy gross profit calculation excludes $47MM in legacy costs
** Note: Smurfs at current target -- $140MM DBO, $360MM IBO; excludes negative co-financier impact on GP (~$8.0MM)
***Note: Smurfs target of $500MM WWBO
Open Season Franchise: DTVs increased original Open Season film margin from 2% to 9%
Cloudy Margin: 15%*
Smurfs Margin: 18%**
Open Season (9/29/06)
Surf's Up (6/8/2007)
Cloudy (9/18/09)
Smurfs (7/29/11)***
0
100
200
300
400
500
600
85.1 58.9124.9 140
112.290.2
118.1
360
WWBO, SPA Releases CY06 - Present ($MM)
DBO IBO

Digital ProductionsSignificant progress towards meeting strategic goals over the past three years
Imageworks has dramatically improved its performance by re-sizing the business, increasing efficiency, growing its satellites, improving support for SPA & Columbia and focusing on fewer, larger projects
5*Note: Due to lower cost structure to execute on $155MM revenue business, Imageworks was able to generate a $5.8MM GP in a down revenue year **Note: Q2 Forecast
FY08 FY09 FY10 FY11 FY12
(40,000)
(30,000)
(20,000)
(10,000)
-
10,000
20,000
30,000
40,000
50,000
60,000
-
20,000
40,000
60,000
80,000
100,000
120,000
140,000
160,000
180,000
200,000
(30,548) (35,227)
9,020 5,826* 8,000**
146,324 137,491
183,400
128,747*
169,774**
FY08-FY12 Imageworks Revenues vs. EBIT ($000)
Consolidated EBIT Total Unabsorbed Costs Gross Revenue

Digital ProductionsStrategic Priorities
Strategic priorities for SPDP include: Serve as the hub for family films at SPE, which require a unique
sensibility and writing approach
Develop more consistent film output to reduce financial volatility
Produce two franchise-potential films a year (CG animated + live-action hybrid), with flexibility to add a third film if needed:
Success of Smurfs and Cloudy’s strong performance warrant development of those properties as theatrical sequels rather than DTVs
Theatrical sequels perform better than the originals for these films, particularly internationally. On average, international box for animated theatrical sequels has generated 2.2 times the revenue of domestic box since 2004
Work closely with Home Entertainment to realize upside potential for titles like Smurfs that over-perform:
During its first 8 weeks in the U.S., Despicable Me sold 6.4MM units; Alvin & The Chipmunks: The Squeakquel sold 3.7MM units. Smurfs has a conservative target of 2.25MM units for the first 8 weeks in the U.S.
6

Digital ProductionsStrategic Priorities (cont.)
Expand revenues from merchandising, licensing and promotions to realize full franchise potential of these films
Produce shorts opportunistically from theatrical properties to deepen brand awareness pre- or post-theatrical release plus create new revenue streams from the property
Franchise extension The Smurfs : A Christmas Carol will aid sell-through of the film and then broadcast on TV worldwide, generating revenue and sustaining the property awareness in on and off-film years. Consumer Products is also leveraging the short to help re-launch merchandise during the upcoming holiday season
Additional Smurfs, Hotel T and Pirates! shorts are under discussion
Aggressively expand Vancouver to continue to reduce overall costs for SPA and Columbia films in competitive marketplace
Discover additional sources of EBIT through exploring new lines of business that are closely related to the core businesses. Self-fund to significantly reduce these start-up costs
7


9
Sony Pictures AnimationStrategic Focus and Progress
Strategic Focus Progress To-DateBuild profitable franchises from strong brands that can be executed as either theatrical or DTV sequels: High-end CG animated films Mid-tier CG animated films Live-action/animation hybrids
Released live-action hybrid The Smurfs to strong success (#1 film in North America after first five days in release; #1 total international gross for 4 consecutive weekends. Already, Smurfs is the top live-action hybrid family film ever released internationally)
Hotel Transylvania in production Smurfs: A Christmas Carol is produced; 22 minute franchise
extension Released successful DTV Open Season 3 Actively developing Smurfs and Cloudy sequels Several promising projects currently in priority development
based on either well-known brands or concepts with strong franchise potential: Popeye, Familiars and Ninja vs. Samurai
Reduce production budget to compensate for eroding home video market
Reduce production CG animation budget by 10-15%, excluding 3D
Shepherd Aardman relationship CG animated Arthur Christmas in post- production Stop motion Pirates! in post-production Actively developing Pirates! sequel Actively developing Nick Park’s Cavemen United project
Realize fuller set of revenue opportunities
Increase merchandising, licensing and promotional opportunities by working closely with Consumer Products Group
Support Sony Electronics’ initiatives Cloudy, Open Season and Smurfs characters have been key elements in Sony Electronics’ marketing and promotional campaigns. Seek similar opportunities with Hotel T and all upcoming properties

SPA is focused on these following films in production: Arthur Christmas: Aardman, CG animated (3D)
In post-production Directors: Sarah Smith; Script: Peter Baynham (Academy Award
nominee for Borat) Pirates!: Aardman, Stop-Motion (3D)
In post-production Director: Peter Lord
Hotel Transylvania: High-end, CG animated (3D) starring Adam Sandler
In production Directors: Genndy Tartakovsky; Producer: Michelle Murdocca
The Smurfs: A Christmas Carol: High-end CG + 2D (hand-drawn) animation / 22 minute original content value-add piece for Smurfs DVD release and TV
Recently completed Director: Troy Quane; Producer: Kurt Albrecht
Sony Pictures AnimationFranchise Development
10
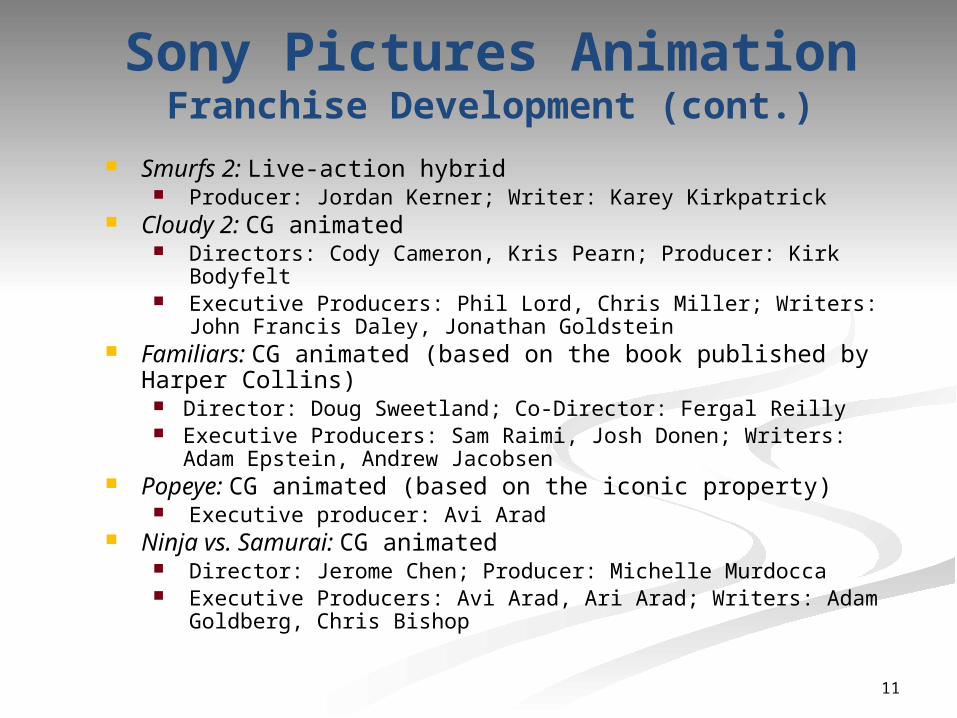
Sony Pictures AnimationFranchise Development (cont.)
11
Smurfs 2: Live-action hybrid Producer: Jordan Kerner; Writer: Karey Kirkpatrick
Cloudy 2: CG animated Directors: Cody Cameron, Kris Pearn; Producer: Kirk Bodyfelt Executive Producers: Phil Lord, Chris Miller; Writers: John Francis
Daley, Jonathan Goldstein Familiars: CG animated (based on the book published by
Harper Collins) Director: Doug Sweetland; Co-Director: Fergal Reilly Executive Producers: Sam Raimi, Josh Donen; Writers: Adam
Epstein, Andrew Jacobsen Popeye: CG animated (based on the iconic property)
Executive producer: Avi Arad Ninja vs. Samurai: CG animated
Director: Jerome Chen; Producer: Michelle Murdocca Executive Producers: Avi Arad, Ari Arad; Writers: Adam Goldberg,
Chris Bishop

Sony Pictures AnimationFranchise Development (cont.)
12
Muncle Trogg: CG animated Executive Producer: Jane Startz
Planet Pete: CG animated Directors: Butch Hartman Executive Producer: Fred Seibert; Writers: Kathyrn Price, Nicole
Millard Pooch Café: CG animated
Executive Producers: Gil Netter, Bridget McMeel, John Glynn; Writer: Kelly Asbury (Gnomeo & Juliet)
Kazorn and the Unicorn: CG animated Executive Producers: Sam Raimi, Josh Donen; Writer: Lloyd Taylor
Instant Karma: Live-action hybrid Producer Terry Rossio; Writer: Paul Hernandez
Raised by Ghosts: Live-action hybrid Producer: Chuck Gordon; Writer: Mark Perez
13
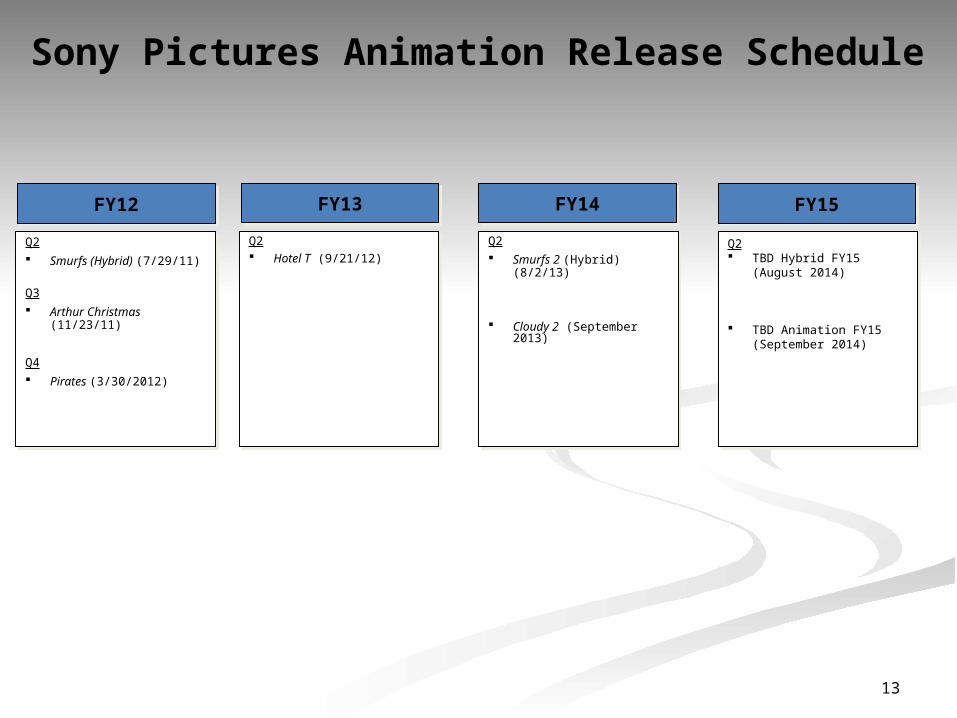
Sony Pictures Animation Release Schedule
FY12FY12
Q2
Smurfs (Hybrid) (7/29/11)
Q3
Arthur Christmas (11/23/11)
Q4
Pirates (3/30/2012)
Q2
Smurfs (Hybrid) (7/29/11)
Q3
Arthur Christmas (11/23/11)
Q4
Pirates (3/30/2012)
FY13FY13
Q2 Hotel T (9/21/12)
Q2 Hotel T (9/21/12)
FY14FY14
Q2
Smurfs 2 (Hybrid) (8/2/13)
Cloudy 2 (September 2013)
Q2
Smurfs 2 (Hybrid) (8/2/13)
Cloudy 2 (September 2013)
FY15FY15
Q2 TBD Hybrid FY15 (August
2014)
TBD Animation FY15 (September 2014)
Q2 TBD Hybrid FY15 (August
2014)
TBD Animation FY15 (September 2014)


Serve SPA and Columbia as a dependable source of high-quality digital animation and VFX expertise
Further reduce costs by aggressively expanding Vancouver, where we enjoy a 58.4% tax rebate on labor
Maintain industry leadership in innovation and quality
Continue to use large 3rd party projects (e.g. OZ, Green Lantern, Alice in Wonderland ) as a means to reduce SPA and Columbia production cost (less gap cost, shared overhead, shared R&D, stronger talent pool)
Commercialize technology as appropriate to create new sources of revenue
15
ImageworksStrategy

Aggressively expand Vancouver to fully leverage its 58.4% tax rebate on labor: Add additional artist groups (color and lighting) and
expand size of existing departments Projected to reach office capacity of 135 employees by
February 2012 Plan and execute second-stage expansion to double
capacity by the end of CY12 Reduce rates charged by India facility following the
buy-out of our partners by the end of FY12 Given the instability of the New Mexico tax rebates and
lack of talent, assess closing the Albuquerque facility and shift capacity to Vancouver at the end of FY12
ImageworksStrategic Objectives – Expand Vancouver
16

The growing number of artists in Vancouver will complete an increasingly larger share of work relative to Culver City:
At the same time, Imageworks has reduced its expensive Culver City real estate footprint (in sq ft) by 44% since FY08, a net cost reduction of ~$4MM/year, while increasing density in TCSOB
ImageworksStrategic Objectives – Expand Vancouver
17
FY12 FY13 FY14 FY150%
10%
20%
30%
40%
7%
15%
25%
30%
Vancouver: Percentage Share of Overall Project Man-Hours, Animation/Color & Light, FY12 – FY15
CAGR : 44%
ImageworksStrategic Objectives – Large 3rd Party Projects
Continue to target large 3rd party projects (e.g., OZ, Alice in Wonderland, Green Lantern and G-Force) to improve profitability and reduce volatility
Leverage director relationships to generate future business (Sam Raimi, Tim Burton)
Continue to be recognized for industry-leading work, at a competitive price Oscar nomination for Alice in 2010 (Imageworks’ first since
Spider-Man 2 in 2005) was a critical factor in securing the VFX work from Disney for OZ
Imageworks’ accolades during the past year also included a BAFTA and ‘Annies’ nom and a Golden Satellite win for its work in Alice. Imageworks also won a Lumiere Award for its pioneering work in 3D
18

ImageworksStrategic Objectives – Make Imageworks
technology the industry standard and monetize where appropriate
Use innovative technology and partnerships to increase efficiency, reduce development costs, and position Imageworks’ technology as the industry standard Imageworks extends its leadership in Open Source,
driving the Alembic partnership with ILM New image-based lighting pipeline lowered costs while
improving quality for both Smurfs and Green Lantern Pending adoption of G-Mail will dramatically lower costs
while adding significant collaboration tools Exploit opportunities to monetize our technology
– e.g., royalties from Foundry for commercialization of our Katana technology
19

Continue to focus on renewed relationship with Columbia as a critical resource for VFX expertise
Serving the studio – and company – as the “go to” resource on 3D through availability of key staff, technology and facilities
Services provided included: Senior leadership and resources to support Sony Corp.
initiatives in both Culver City and Tokyo Assistance for Columbia 3D logo, Zookeeper and Here
Comes the Boom Custom animation for Smurfs TV marketing campaign
(e.g., characters appearing on America’s Got Talent, McDonalds commercials)
20
ImageworksStrategic Objectives – Sony Corp & Columbia
Resource

22
Maximize unique lower-cost synergies with Imageworks to deliver industry-leading support to internal clients at below-market rates
Lower-than-anticipated costs enabled Interactive to rebate $2MM back to SPE Marketing over the past two years
Lowered costs by relocating business unit to TCSOB Opportunistically self-fund and explore closely-related, high-
margin businesses: Produce social game based on SPA property, relying heavily
on unit’s pre-existing experience in social media as well as gap-time of artists to reduce overall start-up costs Based on results of first game, expand business by
launching a new title each year Game infrastructure can be re-used by SPE Digital
Marketing for other promotional games, dramatically reducing their per-game costs
Produce interactive book based on SPA property, providing higher-level interactivity in an arrangement with one (or more) publishers as a prelude to opportunistically publishing in-house
Expand 3rd party business to continue to reduce overall cost for internal clients, mirroring successful Imageworks’ model
Imageworks Interactive Strategy

MRP Financial Projections
24
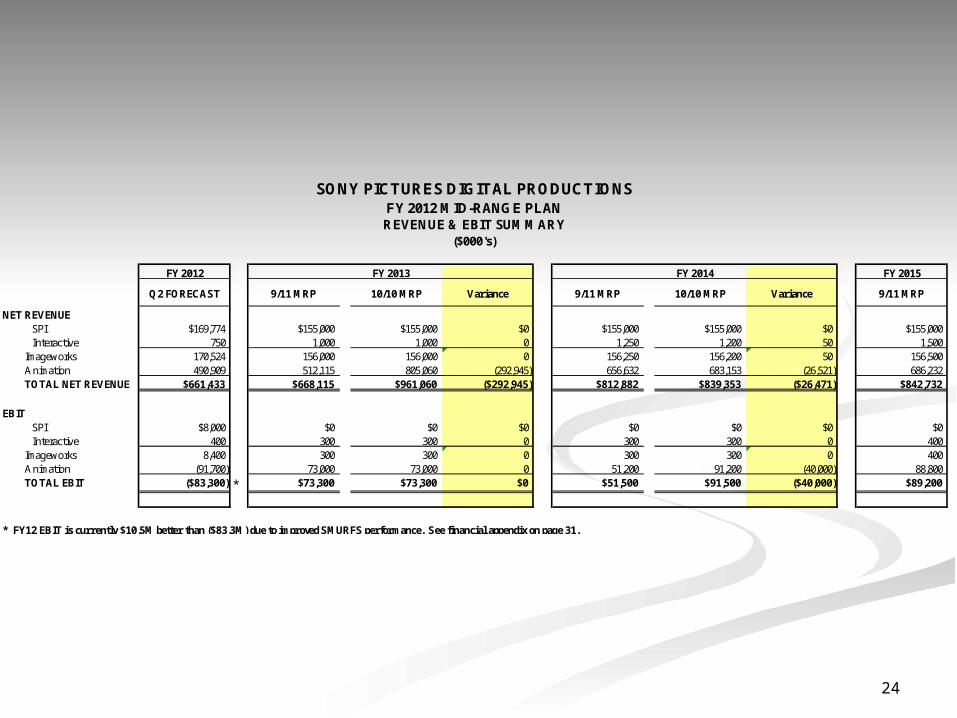
SONY PICTURES DIGITAL PRODUCTIONSFY 2012 MID-RANGE PLANREVENUE & EBIT SUMMARY
($000's)
FY 2012 0 FY 2013 0 FY 2014 0 FY 2015
Q2 FORECAST 9/11 MRP 10/10 MRP Variance 9/11 MRP 10/10 MRP Variance 9/11 MRP
NET REVENUESPI $169,774 $155,000 $155,000 $0 $155,000 $155,000 $0 $155,000Interactive 750 1,000 1,000 0 1,250 1,200 50 1,500
Imageworks 170,524 156,000 156,000 0 156,250 156,200 50 156,500Animation 490,909 512,115 805,060 (292,945) 656,632 683,153 (26,521) 686,232TOTAL NET REVENUE $661,433 $668,115 $961,060 ($292,945) $812,882 $839,353 ($26,471) $842,732
EBITSPI $8,000 $0 $0 $0 $0 $0 $0 $0Interactive 400 300 300 0 300 300 0 400
Imageworks 8,400 300 300 0 300 300 0 400Animation (91,700) 73,000 73,000 0 51,200 91,200 (40,000) 88,800TOTAL EBIT ($83,300) * $73,300 $73,300 $0 $51,500 $91,500 ($40,000) $89,200
* FY12 EBIT is currently $10.5M better than ($83.3M) due to improved SMURFS performance. See financial appendix on page 31.

25
SONY PICTURES DIGITAL PRODUCTIONSFY 2012 MID-RANGE PLAN
EBIT RECONCILIATION($000's)
FY12 FY13 FY14
EBIT PER FY12 BUDGET & 10/10 MRP ($101,700) $73,300 $91,500
VariancesImageworks
• EBIT impact on increased work of $14.7M (Green Lantern and Oz) 6,600• Albuquerque rebate - decreased rebate driven by shift of headcount to Vancouver (2,894) (2,986)• Vancouver rebate - increase driven by Vancouver expansion 2,402 3,777• Net Depreciation / Maintenance spending for Hardware / Software - driven by Vancouver expansion 1,453 402 (1,769)• Other, net 147 90 978
Subtotal Imageworks 8,200 0 0
Animation• Removal of FY13 TBD Hybrid (Aug 2012) 7,138 (29,013)• Removal of two FY13 Direct to Video titles (Apr 2012, March 2013) (8,824) (3,571)
• SMURFS performance - $4.3M increased DBO to $140M; $16.3M increased IBO to $325M* 20,642• SMURFS -lower ITV ultimate ($7.2M) compared to prior year MRP and timing of ITV and PTV flows 9,700 (11,529) (2,162)• PIRATES - ($7.2M) int'l release date shift from FY13 to 3/30/12 (Brazil, France, Italy, Spain, Mexico) and ($6.3M)
domestic release date shift from 4/6/11 to 3/30/11 (13,530) 20,734 (1,968)• ARTHUR CHRISTMAS - increased domestic marketing ultimate by ($7.3M); timing of PTV from FY13 to FY14 (5,922) (5,074) 11,196• HOTEL T - ultimate adjustment from $125M DBO to $120M DBO and timing of DHE flows (6,206) 3,795• CLOUDY 2 - delayed timing of pre-marketing spend to FY14; ultimate adjustment DBO/IBO to $100M/$175M per J.
Blake from $125M/$156M prior MRP 3,500 (5,631)• SMURFS 2 - primarily net of production cost increase from $90M to $122M and DBO/IBO to $125M/$325M per J.
Blake from $125M/$190M prior MRP 986 (2,958)• FY15 TBD HYBRID & TBD ANIMATION - pre-marketing spend (9,000)• Other, net (690) (725) (688)
Subtotal Animation 10,200 0 (40,000)
TOTAL VARIANCE $18,400 $0 ($40,000)
EBIT PER 9/11 MRP ($83,300) $73,300 $51,500
* FY12 EBIT is currently $10.5M better than ($83.3M) due to improved SMURFS performance. See financial appendix on page 31.

26
SONY PICTURES DIGITAL PRODUCTIONSFY 2012 MID-RANGE PLAN
RECEIPTS & CASH FLOW SUMMARY($000's)
FY 2012 0 FY 2013 0 FY 2014 0 FY 2015
Q2 FORECAST 9/11 MRP 10/10 MRP Variance 9/11 MRP 10/10 MRP Variance 9/11 MRP
NET RECEIPTSSPI $169,774 $155,000 $155,000 $0 $155,000 $155,000 $0 $155,000Interactive 24,114 25,773 25,773 0 27,932 27,932 0 30,167
Imageworks 193,888 180,773 180,773 0 182,932 182,932 0 185,167Animation 0 0 0 0 0 0 0 0TOTAL NET RECEIPTS $193,888 $180,773 $180,773 $0 $182,932 $182,932 $0 $185,167
NET CASH FLOWSPI $2,600 $200 $2,700 ($2,500) ($1,200) ($1,600) $400 ($200)Interactive 400 600 635 (35) 900 877 23 1,000
Imageworks 3,000 800 3,335 (2,535) (300) (723) 423 800Animation (216,800) (244,100) (260,800) 16,700 (257,600) (258,000) 400 (247,000)TOTAL NET CASH FLOW ($213,800) ($243,300) ($257,465) $14,165 ($257,900) ($258,723) $823 ($246,200)
27
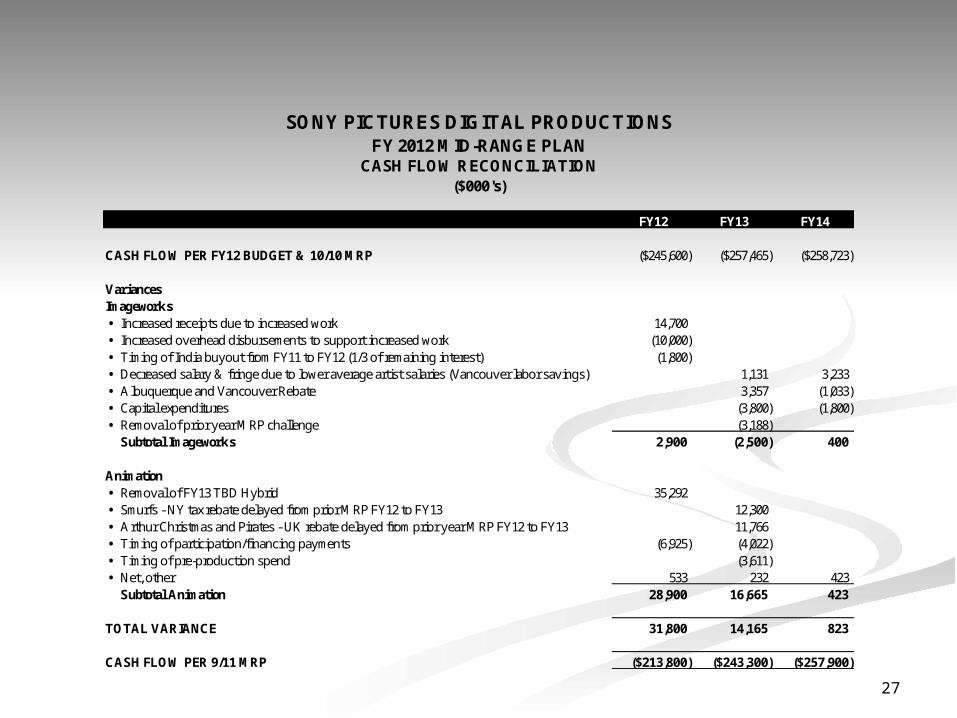
SONY PICTURES DIGITAL PRODUCTIONSFY 2012 MID-RANGE PLAN
CASH FLOW RECONCILIATION($000's)
FY12 FY13 FY14
CASH FLOW PER FY12 BUDGET & 10/10 MRP ($245,600) ($257,465) ($258,723)
VariancesImageworks• Increased receipts due to increased work 14,700• Increased overhead disbursements to support increased work (10,000)• Timing of India buyout from FY11 to FY12 (1/3 of remaining interest) (1,800)• Decreased salary & fringe due to lower average artist salaries (Vancouver labor savings) 1,131 3,233• Albuquerque and Vancouver Rebate 3,357 (1,033)• Capital expenditures (3,800) (1,800)• Removal of prior year MRP challenge (3,188)
Subtotal Imageworks 2,900 (2,500) 400
Animation• Removal of FY13 TBD Hybrid 35,292• Smurfs - NY tax rebate delayed from prior MRP FY12 to FY13 12,300• Arthur Christmas and Pirates - UK rebate delayed from prior year MRP FY12 to FY13 11,766• Timing of participation/financing payments (6,925) (4,022)• Timing of pre-production spend (3,611)• Net, other 533 232 423
Subtotal Animation 28,900 16,665 423
TOTAL VARIANCE 31,800 14,165 823
CASH FLOW PER 9/11 MRP ($213,800) ($243,300) ($257,900)

Financial Appendix

Before FY12 FY13 FY14 FY15 After TotalFY12 Q2 Forecast MRP MRP MRP FY15 Project
Live Action VFXThe Amazing Spiderman $1,784 $52,813 $0 $0 $0 $0 $54,597Green Latern 41,222 16,871 - - - - 58,093 Oz - 13,000 59,860 - - - 72,860 MIB 3 4,373 34,627 - - - - 39,000 Pacific Rim - - 30,900 7,000 - - 37,900 TBD - - 2,140 73,000 80,000 - 155,140 Other - Test, Spec, Work, and Bids - 434 - - - - 434 Subtotal 47,379 117,745 92,900 80,000 80,000 - 418,024
SPA (Animation)SPA - Hotel T 17,111 20,490 17,338 - - - 54,939 SPA - Hotel T 3D - - 3,374 - - - 3,374 SPA - Smurfs 32,747 12,247 - - - - 44,994 SPA - Smurfs 3D 530 513 - - - - 1,043 Aardman - Arthur Christmas 36,337 22,096 - - - - 58,433 Aardman 3D 712 2,127 - - - - 2,839 SPA - Cloudy 2 - 2,500 37,500 10,000 - - 50,000 SPA - Smurfs 2 - 1,712 22,562 5,726 - - 30,000 SPA - Animation TBD FY15 - - 10,000 30,000 15,000 - 55,000 SPA - Hybrid - TBD FY15 - - - 20,085 9,915 - 30,000 SPA - Animation TBD FY16 - - - 12,000 34,000 9,000 55,000 SPA - Hybrid - TBD FY16 - - - - 20,085 9,915 30,000 SPA - Animation TBD FY17 - - - - 7,500 47,500 55,000 SPA Contingency - (4,656) (15,774) (2,811) (11,500) - (34,741) Subtotal 87,437 57,029 75,000 75,000 75,000 66,415 435,881
Revenue Reserve - (5,000) (12,900) - -
Total Revenue $134,816 $169,774 $155,000 $155,000 $155,000 $66,415 $853,905
Third Party Revenue 41,222 29,871 92,900 80,000 80,000 - 323,993 SPE Revenue 93,594 139,903 62,100 75,000 75,000 66,415 529,912 Total 134,816 169,774 155,000 155,000 155,000 66,415 853,905
Live Action VFX $47,379 $112,745 $80,000 $80,000 $80,000 $0 $418,024All-CG 87,437 57,029 75,000 75,000 75,000 66,415 435,881 Total $134,816 $169,774 $155,000 $155,000 $155,000 $66,415 $853,905
StatusAwarded - Greenlit $176,930 $103,134 $5,726 $0Not Awarded - Not Greenlit (7,156) 51,866 149,274 155,000 Total $169,774 $155,000 $155,000 $155,000
Not Awarded % -4.2% 33.5% 96.3% 100.0%
IMAGEWORKSMRP REVENUE ANALYSIS BY PROJECT
FY12 Q2 FORECAST & MRP($ In Thousands)
Project

30
SONY PICTURES ANIMATIONSUMMARY OF EBIT BY TITLE
FISCAL YEAR 2012 Q2 FORECAST & MRP
(In thousands)
FY15
Title Release DateQ2
FORECAST 10-11 MRP 10-10 MRP VAR TO MRP 10-11 MRP 10-10 MRP VAR TO MRP 10-11 MRP
Open Season September 29, 2006 348$ (24)$ 664$ (688)$ 530$ 976$ (446)$ 595$ Surf's Up June 8, 2007 (404) 40 (143) 183 17 (228) 245 91 Open Season 2 DTV January 2009 902 464 340 124 228 380 (152) 77 Cloudy with a Chance of Meatballs September 18, 2009 5,980 1,913 1,408 505 383 299 84 409 Open Season 3 DTV January 2011 2,890 345 561 (216) (88) 137 (225) (47) Smurfs Hybrid (FY12) July 29, 2011 14,415 17,676 29,205 (11,529) 16,228 18,390 (2,162) 2,300 Arthur Christmas (FY12) November 23, 2011 (41,647) 36,198 41,272 (5,074) 29,964 18,768 11,196 9,581 Pirates (FY12) March 30, 2012 (56,830) 44,873 24,139 20,734 6,988 8,956 (1,968) 11,291 DTV Easter 2012 (FY13) April 3, 2012 - - 6,557 (6,557) - 667 (667) - TBD Hybrid (FY13) August 2012 - - (7,138) 7,138 - 29,013 (29,013) - DTV Easter 2013 (FY13) March 26, 2013 - - 2,267 (2,267) - 2,904 (2,904) - Hotel Transylvania (FY13) September 21, 2012 (5,160) (6,180) 26 (6,206) 30,890 27,095 3,795 15,901 Smurfs 2 (FY14) August 2013 - (7,014) (8,000) 986 (4,537) (1,579) (2,958) 33,523
Cloudy 2 (FY14) September 2013 - (2,500) (6,000) 3,500 (7,931) (2,300) (5,631) 39,533 TBD Hybrid (FY15) August 2014 - - - - (4,000) - (4,000) 2,013 TBD Animated (FY15) September 2014 - - - - (5,000) - (5,000) 12,887 Development Reserve (8,417) (9,700) (9,700) - (9,700) (9,700) - (9,700) Film Reserve - - - - - - - (15,000) Non-Title marketing CHALLENGE - - - - - - - - Non-Title IHE - - - - - - - - Overhead (3,777) (2,587) (2,458) (129) (2,615) (2,578) (37) (2,674) Other marketing - (504) - (504) (157) - (157) (11,980) Earnings Before Interest & Taxes (91,700)$ 73,000$ 73,000$ -$ 51,200$ 91,200$ (40,000)$ 88,800$
FY12 FY13 FY14

31
SMURFS( PG Rating, Winchester Financing, 7/29/11 Release Date)
2Q FCST CURRENT FY12 BUD GP BREAK
RETENTION RATE 53% 53% 53% 53%
DOMESTIC BOX OFFICE $140,000 $140,000 $125,000 $99,900
INTERNATIONAL BOX OFFICE 325,000 360,000 189,000 155,000
WORLDWIDE BOX OFFICE 465,000 500,000 314,000 254,900
INTERNATIONAL PRINTS 9,440 9,690 8,400 8,040
DVD UNITS 7,800 7,800 6,670 5,080
DOMESTIC RENTALS 74,200 74,200 66,250 52,950
TOTAL DOMESTIC ADVERTISING (54,500) (54,500) (54,500) (54,500)
DOMESTIC PRINTS (6,280) (6,280) (8,180) (6,280)
OTHER COSTS (6,590) (6,590) (6,630) (4,840)
DOMESTIC THEATRICAL NET 6,830 6,830 (3,060) (12,670)
INT'L RENTALS 123,000 140,000 79,620 64,970
INT'L ADVERTISING (43,200) (43,200) (41,200) (37,870)
INT'L PRINTS (17,000) (16,000) (16,000) (14,880)
OTHER COSTS (8,680) (6,750) (7,610) (5,580)
INT'L THEATRICAL NET 54,120 74,050 14,810 6,640
DOM. HOME VIDEO REVENUE 96,450 96,450 85,860 65,630
DOMESTIC PAY-PER-VIEW / VOD 5,480 5,480 3,300 4,930
DOM. HOME VIDEO COSTS (34,830) (34,830) (28,110) (23,400)
DOMESTIC HOME VIDEO NET 67,100 67,100 61,050 47,160
INT'L HOME VIDEO REVENUE 46,850 46,840 51,750 42,970
INTERNATIONAL PAY-PER-VIEW/VOD 2,400 2,400 2,400
INT'L HOME VIDEO COSTS (17,450) (17,440) (18,950) (15,990)
INT'L HOME VIDEO NET 31,800 31,800 32,800 29,380
DOMESTIC PAY TELEVISION 17,650 17,650 17,650 17,120
DOMESTIC FREE TELEVISION 6,710 6,710 6,590 6,030
INTERNATIONAL TELEVISION 50,840 54,100 60,410 47,860
TV COSTS (500) (500) (500) (500)
TOTAL TELEVISION NET 74,700 77,960 84,150 70,510
AIRLINE / NON-THEATRICAL 2,840 2,840 2,330 2,020
MERCH, MUSIC & OTHER REVENUE 5,250 5,250 4,500 3,500
NON THEATRICAL COSTS (1,720) (1,720) (178) (178)
CONSUMER PRODUCTS COSTS (1,040) (1,040) (1,842) (1,842)
PRODUCTION COST (123,860) (123,860) (123,860) (123,860)
CO-FINANCING PROCEEDS 30,970 30,970 30,970 30,970
CAPITALIZED OH (9,790) (9,790) (9,790) (9,790)
RESIDUALS (10,700) (10,990) (10,980) (9,430)
CREATIVE SHARES (29,990) (37,810) (11,410) (7,960)
CO-FINANCIER OVERAGES (39,580) (42,890) (33,730) (24,450)
TOTAL REVENUES 431,670 451,920 378,260 310,380
RELEASING COSTS (191,790) (188,850) (183,700) (165,860)
PROD, O/H, PART, RESIDUALS (182,950) (194,370) (158,800) (144,520)
GROSS PROFIT (LOSS) $56,930 $68,700 $35,760 $0
GROSS PROFIT MARGIN 13.2% 15.2% 9.5% 0.0%
FY 2012 GROSS PROFIT (LOSS) 14,415 24,930 (15,927) (37,825)

32
ARTHUR CHRISTMAS (3D)(WW Rights, PG Rating, 11/23/11 rel. date)
Q1 FCST FY12 BUD GP BREAK
RETENTION RATE 52% 52% 52% 52% 52% 52% 52% 52% 52% 52% 52% 52% 52% 52%
DOMESTIC BOX OFFICE $125,000 $95,000 $100,000 $115,000 $120,000 $125,000 $130,000 $140,000 $155,000 $175,000 $275,000 $300,000 $125,000 $99,200
INTERNATIONAL BOX OFFICE 162,000 123,000 130,000 149,000 155,000 162,000 168,000 181,000 201,000 227,000 356,000 389,000 162,000 129,000
WORLDWIDE BOX OFFICE 287,000 218,000 230,000 264,000 275,000 287,000 298,000 321,000 356,000 402,000 631,000 689,000 287,000 228,200
INTERNATIONAL PRINTS 7,500 7,000 7,090 7,330 7,420 7,500 7,560 7,760 7,920 8,170 9,160 9,340 7,500 7,090
DVD UNITS 8,270 5,310 5,540 6,280 6,500 6,660 6,810 7,140 7,630 8,240 10,290 10,720 8,180 5,480
DOMESTIC RENTALS 65,000 49,400 52,000 59,800 62,400 65,000 67,600 72,800 80,600 91,000 143,000 156,000 65,000 51,580
TOTAL DOMESTIC ADVERTISING (61,300) (59,300) (59,430) (60,550) (60,930) (61,300) (62,130) (63,780) (66,250) (69,550) (71,300) (71,300) (54,000) (59,370)
DOMESTIC PRINTS (7,070) (6,910) (6,910) (6,910) (6,910) (6,910) (6,910) (6,910) (6,910) (6,910) (6,910) (6,910) (7,070) (6,910)
OTHER COSTS (6,940) (4,980) (5,210) (5,910) (6,150) (6,380) (6,610) (7,080) (7,770) (8,710) (13,370) (14,530) (7,260) (5,180)
DOMESTIC THEATRICAL NET (10,310) (21,790) (19,550) (13,570) (11,590) (9,590) (8,050) (4,970) (330) 5,830 51,420 63,260 (3,330) (19,880)
INT'L RENTALS 68,000 51,700 54,400 62,600 65,300 68,000 70,700 76,200 84,300 95,200 149,600 163,200 68,000 54,000
INT'L ADVERTISING (30,600) (27,500) (28,080) (29,550) (30,080) (30,600) (30,930) (31,900) (33,110) (34,610) (39,140) (39,900) (30,600) (28,080)
INT'L PRINTS (12,750) (12,110) (12,220) (12,530) (12,640) (12,750) (12,820) (13,080) (13,290) (13,610) (14,880) (15,110) (12,750) (12,220)
OTHER COSTS (7,910) (6,030) (6,320) (7,160) (7,430) (7,720) (7,990) (8,560) (9,410) (10,530) (16,120) (17,530) (7,910) (6,270)
INT'L THEATRICAL NET 16,740 6,060 7,780 13,360 15,150 16,930 18,960 22,660 28,490 36,450 79,460 90,660 16,740 7,430
DOM. HOME VIDEO REVENUE 82,680 67,270 70,000 78,870 81,280 83,150 84,980 88,910 94,710 101,990 126,040 131,050 81,750 68,870
DOMESTIC PAY-PER-VIEW/VOD 3,300 3,030 3,080 3,220 3,260 3,300 3,340 3,410 3,510 3,630 4,080 4,160 3,300 3,070
DOM. HOME VIDEO COSTS (27,090) (21,770) (22,700) (25,780) (26,620) (27,240) (27,840) (29,130) (31,030) (33,420) (41,300) (42,950) (26,780) (22,470)
DOMESTIC HOME VIDEO NET 58,890 48,530 50,380 56,310 57,920 59,210 60,480 63,190 67,190 72,200 88,820 92,260 58,270 49,470
INT'L HOME VIDEO REVENUE 48,830 37,370 38,690 43,250 44,540 45,830 47,760 50,320 54,790 60,510 89,170 95,510 48,830 38,690
INT'L PAY-PER-VIEW/VOD 2,780 2,860 3,050 3,130 3,200 3,250 3,440 3,640 3,910 4,120 4,120 2,860
INT'L HOME VIDEO COSTS (17,790) (13,590) (14,080) (15,750) (16,220) (16,700) (17,410) (18,350) (20,010) (22,130) (32,810) (35,180) (17,790) (14,080)
INT'L HOME VIDEO NET 31,040 26,560 27,470 30,550 31,450 32,330 33,600 35,410 38,420 42,290 60,480 64,450 31,040 27,470
DOMESTIC PAY TELEVISION 17,650 14,340 14,810 15,440 15,440 15,440 15,440 15,440 15,440 15,440 15,440 15,440 17,650 14,730
DOMESTIC FREE TELEVISION 6,570 5,900 6,030 6,450 6,520 6,570 6,610 6,710 6,940 7,300 8,640 8,640 6,540 5,990
INTERNATIONAL TELEVISION 42,460 31,320 36,070 37,660 39,010 39,370 39,370 39,370 44,600 45,660 55,440 59,260 41,630 35,410
TV COSTS (500) (500) (500) (500) (500) (500) (500) (500) (500) (500) (500) (500) (500) (500)
TOTAL TELEVISION NET 66,180 51,060 56,410 59,050 60,470 60,880 60,920 61,020 66,480 67,900 79,020 82,840 65,320 55,630
AIRLINE / NON-THEATRICAL 2,330 1,920 2,030 2,330 2,430 2,530 2,640 2,840 3,140 3,540 4,260 4,330 2,330 2,010
MERCH, MUSIC & OTHER REVENUE 2,400 1,900 1,900 1,900 1,900 1,900 1,900 1,900 1,900 1,900 1,900 1,900 2,400 1,900
NON THEATRICAL COSTS (10) 0 0 0 0 0 0 0 0 0 0 0 (10) 0
CONSUMER PRODUCTS COSTS (500) 0 0 0 0 0 0 0 0 0 0 0 (500) 0
PRODUCTION COST (99,000) (99,000) (99,000) (99,000) (99,000) (99,000) (99,000) (99,000) (99,000) (99,000) (99,000) (99,000) (99,000) (99,000)
CAPITALIZED OH (12,180) (12,180) (12,180) (12,180) (12,180) (12,180) (12,180) (12,180) (12,180) (12,180) (12,180) (12,180) (12,180) (12,180)
RESIDUALS (3,930) (3,190) (3,430) (3,680) (3,770) (3,830) (3,870) (3,960) (4,270) (4,480) (5,470) (5,740) (3,890) (3,390)
CREATIVE SHARES (13,330) (8,830) (10,060) (11,470) (11,960) (13,130) (13,540) (14,340) (16,790) (19,480) (40,860) (49,180) (13,270) (9,460)
TOTAL REVENUES $339,220 $266,930 $281,870 $314,570 $325,210 $334,290 $343,590 $361,340 $393,570 $430,080 $601,690 $643,610 $337,430 $279,110
RELEASING COSTS (172,460) (152,690) (155,450) (164,640) (167,480) (170,100) (173,140) (179,290) (188,280) (199,970) (236,330) (243,910) (165,170) (155,080)
PROD, O/H, PART, RESIDUALS (128,440) (123,200) (124,670) (126,330) (126,910) (128,140) (128,590) (129,480) (132,240) (135,140) (157,510) (166,100) (128,340) (124,030)
GROSS PROFIT (LOSS) $38,320 ($8,960) $1,750 $23,600 $30,820 $36,050 $41,860 $52,570 $73,050 $94,970 $207,850 $233,600 $43,920 $0
GROSS PROFIT MARGIN 11.3% NA 0.6% 7.5% 9.5% 10.8% 12.2% 14.5% 18.6% 22.1% 34.5% 36.3% 11.3% 0.0%
33
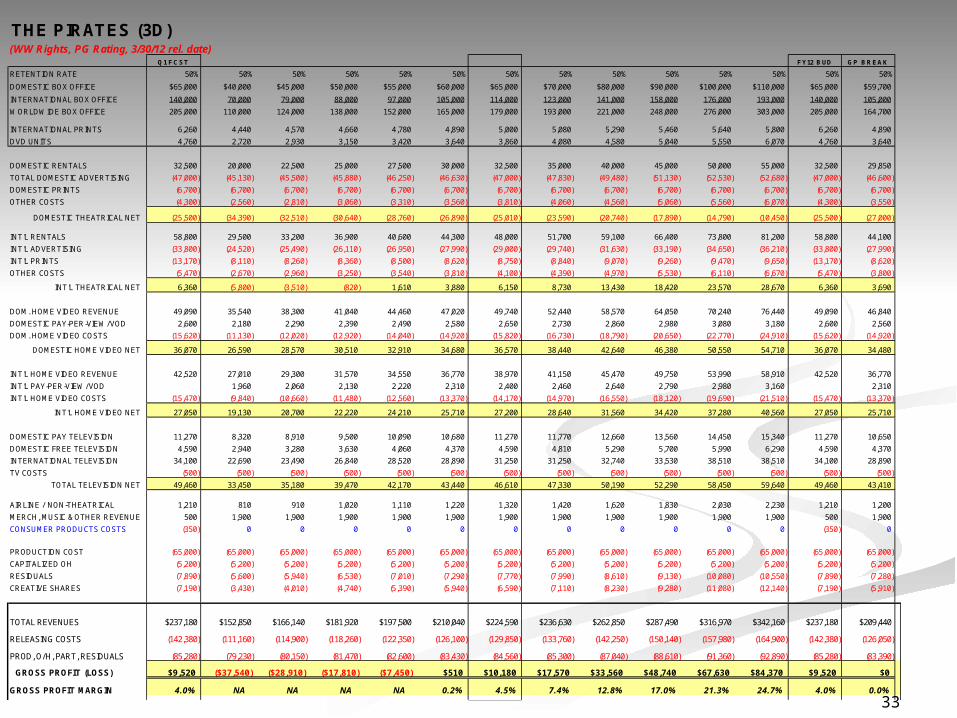
THE PIRATES (3D)(WW Rights, PG Rating, 3/30/12 rel. date)
Q1 FCST FY12 BUD GP BREAK
RETENTION RATE 50% 50% 50% 50% 50% 50% 50% 50% 50% 50% 50% 50% 50% 50%
DOMESTIC BOX OFFICE $65,000 $40,000 $45,000 $50,000 $55,000 $60,000 $65,000 $70,000 $80,000 $90,000 $100,000 $110,000 $65,000 $59,700
INTERNATIONAL BOX OFFICE 140,000 70,000 79,000 88,000 97,000 105,000 114,000 123,000 141,000 158,000 176,000 193,000 140,000 105,000
WORLDWIDE BOX OFFICE 205,000 110,000 124,000 138,000 152,000 165,000 179,000 193,000 221,000 248,000 276,000 303,000 205,000 164,700
INTERNATIONAL PRINTS 6,260 4,440 4,570 4,660 4,780 4,890 5,000 5,080 5,290 5,460 5,640 5,800 6,260 4,890
DVD UNITS 4,760 2,720 2,930 3,150 3,420 3,640 3,860 4,080 4,580 5,040 5,550 6,070 4,760 3,640
DOMESTIC RENTALS 32,500 20,000 22,500 25,000 27,500 30,000 32,500 35,000 40,000 45,000 50,000 55,000 32,500 29,850
TOTAL DOMESTIC ADVERTISING (47,000) (45,130) (45,500) (45,880) (46,250) (46,630) (47,000) (47,830) (49,480) (51,130) (52,530) (52,680) (47,000) (46,600)
DOMESTIC PRINTS (6,700) (6,700) (6,700) (6,700) (6,700) (6,700) (6,700) (6,700) (6,700) (6,700) (6,700) (6,700) (6,700) (6,700)
OTHER COSTS (4,300) (2,560) (2,810) (3,060) (3,310) (3,560) (3,810) (4,060) (4,560) (5,060) (5,560) (6,070) (4,300) (3,550)
DOMESTIC THEATRICAL NET (25,500) (34,390) (32,510) (30,640) (28,760) (26,890) (25,010) (23,590) (20,740) (17,890) (14,790) (10,450) (25,500) (27,000)
INT'L RENTALS 58,800 29,500 33,200 36,900 40,600 44,300 48,000 51,700 59,100 66,400 73,800 81,200 58,800 44,100
INT'L ADVERTISING (33,800) (24,520) (25,490) (26,110) (26,950) (27,990) (29,000) (29,740) (31,630) (33,190) (34,650) (36,210) (33,800) (27,990)
INT'L PRINTS (13,170) (8,110) (8,260) (8,360) (8,500) (8,620) (8,750) (8,840) (9,070) (9,260) (9,470) (9,650) (13,170) (8,620)
OTHER COSTS (5,470) (2,670) (2,960) (3,250) (3,540) (3,810) (4,100) (4,390) (4,970) (5,530) (6,110) (6,670) (5,470) (3,800)
INT'L THEATRICAL NET 6,360 (5,800) (3,510) (820) 1,610 3,880 6,150 8,730 13,430 18,420 23,570 28,670 6,360 3,690
DOM. HOME VIDEO REVENUE 49,090 35,540 38,300 41,040 44,460 47,020 49,740 52,440 58,570 64,050 70,240 76,440 49,090 46,840
DOMESTIC PAY-PER-VIEW/VOD 2,600 2,180 2,290 2,390 2,490 2,580 2,650 2,730 2,860 2,980 3,080 3,180 2,600 2,560
DOM. HOME VIDEO COSTS (15,620) (11,130) (12,020) (12,920) (14,040) (14,920) (15,820) (16,730) (18,790) (20,650) (22,770) (24,910) (15,620) (14,920)
DOMESTIC HOME VIDEO NET 36,070 26,590 28,570 30,510 32,910 34,680 36,570 38,440 42,640 46,380 50,550 54,710 36,070 34,480
INT'L HOME VIDEO REVENUE 42,520 27,010 29,300 31,570 34,550 36,770 38,970 41,150 45,470 49,750 53,990 58,910 42,520 36,770
INT'L PAY-PER-VIEW/VOD 1,960 2,060 2,130 2,220 2,310 2,400 2,460 2,640 2,790 2,980 3,160 2,310
INT'L HOME VIDEO COSTS (15,470) (9,840) (10,660) (11,480) (12,560) (13,370) (14,170) (14,970) (16,550) (18,120) (19,690) (21,510) (15,470) (13,370)
INT'L HOME VIDEO NET 27,050 19,130 20,700 22,220 24,210 25,710 27,200 28,640 31,560 34,420 37,280 40,560 27,050 25,710
DOMESTIC PAY TELEVISION 11,270 8,320 8,910 9,500 10,090 10,680 11,270 11,770 12,660 13,560 14,450 15,340 11,270 10,650
DOMESTIC FREE TELEVISION 4,590 2,940 3,280 3,630 4,060 4,370 4,590 4,810 5,290 5,700 5,990 6,290 4,590 4,370
INTERNATIONAL TELEVISION 34,100 22,690 23,490 26,840 28,520 28,890 31,250 31,250 32,740 33,530 38,510 38,510 34,100 28,890
TV COSTS (500) (500) (500) (500) (500) (500) (500) (500) (500) (500) (500) (500) (500) (500)
TOTAL TELEVISION NET 49,460 33,450 35,180 39,470 42,170 43,440 46,610 47,330 50,190 52,290 58,450 59,640 49,460 43,410
AIRLINE / NON-THEATRICAL 1,210 810 910 1,020 1,110 1,220 1,320 1,420 1,620 1,830 2,030 2,230 1,210 1,200
MERCH, MUSIC & OTHER REVENUE 500 1,900 1,900 1,900 1,900 1,900 1,900 1,900 1,900 1,900 1,900 1,900 500 1,900
CONSUMER PRODUCTS COSTS (350) 0 0 0 0 0 0 0 0 0 0 0 (350) 0
PRODUCTION COST (65,000) (65,000) (65,000) (65,000) (65,000) (65,000) (65,000) (65,000) (65,000) (65,000) (65,000) (65,000) (65,000) (65,000)
CAPITALIZED OH (5,200) (5,200) (5,200) (5,200) (5,200) (5,200) (5,200) (5,200) (5,200) (5,200) (5,200) (5,200) (5,200) (5,200)
RESIDUALS (7,890) (5,600) (5,940) (6,530) (7,010) (7,290) (7,770) (7,990) (8,610) (9,130) (10,080) (10,550) (7,890) (7,280)
CREATIVE SHARES (7,190) (3,430) (4,010) (4,740) (5,390) (5,940) (6,590) (7,110) (8,230) (9,280) (11,080) (12,140) (7,190) (5,910)
TOTAL REVENUES $237,180 $152,850 $166,140 $181,920 $197,500 $210,040 $224,590 $236,630 $262,850 $287,490 $316,970 $342,160 $237,180 $209,440
RELEASING COSTS (142,380) (111,160) (114,900) (118,260) (122,350) (126,100) (129,850) (133,760) (142,250) (150,140) (157,980) (164,900) (142,380) (126,050)
PROD, O/H, PART, RESIDUALS (85,280) (79,230) (80,150) (81,470) (82,600) (83,430) (84,560) (85,300) (87,040) (88,610) (91,360) (92,890) (85,280) (83,390)
GROSS PROFIT (LOSS) $9,520 ($37,540) ($28,910) ($17,810) ($7,450) $510 $10,180 $17,570 $33,560 $48,740 $67,630 $84,370 $9,520 $0
GROSS PROFIT MARGIN 4.0% NA NA NA NA 0.2% 4.5% 7.4% 12.8% 17.0% 21.3% 24.7% 4.0% 0.0%

34
HOTEL TRANSYLVANIA(WW Rights, PG Rating, Q3 2013 rel. date)
GP BREAK
RETENTION RATE 50% 50% 50% 50% 50% 50% 50% 50% 50% 50% 50%
DOMESTIC BOX OFFICE $60,000 $70,000 $80,000 $90,000 $100,000 $110,000 $120,000 $130,000 $140,000 $150,000 $94,600
INTERNATIONAL BOX OFFICE 60,000 70,000 80,000 90,000 100,000 110,000 120,000 130,000 140,000 150,000 95,000
WORLDWIDE BOX OFFICE 120,000 140,000 160,000 180,000 200,000 220,000 240,000 260,000 280,000 300,000 189,600
INTERNATIONAL PRINTS 6,250 6,430 6,610 6,780 6,990 7,150 7,300 7,450 7,600 7,740 6,860
DVD UNITS 4,080 4,580 5,150 5,660 6,230 6,820 7,310 7,710 8,040 8,420 5,910
DOMESTIC RENTALS 30,000 35,000 40,000 45,000 50,000 55,000 60,000 65,000 70,000 75,000 47,300
TOTAL DOMESTIC ADVERTISING (45,000) (45,000) (45,000) (45,000) (45,500) (46,250) (47,000) (48,650) (50,300) (51,950) (45,100)
DOMESTIC PRINTS (6,400) (6,400) (6,400) (6,400) (6,400) (6,400) (6,400) (6,400) (6,400) (6,400) (6,400)
OTHER COSTS (3,390) (3,860) (4,330) (4,810) (5,280) (5,750) (6,220) (6,700) (7,170) (7,640) (5,020)
DOMESTIC THEATRICAL NET (24,790) (20,260) (15,730) (11,210) (7,180) (3,400) 380 3,250 6,130 9,010 (9,220)
INT'L RENTALS 25,200 29,400 33,600 37,800 42,000 46,200 50,400 54,600 58,700 62,900 39,700
INT'L ADVERTISING (23,560) (24,600) (25,560) (26,440) (27,510) (28,520) (29,500) (30,450) (31,370) (32,270) (26,860)
INT'L PRINTS (12,440) (12,710) (12,970) (13,230) (13,540) (13,780) (14,000) (14,220) (14,450) (14,650) (13,350)
OTHER COSTS (3,670) (4,150) (4,630) (5,110) (5,600) (6,080) (6,560) (7,040) (7,520) (8,000) (5,340)
INT'L THEATRICAL NET (14,470) (12,060) (9,560) (6,980) (4,650) (2,180) 340 2,890 5,360 7,980 (5,850)
DOM. HOME VIDEO REVENUE 52,800 58,890 65,760 71,920 78,870 85,840 91,390 96,180 100,180 104,640 76,610
DOMESTIC PAY-PER-VIEW/VOD 3,900 4,140 4,360 4,540 4,710 4,880 5,000 5,140 5,250 5,370 4,620
DOM. HOME VIDEO COSTS (16,760) (18,780) (21,090) (23,180) (25,560) (27,970) (29,940) (31,510) (32,820) (34,280) (24,230)
DOMESTIC HOME VIDEO NET 39,940 44,250 49,030 53,280 58,020 62,750 66,450 69,810 72,610 75,730 57,000
INT'L HOME VIDEO REVENUE 24,480 26,840 29,970 32,310 35,400 37,720 40,790 43,080 46,130 48,420 33,860
INT'L PAY-PER-VIEW/VOD 1,840 1,940 2,030 2,130 2,240 2,320 2,400 2,480 2,560 2,600 2,170
INT'L HOME VIDEO COSTS (8,880) (9,780) (10,970) (11,860) (13,030) (13,920) (15,090) (15,960) (17,130) (18,000) (12,440)
INT'L HOME VIDEO NET 17,440 19,000 21,030 22,580 24,610 26,120 28,100 29,600 31,560 33,020 23,590
DOMESTIC PAY TELEVISION 10,680 11,770 12,660 13,560 14,450 15,340 15,440 15,440 15,440 15,440 13,970
DOMESTIC FREE TELEVISION 4,370 4,810 5,290 5,700 5,990 6,290 6,500 6,600 6,690 6,810 5,830
INTERNATIONAL TELEVISION 24,130 24,930 27,690 29,160 34,170 34,520 37,010 38,640 39,410 43,350 29,540
TV COSTS (500) (500) (500) (500) (500) (500) (500) (500) (500) (500) (500)
TOTAL TELEVISION NET 38,680 41,010 45,140 47,920 54,110 55,650 58,450 60,180 61,040 65,100 48,840
AIRLINE / NON-THEATRICAL 1,220 1,420 1,620 1,830 2,030 2,230 2,430 2,640 2,840 3,040 1,920
MERCH, MUSIC & OTHER REVENUE 3,500 3,500 3,500 3,500 3,500 3,500 3,500 3,500 3,500 3,500 3,500
PRODUCTION COST (104,000) (104,000) (104,000) (104,000) (104,000) (104,000) (104,000) (104,000) (104,000) (104,000) (104,000)
CAPITALIZED OH (12,580) (12,580) (12,580) (12,580) (12,580) (12,580) (12,580) (12,580) (12,580) (12,580) (12,580)
RESIDUALS (2,440) (2,630) (2,900) (3,100) (3,440) (3,610) (3,810) (3,950) (4,070) (4,290) (3,200)
CREATIVE SHARES 0 0 0 0 0 0 0 (680) (680) (2,160) 0
TOTAL REVENUES $182,120 $202,640 $226,480 $247,450 $273,360 $293,840 $314,860 $333,300 $350,700 $371,070 $259,020
RELEASING COSTS (120,600) (125,780) (131,450) (136,530) (142,920) (149,170) (155,210) (161,430) (167,660) (173,690) (139,240)
PROD, O/H, PART, RESIDUALS (119,020) (119,210) (119,480) (119,680) (120,020) (120,190) (120,390) (121,210) (121,330) (123,030) (119,780)
GROSS PROFIT (LOSS) ($57,500) ($42,350) ($24,450) ($8,760) $10,420 $24,480 $39,260 $50,660 $61,710 $74,350 $0
GROSS PROFIT MARGIN NA NA NA NA 3.8% 8.3% 12.5% 15.2% 17.6% 20.0% 0.0%

35
SMURFS 2 (3D)(WW Rights, PG Rating, Q3 2013 rel. date)
GP BREAK
RETENTION RATE 53% 53% 53% 53% 53% 53% 53% 53% 53% 53% 53%
DOMESTIC BOX OFFICE $90,000 $100,000 $110,000 $120,000 $125,000 $130,000 $140,000 $150,000 $160,000 $175,000 $102,200
INTERNATIONAL BOX OFFICE 234,000 260,000 286,000 312,000 325,000 338,000 364,000 390,000 416,000 455,000 266,000
WORLDWIDE BOX OFFICE 324,000 360,000 396,000 432,000 450,000 468,000 504,000 540,000 576,000 630,000 368,200
INTERNATIONAL PRINTS 10,530 10,810 11,080 11,250 11,330 11,420 11,560 11,710 11,870 11,920 10,860
DOMESTIC RENTALS 47,700 53,000 58,300 63,600 66,250 68,900 74,200 79,500 84,800 92,750 54,170
TOTAL DOMESTIC ADVERTISING (52,500) (52,630) (53,380) (54,130) (54,500) (55,330) (56,980) (58,630) (58,780) (59,000) (52,790)
DOMESTIC PRINTS (6,090) (6,090) (6,090) (6,090) (6,090) (6,090) (6,090) (6,090) (6,090) (6,090) (6,090)
OTHER COSTS (4,770) (5,240) (5,720) (6,180) (6,410) (6,650) (7,110) (7,590) (8,060) (8,760) (5,340)
DOMESTIC THEATRICAL NET (15,660) (10,960) (6,890) (2,800) (750) 830 4,020 7,190 11,870 18,900 (10,050)
INT'L RENTALS 98,300 109,200 120,100 131,000 136,500 142,000 152,900 163,800 174,700 191,100 111,600
INT'L ADVERTISING (57,470) (59,400) (61,270) (62,970) (63,750) (64,530) (66,090) (67,130) (67,630) (68,630) (59,740)
INT'L PRINTS (21,840) (22,280) (22,690) (22,950) (23,080) (23,210) (23,430) (23,660) (23,910) (23,980) (22,350)
OTHER COSTS (7,440) (8,220) (9,000) (9,770) (10,160) (10,550) (11,330) (12,100) (12,870) (14,030) (8,400)
INT'L THEATRICAL NET 11,550 19,300 27,140 35,310 39,510 43,710 52,050 60,910 70,290 84,460 21,110
DOM. HOME VIDEO REVENUE 46,630 51,450 57,900 63,320 65,720 68,090 73,440 78,800 83,550 90,940 51,840
DOMESTIC PAY-PER-VIEW/VOD 5,810 6,010 6,210 6,390 6,470 6,540 6,700 6,840 6,960 7,150 6,050
DOM. HOME VIDEO COSTS (12,950) (14,320) (16,020) (17,560) (18,240) (18,920) (20,450) (21,980) (23,340) (25,600) (14,660)
DOMESTIC HOME VIDEO NET 39,490 43,140 48,090 52,150 53,950 55,710 59,690 63,660 67,170 72,490 43,230
INT'L HOME VIDEO REVENUE 47,650 47,650 47,650 47,650 47,650 47,650 47,650 47,650 47,650 47,650 47,650
INT'L PAY-PER-VIEW/VOD 2,930 2,930 2,930 2,930 2,930 2,930 2,930 2,930 2,930 2,930 2,930
INT'L HOME VIDEO COSTS (17,200) (17,200) (17,200) (17,200) (17,200) (17,200) (17,200) (17,200) (17,200) (17,200) (17,200)
INT'L HOME VIDEO NET 33,380 33,380 33,380 33,380 33,380 33,380 33,380 33,380 33,380 33,380 33,380
DOMESTIC PAY TELEVISION 10,430 11,130 11,470 11,470 11,470 11,470 11,470 11,470 11,470 11,470 11,290
DOMESTIC FREE TELEVISION 5,770 6,030 6,320 6,520 6,570 6,610 6,710 6,860 7,030 7,300 6,090
INTERNATIONAL TELEVISION 35,070 41,570 43,260 43,760 45,500 47,400 48,900 52,400 55,500 60,760 42,330
TV COSTS (760) (820) (870) (930) (960) (980) (1,040) (1,100) (1,150) (1,240) (830)
TOTAL TELEVISION NET 50,510 57,910 60,180 60,820 62,580 64,500 66,040 69,630 72,850 78,290 58,880
AIRLINE / NON-THEATRICAL 1,710 1,900 2,090 2,280 2,380 2,470 2,660 2,850 3,040 3,330 1,940
MERCH, MUSIC & OTHER REVENUE 3,500 3,500 3,500 3,500 3,500 3,500 3,500 3,500 3,500 3,500 3,500
PRODUCTION COST (122,000) (122,000) (122,000) (122,000) (122,000) (122,000) (122,000) (122,000) (122,000) (122,000) (122,000)
CAPITALIZED OH (12,200) (12,200) (12,200) (12,200) (12,200) (12,200) (12,200) (12,200) (12,200) (12,200) (12,200)
RESIDUALS (7,500) (8,280) (8,660) (8,870) (9,090) (9,320) (9,600) (10,060) (10,470) (11,150) (8,380)
CREATIVE SHARES (8,390) (9,540) (11,160) (12,930) (14,450) (16,260) (23,820) (33,320) (41,090) (51,260) (9,410)
TOTAL REVENUES $305,500 $334,370 $359,730 $382,420 $394,940 $407,560 $431,060 $456,600 $481,130 $518,880 $339,390
RELEASING COSTS (181,020) (186,200) (192,240) (197,780) (200,390) (203,460) (209,720) (215,480) (219,030) (224,530) (187,400)
PROD, O/H, PART, RESIDUALS (150,090) (152,020) (154,020) (156,000) (157,740) (159,780) (167,620) (177,580) (185,760) (196,610) (151,990)
GROSS PROFIT (LOSS) ($25,610) ($3,850) $13,470 $28,640 $36,810 $44,320 $53,720 $63,540 $76,340 $97,740 $0
GROSS PROFIT MARGIN NA NA 3.7% 7.5% 9.3% 10.9% 12.5% 13.9% 15.9% 18.8% 0.0%

36
CLOUDY WITH A CHANCE FOR MEATBALLS 2 (3D)(WW Rights, PG Rating, Sept 2013 rel. date)
GP BREAK
RETENTION RATE 52% 52% 52% 52% 52% 52% 52% 52% 52% 52% 52%
DOMESTIC BOX OFFICE $70,000 $80,000 $90,000 $100,000 $110,000 $120,000 $125,000 $130,000 $140,000 $150,000 $71,300
INTERNATIONAL BOX OFFICE 123,000 140,000 158,000 175,000 193,000 210,000 219,000 228,000 245,000 263,000 125,000
WORLDWIDE BOX OFFICE 193,000 220,000 248,000 275,000 303,000 330,000 344,000 358,000 385,000 413,000 196,300
INTERNATIONAL PRINTS 7,850 8,070 8,300 8,520 8,690 8,870 8,940 9,030 9,200 9,400 7,880
DOMESTIC RENTALS 36,400 41,600 46,800 52,000 57,200 62,400 65,000 67,600 72,800 78,000 37,080
TOTAL DOMESTIC ADVERTISING (45,000) (45,000) (45,000) (45,130) (45,880) (46,630) (47,000) (47,830) (49,480) (51,130) (45,000)
DOMESTIC PRINTS (5,670) (5,670) (5,670) (5,670) (5,670) (5,670) (5,670) (5,670) (5,670) (5,670) (5,670)
OTHER COSTS (4,030) (4,530) (5,030) (5,530) (6,020) (6,530) (6,770) (7,020) (7,520) (8,010) (4,100)
DOMESTIC THEATRICAL NET (18,300) (13,600) (8,900) (4,330) (370) 3,570 5,560 7,080 10,130 13,190 (17,690)
INT'L RENTALS 51,500 58,800 66,200 73,500 80,900 88,200 91,900 95,600 102,900 110,300 52,400
INT'L ADVERTISING (39,170) (40,810) (42,550) (43,980) (45,310) (47,190) (47,890) (48,830) (50,280) (51,640) (39,410)
INT'L PRINTS (17,150) (17,470) (17,810) (18,130) (18,380) (18,640) (18,740) (18,880) (19,120) (19,420) (17,190)
OTHER COSTS (4,010) (4,520) (5,040) (5,550) (6,070) (6,580) (6,840) (7,100) (7,610) (8,130) (4,070)
INT'L THEATRICAL NET (8,830) (4,000) 800 5,840 11,140 15,790 18,430 20,790 25,890 31,110 (8,270)
DOM. HOME VIDEO REVENUE 48,460 53,290 58,720 63,530 69,990 74,820 77,800 80,190 85,540 90,300 48,610
DOMESTIC PAY-PER-VIEW/VOD 5,590 5,860 6,100 6,310 6,510 6,680 6,760 6,840 6,990 7,130 5,620
DOM. HOME VIDEO COSTS (12,490) (13,860) (15,400) (16,770) (18,470) (19,840) (20,690) (21,380) (22,910) (24,270) (12,660)
DOMESTIC HOME VIDEO NET 41,560 45,290 49,420 53,070 58,030 61,660 63,870 65,650 69,620 73,160 41,570
INT'L HOME VIDEO REVENUE 42,720 47,060 51,370 55,650 54,310 57,660 59,480 61,300 64,920 68,530 43,440
INT'L PAY-PER-VIEW/VOD 2,680 2,850 3,040 3,250 3,420 3,610 3,680 3,770 3,970 3,970 2,710
INT'L HOME VIDEO COSTS (16,240) (17,920) (19,590) (21,240) (19,980) (21,240) (21,910) (22,580) (23,920) (25,250) (16,520)
INT'L HOME VIDEO NET 29,160 31,990 34,820 37,660 37,750 40,030 41,250 42,490 44,970 47,250 29,630
DOMESTIC PAY TELEVISION 8,930 9,620 10,310 11,000 11,470 11,470 11,470 11,470 11,470 11,470 9,020
DOMESTIC FREE TELEVISION 4,860 5,290 5,730 5,990 6,290 6,500 6,560 6,600 6,700 6,810 4,910
INTERNATIONAL TELEVISION 34,260 39,400 44,500 50,260 50,760 53,900 54,400 55,900 59,000 64,020 35,500
TV COSTS (650) (700) (760) (820) (870) (930) (960) (980) (1,040) (1,100) (660)
TOTAL TELEVISION NET 47,400 53,610 59,780 66,430 67,650 70,940 71,470 72,990 76,130 81,200 48,770
AIRLINE / NON-THEATRICAL 1,330 1,520 1,710 1,900 2,090 2,280 2,380 2,470 2,660 2,850 1,350
MERCH, MUSIC & OTHER REVENUE 1,200 1,200 1,200 1,200 1,200 1,200 1,200 1,200 1,200 1,200 1,200
PRODUCTION COST (85,000) (85,000) (85,000) (85,000) (85,000) (85,000) (85,000) (85,000) (85,000) (85,000) (85,000)
CAPITALIZED OH (8,500) (8,500) (8,500) (8,500) (8,500) (8,500) (8,500) (8,500) (8,500) (8,500) (8,500)
RESIDUALS (3,000) (3,340) (3,690) (4,040) (4,160) (4,380) (4,460) (4,560) (4,790) (5,070) (3,060)
CREATIVE SHARES 0 0 0 (100) (100) (100) (1,940) (1,940) (1,940) (4,140) 0
TOTAL REVENUES $237,930 $266,490 $295,680 $324,590 $344,140 $368,720 $380,630 $392,940 $418,150 $444,580 $241,840
RELEASING COSTS (144,410) (150,480) (156,850) (162,820) (166,650) (173,250) (176,470) (180,270) (187,550) (194,620) (145,280)
PROD, O/H, PART, RESIDUALS (96,500) (96,840) (97,190) (97,640) (97,760) (97,980) (99,900) (100,000) (100,230) (102,710) (96,560)
GROSS PROFIT (LOSS) ($2,980) $19,170 $41,640 $64,130 $79,730 $97,490 $104,260 $112,670 $130,370 $147,250 $0
GROSS PROFIT MARGIN NA 7.2% 14.1% 19.8% 23.2% 26.4% 27.4% 28.7% 31.2% 33.1% 0.0%

37
TBD HYBRID FY15 (3D)(WW Rights, PG Rating, Jul 2014 rel. date)
GP BREAK
RETENTION RATE 52% 52% 52% 52% 52% 52% 52% 52% 52% 52% 52%
DOMESTIC BOX OFFICE $80,000 $90,000 $100,000 $110,000 $115,000 $120,000 $125,000 $150,000 $175,000 $200,000 $96,300
INTERNATIONAL BOX OFFICE 122,000 137,000 152,000 168,000 175,000 183,000 190,000 229,000 267,000 305,000 147,000
WORLDWIDE BOX OFFICE 202,000 227,000 252,000 278,000 290,000 303,000 315,000 379,000 442,000 505,000 243,300
INTERNATIONAL PRINTS 7,480 7,660 7,870 8,040 8,150 8,240 8,310 8,680 9,070 9,390 7,780
DOMESTIC RENTALS 41,600 46,800 52,000 57,200 59,800 62,400 65,000 78,000 91,000 104,000 50,080
TOTAL DOMESTIC ADVERTISING (52,500) (52,500) (52,630) (53,380) (53,750) (54,130) (54,500) (58,630) (59,000) (59,380) (52,500)
DOMESTIC PRINTS (6,910) (6,910) (6,910) (6,910) (6,910) (6,910) (6,910) (6,910) (6,910) (6,910) (6,910)
OTHER COSTS (3,980) (4,400) (4,820) (5,260) (5,470) (5,680) (5,900) (6,970) (8,040) (9,100) (4,670)
DOMESTIC THEATRICAL NET (21,790) (17,010) (12,360) (8,350) (6,330) (4,320) (2,310) 5,490 17,050 28,610 (14,000)
INT'L RENTALS 51,200 57,600 64,000 70,400 73,600 76,800 80,000 96,000 112,000 128,000 61,600
INT'L ADVERTISING (36,590) (37,990) (39,540) (40,790) (41,390) (41,970) (42,720) (46,480) (49,400) (52,120) (38,890)
INT'L PRINTS (17,150) (17,430) (17,750) (18,020) (18,180) (18,320) (18,430) (19,000) (19,600) (20,090) (17,620)
OTHER COSTS (4,040) (4,490) (4,950) (5,420) (5,640) (5,870) (6,090) (7,240) (8,380) (9,510) (4,790)
INT'L THEATRICAL NET (6,580) (2,310) 1,760 6,170 8,390 10,640 12,760 23,280 34,620 46,280 300
DOM. HOME VIDEO REVENUE 41,210 46,630 51,450 57,900 60,300 63,320 65,720 78,800 90,940 103,810 47,820
DOMESTIC PAY-PER-VIEW/VOD 5,560 5,810 6,010 6,210 6,290 6,390 6,470 6,840 7,150 7,420 5,940
DOM. HOME VIDEO COSTS (11,400) (12,950) (14,320) (16,020) (16,700) (17,560) (18,240) (21,980) (25,600) (29,320) (13,800)
DOMESTIC HOME VIDEO NET 35,370 39,490 43,140 48,090 49,890 52,150 53,950 63,660 72,490 81,910 39,960
INT'L HOME VIDEO REVENUE 40,280 43,620 46,370 46,650 47,650 47,650 47,650 47,650 47,650 47,650 45,280
INT'L PAY-PER-VIEW/VOD 2,730 2,870 2,930 2,930 2,930 2,930 2,930 2,930 2,930 2,930 2,930
INT'L HOME VIDEO COSTS (14,910) (16,120) (17,110) (16,850) (17,200) (17,200) (17,200) (17,200) (17,200) (17,200) (16,710)
INT'L HOME VIDEO NET 28,100 30,370 32,190 32,730 33,380 33,380 33,380 33,380 33,380 33,380 31,500
DOMESTIC PAY TELEVISION 9,620 10,310 11,000 11,470 11,470 11,470 11,470 11,470 11,470 11,470 10,750
DOMESTIC FREE TELEVISION 5,350 5,770 6,030 6,320 6,450 6,520 6,570 6,860 7,300 7,540 5,930
INTERNATIONAL TELEVISION 36,260 39,900 44,900 49,500 50,260 50,260 51,260 59,400 65,520 72,520 44,900
TV COSTS (700) (760) (820) (870) (900) (930) (960) (1,100) (1,240) (1,380) (800)
TOTAL TELEVISION NET 50,530 55,220 61,110 66,420 67,280 67,320 68,340 76,630 83,050 90,150 60,780
AIRLINE / NON-THEATRICAL 1,520 1,710 1,900 2,090 2,190 2,280 2,380 2,850 3,330 3,800 1,830
MERCH, MUSIC & OTHER REVENUE 3,500 3,500 3,500 3,500 3,500 3,500 3,500 3,500 3,500 3,500 3,500
PRODUCTION COST (105,000) (105,000) (105,000) (105,000) (105,000) (105,000) (105,000) (105,000) (105,000) (105,000) (105,000)
CAPITALIZED OH (10,500) (10,500) (10,500) (10,500) (10,500) (10,500) (10,500) (10,500) (10,500) (10,500) (10,500)
RESIDUALS (7,140) (7,800) (8,520) (9,170) (9,340) (9,430) (9,580) (10,670) (11,560) (12,530) (8,370)
CREATIVE SHARES 0 0 0 0 0 0 0 (16,720) (35,980) (55,640) 0
TOTAL REVENUES $238,830 $264,520 $290,090 $314,170 $324,440 $333,520 $342,950 $394,300 $442,790 $492,640 $280,560
RELEASING COSTS (148,180) (153,550) (158,850) (163,520) (166,140) (168,570) (170,950) (185,510) (195,370) (205,010) (156,690)
PROD, O/H, PART, RESIDUALS (122,640) (123,300) (124,020) (124,670) (124,840) (124,930) (125,080) (142,890) (163,040) (183,670) (123,870)
GROSS PROFIT (LOSS) ($31,990) ($12,330) $7,220 $25,980 $33,460 $40,020 $46,920 $65,900 $84,380 $103,960 $0
GROSS PROFIT MARGIN NA NA 2.5% 8.3% 10.3% 12.0% 13.7% 16.7% 19.1% 21.1% 0.0%
38
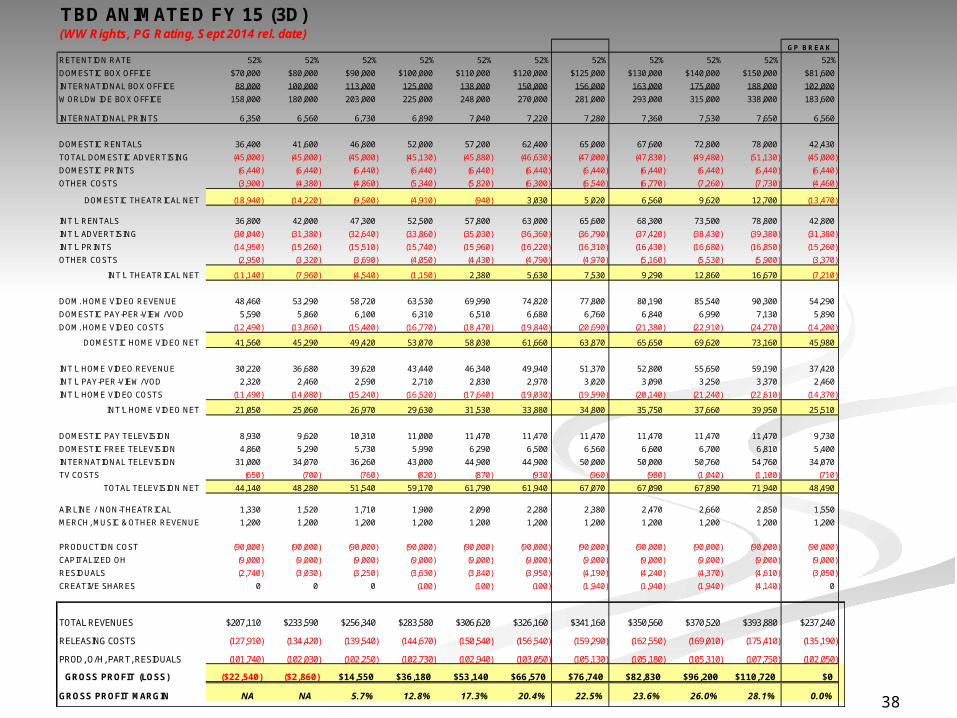
TBD ANIMATED FY 15 (3D)(WW Rights, PG Rating, Sept 2014 rel. date)
GP BREAK
RETENTION RATE 52% 52% 52% 52% 52% 52% 52% 52% 52% 52% 52%
DOMESTIC BOX OFFICE $70,000 $80,000 $90,000 $100,000 $110,000 $120,000 $125,000 $130,000 $140,000 $150,000 $81,600
INTERNATIONAL BOX OFFICE 88,000 100,000 113,000 125,000 138,000 150,000 156,000 163,000 175,000 188,000 102,000
WORLDWIDE BOX OFFICE 158,000 180,000 203,000 225,000 248,000 270,000 281,000 293,000 315,000 338,000 183,600
INTERNATIONAL PRINTS 6,350 6,560 6,730 6,890 7,040 7,220 7,280 7,360 7,530 7,650 6,560
DOMESTIC RENTALS 36,400 41,600 46,800 52,000 57,200 62,400 65,000 67,600 72,800 78,000 42,430
TOTAL DOMESTIC ADVERTISING (45,000) (45,000) (45,000) (45,130) (45,880) (46,630) (47,000) (47,830) (49,480) (51,130) (45,000)
DOMESTIC PRINTS (6,440) (6,440) (6,440) (6,440) (6,440) (6,440) (6,440) (6,440) (6,440) (6,440) (6,440)
OTHER COSTS (3,900) (4,380) (4,860) (5,340) (5,820) (6,300) (6,540) (6,770) (7,260) (7,730) (4,460)
DOMESTIC THEATRICAL NET (18,940) (14,220) (9,500) (4,910) (940) 3,030 5,020 6,560 9,620 12,700 (13,470)
INT'L RENTALS 36,800 42,000 47,300 52,500 57,800 63,000 65,600 68,300 73,500 78,800 42,800
INT'L ADVERTISING (30,040) (31,380) (32,640) (33,860) (35,030) (36,360) (36,790) (37,420) (38,430) (39,380) (31,380)
INT'L PRINTS (14,950) (15,260) (15,510) (15,740) (15,960) (16,220) (16,310) (16,430) (16,680) (16,850) (15,260)
OTHER COSTS (2,950) (3,320) (3,690) (4,050) (4,430) (4,790) (4,970) (5,160) (5,530) (5,900) (3,370)
INT'L THEATRICAL NET (11,140) (7,960) (4,540) (1,150) 2,380 5,630 7,530 9,290 12,860 16,670 (7,210)
DOM. HOME VIDEO REVENUE 48,460 53,290 58,720 63,530 69,990 74,820 77,800 80,190 85,540 90,300 54,290
DOMESTIC PAY-PER-VIEW/VOD 5,590 5,860 6,100 6,310 6,510 6,680 6,760 6,840 6,990 7,130 5,890
DOM. HOME VIDEO COSTS (12,490) (13,860) (15,400) (16,770) (18,470) (19,840) (20,690) (21,380) (22,910) (24,270) (14,200)
DOMESTIC HOME VIDEO NET 41,560 45,290 49,420 53,070 58,030 61,660 63,870 65,650 69,620 73,160 45,980
INT'L HOME VIDEO REVENUE 30,220 36,680 39,620 43,440 46,340 49,940 51,370 52,800 55,650 59,190 37,420
INT'L PAY-PER-VIEW/VOD 2,320 2,460 2,590 2,710 2,830 2,970 3,020 3,090 3,250 3,370 2,460
INT'L HOME VIDEO COSTS (11,490) (14,080) (15,240) (16,520) (17,640) (19,030) (19,590) (20,140) (21,240) (22,610) (14,370)
INT'L HOME VIDEO NET 21,050 25,060 26,970 29,630 31,530 33,880 34,800 35,750 37,660 39,950 25,510
DOMESTIC PAY TELEVISION 8,930 9,620 10,310 11,000 11,470 11,470 11,470 11,470 11,470 11,470 9,730
DOMESTIC FREE TELEVISION 4,860 5,290 5,730 5,990 6,290 6,500 6,560 6,600 6,700 6,810 5,400
INTERNATIONAL TELEVISION 31,000 34,070 36,260 43,000 44,900 44,900 50,000 50,000 50,760 54,760 34,070
TV COSTS (650) (700) (760) (820) (870) (930) (960) (980) (1,040) (1,100) (710)
TOTAL TELEVISION NET 44,140 48,280 51,540 59,170 61,790 61,940 67,070 67,090 67,890 71,940 48,490
AIRLINE / NON-THEATRICAL 1,330 1,520 1,710 1,900 2,090 2,280 2,380 2,470 2,660 2,850 1,550
MERCH, MUSIC & OTHER REVENUE 1,200 1,200 1,200 1,200 1,200 1,200 1,200 1,200 1,200 1,200 1,200
PRODUCTION COST (90,000) (90,000) (90,000) (90,000) (90,000) (90,000) (90,000) (90,000) (90,000) (90,000) (90,000)
CAPITALIZED OH (9,000) (9,000) (9,000) (9,000) (9,000) (9,000) (9,000) (9,000) (9,000) (9,000) (9,000)
RESIDUALS (2,740) (3,030) (3,250) (3,630) (3,840) (3,950) (4,190) (4,240) (4,370) (4,610) (3,050)
CREATIVE SHARES 0 0 0 (100) (100) (100) (1,940) (1,940) (1,940) (4,140) 0
TOTAL REVENUES $207,110 $233,590 $256,340 $283,580 $306,620 $326,160 $341,160 $350,560 $370,520 $393,880 $237,240
RELEASING COSTS (127,910) (134,420) (139,540) (144,670) (150,540) (156,540) (159,290) (162,550) (169,010) (175,410) (135,190)
PROD, O/H, PART, RESIDUALS (101,740) (102,030) (102,250) (102,730) (102,940) (103,050) (105,130) (105,180) (105,310) (107,750) (102,050)
GROSS PROFIT (LOSS) ($22,540) ($2,860) $14,550 $36,180 $53,140 $66,570 $76,740 $82,830 $96,200 $110,720 $0
GROSS PROFIT MARGIN NA NA 5.7% 12.8% 17.3% 20.4% 22.5% 23.6% 26.0% 28.1% 0.0%