Sonic Vibration Affects the Metabolism of Yeast Cells Growing in Liquid Culture
9
ORIGINAL ARTICLE Sonic vibration affects the metabolism of yeast cells growing in liquid culture: a metabolomic study Raphael Bastos Mereschi Aggio • Victor Obolonkin • Silas Granato Villas-Bo ˆas Received: 18 July 2011 / Accepted: 19 August 2011 / Published online: 4 September 2011 Ó Springer Science+Business Media, LLC 2011 Abstract It is undeniable that music and sounds can affect our emotions and mood, but so far the study of physical stimuli provoked by sound on living organisms has been mostly focused on brain and sensorimotor struc- tures rather than cellular metabolism. Using metabolomics, we compared the physiology of yeast cells growing in defined liquid medium exposed to music, high and low frequency sonic vibration and silence. All sonic stimuli tested not only increased the growth rate of the yeast cells by 12% but they also reduced biomass production by 14%. The intra- and extracellular metabolite profiles differed significantly depending on the sonic stimulus applied showing that different metabolic pathways are affected differently by different sound frequency. Therefore, our results clearly demonstrate that sound does affect microbial cell metabolism when growing in liquid culture, opening an entirely new perspective for scientific investigation inter- facing acoustics, biophysics and biochemistry. Keywords Metabolomics Metabolite profiling Bioacoustics Yeast physiology Cell metabolism 1 Introduction Although humanity has puzzled over the effect of sound on animal behaviour and physiology for centuries we have limited knowledge of the role of sound on single cells. Audible sounds, consist of oscillating pressure waves transmitted through solids, liquids, or gases, that if suffi- ciently strong stimulate mechanosensory cells (Pickett et al. 2000). Sound can govern emotions and mood via structures involved in cognitive, sensorimotor, and emo- tional processing, and music has even been proposed as an alternative form of therapy to treat various illnesses (Koelsch et al. 2010). To date little is known about the effects of sonic waves on the cellular metabolism. Nonetheless, some scientific studies have reported that plants respond to different music (Xiujuan et al. 2003) and high frequency sound waves can significantly increase protective antioxidative enzyme expression in plants (Xiujuan et al. 2003; Li et al. 2008). Sonic waves at specific frequencies have also been found to stimulate intestinal contractions and duodenal passage of barium in humans (Polous and Kurko 1991) and Syroeshkin et al. (1998) demonstrated that sonic waves induce contractive conformational changes of the mitochondrial transmembrane ATPase, affecting ATP production. Despite this tantalising evidence, audible sound’s intrinsic impact on cellular metabolism has received limited attention from the scientific community. Although biological interactions of sonic and ultrasonic vibration appears to have been explored since 1900 (Naimark et al. 1951), since the 1920’s the work has almost exclusively focused on ultrasound ( \ 20 kHz; Wood and Loomis 1927; Harvey and Loomis 1928; Harvey et al. 1928). Using a single cell organism as a model, we have exposed baker’s yeast, Saccharomyces cerevisiae to sound, to test whether sonic waves of different frequencies affect basal cell metabolism and growth. We choose a unicellular microorganism to exclude the complexity of multicellular Raphael Bastos Mereschi Aggio and Victor Obolonkin contributed equally to this work. R. B. M. Aggio V. Obolonkin S. G. Villas-Bo ˆas (&) Centre for Microbial Innovation, School of Biological Sciences, The University of Auckland, 3A Symonds Street, Private Bag 92019, Auckland 1142, New Zealand e-mail: [email protected] 123 Metabolomics (2012) 8:670–678 DOI 10.1007/s11306-011-0360-x
Transcript of Sonic Vibration Affects the Metabolism of Yeast Cells Growing in Liquid Culture

ORIGINAL ARTICLE
Sonic vibration affects the metabolism of yeast cells growingin liquid culture: a metabolomic study
Raphael Bastos Mereschi Aggio • Victor Obolonkin •
Silas Granato Villas-Boas
Received: 18 July 2011 / Accepted: 19 August 2011 / Published online: 4 September 2011
� Springer Science+Business Media, LLC 2011
Abstract It is undeniable that music and sounds can
affect our emotions and mood, but so far the study of
physical stimuli provoked by sound on living organisms
has been mostly focused on brain and sensorimotor struc-
tures rather than cellular metabolism. Using metabolomics,
we compared the physiology of yeast cells growing in
defined liquid medium exposed to music, high and low
frequency sonic vibration and silence. All sonic stimuli
tested not only increased the growth rate of the yeast cells
by 12% but they also reduced biomass production by 14%.
The intra- and extracellular metabolite profiles differed
significantly depending on the sonic stimulus applied
showing that different metabolic pathways are affected
differently by different sound frequency. Therefore, our
results clearly demonstrate that sound does affect microbial
cell metabolism when growing in liquid culture, opening an
entirely new perspective for scientific investigation inter-
facing acoustics, biophysics and biochemistry.
Keywords Metabolomics � Metabolite profiling �Bioacoustics � Yeast physiology � Cell metabolism
1 Introduction
Although humanity has puzzled over the effect of sound on
animal behaviour and physiology for centuries we have
limited knowledge of the role of sound on single cells.
Audible sounds, consist of oscillating pressure waves
transmitted through solids, liquids, or gases, that if suffi-
ciently strong stimulate mechanosensory cells (Pickett
et al. 2000). Sound can govern emotions and mood via
structures involved in cognitive, sensorimotor, and emo-
tional processing, and music has even been proposed as an
alternative form of therapy to treat various illnesses
(Koelsch et al. 2010).
To date little is known about the effects of sonic waves
on the cellular metabolism. Nonetheless, some scientific
studies have reported that plants respond to different
music (Xiujuan et al. 2003) and high frequency sound
waves can significantly increase protective antioxidative
enzyme expression in plants (Xiujuan et al. 2003; Li et al.
2008). Sonic waves at specific frequencies have also been
found to stimulate intestinal contractions and duodenal
passage of barium in humans (Polous and Kurko 1991)
and Syroeshkin et al. (1998) demonstrated that sonic
waves induce contractive conformational changes of the
mitochondrial transmembrane ATPase, affecting ATP
production. Despite this tantalising evidence, audible
sound’s intrinsic impact on cellular metabolism has
received limited attention from the scientific community.
Although biological interactions of sonic and ultrasonic
vibration appears to have been explored since 1900
(Naimark et al. 1951), since the 1920’s the work has
almost exclusively focused on ultrasound (\20 kHz;
Wood and Loomis 1927; Harvey and Loomis 1928;
Harvey et al. 1928).
Using a single cell organism as a model, we have
exposed baker’s yeast, Saccharomyces cerevisiae to sound,
to test whether sonic waves of different frequencies affect
basal cell metabolism and growth. We choose a unicellular
microorganism to exclude the complexity of multicellular
Raphael Bastos Mereschi Aggio and Victor Obolonkin contributed
equally to this work.
R. B. M. Aggio � V. Obolonkin � S. G. Villas-Boas (&)
Centre for Microbial Innovation, School of Biological Sciences,
The University of Auckland, 3A Symonds Street,
Private Bag 92019, Auckland 1142, New Zealand
e-mail: [email protected]
123
Metabolomics (2012) 8:670–678
DOI 10.1007/s11306-011-0360-x

organisms, and to eliminate the influence of nervous and
auditory systems of animals. Moreover the genome, bio-
chemistry and metabolome of S. cerevisiae are extremely
well characterised (Sherman 1997), and as such provide us a
powerful model to test the role of sound on cell metabolism.
2 Materials and methods
2.1 Yeast strain
Saccharomyces cerevisiae strain VIN13 was maintained on
YPD (yeast extract, peptone, dextrose) agar plates at 30�C
and used to prepare all pre-inoculums.
2.2 Shake flask cultures
The yeast strain was cultivated aerobically in triplicate,
using shake-flasks containing glucose (20 g l-1) as single
carbon source, (NH4)2SO4 (5.0 g l-1), MgSO47H2O
(0.5 g l-1), KH2PO4 (3.0 g l-1), vitamins and trace ele-
ments according to Verduyn et al. (1992). The culture
flasks were inoculated with an overnight grown pre-inoc-
ulum prepared in the same growth medium. Cultivations
were performed using the same rotatory shaker and incu-
bated in the same incubation room at 28 ± 1�C and 190
rev./min, in 500 ml shake flasks containing 100 ml of
medium and cotton plugs. Each sound treatment was car-
ried out at different days but using broth medium prepared
in a single bulk to ensure identical composition and inoc-
ulated with identical initial optical density using a pre-
inoculum grown overnight in the same medium.
2.3 Sound stimuli
The experimental set up as shown in Fig. 1 consisted of
two middle-high frequency speakers and low frequency
subwoofer connected to a computer. They were placed on
flat panel shaker surrounding the 500 ml shake-flasks. The
distance between the speakers and shake-flasks did not
exceed 20 cm. Due to the small within-group variation
(samples from the different flasks clustered close together
and presented small standard deviations in the different
measurements, n = 15), we assumed the sound pressure to
be roughly equal for all technical replicates. The yeast
cultures were exposed to four different conditions: (HF)
high frequency, 10 kHz, recording 89 dBA, sampled at 705
Kbps; (LF) low frequency, 100 Hz, recording 92 dBA,
sampled at 705 Kbps; broad-band music, sampled at 320
Kbps and 80–92 dBA; and ‘‘silence’’—control conditions
including only the mechanical noise of the incubator room
at approx 60 dBA. The sound stimuli were played contin-
uously for the duration of the experiment.
2.4 Fermentation parameters
Optical density (OD) of culture broth was measured at
600 nm using a Hitachi (model U-1100) spectrophotometer
each hour until the stationary growth phase was reached.
Presence of contamination was monitored using light
microscopy and growth rate (l) was calculated as
l ¼ 2:303ðlogðODÞ � logðOD0ÞÞðt � t0Þ
Fig. 1 Scheme of experimental set up. The experimental set up
consisted of two middle-high frequency speakers and low frequency
subwoofer connected to a computer. They were placed on flat panel
shaker surrounding the 500 ml shake-flasks. The distance between the
speakers and shake-flasks did not exceed 20 cm
Table 1 Classification table obtained from leave-one-out cross val-
idation of 15 samples containing intracellular metabolites
Original source Predicted source
HF LF M S
HF 15 0 0 0
LF 0 15 0 0
M 0 0 15 0
S 0 0 0 15
HF high frequency sonic wave, LF low frequency sonic wave,
M music, S silence
Sonic vibration affects yeast metabolism 671
123

where l is the growth rate, OD is the optical density
measured at the end of the exponential growth, OD0 is the
optical density measured in the beginning of the expo-
nential growth, t is the time at the end of the exponential
growth, and t0 is the time at the beginning of the expo-
nential growth.
2.5 Sampling for metabolome analysis
Five 5 ml cellular samples were rapid harvested from each
flask when the cells had reached an OD600 = 2.3–2.4 (early
to middle exponential growth phase). The cell metabolism
was quenched using cold-glycerol saline solution (-23�C)
followed by cold centrifugation at -20�C. Internal stan-
dard, 20 ll of 2,3,3,3-d4 alanine (10 mM), was added to
the cell pellets and the intracellular metabolites were
extracted using freeze/thaw cycles and cold methanol–
water (1:1v/v) solution. Detailed protocol can be found in
our previously published work (Smart et al. 2010).
2.6 Metabolite analyses
The cell extracts containing intracellular metabolites were
freeze-dried using a 12L Labconco Freeze Dryer (Labconco
Corporation). The freeze-dried solids were resuspended in
200 ll of sodium hydroxide solution (1 M) and derivatized
according to our standard laboratorial procedure (Smart et al.
2010). The derivatized samples were analyzed using a GC–
MS system (GC7890 coupled to a MSD5975, Agilent tech-
nologies), with a quadrupole mass selective detector (EI)
operated at 70 eV. The column used for all analyzes was a
ZB-1701 (Phenomenex), 30 m 9 250 m (internal diameter)
9 0.15 (film thickness), with 5 m guard column. The MS was
operated in scan mode (start after 6 min; mass range 38–650
a.m.u. at 1.47 scans/s (Smart et al. 2010).
2.7 Compound identification
We have used the Automated Mass Spectral Deconvolution
and Identification System (AMDIS) to identify compounds
Fig. 2 Growth curves and growth rates of Saccharomyces cerevisiaeat different experimental conditions. Cultivations occurred aerobi-
cally in shake flasks at 28�C under constant agitation at 190
rev. min-1. Flasks in triplicate were subject to different sound
stimuli: Low frequency sonic waves (100 Hz at 92 dBA), high
frequency sonic waves (10 kHz at 89 dBA), broad-band music
(sampled at 320 kbps at 80–92 dBA), and silence (background noise
at *60 dBA). Each data point represents mean values of three flasks
672 R. B. M. Aggio et al.
123

Table 2 All intracellular metabolites identified in samples of Saccharomyces cerevisiae growing aerobically on glucose at different growth
conditions (sound stimuli)
Mean of relative intensity (n = 15) ± standard deviationa
Silence Music Low frequency High frequency
Aspartate 0.041 ± 0.008 0.018 ± 0.001 0.068 ± 0.013 0.103 ± 0.031
Oleate 0.063 ± 0.017 0.060 ± 0.017 0.032 ± 0.007 0.053 ± 0.039
Proline 0.231 ± 0.034 0.084 ± 0.011 0.049 ± 0.008 0.058 ± 0.023
Citrate 0.000 ± 0.000 0.000 ± 0.000 0.068 ± 0.011 0.076 ± 0.020
Isoleucine 0.090 ± 0.020 0.040 ± 0.010 0.047 ± 0.007 0.058 ± 0.009
Leucine 0.103 ± 0.018 0.051 ± 0.005 0.042 ± 0.006 0.049 ± 0.009
14-methylpentadecanoate 0.043 ± 0.014 0.035 ± 0.008 0.032 ± 0.005 0.040 ± 0.018
Glutamine 0.098 ± 0.023 0.040 ± 0.005 0.035 ± 0.021 0.027 ± 0.010
Succinate 0.009 ± 0.002 0.004 ± 0.001 0.039 ± 0.007 0.029 ± 0.006
Phenol derivative 0.138 ± 0.055 0.089 ± 0.021 0.035 ± 0.005 0.043 ± 0.013
Glutamate 0.171 ± 0.029 0.069 ± 0.016 0.479 ± 0.073 0.558 ± 0.202
Stearate 0.039 ± 0.012 0.021 ± 0.006 0.023 ± 0.004 0.029 ± 0.010
Caproicate 0.015 ± 0.002 0.009 ± 0.005 0.045 ± 0.004 0.029 ± 0.004
Tyrosine 0.017 ± 0.003 0.013 ± 0.004 0.012 ± 0.002 0.015 ± 0.006
2-methoxysuccinate 0.071 ± 0.017 0.033 ± 0.009 0.011 ± 0.001 0.012 ± 0.006
Asparagine 0.000 ± 0.000 0.000 ± 0.000 0.015 ± 0.003 0.017 ± 0.009
NADPH/NADP? 0.000 ± 0.000 0.000 ± 0.000 0.022 ± 0.009 0.017 ± 0.008
NADH/NAD? 0.000 ± 0.000 0.000 ± 0.000 0.020 ± 0.009 0.020 ± 0.010
Caprylate 0.000 ± 0.000 0.000 ± 0.000 0.023 ± 0.002 0.014 ± 0.002
Myristate 0.017 ± 0.001 0.000 ± 0.000 0.006 ± 0.001 0.007 ± 0.003
2-oxoglutarate 0.000 ± 0.000 0.000 ± 0.000 0.008 ± 0.001 0.008 ± 0.001
Malate 0.000 ± 0.000 0.000 ± 0.000 0.004 ± 0.001 0.006 ± 0.002
Caprinate 0.000 ± 0.000 0.000 ± 0.000 0.008 ± 0.001 0.009 ± 0.001
2-aminobutyrate 0.033 ± 0.004 0.015 ± 0.002 0.002 ± 0.0001 0.006 ± 0.0008
Benzoate 0.004 ± 0.0004 0.002 ± 0.001 0.004 ± 0.004 0.003 ± 0.001
Fumarate 0.005 ± 0.0007 0.000 ± 0.000 0.004 ± 0.001 0.004 ± 0.002
Nicotinate 0.000 ± 0.000 0.000 ± 0.000 0.005 ± 0.001 0.004 ± 0.001
Histidine 0.000 ± 0.000 0.003 ± 0.001 0.007 ± 0.002 0.004 ± 0.002
Indol derivative 0.033 ± 0.011 0.031 ± 0.014 0.005 ± 0.004 0.005 ± 0.001
Alanine 0.177 ± 0.032 0.126 ± 0.022 0.359 ± 0.031 0.319 ± 0.035
Serine 0.000 ± 0.000 0.000 ± 0.000 0.003 ± 0.001 0.004 ± 0.001
4-aminobutyrate 0.019 ± 0.001 0.015 ± 0.008 0.003 ± 0.001 0.002 ± 0.001
Adipate 0.008 ± 0.0008 0.000 ± 0.000 0.005 ± 0.0007 0.003 ± 0.0003
Cis-aconitate 0.000 ± 0.000 0.000 ± 0.000 0.002 ± 0.001 0.002 ± 0.001
Levulinate 0.003 ± 0.001 0.000 ± 0.000 0.003 ± 0.001 0.003 ± 0.001
Norvaline 0.000 ± 0.000 0.009 ± 0.0005 0.000 ± 0.000 0.002 ± 0.0001
Phenylpropanoate 0.005 ± 0.0005 0.000 ± 0.000 0.001 ± 0.000 0.001 ± 0.001
Lysine 0.224 ± 0.043 0.176 ± 0.052 0.204 ± 0.042 0.174 ± 0.071
Glycine 0.027 ± 0.004 0.014 ± 0.002 0.009 ± 0.001 0.013 ± 0.006
Norleucine 0.043 ± 0.002 0.037 ± 0.003 0.000 ± 0.000 0.064 ± 0.005
Threonine 0.046 ± 0.007 0.020 ± 0.004 0.018 ± 0.003 0.020 ± 0.005
Valine 0.021 ± 0.003 0.071 ± 0.072 0.216 ± 0.020 0.196 ± 0.021
Hydroxybenzoate 0.009 ± 0.001 0.004 ± 0.0002 0.000 ± 0.000 0.000 ± 0.000
Methionine 0.000 ± 0.000 0.000 ± 0.000 0.003 ± 0.0003 0.005 ± 0.001
10,13-dimethyltetradecanoate 0.045 ± 0.012 0.038 ± 0.009 0.028 ± 0.007 0.038 ± 0.022
Phenylalanine 0.014 ± 0.003 0.000 ± 0.000 0.348 ± 0.032 0.523 ± 0.057
Sonic vibration affects yeast metabolism 673
123

present in each sample. AMDIS is a software freely dis-
tributed by the National Institute of Standards and Tech-
nology and has been largely applied to metabolomics.
Although AMDIS algorithm is considered powerful in
deconvoluting and identifying chromatographic peaks, it
produces some inaccuracies in relation to compound
quantification. Therefore, we used an in-house R (www.
r-project.org) script which recalculates the correct intensity
of each compound previously identified by AMDIS. A
detailed description of this process and our in-house R
script can be found in Aggio et al. (2011).
2.8 Data normalization
As described above, many technical steps precede the
generation of metabolomics data (e.g. sampling, quench-
ing, metabolite extraction and freeze-drying). Each one of
these steps is a potential source of variability, which can
possibly interfere in the identification of trends and corre-
lations present in our data-set. Therefore, we used the
2,3,3,3-d4 alanine as internal standard to minimise this
variability. This way, we divided the intensity of each
metabolite by the intensity of the internal standard detected
in each sample. More details about data normalization
procedure can be found in Smart et al. (2010).
2.9 Metabolomic data analysis
The difference in metabolite profiles of the different samples
was assessed by three different statistical methods. Firstly we
short-listed the relative level of each identified metabolite in
all the growth conditions. Conditions for which the level of a
metabolite was below the detection limit of the method it was
assigned absent. The qualitative results are summarised in
the Venn diagram (Fig. 3). Secondly, the metabolites that
were detected in all samples from all conditions were
selected for Fisher discriminant analysis (FDA). The pro-
jections of samples to three dimensions were computed by
dicrcoord function from fpc package (http://www.homepa
ges.ucl.ac.uk/*ucakche/). The visual clustering was
achieved by plotting the first three FDA projections. lda
function from the MASS package was used to classify
samples into four experimental categories. The results were
validated using leave-one-out cross validation technique,
using a single observation as the testing data for the FDA and
the remaining data as the training set. The procedure was
repeated until all observations were used as the testing
samples. Results are showed in Table 1. We achieved 100%
correct classification for all of the experimental conditions,
which validates the separation of samples in the four data
classes (growth conditions). Finally each metabolite
Fig. 3 Fisher discriminant analysis (FDA) for sample visualisation.
GC–MS metabolite data successfully distinguishes the different
growth conditions. Projections of the log transformed intracellular
metabolite data from 60 samples into 3D space shows four distinct
clusters of the four data classes. For each sample the projection values
were calculated as the linear combination of metabolite values
determined by FDA. Only metabolites that were detected in all
samples of all four growth conditions were used for the analysis
Table 2 continued
Mean of relative intensity (n = 15) ± standard deviationa
Silence Music Low frequency High frequency
4-aminobenzoate 0.002 ± 0.0002 0.000 ± 0.000 0.004 ± 0.000 0.000 ± 0.000
Pyruvate 0.000 ± 0.000 0.000 ± 0.000 0.004 ± 0.0005 0.003 ± 0.0004
Lactate 0.037 ± 0.019 0.017 ± 0.010 0.155 ± 0.014 0.149 ± 0.030
Malonate 0.000 ± 0.000 0.000 ± 0.000 0.004 ± 0.004 0.001 ± 0.000
Carbamate 0.089 ± 0.040 0.016 ± 0.008 0.000 ± 0.000 0.000 ± 0.000
Glutarate 0.000 ± 0.000 0.000 ± 0.000 0.002 ± 0.0003 0.000 ± 0.000
Ornithine 0.570 ± 0.069 0.304 ± 0.052 0.196 ± 0.029 0.106 ± 0.037
Pyroglutamate 0.000 ± 0.000 0.000 ± 0.000 0.253 ± 0.072 0.162 ± 0.089
a Mean of GC–MS peak normalized by internal standard
674 R. B. M. Aggio et al.
123

expression level was tested for the difference between
growth conditions with univariate analysis of variance
(ANOVA). The data was log-transformed to fit the normal
distribution criteria. Post-hoc turkey multiple comparison
test was used to estimate significantly different pairs of
conditions. Analysis was performed using R 2.9.0 software (
http://www.r-project.com).
3 Results and discussion
A strain of S. cerevisiae commonly used in wine fermenta-
tion was cultured in a chemically defined broth with glucose
as the only carbon source. All culture flasks were inoculated
with freshly prepared (exponentially growing) pre-inoculum
at identical initial optical density and were incubated at 28�C
under constant agitation using the same shaker-incubator.
Three different sound stimuli were applied constantly to the
culture flasks in triplicate throughout the incubation period
(Fig. 1): (LF) low frequency sonic waves (100 Hz at
92 dBA), (HF) high frequency sonic waves (10 kHz
at 89 dBA), and (M) broad-band music (sampled at 320 kbps
at 80–92 dBA); which were compared to culture flasks
growing in the silence (background noise at*60 dBA). The
yeast cells growing under sonic stimuli presented longer lag
phase (?1 h) and shorter exponential growth (-2 h) when
compared to cells growing in the silence (Fig. 2). In addition,
the growth rate of cells grown under sound stimuli was found
to be significantly different than the growth rate of yeast cells
growing in the silence (P value \ 0.005—Student’s t-test)
(Fig. 2). Yeasts growing under music presented the highest
growth rate of 0.362 h-1, which was 12.4% faster
(P \ 0.005) than cells growing in the silence (0.322 h-1).
The growth rate of cells growing under low frequency
(0.350 h-1) and high frequency sonic waves (0.359 h-1)
grew also significantly faster than in the silence (P \ 0.005).
Interestingly, the increased growth rates of sound exposed
yeast resulted in up to 14% reduction in biomass production
(Fig. 2). The maximum optical densities (600 nm) reached
by cultures incubated under sound stimuli were between 3.44
and 3.72 while the cultures kept in the silence reached 4.03
(P \ 0.05).
We reasoned that sonically modulated growth and bio-
mass accumulation must have impacted cellular metabolism
and metabolites. Therefore we explored the metabolome of
cultures from each sound treatment. Cells from all treatments
were harvested at middle exponential growth phase
(OD600nm 2.3–2.4) and promptly quenched at -23�C to stop
cell metabolism (Smart et al. 2010). Cells were washed and
intracellular metabolites extracted at low temperature prior
Fig. 4 Venn visualization of
the different identified
metabolites comparing
experimental conditions.
Experimental conditions:
S silence, M music, LF low
frequency, and HF high
frequency
Sonic vibration affects yeast metabolism 675
123

to be chemical derivatized and analysed by gas chromatog-
raphy-mass spectrometry (Smart et al. 2010).
Approximately 50 different metabolites, which play
important metabolic roles in the central carbon metabo-
lism, lipid and amino acid biosynthesis, were identified
among hundreds of detected compounds (Table 2). To
distinguish samples among classes, we projected the
identified metabolite level data from each sample to a
lower dimensional space. Two often-used data projection
methods are PCA (principal component analysis) and FDA
(Fisher discriminant analysis). PCA maximizes variation in
the reduced dimensions, whereas FDA maximizes separa-
tion between classes (Villas-Boas et al. 2005). For this
reason, we applied FDA to visualize samples in an attempt
to distinguish them among classes, which revealed very
clear separation as shown in Fig. 3. Our metabolomics data
successfully demonstrated that each data class (sound
stimuli and silence) present distinct metabolite profiles,
with samples from same data class clustering very close to
each other. For instance, we achieved 100% correct clas-
sification for all of the experimental conditions using the
leave-one-out cross validation technique (Table 1)
55 different intracellular metabolites were consistently
identified from over 120 metabolites searched for in our
MS library (Table 2). Of these 32 metabolites were
detected at significant different levels in each growth
condition and 9 were unique to specific conditions (Fig. 5).
On comparison of the most significantly changed metabo-
lite levels among growth conditions, some metabolites
detected in all four conditions showed a linear decrease in
levels when comparing silence, music, low frequency and
high frequency sonic waves (e.g. ornithine, glutamine,
2-methoxysuccinate). On the other hand, several com-
pounds were detected only in samples growing under fixed
sonic waves such as NADP?, NAD?, myristate, 2-oxo-
glutarate, malate, fumarate, and others (Fig. 5), whereas
fewer metabolites were only detected in music and silence
(Figs. 4, 5).
Although non-detection for a given condition illustrates
that some metabolites were below our detection limits,
differential metabolite level data still permits interpretation
and provides proof-of-concept that sound impacts on cel-
lular metabolism of yeast. Using our recently developed
approach for predicting metabolic pathway activity based
Fig. 5 Some of the metabolites detected at significant different
levels. Stripcharts of the metabolites shows statistically significant
difference between experimental conditions tested using univariate
ANOVA. Arrows represent 95% turkey confidence intervals for
multiple comparisons between growth conditions. Only metabolites
showing greatest difference were selected for the plot. Experimental
conditions: S silence, M music, LF low frequency, and HF high
frequency
676 R. B. M. Aggio et al.
123
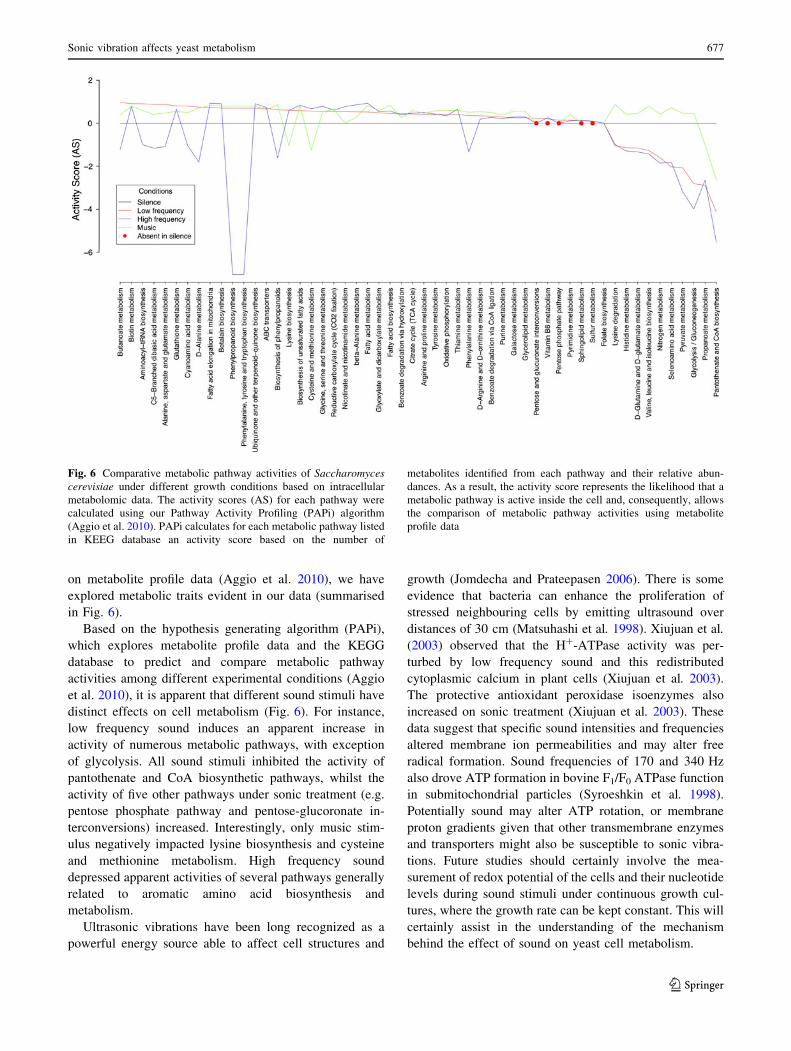
on metabolite profile data (Aggio et al. 2010), we have
explored metabolic traits evident in our data (summarised
in Fig. 6).
Based on the hypothesis generating algorithm (PAPi),
which explores metabolite profile data and the KEGG
database to predict and compare metabolic pathway
activities among different experimental conditions (Aggio
et al. 2010), it is apparent that different sound stimuli have
distinct effects on cell metabolism (Fig. 6). For instance,
low frequency sound induces an apparent increase in
activity of numerous metabolic pathways, with exception
of glycolysis. All sound stimuli inhibited the activity of
pantothenate and CoA biosynthetic pathways, whilst the
activity of five other pathways under sonic treatment (e.g.
pentose phosphate pathway and pentose-glucoronate in-
terconversions) increased. Interestingly, only music stim-
ulus negatively impacted lysine biosynthesis and cysteine
and methionine metabolism. High frequency sound
depressed apparent activities of several pathways generally
related to aromatic amino acid biosynthesis and
metabolism.
Ultrasonic vibrations have been long recognized as a
powerful energy source able to affect cell structures and
growth (Jomdecha and Prateepasen 2006). There is some
evidence that bacteria can enhance the proliferation of
stressed neighbouring cells by emitting ultrasound over
distances of 30 cm (Matsuhashi et al. 1998). Xiujuan et al.
(2003) observed that the H?-ATPase activity was per-
turbed by low frequency sound and this redistributed
cytoplasmic calcium in plant cells (Xiujuan et al. 2003).
The protective antioxidant peroxidase isoenzymes also
increased on sonic treatment (Xiujuan et al. 2003). These
data suggest that specific sound intensities and frequencies
altered membrane ion permeabilities and may alter free
radical formation. Sound frequencies of 170 and 340 Hz
also drove ATP formation in bovine F1/F0 ATPase function
in submitochondrial particles (Syroeshkin et al. 1998).
Potentially sound may alter ATP rotation, or membrane
proton gradients given that other transmembrane enzymes
and transporters might also be susceptible to sonic vibra-
tions. Future studies should certainly involve the mea-
surement of redox potential of the cells and their nucleotide
levels during sound stimuli under continuous growth cul-
tures, where the growth rate can be kept constant. This will
certainly assist in the understanding of the mechanism
behind the effect of sound on yeast cell metabolism.
Fig. 6 Comparative metabolic pathway activities of Saccharomycescerevisiae under different growth conditions based on intracellular
metabolomic data. The activity scores (AS) for each pathway were
calculated using our Pathway Activity Profiling (PAPi) algorithm
(Aggio et al. 2010). PAPi calculates for each metabolic pathway listed
in KEEG database an activity score based on the number of
metabolites identified from each pathway and their relative abun-
dances. As a result, the activity score represents the likelihood that a
metabolic pathway is active inside the cell and, consequently, allows
the comparison of metabolic pathway activities using metabolite
profile data
Sonic vibration affects yeast metabolism 677
123

4 Conclusions
By using a metabolomic approach, we demonstrate that
audible frequency sound influences yeast cell metabolism.
We not only showed that the intracellular metabolite profile
of yeasts cells harvested at same growth phase (early
exponential growth) but growing at different sound stimuli
were significantly different as demonstrated by FDA
analysis (Fig. 3), we also showed that some identified
metabolites were only detected in specific group of samples
(sound treatments, n = 15) (Fig. 4), while those metabo-
lites detected in all samples also presented significant dif-
ferent levels (Fig. 5). Moreover, our data indicate that
different sound frequencies induce different metabolic and
physiological responses in yeast cells. This opens new
perspectives for scientific investigation interfacing acous-
tics, biophysics and biochemistry, and perhaps provides
powerful tools for manipulating cell metabolism and
growth control (i.e.; in bioreactors) and proliferation (i.e.;
cancer treatment).
Acknowledgments We are very grateful to Gregory Cook, Matthew
Goddard, Richard Gardner, and Vladimir Obolonkin for valuable
comments and to Anthony Hickey for discussion and critical reading
of this manuscript. We also thank Farhana Pinu and Sang Kim for
technical assistance with media and sample preparation.
References
Aggio, R. B. M., Ruggiero, K., & Villas-Boas, S. G. (2010). Pathway
Activity Profiling (PAPi): From the metabolite profile to the
metabolic pathway activity. Bioinformatics, 26, 2969–2976.
Aggio, R. B. M., Villas-Boas, S. G., & Ruggiero, K. (2011). Metab:
An R package for high-throughput analysis of metabolomics data
generated by GC-MS. Bioinformatics, 27, 2316–2318.
Harvey, E. N., Harvey, E. B., & Loomis, A. L. (1928). Further
observations on the effect of high frequency sound waves on
living matter. Biological Bulletin Marine Biological Laboratory,55, 459–469.
Harvey, E. N., & Loomis, A. L. (1928). High frequency sound waves
of small intensity and their biological effects. Nature, 121,
622–624.
Jomdecha, C., & Prateepasen, A. (2006). The research of low-
ultrasonic energy effects on yeast growth in fermentation
process. In 12th Asia-Pacific Conference on NDT, 5th–10thNovember 2006, Auckland, New Zealand.
Koelsch, S., Offermanns, K., & Franzke, P. (2010). Music in the
treatment of affective disorders: An exploratory investigation of
a new method for music-therapeutic research. Music Perception,27, 307–316.
Li, B., Wei, J., Tang, K., Liang, Y., Shu, K., & Wang, B. (2008).
Effect of sound wave stress on antioxidant enzyme activities and
lipid peroxidation of Dendrobium candidum. Colloids andSurfaces B: Biointerfaces, 63, 269–275.
Matsuhashi, M., Pankrushina, A. N., Takeuchi, S., Ohshima, H.,
Miyoi, H., Endoh, K., et al. (1998). Production of sound waves
by bacterial cells and the response of bacterial cells to sound.
The Journal of General and Applied Microbiology, 44, 49–55.
Naimark, G. M., Klair, J., & Mosher, W. A. (1951). A bibliography
on sonic and ultrasonic vibration: Biological, biochemical and
biophysical applications. Journal of The Franklin Institute, 251,
279–299.
Pickett, J. P., et al. (2000). The American Heritage� Dictionary of theEnglish Language (4th ed.). Boston: Houghton Mifflin.
Polous, Y. U. M., & Kurko, V. S. (1991). Sound-wave stimulation of
duodenal motility in chronic duodenal ileus. KlinicheskayaMeditsina, 69, 42–44.
Sherman, F. (1997). Yeast genetics. In R. A. Meyers (Ed.), Theencyclopaedia of molecular biology and molecular medicine(Vol. 6, pp. 302–325). Weinheim: VCH Publisher.
Smart, K. F., Aggio, R. B. M., Van Houtte, J. R., & Villas-Boas, S. G.
(2010). Analytical platform for metabolome analysis microbial
cells using methyl chloroformate derivatization followed by gas
chromatography–mass spectrometry. Nature Protocols, 5,
1709–1729.
Syroeshkin, A. V., Bakeeva, L. E., & Cherepanov, D. A. (1998).
Contraction transitions of F1–F0 ATPase during catalytic
turnover. Biochimica et Biophysica Acta, 1409, 59–71.
Verduyn, C., Postma, E., Scheffers, W. A., & van Dijken, J. P. (1992).
Effect of benzoic acid on metabolic fluxes in yeasts: A
continuous-culture study on regulation of respiration and alco-
holic fermentation. Yeast, 8, 501–517.
Villas-Boas, S. G., Moxley, J. F., Akesson, M., Stephanopoulos, G., &
Nielsen, J. (2005). High-throughput metabolic state analysis:
The missing link in integrated functional genomics of yeasts.
Biochemical Journal, 388, 669–677.
Wood, R. W., & Loomis, A. L. (1927). The physical and biological
effects of high frequency sound waves of great intensity. TheLondon, Edinburgh, and Dublin Philosophical Magazine, 4,
417–436.
Xiujuan, W., Bochu, W., Yi, J., Defang, L., Chuanren, D., Xiaocheng,
Y., et al. (2003). Effects of sound stimulation on protective
enzyme activities and peroxidise isoenzymes of chrysanthemum.
Colloids and Surfaces B: Biointerfaces, 27, 59–63.
678 R. B. M. Aggio et al.
123