
Sonic Echo/Impulse Response (SE/IR) - Aplace by Glenvill€¦ · Sonic Echo/Impulse Response...
63
Sonic Echo/Impulse Response (SE/IR) NDE 360 PLATFORM System Reference Manual NDE-360 Platform with WinSEIR Software Version 1.3
Transcript of Sonic Echo/Impulse Response (SE/IR) - Aplace by Glenvill€¦ · Sonic Echo/Impulse Response...

Sonic Echo/Impulse Response (SE/IR)
NDE 360 PLATFORM
System Reference Manual
NDE-360 Platform with WinSEIR Software Version 1.3

1
Sonic Echo/Impulse Response (SE/IR)
www.olsoninstruments.com | www.olsonengineering.com
NOTICES
Errors and Omissions This document is believed to be accurate, but Olson Instruments, Inc. will not be responsible for errors or omissions, which may be found. Further, Olson Instruments will not be responsible for any damages resulting from any errors or omissions. Proprietary Information This document, as well as all software written by Olson Instruments, Inc., is proprietary to Olson Instruments, Inc. This manual may not be sold, reproduced, or used with any other product other than the Olson Instruments Sonic Echo/Impulse Response system unless approved by Olson Instruments, Inc. Further, this manual and the accompanying software may not be used by any party other than the original purchaser without prior approval of Olson Instruments, Inc. Warranty (See Sales Contract Documents) Copyright Copyright 2012 by Olson Instruments, Inc. All rights reserved. No part of this publication may be reproduced or utilized in any form or by any means, electronic or mechanical, including photocopying, recording, or by any information storage or retrieval system, without prior written permission of the above named copyright holder. Written by: Olson Instruments, Inc. 12401 W. 49th Avenue Wheat Ridge, Colorado USA 80033-1927 Office: (303)423-1212 Fax: (303)423-6071 E-Mail: [email protected] Revised: May 2012

2
Sonic Echo/Impulse Response (SE/IR)
www.olsoninstruments.com | www.olsonengineering.com
Table of Contents
1.0 INTRODUCTION ..............................................................................................................................................3
1.1 Organization and Scope of Manual ..............................................................................................................3
1.2 Test Methodology .........................................................................................................................................4
2.0 HARDWARE.....................................................................................................................................................7
2.1 Hardware Component Listing .......................................................................................................................7
2.2 Basic Components and Maintenance of NDE-360 Platform.........................................................................9
2.3 Hardware Setup ..........................................................................................................................................12
3.0 SE/IR DATA AQUISITION..............................................................................................................................18
4.0 WinSEIR SOFTWARE SETUP.......................................................................................................................25
4.1 Prerequisite Software..................................................................................................................................25
4.2 Software Installation....................................................................................................................................25
4.3 Software Updates .......................................................................................................................................26
4.4 Software Uninstallation ...............................................................................................................................26
5.0 WinSEIR SOFTWARE ANALYSIS .................................................................................................................27
5.1 Start Program..............................................................................................................................................27
5.2 Open and Accept/Reject NDE-360 Data ....................................................................................................27
5.3 Impulse Response (IR) Analysis.................................................................................................................30
5.4 Calibration Values.......................................................................................................................................31
5.5 Filtering .......................................................................................................................................................31
5.6 Concrete Velocity........................................................................................................................................32
5.7 Units ............................................................................................................................................................33
5.8 Next Channel (Average Waveform Plot).....................................................................................................33
5.9 Amplification................................................................................................................................................33
5.10 Calibration Database ................................................................................................................................34
5.11 Zoom In/Out ..............................................................................................................................................34
5.12 Shaft Toe Detection ..................................................................................................................................35
5.13 Open Next Data File .................................................................................................................................35
6.0 WinSEIR SOFTWARE EXPORTING OPTIONS............................................................................................36
6.1 Copy Image to the Clipboard ......................................................................................................................36
6.2 Save Image to .jpg ......................................................................................................................................36
6.3 Export Waveform to a Comma Separated Format .....................................................................................36
Related Peer Reviewed Papers ...............................................................................................................................37
3
Sonic Echo/Impulse Response (SE/IR)
www.olsoninstruments.com | www.olsonengineering.com
1.0 INTRODUCTION The Olson Instruments Sonic Echo/Impulse Response (SE/IR) system is commonly used for quality assurance, condition evaluation, and forensic testing of piles and deep foundations. Common applications of the SE/IR system are determining the length of foundations and/or locating defects within foundations. The basic requirement for any foundation to be testable by this system is that an area of approximately 3 inches (7.6 cm) by 5 inches (12.7 cm) access be available on the foundation top, and that the surface to be tested is relatively smooth and flat. Alternatively, testing can be done by mounting the receiver to a block on the side of the pile, but the data quality will be lower. The NDE-360 is a light, handheld data collection platform with a touch screen feature that allows a single operator to collect data easily and fast. When used for quality assurance, forensic testing, and condition evaluation of deep foundations, the NDE-360 with SE/IR-1 system is a powerful, easy to handle and operate tool for verifying foundation integrity, locating defects and determining foundation length. The NDE-360 system with the SE/IR test consists of several basic components. These components include the 4 channel NDE-360 platform for data acquisition, analysis and display, an accelerometer, an instrumented 3 lb hammer, a geophone, grease and cables. Details of the hardware and its usage are included in Section 2.0. The Windows WinSEIR software is a post data analysis program with a number of specialized SE/IR analysis tools built-in. This manual covers step-by-step hardware assembly, software setup, data acquisition, data analysis, and output generation.
1.1 Organization and Scope of Manual
This operation manual for the SE/IR test with the NDE-360 system manufactured by Olson Instruments includes all required instruction for the use of the hardware and software included with the system. If any problems with the system appear that are not covered in this manual, please call Olson Instruments at the number included in the front of this manual. Note that training in the use of the system by Olson Instruments personnel is recommended for the most effective operation of this system.

4
Sonic Echo/Impulse Response (SE/IR)
www.olsoninstruments.com | www.olsonengineering.com
1.2 Test Methodology
The SE method is a low strain integrity test conducted from the top (or upper side) of the shaft as shown in the figure below. Test equipment includes a 3 pound (1.36 kg) hammer (instrumented or mechanical), receiver (accelerometer and/or geophone) mounted on the top (or upper side) of the shaft, and a data acquisition platform. The test involves hitting the foundation top with the hammer to generate wave energy that travels to the bottom of the foundation. The wave reflects off irregularities (cracks, necks, bulbs, soil intrusions, voids, etc.) and/or the bottom of the foundation and travels back along the foundation to the top. The receiver measures the vibration response of the foundation to each impact. The data collection platform acquires, processes and displays the receiver outputs. Foundation length and integrity of concrete are evaluated by identifying and analyzing the arrival times, direction, and amplitude of reflections measured by the receivers in time. The echo depth (D) is calculated by multiplying the reflection time (t) by the compression wave velocity (V) and dividing this quantity by 2 to account for the fact that the wave has gone down and reflected back, i.e., D = V*t/2 . Analysis of the length determination and the integrity evaluation of a foundation with the SE method is based on the identification and evaluation of reflections. Test results are analyzed in the time domain for the SE test. The SE test method is sensitive to changes in the shaft impedance (shaft concrete area * velocity * mass density where mass density equals unit weight divided by gravity), which cause the reflections of the compression wave energy. Compression wave energy (hammer impact energy) reflects differently from increased shaft impedance than from decreased shaft impedance. This phenomenon allows the type of reflector to be identified as follows. Soil intrusions, honeycomb, breaks, cracks, cold joints, poor quality concrete and similar defects are identified as reflections that correspond to a decrease in the shaft impedance. Increases in the shaft cross-section or the competency of surrounding materials such as bedrock and stiffer soil strata are identified as reflections corresponding to increases in the shaft impedance. A decrease in impedance is indicated by a downward initial break of a reflection event in an SE record and frequency peaks positioned in a record such that a peak could be extrapolated to be near 0 Hz in the mobility plot. Conversely, an increase in shaft impedance is identified by an upward initial break for an SE reflector.

5
Sonic Echo/Impulse Response (SE/IR)
www.olsoninstruments.com | www.olsonengineering.com
When length to diameter ratio exceeds 20:1 to 30:1 for shafts in stiffer soils/bedrock, the attenuation of compression wave energy is high and bottom echoes are weak or unidentifiable in SE test results. If the shaft is embedded in a material which has similar impedance to that of the shaft, it may not be possible to see a reflection from the bottom of the shaft. Impulse Response (IR) - The IR method is also an echo test and uses the same test equipment as the SE method. The test procedures are similar to the SE test procedures, but the data processing is different. The IR method involves frequency domain data processing, i.e., the vibrations of the foundation measured by the receivers are processed with Fast Fourier Transform (FFT) algorithms to generate transfer functions for analyses. The coherence of the impulse hammer impact and accelerometer receiver response data versus frequency is calculated to indicate the data quality. A coherence near 1.0 indicates good quality data. For shafts in air or in relatively soft soils, the coherence will typically only be near 1.0 at frequencies for which the mobility is non-zero. In the IR records the linear transfer function amplitude is in inches/second/pound force on the vertical axis (mobility) and frequency in Hz on the horizontal axis. Because of the rod-like shape of a deep foundation, reflections are indicated by equally spaced resonant peaks that correspond to modes of vibration associated with the depth of the reflector. The inverse of the SE reflection time, t, is equal to the change in frequency, delta f, between the resonant peaks in the IR mobility plot. The reflector depth is then calculated as: D = V/(2*∆f). SE/IR Analyses - Analysis of the length determination and the integrity evaluation of a foundation for both the SE and IR methods is based on the identification and evaluation of reflections. However, test results are analyzed in the time domain for the SE and in the frequency domain for the IR method. The reflections are shown as resonant frequency peaks in the frequency domain for IR test data. The two methods complement each other because the identifications of reflections are sometimes clearer in either the time or the frequency domain. The SE and IR test methods are sensitive to changes in the shaft impedance (shaft concrete area * velocity * mass density where mass density equals unit weight divided by gravity), which cause the reflections of the compression wave energy. Compression wave energy (hammer impact energy) reflects differently from increased shaft impedance than from decreased shaft impedance. This phenomenon allows the type of reflector to be identified as follows. Soil intrusions, honeycomb, breaks, cracks, cold joints, poor quality concrete and similar defects (referred to herein as a neck) are identified as reflections that correspond to a decrease in the shaft impedance. Increases in the shaft cross-section or the competency of surrounding materials such as bedrock and stiffer soil strata (referred to herein as a bulb) are identified as reflections corresponding to increases in the shaft impedance. A decrease in impedance is indicated by a downward initial break of a reflection event in an SE record and frequency peaks positioned in a record such that a peak could be extrapolated to be near 0 Hz in the mobility plot. Conversely, an increase in shaft impedance is identified by an upward initial break for an SE reflector and frequency peaks positioned in an IR record such that a trough could be extrapolated to be near 0 Hz in the mobility plot. When length to diameter ratios

6
Sonic Echo/Impulse Response (SE/IR)
www.olsoninstruments.com | www.olsonengineering.com
exceed 20:1 to 30:1 for shafts in stiffer soils/bedrock, the attenuation of compression wave energy is high and bottom echoes are weak or unidentifiable in SE/IR test results. The term “weak bottom echo” is used to indicate that a bottom echo is seen, but that it is barely visible above the normal background noise. Note that it is possible for a perfectly sound shaft to have a weak bottom echo, as a weak echo can be caused by either a shallow reflector blocking energy from the shaft bottom, or from wave energy coupling into the bedrock at the shaft bottom rather than reflecting back up. Thus, the strength of the bottom echo is used as a secondary, minor consideration as to shaft condition.

7
Sonic Echo/Impulse Response (SE/IR)
www.olsoninstruments.com | www.olsonengineering.com
2.0 HARDWARE The SE/IR system with the NDE-360 platform consists of several basic components packaged into a padded carrying case. The padded case stores the NDE-360 data acquisition platform, battery charger, accelerometer, 3 lb instrumented hammer, 4.5 Hz geophone, grease, and cables. A description of each of these components as well as their connection and operation is included in the following sections.
2.1 Hardware Component Listing
COMPONENT NAMECOMPONENT NAMECOMPONENT NAMECOMPONENT NAME QTYQTYQTYQTY DESCRIPTIONDESCRIPTIONDESCRIPTIONDESCRIPTION
1.) Olson Instruments NDE-360 Platform
1 Platform for data acquisition, analysis and display of SE/IR data
2.) Accelerometer
1 To receive the SE/IR acceleration time domain data (to be mounted on the foundation top)
3.) Instrumented Hammer
1 An instrumented 3 lb hammer impact source
4.) Heads for Instrumented Hammer
1 4 heads for the instrumented hammer (each head has a different hardness)
5.) Geophone 1
To receive the SE/IR velocity time domain data (to be mounted on the foundation top).

8
Sonic Echo/Impulse Response (SE/IR)
www.olsoninstruments.com | www.olsonengineering.com
6.) BNC Cable 2 BNC extension cable for accelerometer
7.) BNC Adapter 1 Female to Female BNC adaptor
8.) BNC to 4 Pin Adaptor Cable
1 To connect the BNC cable to the input channel on the NDE-360 system.
9.) Phone Jack to 4 Pin Adaptor 1
To connect the geophone to the input channel on the NDE-360 system.
10.) Microdot to BNC Cable
1 To connect the accelerometer to the BNC Cable.
11.) Battery Charger 1 Battery Charger for the NDE-360 platform
12.) Battery 1 Nickel metal hydride battery
13.) Card Reader and Compact Flash Card
1 Compact Flash Card to hold the firmware file and store SE/IR data files. Card Reader to transfer the SE/IR data files to the analysis computer.
14.) Coupling Grease
1 Coupling agent between the accelerometer and foundation top

9
Sonic Echo/Impulse Response (SE/IR)
www.olsoninstruments.com | www.olsonengineering.com
2.2 Basic Components and Maintenance of NDE-360 Platform
Battery Charging: The external battery charger (Item 11) automatically switches between 100/240 Volts AC. In order to charge the battery, the battery charger must be plugged into the line voltage supply (110/220 VAC) using the correct plug adapter. The other end plugs into the NDE-360 next to the CF card slot. The NDE-360 must be turned off during charging. The battery is charged when the light on the charger unit blinks at a slow, steady rate. If the NDE-360 is turned on and the charger is plugged in, it is possible to use the NDE-360 for data acquisition, but the charger will not automatically turn off when the battery is fully charged. Therefore, be aware that the battery can be overcharged and possibly damaged if the NDE-360 is turned on with the charger connected over an extended period of time. To properly charge the NDE-360, be sure it is turned off when the charger is plugged in and charging. If a 12 VDC source (like an automobile power outlet) is plugged directly into the NDE 360, it will run the NDE 360 but it will not charge the battery. (If a car battery is used, do not run the car engine.) If plugged into a 12 VDC source (like an automobile power outlet) while the battery is removed, it will also run the NDE 360. Turn the unit off promptly when the yellow “low battery” indicator on the NDE 360 lights up, otherwise the battery may discharge to the point where it requires a 12VDC boost so that the charger can recognize the battery and start charging.
Time required to fully charge the battery is 8 hours. The fully charged battery will power the NDE-360 system for 8 – 10 hours.
i
Power Supply
Battery Charger

10
Sonic Echo/Impulse Response (SE/IR)
www.olsoninstruments.com | www.olsonengineering.com
Location of Battery: The compartment housing the battery is located on the back of the NDE-360 system. Move the switch to remove the battery cover if the battery needs to be replaced. Channel Arrangement: The NDE-360 system is equipped with 4 channels. There is one 4 pin connector for each channel. Channel 1 is located on the right hand side if facing the front screen of the NDE-360 system (it is typically located near the Impact Echo channel which is not used in the SE/IR test).
Do not expose the NDE-360 system or the battery to water. !
Battery Panel
Ch 4 Ch 3 Ch 2 Ch 1
Wideband Channels
Not used in the SE/IR test
Not used in the SE/IR test

11
Sonic Echo/Impulse Response (SE/IR)
www.olsoninstruments.com | www.olsonengineering.com
Data Storage: A compact flash card is used to store the SE/IR data files. In addition, the master program controlling the SE/IR test is stored in the compact flash card. The system must start up with the compact flash secured in place. The card should be located on the left side of the NDE-360 system if looking at the front screen.
NDE-360 Operation Notes: The NDE-360 system is a self-contained data conditioning, collection, basic processing and data display platform usable for a number of types of NDT tests. The system was designed to make it user friendly and easy to handle and operate by a single operator. The main screen can be navigated using the touch screen feature.
Compact Flash Card
If the compact flash card is missing from the system, the system will not function. Do not remove the compact flash card while the system is turned on.
!
Never impact the screen with any sharp object! !

12
Sonic Echo/Impulse Response (SE/IR)
www.olsoninstruments.com | www.olsonengineering.com
2.3 Hardware Setup
Connect the microdot cable to the accelerometer by aligning the pin on the microdot cable with the corresponding hole in the accelerometer and then hand-tighten the connection. If needed, attach the female BNC adaptor to the BNC end of the microdot cable by aligning the pin with the hole and gently connecting the two pieces. This connection will have a locking mechanism that will prevent over-tightening the connection. Next, if needed, attach the other end of the female BNC adaptor to a BNC cable. Follow the same procedure as before when connecting these two cables.

13
Sonic Echo/Impulse Response (SE/IR)
www.olsoninstruments.com | www.olsonengineering.com
Now attach the BNC cable to the 4 pin adaptor cable using the same procedure as before when connecting these two cables. Insert the 4 pin adaptor cable into a wideband channel. The default channels used by the SE/IR software are Channel 1 for the geophone, Channel 2 for the accelerometer and Channel 4 for the hammer. Put a small amount of coupling grease on the base of the accelerometer and then mount the accelerometer on a smooth area on the foundation top.
Accelerometer
Coupling Grease

14
Sonic Echo/Impulse Response (SE/IR)
www.olsoninstruments.com | www.olsonengineering.com
For the SE/IR test, an instrumented 3 lb (1.4 kg) hammer is typically used. Screw in the impact head to the instrumented hammer. The tip most commonly used for the SE/IR test is the black head. The red tip is typically used for very long foundations (greater than about 90 feet or 30 m). Connect the BNC Cable to the BNC connector on the end of the instrumented hammer
Black Impact Head
BNC Cable
Instrumented Hammer

15
Sonic Echo/Impulse Response (SE/IR)
www.olsoninstruments.com | www.olsonengineering.com
Connect the other end of the BNC cable to the BNC to 4 Pin adaptor cable. Connect the 4 Pin adaptor cable to Channel 4 on the NDE-360 platform.
BNC to 4 Pin adapter cable
Hammer connected to Channel 4

16
Sonic Echo/Impulse Response (SE/IR)
www.olsoninstruments.com | www.olsonengineering.com
Connect the Phone Jack to 4 Pin adaptor cable to the geophone. Connect the 4 Pin adaptor cables for the geophone and accelerometer to the input channels on the NDE-360 platform. By default, the geophone should be connected to Channel 1, the accelerometer to Channel 2 and the instrumented hammer to Channel 4.
Phone Jack to 4 Pin adaptor cable
Geophone
Connected to an accelerometer
Connected to a geophone
Connected to an instrumented hammer

17
Sonic Echo/Impulse Response (SE/IR)
www.olsoninstruments.com | www.olsonengineering.com
The picture below shows the complete hardware setup for the SE/IR test.
Instrumented Hammer
Accelerometer Geophone

18
Sonic Echo/Impulse Response (SE/IR)
www.olsoninstruments.com | www.olsonengineering.com
3.0 SE/IR DATA AQUISITION
1. Turn on the NDE-360 system (with the hardware in Section 2.0 connected). Make sure that
the compact flash card is secured in place. The master software to run the system is located on the compact flash card. Press on the “Continue” button on the upper right corner of the screen. If the compact flash card is not in place, the “Continue” button will not appear on the screen.
If the continue button disappears from the screen, turn off the system and insert the compact flash card in place and turn the system on again.
i
Press on this button to continue
Press on this button to turn on the system

19
Sonic Echo/Impulse Response (SE/IR)
www.olsoninstruments.com | www.olsonengineering.com
2. Press on the “SE/IR” option. The picture below shows a screen with the several options enabled. The options on the unit may be different depending on the system ordered.
3. Press on the “Param” button to set up the data parameters. Note that the unit is loaded with
the default parameters that are appropriate for most SE/IR tests.

20
Sonic Echo/Impulse Response (SE/IR)
www.olsoninstruments.com | www.olsonengineering.com
In the parameter setup screen, the user can change the following parameters by touching the buttons to toggle the values. Touch the “Back” button after the parameter setup is complete. Change Date/Time. This option allows the user to enter the correct date and time of testing. Time/Point or Sampling Rate means how often (in the time domain) the system will acquire data points within a given data trace. In the case shown in the picture below, the Time/Point is set at 20 microseconds. This means the system will acquire data at 20 microsecond intervals. This parameter can not be changed after the data is taken. Points Per Record is the number of sampling points for each waveform. The higher this value, the more data is acquired in each waveform. The total time of a record is affected by both the Sample Rate and the Record Size. This parameter can not be changed after the data is taken. Velocity. The software uses this velocity to calculate the echo depth. If velocity calibration is not possible, a typical concrete velocity of 12,000 ft/sec may be used as a default. This parameter can be changed later in the post data analysis. # Recs. Number of Records is the total number of SE/IR data records you want to save. This parameter can not be changed after the data is taken. Pre-Trigger is number of points before the triggering point that data collection starts. In this case, the pre-trigger is 100 points (or 100 x 20 us = 2000 us). This parameter can not be changed after the data is taken. Trigger Level % is the minimum signal amplitude (in terms of percentage full scale) to trigger data acquisition. In this case, the trigger level is set at 6%. Therefore, the system will start acquiring data once the absolute amplitude of the signal exceeds 0.6 volt on the selected trigger channel. This parameter can not be changed after the data is taken. Channel Setup For the SE/IR test, three channels (connected to the geophone, accelerometer and instrumented hammer) are used. Any of the 4 channels can be used for the SE/IR test. However, the default parameter is loaded with Ch 1 for geophone (Velocity), Ch 2 for accelerometer (Accel) and Ch 4 for instrumented hammer (Force). Typically, the channel connected to the instrumented hammer is used as the trigger channel and SREF (reference) channel. More details are provided below: REF: Press a button in the REF column to assign the reference channel. Generally, this is the hammer or Force channel. This sets the numerator term in Transfer Function (IR) analysis. TRIG: Press a button in this column to assign the trigger channel. This is the channel that determines when data collection occurs, along with the “Trig Lev %” setting. CAL: These entries are used to enter the transducer calibrations, in terms of unit/volt where “unit” is the engineering unit (Metric or English) desired for the final result on a given channel. Note that default calibrations are filled in for some “typical” English units.
Type of Transducer
To go back to previous menu

21
Sonic Echo/Impulse Response (SE/IR)
www.olsoninstruments.com | www.olsonengineering.com
4. After the channel setup is complete in the parameter setup menu, press the “Back” button to return. Next, the gain control for the channel should be set by touching the + button to increase the gain value and the – button to reduce the gain value. It is recommended that a gain of 10 - 100 is initially set for the accelerometer and velocity channels and 1 for the instrumented hammer channel.
5. The filename arrangement of the NDE-360 uses a fixed alphabetical prefix and a numerical
suffix. The prefix can be set at the beginning of any test. If the prefix is not changed, a higher suffix number will be added to the current prefix for the new filename. To change the prefix, press on the “Files” button and press number 5 and then number 1. Then a virtual keyboard will appear on the screen and the user can change the prefix part of the filename. Press the “A” button on either side to accept the new prefix of the filename.
Accept Button
Initial gain of 10 for both velocity
and accelerometer channels
To set up file name

22
Sonic Echo/Impulse Response (SE/IR)
www.olsoninstruments.com | www.olsonengineering.com
6. Now, the system is ready to acquire SE/IR data. Press on the “Test” button to start testing. 7. The NDE-360 system will then wait for the data. Note that the voltage of the SE/IR time
domain data has to exceed the trigger level in order for the system to start taking data. Hit the hammer on the foundation top next to the accelerometer and geophone.
23
Sonic Echo/Impulse Response (SE/IR)
www.olsoninstruments.com | www.olsonengineering.com
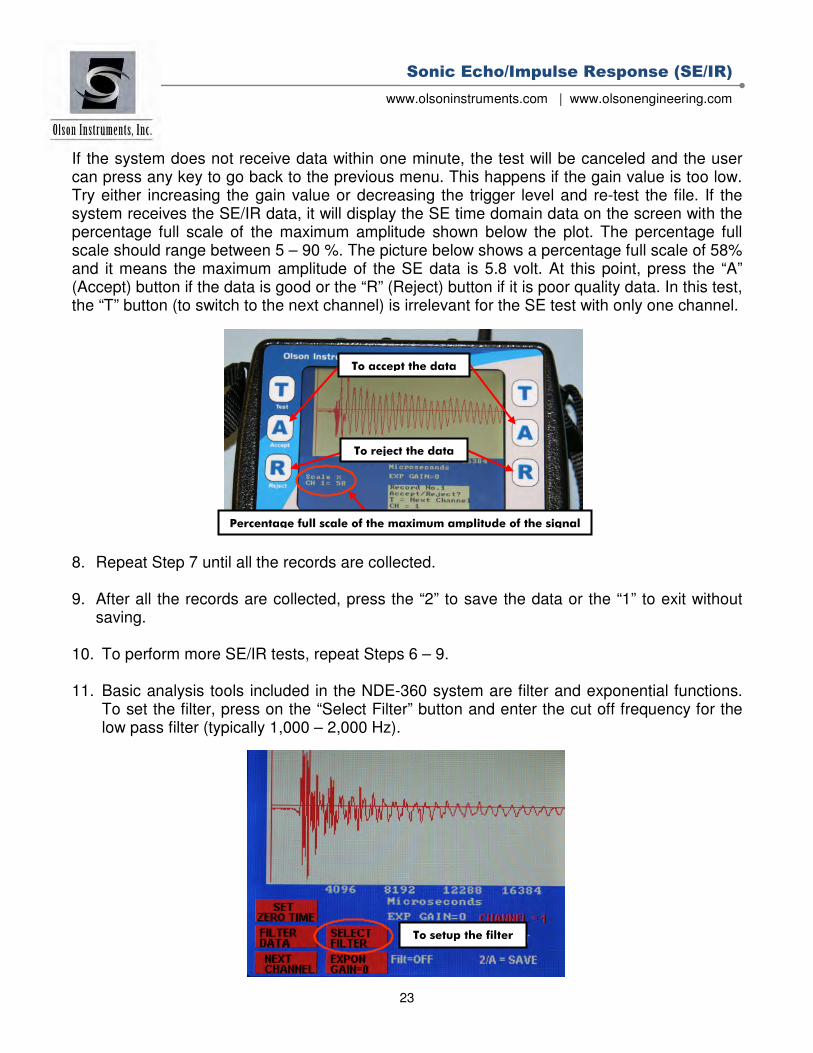
If the system does not receive data within one minute, the test will be canceled and the user can press any key to go back to the previous menu. This happens if the gain value is too low. Try either increasing the gain value or decreasing the trigger level and re-test the file. If the system receives the SE/IR data, it will display the SE time domain data on the screen with the percentage full scale of the maximum amplitude shown below the plot. The percentage full scale should range between 5 – 90 %. The picture below shows a percentage full scale of 58% and it means the maximum amplitude of the SE data is 5.8 volt. At this point, press the “A” (Accept) button if the data is good or the “R” (Reject) button if it is poor quality data. In this test, the “T” button (to switch to the next channel) is irrelevant for the SE test with only one channel. 8. Repeat Step 7 until all the records are collected. 9. After all the records are collected, press the “2” to save the data or the “1” to exit without
saving. 10. To perform more SE/IR tests, repeat Steps 6 – 9. 11. Basic analysis tools included in the NDE-360 system are filter and exponential functions.
To set the filter, press on the “Select Filter” button and enter the cut off frequency for the low pass filter (typically 1,000 – 2,000 Hz).
To reject the data
To accept the data
Percentage full scale of the maximum amplitude of the signal
To setup the filter

24
Sonic Echo/Impulse Response (SE/IR)
www.olsoninstruments.com | www.olsonengineering.com
Then press on the Filter Data button to apply to current filter setup to the waveform. 12. The data can be recalled in the NDE-360 system by pressing the “File” button on the main
screen and then selecting Option 2. 13. The data files on the compact flash card can be moved to the analysis computer for post-
data analysis.

25
Sonic Echo/Impulse Response (SE/IR)
www.olsoninstruments.com | www.olsonengineering.com
4.0 WinSEIR SOFTWARE SETUP This section covers the steps required to install the WinSEIR software on a laptop or desktop computer from the supplied installation jump drive.
4.1 Prerequisite Software
Windows .Net Framework 4 is required for the WinSEIR software. The software is fully compatible with Windows XP, Vista and Windows 7 (32 or 64 bit).
4.2 Software Installation
1. Uninstall any previous version of WinSEIR.
2. Run WinSEIR Setup (located in WinSEIR Setup/Release). The default location for the
software installation is either ProgramFiles(x86)/OlsonInstruments/WinSEIR or ProgramFiles/OlsonInstruments/WinSEIR unless the user changes the location during the installation process. Note that the parameter.prm file will also be installed in the selected directory and “write protect” will be added to the parameter file. Therefore, the user needs to manually change the security setting of the parameter.prm file (see Step 3 below). Also note that the installation process may take several minutes. If .Net Framework 4 is not found during the installation process, the user will be prompted to install this prerequisite and the following web address will be prompted on the web browser: http://www.microsoft.com/en-us/download/details.aspx?id=17851
3. For Vista and Windows 7 operating systems, go into the application folder and locate
parameter.prm. Right click on parameter.prm and click on “Properties”. Go to the General tab and make sure that the “Read-only” box is unclicked. Then go to the Security tab and make sure that “Full control” is checked to allow write access to the file. See Figure 1 for the setup.
Step 3 is not required for the Windows XP operating system. i
Note that .Net Framework 4 Full Version is required. The .Net Framework 4 Client Profile is not compatible with this software. Internet web access is REQUIRED to complete the installation of this software if the .Net Framework 4 is not present on the target computer already.
i

26
Sonic Echo/Impulse Response (SE/IR)
www.olsoninstruments.com | www.olsonengineering.com
Figure 1 – General and Security Properties for parameter.prm
4.3 Software Updates
To update the software, completely uninstall the WinSEIR Setup software per Section 4.4 and re-install the new version of WinSEIR Setup.
4.4 Software Uninstallation
The following steps are required to uninstall the WinSEIR Software 1. Click on “Start/Settings/Control Panel” 2. Select “Add/Remove Programs” 3. Highlight WinSEIR Setup, select “Remove” 4. The uninstall process will begin automatically, removing all installed components including
the shortcut.

27
Sonic Echo/Impulse Response (SE/IR)
www.olsoninstruments.com | www.olsonengineering.com
5.0 WinSEIR SOFTWARE ANALYSIS
5.1 Start Program
Click on WinSEIR.exe in the application folder or on the desktop. The screen, as shown in Figure 2, will appear.
Figure 2 - Main Screen for WinSEIR Software
5.2 Open and Accept/Reject NDE-360 Data
1. Click on the “Open” button on the main screen (or go to “File/Open”) and select the data file
(.nde) downloaded from the NDE-360. The first record from all the channels will appear in the top plot box on the screen, as shown in Figure 3. The data parameters used to acquire the data will be highlighted in green and disabled. Note that these data parameters can not be changed during the analysis process. However, transducer type and calibration values can be changed during the data analysis.
2. Click on the “Accept” or “Reject” buttons to either include or exclude the current records in
the analysis. Once the first records (from all channels) are accepted, the current average trace of the data is calculated and displayed in the bottom plot box on the screen, and the next set of records are shown on the top screens, as shown in Figure 4. Once one record has been accepted, the software automatically calculates the shaft top and bottom with the shaft depth displayed in the caption on the bottom plot box, as shown in Figure 4.

28
Sonic Echo/Impulse Response (SE/IR)
www.olsoninstruments.com | www.olsonengineering.com
Figure 3 – Screen with the First SE Data Records (2 channels shown)
Figure 4 – Screen with the First Records Accepted
“Accept” to accept current record or “Reject” to reject current record or “Accept All” to accept all the records

29
Sonic Echo/Impulse Response (SE/IR)
www.olsoninstruments.com | www.olsonengineering.com
3. Repeat Step 2 until all the data are accepted or rejected. Note that the user can reject the records that were previously accepted by clicking on the “Subtract” button. The “Subtract” button automatically removes the previously accepted data from the average.
Once all the records are accepted/rejected (at least one record must be accepted), the software rearranges the plots so that the average waveform is presented in the top plot box and an approximate shape of the shaft is presented in the bottom plot box, as shown in Figure 5. It is possible to manually change the automatically picked shaft top and bottom. This is done by using the mouse to drag the cursor along the waveform to the desired location. It is also possible to select additional locations besides shaft top and shaft bottom (like a neck or bulb), but the user must first click on the shaft top, then the next location(s). To clear these additional picks, simply right click anywhere on the plot.
Figure 5 – Final Screen after all the Records are Processed (accepted/rejected)

30
Sonic Echo/Impulse Response (SE/IR)
www.olsoninstruments.com | www.olsonengineering.com
5.3 Impulse Response (IR) Analysis
The Impulse Response function (transfer function magnitude and coherence) is only available when the instrumented hammer is used as an impact source and the data from the instrumented hammer is saved. Note: The user must properly identify the hammer in the “Transducer Type” Menu in the bottom left portion of the screen. Once the software detects the presence of the instrumented hammer (force), the IR function is enabled after all the records have been accepted/rejected. Note that the IR function automatically pads and decimates the data (in the background) to increase the resolution in the frequency domain. To run the IR analysis, go to the main menu and select “IR Analysis Functions/Calculate and Display Impulse Response”. Then the transfer function magnitude and coherence will be calculated and displayed alongside the SE results, as shown in Figure 6. The transfer function magnitude is displayed in the top right plot box and the coherence is shown in the bottom right plot box. Use the mouse to manually pick the peaks in the frequency domain. Left click on the highest peak then repeat after each trough, moving from left to right. If the peaks are picked out of order, the depth calculation will be incorrect. To clear these additional picks, simply right click anywhere on the plot.
Figure 6 – Impulse Response Results

31
Sonic Echo/Impulse Response (SE/IR)
www.olsoninstruments.com | www.olsonengineering.com
5.4 Calibration Values
The calibration values are loaded from the NDE 360 data files into the WinSEIR application. If these values need to be corrected, simply type the correct calibration values into the calibration boxes on the left side of the screen. Note that a calibration database is built into the software and can be edited as needed (see Section 5.10). Once the correct calibration values are entered, these values are used in the analysis and the waveform plot(s) are updated, as shown in Figure 7. Note that if the WinSEIR application is installed within the Program Files or Program Files (x86) directories, edits or updates will not be allowed on the calibration database file.
Figure 7 – Average Waveform Plot with Correct Calibration Values
5.5 Filtering
Interactive filtering is implemented in this software. Filtering can greatly aid in the analysis of SE data, to help clarify echoes, especially deep echoes, and remove high-frequency noise from ringing rebar and other sources. Normally, a low-pass Butterworth filter is used, with the cutoff frequency set between 400 to 4000 Hz. The frequency selected will depend on the length of the shaft and the type of echo being examined. A low-frequency cutoff (1000 Hz or less) will bring out deep bottom echoes and eliminate ringing from rebar or shallow pile caps, but will mask out shallow echoes from necks or defects. A higher-frequency cutoff will allow the user to see shallow echoes, but strong shallow echoes may ring for a relatively long time in the record and mask the bottom echoes.

32
Sonic Echo/Impulse Response (SE/IR)
www.olsoninstruments.com | www.olsonengineering.com
We recommend that the user start with a relatively high frequency low-pass cutoff, and then use the convenient frequency filter slider bar to slowly lower the cutoff frequency to the point where the echo of interest is clearest without being filtered out. As the slider bar is moved, the data will be filtered live at each new frequency. Note that if the user moves the slider too fast, there may be a delay before the new data is displayed. As noted, a Butterworth filter is used. The type of pass-band can be selected with the top tool bar. The default pass-band filter for SE data is “Lowpass” which is the recommended filter. The frequencies are set using the marks on the slider bar just above the top plot box windows, as shown in Figure 8. There are three options for pass-band filtering:
• Lowpass – Passes the frequencies below the right mark. This type of pass-band is recommended for SE data analysis.
• Highpass – Passes the frequencies above the left mark. This type of pass-band is recommended for Spectral Analysis of Surface Waves or Impact Echo data analysis.
• Bandpass – Passes the frequencies between the left and right mark. This type of pass-band can be used for SE data analysis if there is interference from low frequency noise.
Figure 8 – Filtering
5.6 Concrete Velocity
The concrete velocity used for depth calculation is read from the value saved in the NDE-360 data file. If this velocity needs to be modified, simply enter the new velocity value in the “Velocity” box on the tool bar, as shown in Figure 9.
Figure 9 – Concrete Velocity

33
Sonic Echo/Impulse Response (SE/IR)
www.olsoninstruments.com | www.olsonengineering.com
5.7 Units
The units used in the program are the units saved in the NDE-360 data file. The units can be changed from Metric to English or vice versa during the analysis process. Click on the “Unit” box, as shown in Figure 10, to change the units.
Figure 10 – Units
5.8 Next Channel (Average Waveform Plot)
After the completion of the averaging process, click on the “Next Channel” arrow on the toolbar to view the average waveform for the next active channel, as shown in Figure 11. The average waveform and the approximate shaft shape (if applicable) plots will be updated.
Figure 11 – Next Channel
5.9 Amplification
The data can be amplified exponentially using the +/- buttons on the toolbar, as shown in Figure 12, to increase and decrease the amplification factor. This feature can make the bottom echo clearer. Note that the software automatically scales the data between the shaft top and bottom only (which may result in data beyond the indicated shaft bottom going off-screen).
Typical concrete velocity is 12,000 – 13,000 ft/sec or 3,600 – 4,000 m/s. Higher strength concrete may have a higher velocity. Young concrete (less than 7 days old) may have a slower velocity.
i

34
Sonic Echo/Impulse Response (SE/IR)
www.olsoninstruments.com | www.olsonengineering.com
Figure 12 – Amplification
5.10 Calibration Database
The software has a built-in database for the calibration values of the transducers. To edit the database, go to the Main Menu and select “General Functions/Enter Calibrations” and the applet, as shown in Figure 13, will appear on the screen. This applet will allow users to input new transducer calibration values into the database.
Figure 13 – Calibration Applet
5.11 Zoom In/Out
An Automatic Zoom In/Out feature is implemented in the software and allows the user to zoom in/out on the X axis. To manually zoom in/out, go to the Main Menu and select “Analysis Functions/Zoom In” or “Analysis Functions/Zoom Out”.

35
Sonic Echo/Impulse Response (SE/IR)
www.olsoninstruments.com | www.olsonengineering.com
5.12 Shaft Toe Detection
If the design depth of the shaft is known, the software can automatically detect the nearest echo to the shaft toe. Go to “Analysis Functions/Shaft Toe Detection” to enter the design depth of the shaft, as shown in Figure 14. If the design depth is not known, leave the depth blank and the software will automatically calculate the shaft toe based on the data.
Figure 14 – Design Depth
5.13 Open Next Data File
If the data filenames have a fixed alphabetical prefix and are numbered sequentially in the suffix, it is possible to scroll quickly through the data. Note that this is the normal way files are saved on the NDE-360. Use the buttons “Next File” and “Prev File” to quickly open the files, as shown in Figure 15.
Figure 15 – Quick File Opening

36
Sonic Echo/Impulse Response (SE/IR)
www.olsoninstruments.com | www.olsonengineering.com
6.0 WinSEIR SOFTWARE EXPORTING OPTIONS
6.1 Copy Image to the Clipboard
After all the records are accepted/rejected, the final top (average waveform) and bottom (approximate shaft shape) plots can be copied to the clipboard for easy pasting into reports or other documents. Go to “Edit/Copy Top Plot” or “Edit/Copy Bottom Plot” to copy the desired plot to the clipboard. The Impulse Response results (transfer function magnitude plot) can be copied to the clipboard by selecting “Edit/Copy IR Plot”.
6.2 Save Image to .jpg
After all the records are accepted/rejected, the final top (average waveform) and bottom (approximate shaft shape) plots can be saved to .jpg format. Go to “File/Save Top Plot” or “File/Save Bottom Plot” to save the desired plot in .jpg format. The Impulse Response results (transfer function magnitude plot) can be saved to .jpg format by selecting “File/Save IR Plot Image”.
6.3 Export Waveform to a Comma Separated Format
The raw waveform data can be exported to a text file readable by Excel, MatLab, or similar programs by going to the Main Menu and selecting “File/Export Raw Data to Comma Separated Format”.

37
Sonic Echo/Impulse Response (SE/IR)
www.olsoninstruments.com | www.olsonengineering.com
Related Peer Reviewed Papers
38
Sonic Echo/Impulse Response (SE/IR)
www.olsoninstruments.com | www.olsonengineering.com
NDT Diagnosis of Drilled Shaft Foundations
by
Larry D. Olson, P.E., Principal Engineer
Olson Engineering, Inc.
5191 Ward Road, Suite 1
Wheat Ridge, Colorado 80033-1905
Tel: 303/423-1212
Fax: 303/423-6071
E-Mail: [email protected]
Marwan F. Aouad, Ph.D., Project Manager
Olson Engineering, Inc.
5191 Ward Road, Suite 1
Wheat Ridge, Colorado 80033-1905
Tel: 303/423-1212
Fax: 303/423-6071
E-Mail: [email protected]
and
Dennis A. Sack, Project Manager
Olson Engineering, Inc.
5191 Ward Road, Suite 1
Wheat Ridge, Colorado 80033-1905
Tel: 303/423-1212
Fax: 303/423-6071
E-Mail: [email protected]
A paper prepared for presentation at the 1998 Annual Meeting of the Transportation
Research Board and for publication in the Transportation Research Record

39
Sonic Echo/Impulse Response (SE/IR)
www.olsoninstruments.com | www.olsonengineering.com
ABSTRACT
Number of words = 6590 (including 250 words for each figure)
Nondestructive methods based on propagation of sonic and ultrasonic waves are increasingly
being used in the United States and internationally for forensic investigations of existing structures and
for quality assurance of new construction. Of particular interest is the quality assurance of newly
constructed drilled shaft foundations. A large number of State Departments of Transportation specify
NDT testing of drilled shaft foundations, particularly for shafts drilled and placed under “wet”
construction conditions.
For quality assurance of drilled shaft foundations of bridges, the Crosshole Sonic Logging (CSL)
and Sonic Echo/Impulse Response (SE/IR) methods are routinely used. The CSL method requires access
tubes to be installed in the shaft prior to concrete placement. SE/IR measurements require that the top of
the shaft be accessible after concrete placement. Discussed in this paper are proper test setups,
specifications, and case studies to illustrate the advantages and disadvantages of each of these methods.
Presented also are recommendations for repair when a defect is identified in a drilled shaft foundation.
Based on our experience, the CSL method is more effective in locating defects than the SE/IR method.
CSL measurements are effective in determining anomalies and defects between two access tubes.
However, an accurate image of the defect cannot be determined from just a CSL test. The Crosshole
Tomography (CT) method uses multiple CSL logs with varying receiver locations to produce a 2-D
image of the defect, and thus a better characterization of the defect. The CT method is briefly discussed
in this paper along with presentation of one dataset obtained from a drilled shaft foundation. The CT

40
Sonic Echo/Impulse Response (SE/IR)
www.olsoninstruments.com | www.olsonengineering.com
method requires more time for data collection and analysis than the CSL method, and presently its use is
justified only for critical drilled shaft foundations.
Key Words: Crosshole Sonic Logging, Sonic Echo/Impulse Response, Tomography, Quality
Assurance, Drilled Shafts.
INTRODUCTION
Quality assurance of foundations, particularly drilled shaft foundations, is becoming an
important part of the foundation installation process to ensure a good foundation that can transfer the
applied loads to the surrounding soil or rock. Until the mid 1980's, quality assurance of driven piles and
drilled shafts in the USA was performed at selected shafts and used the Sonic Echo and Impulse
Response (SE/IR) test methods to identify anomalies or defects (Olson and Thompson, 1985; Davis and
Dunn, 1974). The SE/IR method relies on reflection events from a change in impedance. Although the
SE/IR method can be applied to identify defects, the method suffers from the following limitations: 1)
the strength of the echoes depends on the surrounding soil, 2) echoes are frequently too weak to be
distinguished when length to diameter ratios exceed 20:1, 3) the size and location of the defect cannot be
determined, 4) defects located below a major defect cannot be identified, 5) defects at or near the bottom
of the shaft cannot generally be identified, and 6) planned or unplanned diameter changes can appear to
be defects even if the diameter is acceptable.
The drawbacks associated with the SE/IR method have led to the search for other alternatives
and the development of the Crosshole Sonic Logging and Gamma-Gamma methods (Olson et. al, 1994)
to identify defects in drilled shaft foundations by use of cast-in-place access tubes. One of the

41
Sonic Echo/Impulse Response (SE/IR)
www.olsoninstruments.com | www.olsonengineering.com
advantages of the CSL method over the Gamma-Gamma method is that a fairly complete coverage of
the shaft conditions can be determined with the CSL method, while the Gamma-Gamma method
determines the shaft conditions around the installed tubes in a drilled shaft. In addition, CSL is generally
much faster to perform and does not use radioactive materials.
In this paper, the Crosshole Sonic Logging (CSL), Crosshole Tomography (CT) and Sonic
Echo/Impulse Response (SE/IR) methods are discussed along with case studies to illustrate the use of
each method. It should be mentioned that the CT method is not routinely applied to drilled shaft
foundations, and its application is limited to critical structures to produce a better image of defects
identified in CSL and SE/IR tests.
CROSSHOLE SONIC LOGGING METHOD
The CSL method was developed in the mid 1980's for quality assurance of drilled shaft
foundations, slurry walls and seal footings. The CSL method relies on direct transmission of
sonic/ultrasonic waves between access tubes placed in a drilled shaft prior to concrete placement. Figure
1 shows an illustration for a CSL test setup.
The number of access tubes per drilled shaft is dependent on the diameter of the shaft, typically 1
tube per 1 ft of diameter, and the tubes are installed around the perimeter of the shaft and tied to the
inside (or outside) of the cage of the shaft. The tubes are usually 38 to 50 mm (1.5 to 2.0 in.) inside
diameter schedule 40 steel or PVC pipe. Tube debonding from the surrounding concrete can occur at an
earlier time in PVC tube as compared to steel tubes. Most State DOT’s specify that CSL tests be

42
Sonic Echo/Impulse Response (SE/IR)
www.olsoninstruments.com | www.olsonengineering.com
performed in 10 days or less after concrete placement for PVC tubes and in 45 days or less for steel
tubes to avoid problems associated with tube debonding.
To perform a CSL test, two probes (hydrophones) are lowered to the bottom of two access tubes,
and are retrieved to the top of the shaft while CSL measurements are taken approximately every 50 mm
(2 in.). The ultrasonic wave pulser is controlled by a distance wheel to trigger the transmission of waves
at preselected vertical intervals. Automatic scanning of the collected records produces two plots, time
(or velocity) and energy, versus depth. Anomalies and defects between tested tubes are manifested by
time delays (or velocity decreases) and energy drops in the scanned CSL plot. Concrete velocities are
calculated by simply dividing the distance between the two tubes by the time required for the wave to
travel from the source hydrophone to the receiver hydrophone. CSL tests are typically performed
between all perimeter tubes to evaluate the concrete conditions of the outer part of the shaft and between
major diagonal tubes to evaluate the concrete conditions of the inner part of the shaft. Figure 2 shows an
illustration for the interpretation of a CSL log. NDT methods which could be used in conjunction with
the CSL method to better identify anomalous zones include Crosshole Tomography (CT), Singlehole
Sonic Logging (SSL), Gamma-Gamma Nuclear Density Logging, Downhole Sonic and/or Sonic
Echo/Impulse Response (SE/IR) tests. The CT and SE/IR methods are briefly discussed below.
CROSSHOLE TOMOGRAPHY METHOD
The Crosshole Tomography method uses the same equipment as the CSL method with more tests
being collected (many source and receiver locations). Once a defect is identified in CSL tests, CT tests
can be performed to produce an image of the defect between the test tubes. The CT tests are typically
performed at depths extending few feet below and above the defect zone as shown in Figure 3.

43
Sonic Echo/Impulse Response (SE/IR)
www.olsoninstruments.com | www.olsonengineering.com
Tomography is an inversion procedure that can provide for ultrasonic images of a concrete zone
from the observation of transmitted compressional or shear first arrival energy. The CT data is used to
obtain an image of the defect. The test region is first discretized into many cells with assumed slowness
values (inverse of velocity) and then the time arrivals along the test paths are calculated. The calculated
times are compared to the measured travel times and the errors are redistributed along the individual
cells using mathematical models. This process is continued until the measured travel times match the
assumed travel times within an assumed tolerance. Tomographic analysis was performed using two
series expansion algorithms with a curved ray analysis from geotomography. The tomographic analysis
presented herein was performed using a SIRT (Simultaneous Iterative reconstruction Technique,
Herman 1980) based analysis program developed as part of a research project sponsored by the National
Science Foundation to image defects in structural concrete (Olson et al, 1993).
SONIC ECHO / IMPULSE RESPONSE METHODS
Sonic Echo Test Method
The SE method is a low strain integrity test conducted from the surface. Test equipment includes
an impulse hammer (optional, an ordinary plastic tipped hammer) and an accelerometer (or geophone)
on the shaft top as shown in Figure 4. The impulse hammer has a built-in load cell that can measure the
force and duration of the impact (needed for IR tests). The test involves hitting the foundation top with
the hammer to generate wave energy that travels down the foundation. The wave reflects off
irregularities and/or the bottom of the foundation and travels up the foundation to the foundation top.
The receiver measures the vibration response of the foundation to each impact. The signal analyzer or
PC processes and displays the hammer and receiver outputs. Foundation integrity is evaluated by

44
Sonic Echo/Impulse Response (SE/IR)
www.olsoninstruments.com | www.olsonengineering.com
identifying and analyzing the arrival times, direction, and amplitude of reflections measured by the
receiver in time. The receiver output is usually integrated (if an accelerometer is used) and exponentially
amplified with time (Koten and Middendorp, 1981) to enhance weak reflections. Digital filtering with a
low-pass filter of about 2,000 Hz is usually applied to eliminate high frequency noise. In some cases,
where reflections are difficult to identify, an impedance imaging procedure is used to obtain a 2-D
image of the shaft (Paquet, 1991).
Impulse Response (IR) Test Method
The IR method is also an echo test and uses the same test equipment as the SE method. The test
procedures are similar to the SE test procedures, but the data processing is different. The IR method
involves frequency domain data processing, i.e., the vibrations of the foundation measured by the
receiver are processed with Fast Fourier Transform (FFT) algorithms to generate transfer functions for
analyses. The coherence of the impulse hammer impact and accelerometer receiver response data versus
frequency is calculated to indicate the data quality. A coherence near 1.0 indicates good quality data. In
the IR records the linear transfer function amplitude is in velocity/force on the vertical axis (mobility)
and frequency in Hz on the horizontal axis.
SE/IR Analyses
Analysis of the integrity of a foundation for both the SE and IR methods is based on the
identification and evaluation of reflections. However, test results are analyzed in the time domain for the
SE and in the frequency domain for the IR method. The reflections are shown as resonant frequency
peaks in the frequency domain for IR test data. The two methods complement each other because the
identifications of reflections are sometimes clearer in either the time or the frequency domain.

45
Sonic Echo/Impulse Response (SE/IR)
www.olsoninstruments.com | www.olsonengineering.com
The SE and IR test methods are sensitive to changes in the shaft impedance (shaft concrete area
* velocity * mass density where mass density equals unit weight divided by gravity), which cause the
reflections of the compression wave energy. Compression wave energy (hammer impact energy) reflects
differently from increased shaft impedance than from decreased shaft impedance. This phenomenon
allows the type of reflector to be identified as follows. Soil intrusions, honeycomb, breaks, cold joints,
poor quality concrete and similar defects (referred to herein as a neck) are identified as reflections that
correspond to a decrease in the shaft impedance. Increases in the shaft cross-section or the competency
of surrounding materials (referred to herein as a bulb) are identified as reflections corresponding to
increases in the shaft impedance. A decrease in impedance is indicated by a downward initial break of a
reflection event in an SE record and frequency peaks positioned in a record such that a peak could be
extrapolated to be near 0 Hz in the mobility plot. Conversely, an increase in impedance is identified by
an upward initial break for an SE reflector and frequency peaks positioned in an IR record such that a
trough could be extrapolated to be near 0 Hz in the mobility plot.
CASE STUDIES
Discussed below are results from CSL and CT tests performed by Olson Engineering on two
drilled shaft foundations in California. Also discussed are results from CSL and SE/IR tests performed
on a drilled shaft foundation in New Mexico.
The CSL results between tube pair 1-4 of the first shaft in California are presented in Figure 5. A
significant delay in arrival times of compression waves and a significant drop in energy were observed
in this CSL log at depths ranging from 2.5 to 3.4 m (8.3 to 11.2 ft) below the top of the shaft. Although

46
Sonic Echo/Impulse Response (SE/IR)
www.olsoninstruments.com | www.olsonengineering.com
the anomaly depth is well identified in Figure 5, the exact location of the defect between tubes 1 and 4
cannot be determined. For a better characterization of the anomaly indicated in Figure 5, a tomograhic
dataset was obtained by Olson Engineering. For this dataset, the source was pulled from a depth of 5.5
m (18 ft) below the shaft top and ending at the top of the tubes with the receiver moved at fixed interval
locations of 57 mm (2.25 in.). A velocity tomogram between tube pair 1-4 is presented in Figure 6. The
anomalous zone in Figure 6 is represented as the low-velocity area (light area) which extends from a
depth of 2.8 m (9.3 ft) to a depth of 3.5 m (11.6 ft) below the top of the shaft. The apparent low-velocity
regions in the middle at the top and bottom of Figure 6 are artifacts resulting from a low ray density in
these areas (see Figure 6 for the distribution of the ray densities). Figure 6 clearly shows that the defect
occupies the entire distance between tubes 1 and 4, which cannot be inferred from the CSL results. This
was confirmed by subsequent excavation.
CSL results performed by Olson Engineering on a drilled shaft foundation at the Sargent Bridge
on Highway 101 in Hollister, California identified a defect at depths ranging from 4.6 to 5.2 m (15 to 17
ft). The anomaly was more severe between tube pair 1-3 than between other tube pairs (Figure is similar
to Figure 5 and not shown here). This anomaly was further confirmed by Gamma-Gamma testing and
destructive coring showed it to be a soil intrusion. Tomograhic data was obtained between tube pair 1-3
with the source pulled from 5.8 m (19 ft) below the shaft top to the shaft top and the receiver fixed at 49
locations of 57-mm (2.25-in.) separation. Figure 7 shows the velocity tomogram obtained from this
tomographic dataset along with the corresponding ray density plot. The anomalous zone in Figure 7 is
represented as the low-velocity area which extends from a depth of 4.6 m (15 ft) to a depth of 5.2 m (17
ft) below the top of the shaft. Figure 7 shows that the defect is centered around the tubes with good

47
Sonic Echo/Impulse Response (SE/IR)
www.olsoninstruments.com | www.olsonengineering.com
quality concrete in the interior between the two tubes as opposed to the defect shown in Figure 6 which
extended through the entire distance between the two tubes.
The CSL results between tube pair 1-2 of a shaft tested in New Mexico are presented in Figure 8.
A significant delay in arrival times of compression waves and a significant drop in energy were
observed in this CSL log at depths ranging from 10.4 to 11.6 m (34 to 38 ft) below the top of the shaft.
The CSL results between other tubes showed similar anomalies at the same depths. Another commonly
used display for CSL data is the banded time versus depth (also known as Z-axis modified). In this
display, a line is plotted for each point of each record for which the positive or negative signal peaks are
greater than the threshold value. This results in a series of bands vertically down the plot for a shaft with
no defects. A defect will be seen as a disappearance of the bands at the defect depth. Figure 9 shows this
type of display for the shaft tested in New Mexico with the negative peaks as the black bands. Sonic
Echo/Impulse Response tests were performed on the same shaft. Echoes from a depth of 11 m (36 ft)
were identified in the SE records as shown in Figure 10. The upper trace in Figure 10 represents the
accelerometer output and the lower trace represents the upper trace after integration (to velocity) and
exponential amplification. The IR results showed an echo from a depth of 10.8 m (35.3 ft) as shown in
Figure 11. The upper trace in Figure 11 represents the coherence function to reflect data quality and the
lower trace is the mobility function which is equal to velocity divided by pound force. No echoes from
the bottom of the shaft at a depth of 18.9 m (62 ft) were identified in the SE/IR records. It was then
concluded that the encountered defect is a major defect since bottom echoes could not be identified.
Note also the good agreement between the CSL and SE/IR results. If there were additional defects below
the major encountered defect at a depth of 11 m (36 ft), they most likely would not have been identified
by the SE/IR method, but could easily have been identified with the CSL method.

48
Sonic Echo/Impulse Response (SE/IR)
www.olsoninstruments.com | www.olsonengineering.com
SOLUTIONS TO ENCOUNTERED DEFECTS
When defects are encountered in drilled shafts, the design engineer is informed of the problem.
The structural and geotechnical engineers usually check the axial and lateral capacity of the shaft after
considering the size, depth and severity of identified defects plus actual load test results (if any),
concrete strengths and volumes with appropriate safety factors. Based on the new calculations, the shaft
is either accepted or rejected.
For shallow defects, the most common procedure is to excavate around the perimeter of the shaft
until the defect area is exposed and repair procedures take place. For deep defects which still influence
the capacity of the shaft, coring is usually performed and grout is injected using the coreholes. In other
circumstances, two substitute shafts are drilled next to the defect shaft so that sufficient load can be
transferred to the new shafts via a tie beam such that the defect shaft may carry no loads or reduced
loads safely.
CONCLUSIONS
The CSL method is an excellent nondestructive method for identifications of anomalous zones in
drilled shaft foundations. Many State DOT's are moving towards specifications for CSL tests on new
construction of drilled shaft foundations. The method is effective at locating defects between tube pairs,
defect depths and extent, but not exact locations of defects between tube pairs.
The CT can be used as a complimentary method to the CSL method to determine a better
characterization of the defect. Because of the much greater time required to perform tomographic
analyses, the method may not gain popularity and its application will be limited to the more critical

49
Sonic Echo/Impulse Response (SE/IR)
www.olsoninstruments.com | www.olsonengineering.com
structures. The SE/IR method can be used in conjunction with the CSL method to determine the nature
of encountered anomalies. A good application for the SE/IR method is when the identified anomalies in
CSL testing are due to tube debonding and do not represent any defects in the drilled shafts. An SE/IR
test is usually performed and if no reflections are identified in the areas where tube debonding occurred
in CSL testing, the shaft is considered to be sound.

50
Sonic Echo/Impulse Response (SE/IR)
www.olsoninstruments.com | www.olsonengineering.com
REFERENCES
Olson, L.D. and R.W. Thompson, 1985. “Case Histories Evaluation of Drilled Pier Integrity by
the Stress Wave Propagation Method,” Proceedings: Drilled Piers and Caisson II, American Society of
Civil Engineers Spring Convention, Denver, Colorado.
Davis, A.G. and C.S. Dunn, 1974. "From Theory to Field Experience with the Nondestructive
Vibration Testing of Piles," Proceedings of the Institution of Civil Engineers Part 2, 57: 571-593.
Olson, L.D., M. Lew, G.C. Phelps, K.N. Murthy, and B.M. Ghadiali, 1994. "Quality assurance of
Drilled Shaft Foundations with Nondestructive Testing," Proceedings of the FHWA Conference on
Deep Foundation, Orlando, Florida.
Herman, G.T, 1980. "Image Reconstruction from Projections, the Fundamentals of
Computerized Tomography," Academic Press, Inc.
Olson, L.D., F. Jalinoos, M.F. Aouad, and A.H. Balch, 1993. “Acoustic Tomography and
Reflection Imaging for Nondestructive Evaluation of Structural Concrete,” NSF Phase I Final Report
(Award # 9260840), SBIR Industrial Innovation Interface Division, Washington, D.C.
Koten, H. Van and P. Middendorp, 1981. “Testing of Foundation Piles,” HERON, Joint
Publication of the Department of Civil Engineering of Delft University of Technology, Delft, The
Netherlands, and Institute TNO for Building Materials and Sciences, Rigswijk (ZH), The Netherlands,
Vol. 26, No. 4.

51
Sonic Echo/Impulse Response (SE/IR)
www.olsoninstruments.com | www.olsonengineering.com
Paquet, J., 1991. “Une Nouvelle Orientation Dams le Controle D’Integute Des Pieux par
Sollicitation Dynamique: Le Profil D’Inpedana,”, Frud Colloque International, Foundation Profondes,
Paris, pp 1-10 (in French).
LIST OF FIGURES
Figure 1- Crosshole Sonic Logging Test Setup.
Figure 2- Example Crosshole Sonic Log.
Figure 3- Crosshole Tomography Setup between Two Tubes of a Drilled Shaft.
Figure 4- Sonic Echo/Impulse Response Test Method.
Figure 5- CSL Results Between Tubes 4-1 in a Drilled Shaft in California.
Figure 6- Velocity Tomography Results from the First Drilled Shaft in California.
Figure 7- Velocity Tomography Results from the Second Drilled Shaft, Hollister, California.
Figure 8- CSL Results Between Tubes 1-2 in a Drilled Shaft in New Mexico.
Figure 9- Alternative Banded Time Display of CSL Results Between Tubes 1-2 in a Drilled
Shaft in New Mexico.
Figure 10- Sonic Echo Test Results, Drilled Shaft in New Mexico.
Figure 11- Impulse Response Test Results, Drilled Shaft in New Mexico.

52
Sonic Echo/Impulse Response (SE/IR)
www.olsoninstruments.com | www.olsonengineering.com
Figure 1 — Crosshole Sonic Logging Test Setup

53
Sonic Echo/Impulse Response (SE/IR)
www.olsoninstruments.com | www.olsonengineering.com
Figure 2 — Example Crosshole Sonic Log

54
Sonic Echo/Impulse Response (SE/IR)
www.olsoninstruments.com | www.olsonengineering.com
Figure 3 — Crosshole Tomography Setup between Two Tubes of a Drilled Shaft

55
Sonic Echo/Impulse Response (SE/IR)
www.olsoninstruments.com | www.olsonengineering.com
Figure 4 — Sonic Echo/Impulse Response Test Method

56
Sonic Echo/Impulse Response (SE/IR)
www.olsoninstruments.com | www.olsonengineering.com
Figure 5 — CSL Results Between Tubes 4-1 in a Drilled Shaft in California

57
Sonic Echo/Impulse Response (SE/IR)
www.olsoninstruments.com | www.olsonengineering.com
Figure 6 — Velocity Tomography Results from the First Drilled Shaft in California

58
Sonic Echo/Impulse Response (SE/IR)
www.olsoninstruments.com | www.olsonengineering.com
Figure 7 — Velocity Tomography Results from the Second Drilled Shaft, Hollister, California

59
Sonic Echo/Impulse Response (SE/IR)
www.olsoninstruments.com | www.olsonengineering.com
Figure 8 — CSL Results Between Tubes 1-2 in a Drilled Shaft in New Mexico

60
Sonic Echo/Impulse Response (SE/IR)
www.olsoninstruments.com | www.olsonengineering.com
Figure 9 — Alternative Banded Time Display of CSL Results Between Tubes 1-2 in a Drilled Shaft in New Mexico

61
Sonic Echo/Impulse Response (SE/IR)
www.olsoninstruments.com | www.olsonengineering.com
Figure 10 — Sonic Echo Test Results, Drilled Shaft in New Mexico
The lower trace shown is the same data as the upper trace after it has been integrated and
exponentially amplified.
T1 = 6 ms T2 = 12 ms
Compression Wave Velocity = 3658 m/sec (12,000 ft/sec)
Depth of Reflector = VC * T1/2 = 3658 * 0.006/2 = 11 m (36 ft)
The reflection is from an anomaly located at about 11 m below the shaft top
Second Echo at 12 ms
First Echo at 6 ms
62
Sonic Echo/Impulse Response (SE/IR)
www.olsoninstruments.com | www.olsonengineering.com
∆f =170 Hz
∆f =170 Hz
∆f =170 Hz
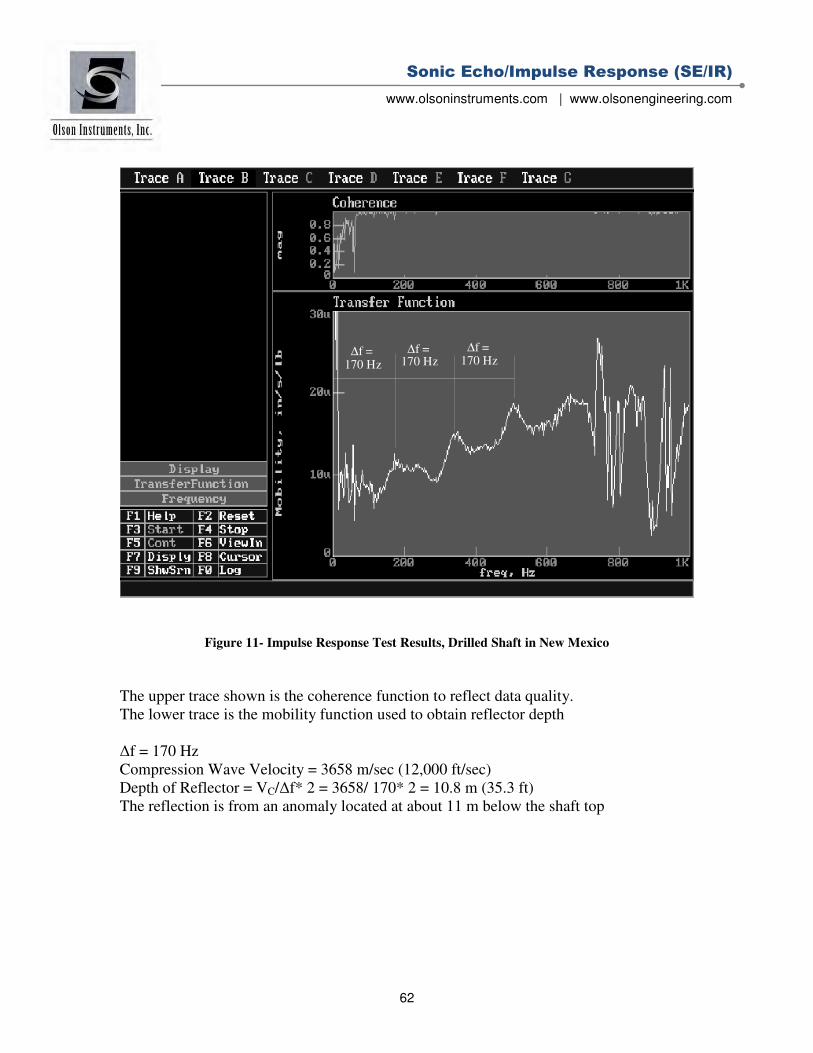
Figure 11- Impulse Response Test Results, Drilled Shaft in New Mexico
The upper trace shown is the coherence function to reflect data quality.
The lower trace is the mobility function used to obtain reflector depth
∆f = 170 Hz
Compression Wave Velocity = 3658 m/sec (12,000 ft/sec)
Depth of Reflector = VC/∆f* 2 = 3658/ 170* 2 = 10.8 m (35.3 ft)
The reflection is from an anomaly located at about 11 m below the shaft top