Song-induced ZENK Gene Expression in Auditory Pathways of ... · Claudio V. Mello’ and David F....
15
The Journal of Neuroscience, November 1994, 14(11): 6652-6666 Song-induced ZENK Gene Expression in Auditory Pathways of Songbird Brain and Its Relation to the Song Control System Claudio V. Mello’ and David F. Clayton2 ‘Laboratory of Animal Behavior, The Rockefeller University, New York, New York 10021 and *Department of Cell and Structural Biology, University of Illinois, Urbana, Illinois 61801 The ZENK gene encodes a zinc-finger-containing transcrip- tional regulator and can be rapidly activated in songbird brain by presentation of birdsong (Mello et al., 1992). Here we map the areas of the songbird forebrain that show this genomic response to birdsong, using in situ hybridization. After 30 min of song presentation ZENK mRNA levels reach a peak in the caudomedial telencephalon, in areas adjacent to or closely related with primary auditory structures. These areas include subfields of field L (Ll and L3), the caudomedial neostriatum (NCM), the caudomedial hyperstriatum ventrale (CMHV) anterior to field L, the caudal paleostriatum, and two field L targets, HVC shelf and RA cup. In contrast, ZENK induction is absent in some areas that show a response to song by other measures and where ZENK induction might have been expected. These include the direct thalamo-re- cipient field L subfield L2, and the nuclei of the circuit in- volved in the acquisition and production of learned song. These results demonstrate that ZENK induction following song presentation occurs only in a subset of areas physi- ologically activated by song, and draw attention to areas previously unsuspected as related to processing of complex auditory stimuli. Based on what is known about ZENK func- tion in mammalian systems (Christy et al., 1989; Cole et al., 1989; Wisden et al., 1990), we speculate that areas revealed by ZENK induction might correspond to sites where critical neuronal modifications occur in response to birdsong pre- sentation, possibly leading to the formation of song-related memories. [Key words: song control circuit, birdsong, immediate-ear- ly gene, ZENK, field L, NCM] Songbirdshave emerged,in the last 3 decades, as a powerful systemto study the mechanisms by which experience leadsto the modification of behaviors. Birds must hear and remember songs from other individuals in order to perform various tasks essential for their survival and reproduction, suchassong leam- ing, territorial defense, and courtshipbehavior (Kroodsma, 1976; received Nov. 16, 1993; revised Apr. 19, 1994; accepted Apr. 27, 1994. We gratefully acknowledge the unfailing support and continual inspiration pro- vided by Fernando Nottebohm over many years; without his generous and in- quisitive spirit, this marriage of molecular biology and neuroethology never would have proceeded. We also thank Fernando Nottebohm for providing birds from the Rockefeller University Field Research Center, with partial support of a grant from the National Institutes of Health (DCO0182). Specific grant support for the experiments presented here was provided to D.F.C. by the Whitehall Foundation and the NIH (NS25742). Correspondence should be addressed to Claudio V. Mello, Laboratory ofAnimal Behavior, The Rockefeller University, 1230 York Avenue, New York, NY, 1002 1. Copyright 0 1994 Society for Neuroscience 0270-6474/94/146652-l 5$05,00/O Marler and Peters, 1977; Welty and Baptista, 1988; Godard, 199 1). Considerable progress hasbeenachieved in defining the neural substrateof normal singing behavior by usinga combi- nation of brain lesions, electrophysiologicalrecordingsand an- atomical tract-tracing techniques.A series of distinct intercon- nected brain nuclei is necessary for normal song production (Nottebohm et al., 1976, 1982); theseinclude a neostriatal nu- cleus, HVC (high vocal center), an archistriatal nucleus to which HVC projects (RA or robustus archistriatalis), and RA’s pro- jections onto the motoneurons of the XII cranial nerve that innervate the syrinx, the vocal organ of songbirds. An alternative pathway leading from HVC to RA includes a series of paleo- striatal, thalamic, and neostriatal nuclei, and seems to be es- sentialfor song learning, but not necessarily for song production in adults (Bottjer et al., 1984; Sohrabji et al., 1990; Scharff and Nottebohm, 199 1). Various of these “song control nuclei” un- dergo anatomical changes associated with the development of song production in juveniles (Konishi and Akutagawa, 1985; Nordeen and Nordeen, 1988) and with subsequent seasonal changes in singingbehavior in species such as the canary (Not- tebohm, 1981, 1989; Nottebohm et al., 1986; Alvarez-Buylla et al., 1990). Despite considerable progress in understanding songproduc- tion, relatively little is known about the neural circuitry re- sponsible for song perception and discrimination, or for the formation of memories related to the songs the bird hears. An- atomical studies haverevealed that the ascending auditory path- ways in birds share many homologieswith mammalsand in- clude the midbrain nucleusMLd (homolog of the mammalian inferior colliculus) and the thalamic nucleus Ov (homolog of the medial geniculate;see Karten, 1967, 1968).Projections from Ov then reach the telencephalon through the primary auditory projection area, field L (Karten, 1968; Kelley and Nottebohm, 1979). However, the anatomy and function of higher auditory processing stations in the avian telencephalonis poorly under- stood. Recent studiesof field L cytoarchitectonic organization in songbirds,for example, reveal that it is a complex structure consisting of various subdivisions whose specific connections and functions are not yet well defined (Fortune and Margoliash, 1992a). Metabolic studies and electrophysiological recordings have demonstrated that units in the avian field L have a ton- otopic organization and show low selectivity to complex audi- tory stimuli (D. Bonke et al., 1979; Mtiller and Leppelsack, 1985; Mtiller and Scheich, 1985); auditory responses with a higher selectivity for complex stimuli have been describedin areas adjacentto and receiving an input from field L, for instance the caudomedial HV (Mtiller and Leppelsack, 1985). Initial studieson field L connectivity in songbirds revealed projections to the shelf and cup areas immediately adjacentto
Transcript of Song-induced ZENK Gene Expression in Auditory Pathways of ... · Claudio V. Mello’ and David F....

The Journal of Neuroscience, November 1994, 14(11): 6652-6666
Song-induced ZENK Gene Expression in Auditory Pathways of Songbird Brain and Its Relation to the Song Control System
Claudio V. Mello’ and David F. Clayton2
‘Laboratory of Animal Behavior, The Rockefeller University, New York, New York 10021 and *Department of Cell and Structural Biology, University of Illinois, Urbana, Illinois 61801
The ZENK gene encodes a zinc-finger-containing transcrip- tional regulator and can be rapidly activated in songbird brain by presentation of birdsong (Mello et al., 1992). Here we map the areas of the songbird forebrain that show this genomic response to birdsong, using in situ hybridization. After 30 min of song presentation ZENK mRNA levels reach a peak in the caudomedial telencephalon, in areas adjacent to or closely related with primary auditory structures. These areas include subfields of field L (Ll and L3), the caudomedial neostriatum (NCM), the caudomedial hyperstriatum ventrale (CMHV) anterior to field L, the caudal paleostriatum, and two field L targets, HVC shelf and RA cup. In contrast, ZENK induction is absent in some areas that show a response to song by other measures and where ZENK induction might have been expected. These include the direct thalamo-re- cipient field L subfield L2, and the nuclei of the circuit in- volved in the acquisition and production of learned song. These results demonstrate that ZENK induction following song presentation occurs only in a subset of areas physi- ologically activated by song, and draw attention to areas previously unsuspected as related to processing of complex auditory stimuli. Based on what is known about ZENK func- tion in mammalian systems (Christy et al., 1989; Cole et al., 1989; Wisden et al., 1990), we speculate that areas revealed by ZENK induction might correspond to sites where critical neuronal modifications occur in response to birdsong pre- sentation, possibly leading to the formation of song-related memories.
[Key words: song control circuit, birdsong, immediate-ear- ly gene, ZENK, field L, NCM]
Songbirds have emerged, in the last 3 decades, as a powerful system to study the mechanisms by which experience leads to the modification of behaviors. Birds must hear and remember songs from other individuals in order to perform various tasks essential for their survival and reproduction, such as song leam- ing, territorial defense, and courtship behavior (Kroodsma, 1976;
received Nov. 16, 1993; revised Apr. 19, 1994; accepted Apr. 27, 1994.
We gratefully acknowledge the unfailing support and continual inspiration pro- vided by Fernando Nottebohm over many years; without his generous and in- quisitive spirit, this marriage of molecular biology and neuroethology never would have proceeded. We also thank Fernando Nottebohm for providing birds from the Rockefeller University Field Research Center, with partial support of a grant from the National Institutes of Health (DCO0182). Specific grant support for the experiments presented here was provided to D.F.C. by the Whitehall Foundation and the NIH (NS25742).
Correspondence should be addressed to Claudio V. Mello, Laboratory ofAnimal Behavior, The Rockefeller University, 1230 York Avenue, New York, NY, 1002 1. Copyright 0 1994 Society for Neuroscience 0270-6474/94/146652-l 5$05,00/O
Marler and Peters, 1977; Welty and Baptista, 1988; Godard, 199 1). Considerable progress has been achieved in defining the neural substrate of normal singing behavior by using a combi- nation of brain lesions, electrophysiological recordings and an- atomical tract-tracing techniques. A series of distinct intercon- nected brain nuclei is necessary for normal song production (Nottebohm et al., 1976, 1982); these include a neostriatal nu- cleus, HVC (high vocal center), an archistriatal nucleus to which HVC projects (RA or robustus archistriatalis), and RA’s pro- jections onto the motoneurons of the XII cranial nerve that innervate the syrinx, the vocal organ of songbirds. An alternative pathway leading from HVC to RA includes a series of paleo- striatal, thalamic, and neostriatal nuclei, and seems to be es- sential for song learning, but not necessarily for song production in adults (Bottjer et al., 1984; Sohrabji et al., 1990; Scharff and Nottebohm, 199 1). Various of these “song control nuclei” un- dergo anatomical changes associated with the development of song production in juveniles (Konishi and Akutagawa, 1985; Nordeen and Nordeen, 1988) and with subsequent seasonal changes in singing behavior in species such as the canary (Not- tebohm, 198 1, 1989; Nottebohm et al., 1986; Alvarez-Buylla et al., 1990).
Despite considerable progress in understanding song produc- tion, relatively little is known about the neural circuitry re- sponsible for song perception and discrimination, or for the formation of memories related to the songs the bird hears. An- atomical studies have revealed that the ascending auditory path- ways in birds share many homologies with mammals and in- clude the midbrain nucleus MLd (homolog of the mammalian inferior colliculus) and the thalamic nucleus Ov (homolog of the medial geniculate; see Karten, 1967, 1968). Projections from Ov then reach the telencephalon through the primary auditory projection area, field L (Karten, 1968; Kelley and Nottebohm, 1979). However, the anatomy and function of higher auditory processing stations in the avian telencephalon is poorly under- stood. Recent studies of field L cytoarchitectonic organization in songbirds, for example, reveal that it is a complex structure consisting of various subdivisions whose specific connections and functions are not yet well defined (Fortune and Margoliash, 1992a). Metabolic studies and electrophysiological recordings have demonstrated that units in the avian field L have a ton- otopic organization and show low selectivity to complex audi- tory stimuli (D. Bonke et al., 1979; Mtiller and Leppelsack, 1985; Mtiller and Scheich, 1985); auditory responses with a higher selectivity for complex stimuli have been described in areas adjacent to and receiving an input from field L, for instance the caudomedial HV (Mtiller and Leppelsack, 1985).
Initial studies on field L connectivity in songbirds revealed projections to the shelf and cup areas immediately adjacent to
The Journal of Neuroscience, November 1994, f4(11) 6653
nuclei HVC and RA, respectively (Kelley and Nottebohm, 1979) suggesting a pathway for auditory information to reach the nu- clei that control song production. Because these nuclei are an- atomically well defined and have an obvious function in song behavior, several studies have been directed at testing the hy- pothesis that these song control centers also have a role in song perception and discrimination. From the work of a number of individuals, it is now apparent that selective electrophysiological responses can be evoked by the sound of specific songs at various levels throughout the song control pathway, all the way to the syringeal musculature (Katz and Gurney, 1981; Margoliash, 1983, 1986; Williams and Nottebohm, 1985; Doupe and Kon- ishi, 1991; Margoliash and Fortune, 1992; Vicario and Yohai, 1993). The identification of these auditory responses confirms that the song control pathway receives auditory input and may be tuned to specific song patterns. However, it does not yet establish a functional role for these responses, nor does it es- tablish whether the response specificity arises within the song control pathway or in other auditory processing centers that may ultimately impinge upon the song control pathway.
More suggestive evidence that the song control nuclei have a function in song perception and behavioral modification has been provided by Brenowitz (1991) who showed that lesions directed at HVC will disrupt the selectivity of the behavioral response of females to conspecific song. However, these “HVC” lesions were not limited to HVC proper but also included sur- rounding neo- and hyperstriatum, areas that could also be in- volved in auditory processing and perception (B. A. Bonke et al., 1979; Kelley and Nottebohm, 1979; Saini and Leppelsack, 1981; Fortune and Margoliash, 1992; Mello et al., 1992). Fur- thermore, behavioral responses by females to conspecific song can be elicited in species in which females lack a complete song control circuit, such as zebra finches (Clark and Nottebohm, 1990). Thus, it seems likely that important aspects of song per- ception may be mediated by areas outside the motor pathway controlling song production.
A significant barri& to further studies of the neural circuitry responsible for song perception or discrimination is the lack of an adequate methodology. Studies based on brain lesioning are limited by the technical challenges of placing spatially confined lesions, and are only meaningful in the context of information provided by anatomical and electrophysiological methods. Studies based on conventional anatomical and electrophysio- logical techniques are challenged by the complexity of brain areas involved in higher auditory processing (presumably ho- mologous to parts of the mammalian sensory and association cortices) and by the difficulties of recording from awake, freely behaving birds.
A new approach for mapping brain regions responsive to song, that circumvents some of the limitations of these other con- ventional techniques, has recently been afforded by our obser- vation that exposure to tape-recorded birdsong causes a rapid increase in a specific mRNA (“ZENK”) in the forebrain of ca- naries and zebra finches (Mello et al., 1992). The ZENK mRNA encodes a protein that is believed to function in the transcrip- tional regulation of other genes (Milbrandt, 1987; Christy et al., 1988, 1989; Lemaire et al., 1988; Sukhatme et al., 1988) and its induction may represent an early step in a mechanistic cas- cade leading to long-term cellular changes underlying learning and memory (Goelet et al., 1986). The activation of this gene following song occurs in relatively discrete portions of the song- bird brain. In at least one of these areas, the caudomedial neo-
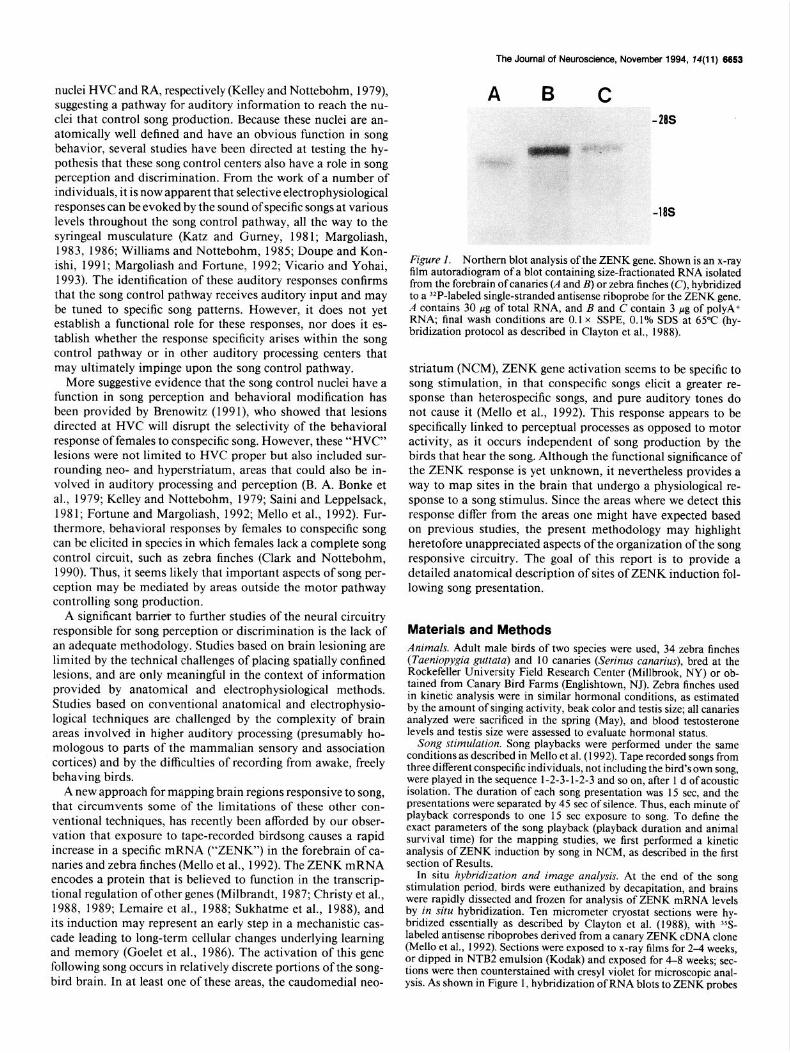
Figure 1. Northern blot analysis of the ZENK gene. Shown is an x-ray film autoradiogram of a blot containing size-fractionated RNA isolated from the forebrain of canaries (A and B) or zebra finches (C), hybridized to a 32P-labeled single-stranded antisense riboprobe for the ZENK gene. A contains 30 wug, of total RNA, and B and C contain 3 ue of polyA+ RNA, final wash conditions are 0.1 x SSPE, 0.1% SDS’it 65°C (hy- bridization protocol as described in Clayton et al., 1988).
striatum (NCM), ZENK gene activation seems to be specific to song stimulation, in that conspecific songs elicit a greater re- sponse than heterospecific songs, and pure auditory tones do not cause it (Mello et al., 1992). This response appears to be specifically linked to perceptual processes as opposed to motor activity, as it occurs independent of song production by the birds that hear the song. Although the functional significance of the ZENK response is yet unknown, it nevertheless provides a way to map sites in the brain that undergo a physiological re- sponse to a song stimulus. Since the areas where we detect this response differ from the areas one might have expected based on previous studies, the present methodology may highlight heretofore unappreciated aspects of the organization of the song responsive circuitry. The goal of this report is to provide a detailed anatomical description of sites of ZENK induction fol- lowing song presentation.
Materials and Methods Animals. Adult male birds of two species were used, 34 zebra finches (Taeniopygiq guttata) and 10 canahes (Serinus can&us), bred at the Rockefeller Universitv Field Research Center (Millbrook. NY) or ob- tained from Canary Bird Farms (Englishtown, hJ). Zebra’finches used in kinetic analysis were in similar hormonal conditions, as estimated by the amount of singing activity, beak color and testis size; all canaries analyzed were sacrificed in the spring (May), and blood testosterone levels and testis size were assessed to evaluate hormonal status.
Song stimulation. Song playbacks were performed under the same conditions as described in Mello et al. (1992). Tape recorded songs from three different conspecific individuals, not including the bird’s own song, were played in the sequence 1-2-3-l-2-3 and so on, after 1 d of acoustic isolation. The duration of each song presentation was 15 set, and the presentations were separated by 45 set of silence. Thus, each minute of playback corresponds to one 15 set exposure to song. To define the exact parameters of the song playback (playback duration and animal survival time) for the mapping studies, we first performed a kinetic analysis of ZENK induction by song in NCM, as described in the first section of Results.
In situ hybridization and image analysis. At the end of the song stimulation period, birds were euthanized by decapitation, and brains were rapidly dissected and frozen for analysis of ZENK mRNA levels by in situ hybridization. Ten micrometer cryostat sections were hy- bridized essentially as described by Clayton et al. (1988), with ?S- labeled antisense riboprobes derived from a canary ZENK cDNA clone (Mello et al., 1992). Sections were exposed to x-ray films for 2-4 weeks, or dipped in NTB2 emulsion (Kodak) and exposed for 4-8 weeks; sec- tions were then counterstained with cresyl violet for microscopic anal- ysis. As shown in Figure 1, hybridization of RNA blots to ZENK probes

6654 Mello and Clayton l ZENK Expression in the Songbird Brain after Song
3.5
p 3.0 1
0
0
: a
0
0 10 20 30 40 50 60 70
SURVIVAL TIME (min.) Figure2. Time course ofZENK mRNA induction after song playback. ZENK n-fold induction in the caudomedial neostriatum (NCM) ofzebra finches is plotted as a function of survival time after short-duration (10 min) playback ofconspecific song. Frozen brain sections were hybridized with ‘5S-labeled riboprobes for ZENK and exposed to x-ray films; optical density measurements in NCM were taken from autoradiograms and normalized to levels in unstimulated controls. Data points represent individuals (n = 2/time point); unstimulated controls are plotted as open circles at time = 0.
under identical conditions results in detection of a single, clean band of about 3.5 kb for both species tested, confirming the specificity of these reaction conditions (Northern blot procedure as described in Clay- ton et al., 1988).
For anatomical description of ZENK induction patterns, song-stim- ulated zebra finches were sectioned in the parasagittal (five birds) or the coronal plane (three birds), and compared to two unstimulated control birds in each plane; eight song-stimulated canaries were analyzed in the parasagittal plane an&compared to two unstimulated controls. For ki- netic analysis of ZENK induction. 22 zebra finches were stimulated as described<in detail in Results; xiray film autoradiograms of medial parasagittal brain sections hybridized with ZENK riboprobes were quantified by densitometry using a Macintosh-based image processing system and IMAGE (NIH) software. Before measurements, a calibration curve was established using optical density standards. For the kinetic analysis, measurements were made in medial parasagittal sections (150- 250 pm from the midline) over the caudomedial neostriatum (NCM) using as dorsal, caudal and ventral boundaries the ventricular zone and as rostrodorsal boundary the lamina hyperstriatalis (LH); field L was not included in these measurements. For each section analyzed, the optical density over NCM was determined and the nonspecific back- ground (i.e., hybridization signal over the glass slide) was subtracted; to control for variations in hybridization efficiency or section thickness, the background-corrected density value obtained over NCM was di- vided by the background-corrected value over the adjacent hippocam- pus, where ZENK levels do not change in response to song stimulation. The resulting ratio obtained for two adjacent sections from each bird were averaged and then divided by the ratio obtained in unstimulated control birds, to create the normalized scale of ZENK signal relative to controls in NCM, shown on the y-axis of Figures 1 and 2. To obtain an estimate of n-fold induction values in areas other than NCM, some of their boundaries were arbitrarily defined in parasagittal sections, as follows: anterior border of field Ll, 300 pm anterior to field L2a; pos- terior border of field L3, 500 pm posterior to field L2a; ventral border of the HVC shelf, 400 pm from HVC’s ventral border; rostroventral border of the RA cup, 400 pm from RA’s rostroventral border. The same area was used for measurements in both song-stimulated and unstimulated control animals; average values obtained from repeated measurements (three) in song-stimulated birds were normalized to val- ues obtained in unstimulated controls.
10-
a-
6-
4-
2-
3
0
0
0
0
ok-‘-‘-‘-‘-‘-‘.‘-‘-‘.’ 0 5 10 15 20 25 30 35 40 45 50
PLAYBACK DURATION (min.) Figure 3. Time course of ZENK mRNA induction after song playback: effect of playback duration. ZENK n-fold induction in NCM of zebra finches is plotted as a function of playback duration; all animals were sacrificed 40 min after beginning of playback. Frozen brain sections were hybridized with %-labeled riboprobes for ZENK and exposed to x-ray films; optical density measurements in NCM were taken from autoradiograms and normalized to levels in unstimulated controls. Data points represent individuals (n = Z/time point); unstimulated controls are plotted as open circles at time = 0.
Results Kinetics of ZENK induction by song As a first step before extensive anatomical mapping, we con- ducted two experiments where we defined the kinetics of the ZENK response to song, in order to establish a stimulation paradigm that would result in a high and reproducible ZENK induction. Densitometric analysis of in Situ hybridization au- toradiograms was used to measure the levels of ZENK mRNA in stimulated birds relative to controls in NCM, an area that shows a very pronounced ZENK induction after song (Mello et al., 1992; see also below). In the first experiment, we fixed the duration of the playback (10 min) and varied the survival time counted from the start of the playback. The results shown in Figure 2 demonstrate that ZENK induction is rapid and tran- sient; a small increase is seen 10 min after the start of the stimulation, but ZENK RNA levels continue to rise after the stimulus ceases, and reach a peak around 30 min before re- turning to levels comparable to unstimulated controls by 60 min.
To define the effect of playback duration on levels of ZENK induction, we conducted a second experiment in which the sur- vival time after the start of the stimulation was held constant at 40 min and the duration of the song playback was varied. As shown in Figure 3, the amount of ZENK induction increases roughly in proportion to the duration of playback, suggesting that the effects of repetitive stimuli summate during this period, although ZENK levels eventually decline after longer playbacks (C. V. Mello and D. F. Clayton, unpublished observations); it is unclear whether the difference between 30 and 40 min is significant. In order to maximize the ZENK induction in re- sponse to song for mapping purposes, we decided to use 30 min of song playback followed immediately by sacrifice.

The Journal of Neuroscience. November 1994, f4(11) 6655
ZENK induction after song: general pattern The anatomical distribution of ZENK mRNA signal was de- termined by analyzing both x-ray film autoradiograms and emulsion-dipped serial brain sections after hybridization with ZENK riboprobe. We examined both zebra finches and canaries, and identified brain regions where ZENK hybridization signal increased in birds exposed to song compared to unstimulated controls. The lower and upper diagrams of Figure 4 indicate the levels of coronal and parasagittal brain sections shown in Figures 5 and 6, respectively, where zebra finches exposed to song (mid- dle columns) are compared to unstimulated finches (right col- umns). The patterns of ZENK induction observed in adult male zebra finches (shown in this report) and in adult canaries in the spring (not shown) are remarkably similar.
a
1 P
As can be seen in the series ofcoronal sections (Fig. 5, compare middle and right columns), ZENK induction after song presen- tation is bilateral and restricted to the medial portions of the telencephalon, at the more caudal levels. The area of high ZENK signal consists of the medial portions of the neostriatum and hyperstriatum ventrale (Fig. 54-F) as well as the caudodorsal paleostriatum (Fig. 5G; see also Fig. 6) and portions of the archistriatum (better seen in Fig. 6). A central or core negative area within the neostriatum, which appears as a horizontal stripe surrounded by areas showing significant ZENK induction, can be seen in Figure 5C-E. In general, ZENK signal tends to be denser in more medial and dorsal regions, and lateral boundaries of areas showing high ZENK signal can be clearly seen in these autoradiograms (Fig. 5A-F). When sections are stained with cresyl violet, no obvious boundaries such as laminae or differ- ences in cell number or density corresponding to the lateral border of the high ZENK region are seen within the neostriatum or hyperstriatum ventrale, although thicker sections might be necessary to provide more anatomical detail. There seem to be no gross interhemispheric differences; the difference seen in Fig- ure 5A is more likely the result of the plane of sectioning, since the left hemisphere of this brain was cut at a level slightly more caudal than the right one.
d
t P
Figure 4. Diagrammatic schemes of the songbird brain. Top, Dorsal view of the brain; lines represent levels of parasagittal sections (A-G) shown in Figure 6. Bottom, Diagram of a parasagittal section at the level indicated by line A in the top panel; lines represent levels of coronal sections (A-H) shown in Figure 5.
The parasagittal series (Fig. 6) confirms this general pattern and demonstrates that the most marked ZENK induction occurs in the caudal telencephalon. This effect is most pronounced in the more medial sections (Fig. 6A), where a homogeneously high signal covers a relatively large area of the caudal telencephalon formed by the caudomedial hyperstriatum ventrale (CMHV) and neostriatum (NCM). The central or core negative region is very conspicuous in this plane of section. In the more medial sections, the negative region is stripe-shaped (Fig. 6A-E) and extends caudodorsally from the caudodorsal tip of the paleos- triatal complex (Fig. 6D,E) toward the dorsal neostriatum, fol- lowing a course roughly parallel with the lamina that separates the hyperstriatum ventrale and the neostriatum (Fig. 6B-E); in more lateral sections, this area assumes a boomerang or inverted V-shape (Fig. 6F,G); as described more fully below, this central core corresponds to portions of the auditory thalamo-recipient zone (field L).
(Fig. 6A) and can be easily overlooked in the more medial sec- tions since it completely separates from the rest of the brain when brains are cut in a vibratome. This protuberance consists of a central core, field L, and the surrounding caudomedial neostriatum and hyperstriatum. These areas are individually analyzed in further detail below.
Caudomedial hyperstriatum ventrale (CMHV)
The caudomedial HV is seen in coronal sections extending me- dially and ventrally toward the midline, between the hippocam- pus and the caudomedial neostriatum; it constitutes most of the dorsal area of high ZENK expression after song presentation in Figure X-F. In medial parasagittal sections, HV constitutes the rostrodorsal portions of the drop-shaped area that shows high (sevenfold above control levels) ZENK induction (Fig. 6A). At more lateral levels, the caudal HV extends rostrally, and eventually becomes continuous with the more rostra1 portions of HV; high ZENK levels are restricted to the caudal portions, closely adjacent to field L (Fig. 6C-G).
Caudomedial neostriatum (NC&f) ZENK induction following song occurs, thus, in a structure In medial parasagittal sections (200-500 pm from the midline),
that might be described as a medial protuberance of the caudal NCM is easily defined by its natural boundaries: the ventricular telencephalon. This protuberance is bound dorsomedially by zone dorsally, ventrally and caudally; rostrodorsally, it is sep- the hippocampus (Figs. 5A-H, 6A-C) and lies over the cere- arated from HV by the lamina hyperstriatica and medial por- bellum caudally (Figs. 5A,B, 6A), and over caudal diencephalic tions of field L (Fig. 6A; see also Mello et al., 1992). In even structures more rostrally (Figs. 5D, 6A). When sectioned in the more medial sections (less than 100 Frn from the midline) field parasagittal plane, this structure has an ovoid or drop-like shape L and HV are absent and NCM has a rounder shape and is

A
B
C
D
E
F
G
H

surrounded on all sides by ventricular zone (not shown). In more lateral sections, the caudal neostriatum becomes gradually larg- er, assuming a drop-like shape together with the caudomedial HV and eventually becoming continuous with the rostra1 parts of the neostriatum (Fig. 6%D). At these more lateral levels, ZENK signal is more diffuse and a stripe-shaped area negative for ZENK appears within the neostriatum (Fig. 6A-D). In co- ronal sections, NCM can be defined as a thin neostriatal layer with high ZENK signal that separates the core negative region (L2) from the midline (Fig. SC-E); more caudally, ZENK ex- pression occurs in a larger area of the neostriatum that is caudal to field L (Fig. 54,B).
Field L
ZENK signal in parts of the neostriatum around the negative core presents a patchy appearance, especially in the parasagittal plane (Fig. 6E-G). Recent studies on the organization of the avian brain provide evidence suggesting that some of these areas correspond to divisions of field L, the primary forebrain audi- tory area. Field L is a complex aggregation of subfields that have been variously defined by morphological and electrophysiolog- ical criteria. Fortune and Margoliash (1992a) recently presented a detailed cytoarchitectonic study in the zebra finch in which field L was divided into five subregions: Ll, L2a, L2b, L3 and L (or L of Rose). Detailed differences in cytoarchitectonic or- ganization are not easily seen in thin sections after in situ hy- bridization; L2a, however, is readily identified. The localization of the remaining subdivisions is inferred with reference to L2a, as well as to the laminae that separate the hyperstriatum ventrale from the neostriatum (LH or lamina hyperstriatica) and the paleostriatum from the neostriatum (LMD or lamina medullaris dorsalis). By comparing Figure 6 with the diagrams in Figure 2 of their report (e.g., our Fig. 6F corresponds approximately to their Fig. 2B,C), it becomes clear that the patchy pattern ob- served corresponds, at least in part, to various subregions of field L. The occurrence of differential patterns of gene induction within field L corresponding to Fortune and Margoliash’s di- visions demonstrates that the various field L subdivisions are composed of cells with different properties, and lends further support to Fortune and Margoliash’s classification. From this comparison we draw the following observations.
L2a, L26, field L of Rose. Induction is not observed in these areas. The core or central area of negative signal corresponds to subfields L2a (thin stripe oriented obliquely from the dor- socaudal tip of the paleostriatum toward the dorsocaudal neo- striatum, Fig. 6&E), L2b (the apex of the boomerang or in- verted V-shaped negative core region in Fig. 6F,G) and the lateral portions of field L of Rose (the caudal leg of the inverted V-shape in Fig. 6G, compare with definition by Fortune and Margoliash, 1992a); it is unclear whether ZENK induction oc- curs in the more medial portions of field L of Rose, since this region was not readily identified in our material.
t
The Journal of Neuroscience, November 1994, 74(11) 6657
LI and L3. Significant induction is observed in these parts of field L. One of the patches showing high ZENK induction (4.5-fold) lies ventrocaudally to the stripe-shaped negative core and dorsocaudally to the paleostriatum and occupies the con- cavity of the boomerang or inverted V-shape (Fig. 6E-G); it thus closely matches L3 (Fortune and Margoliash, 1992a). A significant induction (2.5-fold) is also seen in the region anter- odorsal to the negative core, an area that probably corresponds to Ll (Figs. 5C-E, 6D,E; and compare with Fortune and Mar- goliash, 1992a).
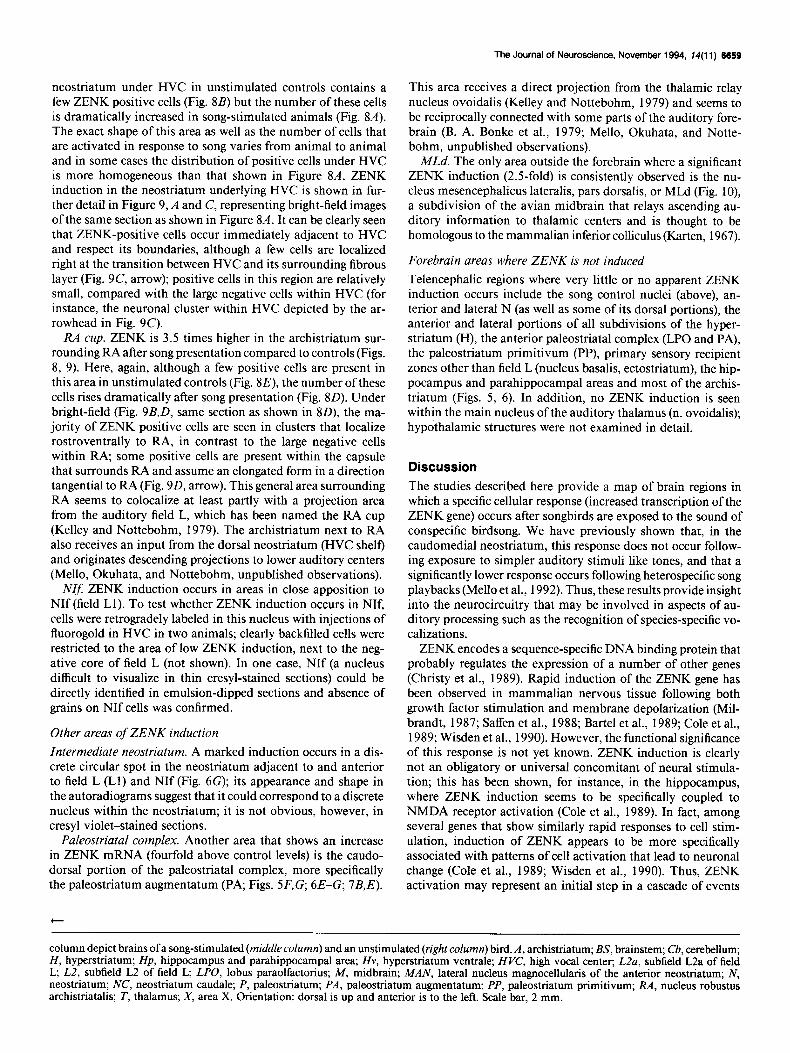
The relationships between field L subfields are observed in closer detail in Figure 7. The diagram on the upper left comer represents a camera lucida drawing of a cresyl-stained parasa- gittal section at the same level as the autoradiogram in Figure 6E (notice the reverse orientation of the figures). L2a is easily defined as a field that extends from the caudodorsal tip of the paleostriatum toward the dorsal neostriatum and runs parallel to the caudal end of the lamina hyperstriatica; it contains small and darkly staining cells, typically organized in short rows or columns aligned with the major axis of L2a. Other subfields were defined with relation to L2a and the laminae hyperstriatica (LH) and medullaris dorsalis (LMD), both readily identified with cresyl violet staining. Caudal to the angle between L2a and the caudal part of the LMD (which separates neostriatum from paleostriatum) is L3, and immediately rostra1 to L2a is Ll, whose rostra1 boundaries are not well-defined. The area enclosed by the hatched rectangle in the diagram is shown in detail in Figure 7, A and B (bright- and dark-field views, respectively, of a section from a song stimulated bird) and Figure 7C (dark-field view of a section from an unstimulated control). Some signal is seen in the unstimulated Ll and L3 (Fig. 7C) but a dramatic increase in the number of positive cells occurs in both fields after song presentation (Fig. 7B), but not in L2a. High power views demonstrate positive cells in Ll (Fig. 70, right, arrow points to a positive cluster) and L3 after song presentation (Fig. 7E, upper half, positive cells in clusters or in isolation) but not in L2a (see the left half of Fig. 70).
Relationship to song control nuclei
ZENK induction following song is not observed in song control nuclei HVC (Figs. 5, 6, 8, 9), RA (Figs. 5, 6, 8, 9) and NIf (not shown), although significant induction is observed in areas im- mediately adjacent to these (as described in more detail below), nor does it occur in Area X (Fig. 6) DLM (not shown), and L-MAN (Fig. 6).
HVC shelf: A marked induction (fourfold on x-ray film au- toradiograms) can be seen in the caudodorsal neostriatum, most prominently in the area immediately adjacent to HVC (Fig. 8). The neostriatum underlying HVC receives a direct input from field L, possibly from subfields Ll and L3 (Kelley and Notte- bohm, 1979; Fortune and Margoliash, 1992b; Mello, Okuhata, and Nottebohm, unpublished observations) and has been called the shelf region. As can be seen from the dark-field images, the
Figure 5. ZENK mRNA induction in the zebra finch brain following exposure to song. A-H represent a series of coronal sections, from +0.25 (A) to +2.5 mm (H) in the anteroposterior axis, as indicated in Figure 4 (bottom). Left column, Diagrams of camera lucida drawings of the sections whose autoradiograms are shown in the middle column. In situ hybridization autoradiograms at levels corresponding to the diagrams on the left column depict brains ofa song-stimulated (middle column) and an unstimulated (right column) bird. A, archistriatum; Cb, cerebellum; E, ectostriatum; H, hyperstriatum; Hp, hippocampus and parahippocampal area; Hv, hyperstriatum ventrale; HVC, high vocal center; L2, subfield L2 of field L, N, neostriatum; PA, paleostriatum augmentatum; PP, paleostriatum primitivum; RA, nucleus robustus archistriatalis. Scale bar, 2 mm.

6658 Mello and Clayton l ZENK Expression in the Songbird Brain after Song
NCM
c
Figure 6. ZENK mRNA induction in the zebra finch brain following exposure to song. A-G represent a series of parasagittal sections, from 0.25 mm (A) to 2.2 mm (G) lateral to the midline, as shown in Figure 4 (top panel). Left column, Diagrams of camera lucida drawings of the sections whose autoradiograms are shown in the middZe column. In situ hybridization autoradiograms at levels corresponding to the diagrams on the left
neostriatum under HVC in unstimulated controls contains a few ZENK positive cells (Fig. 8B) but the number of these cells is dramatically increased in song-stimulated animals (Fig. 84. The exact shape of this area as well as the number of cells that are activated in response to song varies from animal to animal and in some cases the distribution of positive cells under HVC is more homogeneous than that shown in Figure 8.4. ZENK induction in the neostriatum underlying HVC is shown in fur- ther detail in Figure 9, A and C, representing bright-field images of the same section as shown in Figure 8A. It can be clearly seen that ZENK-positive cells occur immediately adjacent to HVC and respect its boundaries, although a few cells are localized right at the transition between HVC and its surrounding fibrous layer (Fig. SC, arrow); positive cells in this region are relatively small, compared with the large negative cells within HVC (for instance, the neuronal cluster within HVC depicted by the ar- rowhead in Fig. 9C).
RA cup. ZENK is 3.5 times higher in the archistriatum sur- rounding RA after song presentation compared to controls (Figs. 8, 9). Here, again, although a few positive cells are present in this area in unstimulated controls (Fig. 8E), the number of these cells rises dramatically after song presentation (Fig. 80). Under bright-field (Fig. 9B,D, same section as shown in 8D), the ma- jority of ZENK positive cells are seen in clusters that localize rostroventrally to RA, in contrast to the large negative cells within RA; some positive cells are present within the capsule that surrounds RA and assume an elongated form in a direction tangential to RA (Fig. 9D, arrow). This general area surrounding RA seems to colocalize at least partly with a projection area from the auditory field L, which has been named the RA cup (Kelley and Nottebohm, 1979). The archistriatum next to RA also receives an input from the dorsal neostriatum (HVC shelf) and originates descending projections to lower auditory centers (Mello, Okuhata, and Nottebohm, unpublished observations).
NIX ZENK induction occurs in areas in close apposition to NIf (field Ll). To test whether ZENK induction occurs in NIf, cells were retrogradely labeled in this nucleus with injections of fluorogold in HVC in two animals; clearly backfilled cells were restricted to the area of low ZENK induction, next to the neg- ative core of field L (not shown). In one case, NIf (a nucleus difficult to visualize in thin cresyl-stained sections) could be directly identified in emulsion-dipped sections and absence of grains on NIf cells was confirmed.
Other areas of ZENK induction Intermediate neostriatum. A marked induction occurs in a dis- crete circular spot in the neostriatum adjacent to and anterior to field L (Ll) and NIf (Fig. 6G); its appearance and shape in the autoradiograms suggest that it could correspond to a discrete nucleus within the neostriatum; it is not obvious, however, in cresyl violet-stained sections.
Paleostriatal complex. Another area that shows an increase in ZENK mRNA (fourfold above control levels) is the caudo- dorsal portion of the paleostriatal complex, more specifically the paleostriatum augmentatum (PA; Figs. 5F,G; 6E-G; 7B,E).
c
The Journal of Neuroscience, November 1994, 14(11) 6659
This area receives a direct projection from the thalamic relay nucleus ovoidalis (Kelley and Nottebohm, 1979) and seems to be reciprocally connected with some parts of the auditory fore- brain (B. A. Bonke et al., 1979; Mello, Okuhata, and Notte- bohm, unpublished observations).
MLd. The only area outside the forebrain where a significant ZENK induction (2.5fold) is consistently observed is the nu- cleus mesencephalicus lateralis, pars dorsalis, or MM (Fig. IO), a subdivision of the avian midbrain that relays ascending au- ditory information to thalamic centers and is thought to be homologous to the mammalian inferior colliculus (Karten, 1967).
Forebrain areas where ZENK is not induced
Telencephalic regions where very little or no apparent ZENK induction occurs include the song control nuclei (above), an- terior and lateral N (as well as some of its dorsal portions), the anterior and lateral portions of all subdivisions of the hyper- striatum (H), the anterior paleostriatal complex (LPO and PA), the paleostriatum primitivum (PP), primary sensory recipient zones other than field L (nucleus basalis, ectostriatum), the hip- pocampus and parahippocampal areas and most of the archis- triatum (Figs. 5, 6). In addition, no ZENK induction is seen within the main nucleus of the auditory thalamus (n. ovoidalis); hypothalamic structures were not examined in detail.
Discussion
The studies described here provide a map of brain regions in which a specific cellular response (increased transcription of the ZENK gene) occurs after songbirds are exposed to the sound of conspecific birdsong. We have previously shown that, in the caudomedial neostriatum, this response does not occur follow- ing exposure to simpler auditory stimuli like tones, and that a significantly lower response occurs following heterospecific song playbacks (Mello et al., 1992). Thus, these results provide insight into the neurocircuitry that may be involved in aspects of au- ditory processing such as the recognition of species-specific vo- calizations.
ZENK encodes a sequence-specific DNA binding protein that probably regulates the expression of a number of other genes (Christy et al., 1989). Rapid induction of the ZENK gene has been observed in mammalian nervous tissue following both growth factor stimulation and membrane depolarization (Mil- brandt, 1987; Saffen et al., 1988; Bartel et al., 1989; Cole et al., 1989; Wisden et al., 1990). However, the functional significance of this response is not yet known. ZENK induction is clearly not an obligatory or universal concomitant of neural stimula- tion; this has been shown, for instance, in the hippocampus, where ZENK induction seems to be specifically coupled to NMDA receptor activation (Cole et al., 1989). In fact, among several genes that show similarly rapid responses to cell stim- ulation, induction of ZENK appears to be more specifically associated with patterns of cell activation that lead to neuronal change (Cole et al., 1989; Wisden et al., 1990). Thus, ZENK activation may represent an initial step in a cascade of events
column depict brains of a song-stimulated (middle column) and an unstimulated (right column) bird. A, archistriatum; BS, brainstem; Cb, cerebellum; H, hyperstriatum; Hp, hippocampus and parahippocampal area; Hv, hyperstriatum ventrale; HVC, high vocal center; L2a, subfield L2a of field L, L2, subfield L2 of field L, LPO, lobus paraolfactorius; M, midbrain; MAN, lateral nucleus magnocellularis of the anterior neostriatum; N, neostriatum; NC, neostriatum caudale; P, paleostriatum; PA, paleostriatum augmentatum; PP, paleostriatum primitivum; RA, nucleus robustus archistriatalis; T, thalamus; A’, area X. Orientation: dorsal is up and anterior is to the left. Scale bar, 2 mm.
6660 Mello and Clayton l ZENK Expression in the Songbird Brain after Song
Figure 7. ZENK mRNA induction after song presentation in the zebra finch field L complex. At the top left is a diagrammatic scheme of a parasagittal brain section at the level of field L, the boxed area is shown in detail in A-C. A, Bright-field view of emulsion-dipped section stained with cresyl violet after in situ hybridization with ZENK riboprok, Dashed lines are drawn over the laminae that separate L subdivisions and the
The Journal of Neuroscience, November 1994, 14(11) 6681
HVC
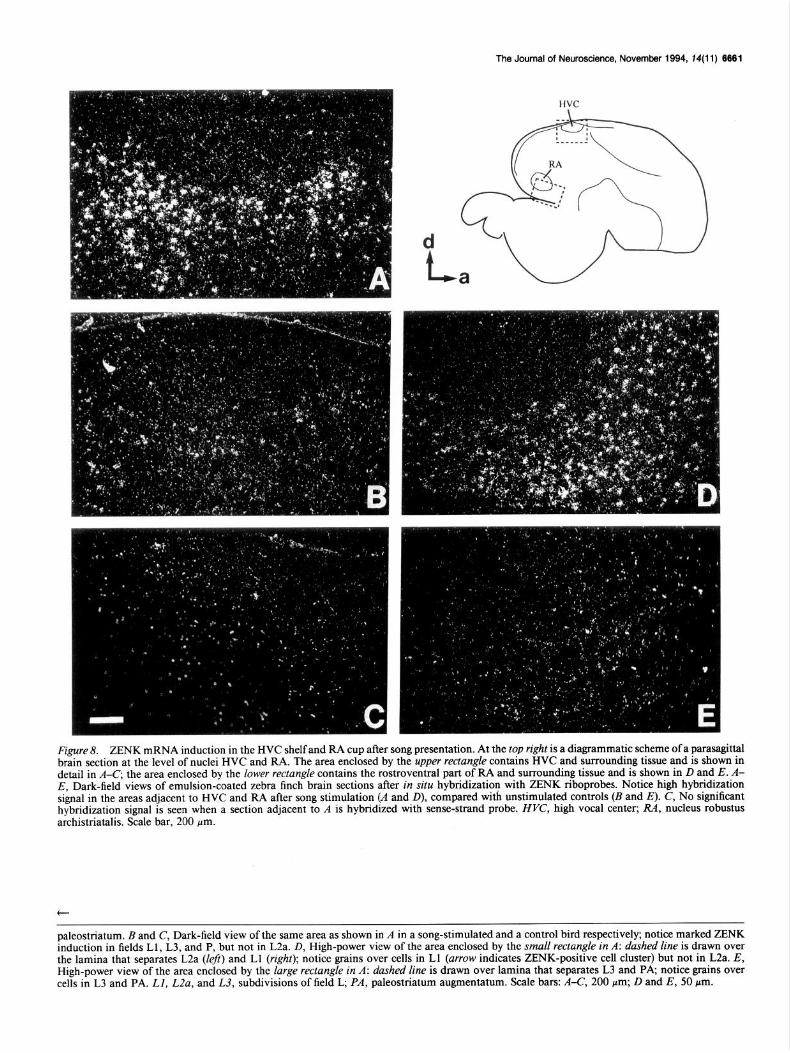
Figure 8. ZENK mRNA induction in the HVC shelf and RA cup after song presentation. At the top right is a diagrammatic scheme of a parasagittal brain section at the level of nuclei HVC and RA. The area enclosed by the upper rectangle contains HVC and surrounding tissue and is shown in detail in A-C; the area enclosed by the lower rectangle contains the rostroventral part of RA and surrounding tissue and is shown in D and E. A- E, Dark-field views of emulsion-coated zebra finch brain sections after in situ hybridization with ZENK riboprobes. Notice high hybridization signal in the areas adjacent to HVC and RA after song stimulation (A and D), compared with unstimulated controls (I3 and E). C, No significant hybridization signal is seen when a section adjacent to A is hybridized with sense-strand probe. HVC, high vocal center; RA, nucleus robustus archistriatalis. Scale bar, 200 pm.
paleostriatum. B and C, Dark-field view of the same area as shown in A in a song-stimulated and a control bird respectively; notice marked ZENK induction in fields Ll, L3, and P, but not in L2a. D, High-power view of the area enclosed by the small rectangle in A: dashed line is drawn over the lamina that separates L2a (left) and Ll (right); notice grains over cells in Ll (arrow indicates ZENK-positive cell cluster) but not in L2a. E, High-power view of the area enclosed by the large rectangle in A: dashed line is drawn over lamina that separates L3 and PA, notice grains over cells in L3 and PA. Ll, L2a, and L3, subdivisions of field L, PA, paleostriatum augmentatum. Scale bars: A-C, 200 pm; D and E, 50 pm.

6662 Mello and Clayton l ZENK Expression in the Songbird Brain after Song 6662 Mello and Clayton l ZENK Expression in the Songbird Brain after Song
I-;.‘--... . _,
I
Figure 9. ZENK mRNA induction in the HVC shelf and RA cup after song presentation. Zebra finch brain sections at the level of nuclei HVC and RA are shown, coated with autoradiographic emulsion after in situ hybridization with ZENK riboprobes and counterstaining with cresyl violet. A and Bare bright-field views of the same sections as shown in Figure 8, A and D, respectively; dashed lines are drawn over the boundaries between HVC and RA and adjacent tissues. C and D, High-power views of the areas enclosed by the rectangles in A and B, respectively; labeled cells are seen in the tissues adjacent to HVC and RA, but not within HVC and RA. Arrows indicate labeled cells in the transition zones between HVC (C) and RA (D) and adjacent tissues; arrowhead points to an unlabeled neuronal cluster within HVC (C). HVC, high vocal center; RA, nucleus robustus archistriatalis. Scale bars: A and B, 200 pm; C and D, 30 pm.
leading to long-lasting cellular changes that could underlie learn- ing and memory (Goelet et al., 1986).
The use here of ZENK induction as a mapping tool for an- alyziing brain areas that display functional responses to a specific sensory stimulus is analogous, in principle, to the use of elec- trophysiological recordings or indicators of metabolic activity (e.g., 2-deoxyglucose uptake, or blood flow measurements) for similar purposes. However, activity maps generated by these other techniques do not necessarily coincide with ZENK in- duction maps. Indeed, we observed no ZENK response in sev- era1 areas that have been previously described to show physi- ologic responses to song stimulation, including the thalamic
auditory relay nucleus ovoidalis, the primary forebrain auditory projection area (field L2), and the various nuclei of the motor pathway for song production (discussed further below). ZENK induction thus seems to reveal a subset of sites where physio- logical activation occurs; the compelling speculation is that these may specifically represent sites undergoing plastic change in the circuit, although this remains to be proven.
Summary of ZENK induction pattern A schematic diagram demonstrating brain regions revealed by ZENK induction following song (shaded areas) is shown in Fig- ure 11. Two general effects are observed.

The Journal of Neuroscience, November 1994, 14(11) 6663
Figure 10. ZENK mRNA induction in MLd after song presentation. At the lower right is a drawing representing a transverse section of a zebra finch brain at the level of MM; the boxed area is shown in detail in A-C. A and B, Emulsion-coated brain sections from song stimulated (A) and unstimulated (B) birds, after in situ hybridization with riboprobes for ZENK and counterstaining with cresyl violet, viewed under dark-field. C, Bright-field view of A. A, archistriatum: BS, brainstem; Cb, cerebellum; Hp, hippocampus; MM, nucleus mesencephalicus lateralis, pars dorsalis; N, neostriatum. Scale bar, 230 pm.
Induction in the caudomedial telencephalon, in areas adjacent to or closely related with primary auditory structures, including some subfields of field L (Ll and L3, shown in the diagram as a ring around field L core, L2), the caudomedial neostriatum (NCM) and the caudomedial hyperstriatum ventrale (CMHV) anterior to field L, the caudal paleostriatum (PC), and two areas that overlap with field L targets, HVC shelf and RA cup (note that these last two areas are also closely apposed to song control nuclei).
A lack of induction in some areas known to be activated by song and where induction might have been expected, these in- clude (1) the direct thalamo-recipient field L subfield, L2, and (2) the nuclei of the song system involved in the acquisition and production of learned song.
Note that this anatomical pattern was observed in adult birds sacrificed 30 min after beginning a playback of tape-recorded conspecific song; changes in the pattern might conceivably occur if various aspects of the experimental paradigm were changed, such as duration of playback, familiarity of the bird to the song stimulus and the hormonal or developmental state of the bird. No obvious variations in this general pattern have been seen in either preliminary seasonal (canaries in October vs May) or developmental (juvenile vs adult zebra finches) comparisons (Mello and Clayton, unpublished observations), although a quantitative analysis has not been performed. However, in other recent experiments with adult birds we have found that longer
playbacks result in a habituation of the response to the specific song used, but not to other songs (Mello and Clayton, unpub- lished observations).
Among ZENK positive areas, attention is immediately drawn to the most caudomedial portions of HV and N, for the following reasons. (1) The most marked ZENK induction seems to occur there; the fact that basal levels are very low in these areas in the unstimulated controls may contribute significantly to that effect. (2) The close proximity to the primary auditory area suggests the possibility of auditory input and a function in au- ditory processing. The caudomedial HV has been previously shown to be reciprocally connected with field L (B. A. Bonke et al., 1979) in the guinea fowl; in addition, auditory responses with high selectivity for complex stimuli have been recorded in starlings in this area and in the neostriatum close to field L (Miiller and Leppelsack, 1985). (3) Cytoarchitectonic bound- aries of these areas are easily identified in cresyl-stained sections; this allows precise delineation for densitometric measurements in the evaluation of the time course and specificity of the ZENK response.
Involvement of NC34 in auditory processing
NCM, in particular, has not been previously described as di- rectly involved in song production or perception. To address the possibility that NCM may be involved in auditory process- ing, we have begun an analysis of NCM connectivity using an-

6664 Mello and Clayton - ZENK Expression in the Songbird Brain after Song
AUDITORY t
(to medullary nuclei involved in song and respiratory control)
Figure II. Schematic summary diagram representing areas where the ZENK gene is induced (shaded areas) in response to playbacks of con- specific song. The ring around the field L core (L2) represents Ll and L3, the shaded urea under HVC represents the shelf region and the area around RA represents the cup region. Thin solid arrows represent the connections of the main avian ascending auditory pathway (Karten, 1967, 1968; Kelley and Nottebohm, 1979) and the telencephalic pro-
jections of field L in canaries (Kelley and Nottebohm, 1979). Thicksolid arrows represent connections of the descending song control pathway (Nottebohm et al., 1976). Dashed arrows represent preliminary results observed after injections of anterograde or retrograde tracers in NCM. No attempt was made to represent all known connections or the densities of these connections; it is also mostly unknown whether they are ex- citatory or inhibitory. CMHV, caudomedial hyperstriatum ventrale; HVC, high vocal center; L, core of field L (L2); mesenc, mesencephalon; MLd, nucleus mesencephalicus lateralis, pars dorsalis; NCM, caudo- medial neostriatum; Ov, nucleus ovoidalis; PC, caudal paleostriatum; RA, nucleus robustus archistriatalis; telenc, telencephalon; thud, thala- mus.
terograde and retrograde tracers (Mello, Okuhata, and Notte- bohm, unpublished observations). Preliminary results, as summarized in Figure 11, indicate that NCM is an integral part of the telencephalic auditory circuitry. Injections of retrograde tracers in NCM result in the retrograde labeling of cells in the thalamus (in close apposition to nucleus ovoidalis), in field L, in the caudomedial HV (HVCM) and in the caudodorsal pa- leostriatum (PC). Injections of anterograde tracers result in la- belled fibers within HVCM, PC, and more lateral portions of the neostriatum, including the area under HVC (shelf), a field L target that could contribute an input to HVC (Katz and Gur- ney, 198 1; Mello, Okuhata, and Nottebohm, unpublished ob- servations). In addition, units in NCM respond to auditory stim- ulation (S. Okuhata, S. Volman, and D. Vicario, personal communications). The position NCM apparently occupies with- in the forebrain auditory pathways suggests that NCM could represent part of the interface between song perception and
production systems. To clarify the role of NCM in auditory processing, other experiments are necessary, including a study of the effects of several classes of auditory stimuli (bird’s own song, conspecific song played backward, white noise, etc.) on ZENK induction and electrophysiological recordings to deter- mine the response properties of units within NCM.
Significance of induction in other brain regions
Most other brain areas showing high ZENK induction in re- sponse to song have also been described as intimately related to auditory pathways. Fields Ll and L3 may receive a sparse direct projection from the auditory thalamus, but they also con- stitute the main target of field L2. This suggests that these areas could represent higher order stations for auditory processing than field L2; the fact that more complex responses and longer latencies are seen as one moves a recording electrode away from a central area that corresponds to field L2 (Miiller and Leppel- sack, 1985; Heil and Scheich, 199 1) is consistent with this idea. The HVC shelf and the RA cup both receive a projection either directly from field L or from some immediately adjacent area (Kelley and Nottebohm, 1979); the shelf and cup may represent sites of converging auditory inputs (Mello, Okuhata, and Not- tebohm, unpublished observations), and their close proximity to song control nuclei suggests that they could then contribute to the song-selective auditory responses seen within the song control circuit. The caudal portion of the paleostriatal complex receives a direct projection from the thalamic relay nucleus ovoidalis (Kelley and Nottebohm, 1979), whereas MM is a central component of the ascending auditory pathway and is generally considered the avian homolog of the mammalian in- ferior colliculus (Karten, 1967).
Lack of ZENK response in field L2 and the song control nuclei ZENK induction in response to song seems to occur in specific subregions of the brain that are closely related to auditory struc- tures and could thus be involved in various aspects of auditory processing. However, not all regions of the brain involved in auditory processing are necessarily revealed by ZENK induc- tion: L2a and the song control nuclei constitute clear examples of areas where no ZENK induction is detected despite the fact that stimulation from song playbacks is known to reach these regions.
Field L is the primary forebrain thalamo-recipient zone for auditory stimuli (Karten, 1968; B. A. Bonke et al., 1979; Kelley and Nottebohm, 1979). The heaviest telencephalic termination of the auditory thalamus corresponds to L2a, which then pro- jects to surrounding fields, Ll and L3 (Karten, 1968; B. A. Bonke et al., 1979; Saini and Leppelsack, 198 1). Cells in L2a are char- acterized by very low response selectivity and respond readily, both electrophysiologically and metabolically, to various classes of auditory stimuli, from simple to complex (including species- specific vocalizations), as is expected of an area that may func- tion primarily as a relay to higher-order auditory regions (D. Bonke et al., 1979; Scheich et al., 1979; Braun et al., 1985; Miiller and Leppelsack, 1985; Miiller and Scheich, 1985). Nev- ertheless, no ZENK induction was observed in L2a (or in L2b, a subdivision of L2 that specifically receives input from nucleus semilunaris paraovoidalis, a subdivision of the auditory thal- amus closely related to ovoidalis; see Wild, 1987). Similarly, ZENK induction was notably absent in the nuclei of the song control circuit, which respond metabolically to auditory stim-

The Journal of Neuroscience, November 1994, f4(11) 6665
ulation (Braun et al., 1985) and where electrophysiological re- sponses with a high selectivity for species-specific song have been reported (Margoliash, 1983, 1986; Williams and Notte- bohm, 1985; Doupe and Konishi, 1991; Margoliash and For- tune, 1992; Vicario and Yohay, 1993).
In another study, we have found a specific lack of ZENK response in primary telencephalic receptive fields and in an- drogen-concentrating nuclei within the song control circuit fol- lowing metrazole-induced seizures, despite widespread ZENK induction throughout the rest of the telencephalon (Mello and Clayton, unpublished observations). Taken together, our find- ings suggest that ZENK induction has been uncoupled from cellular depolarization in these specific areas of the telenceph- alon. The mechanism of this uncoupling, and its functional significance, are both unknown at this time. It also remains to be seen whether other classes of genes responsive to depolar- ization can be activated in areas that lack a ZENK response. However, we have observed that at least one other immediate early gene, c-jun, is induced in a pattern roughly similar to ZENK, either by song stimulation or metrazole (Mello, Nastiuk, and Clayton, unpublished observations). If immediate early gene activation represents a necessary step in long-term activity-de- pendent modifications of neural circuitry, as others have sug- gested, a selective shutting off of their induction in certain areas like primary sensory receptive fields and motor control path- ways (such as the song control circuit) might provide a mech- anism for stabilizing essential sensory and motor representa- tions in the brain.
Conclusion Electrophysiological responses recorded in nuclei of the song control pathway in response to song playbacks are highly selec- tive, with preferences for conspecific songs and for the bird’s own song (Margoliash, 1986; Doupe and Konishi, 199 1; Vicario and Yohay, 1993). This has led investigators to implicate this pathway in aspects of song perception and processing. ZENK induction patterns, however, draw attention to larger brain regions that are intimately related with the primary auditory area and may process song information before it reaches the song system. Together with data derived from anatomical stud- ies (Mello, Okuhata, and Nottebohm, unpublished observa- tions), these results suggest that complex telencephalic circuits may be involved in the neural processing of auditory stimuli such as song. Thus, it is possible that the selectivity to song playbacks observed by neurophysiological recording within nu- clei of the song system results partly from auditory processing occurring in these other areas. It should be very interesting to examine in detail the electrophysiological response properties of these areas to complex auditory stimuli, and whether and how these responses can be modified.
References Alvarez-Buylla A, Kim JR, Nottebohm F (1990) Birth of projection
neurons in adult avian brain may be related to perceptual or motor learning. Science 249:1444-1446.
Bartel DP, Sheng M, Lau LF, Greenberg ME (1989) Growth factors and membrane depolarization activate distinct programs of early re- sponse gene expression: dissociation of fos and jun induction. Genes Dev 3:304-3 13.
Bonke BA, Bonke D, Scheich H (1979) Connectivity of the auditory forebrain nuclei in the guinea fowl (Numida meleagris). Cell Tissue Res 200:101-121.
Bonke D, Scheich H, Langer G (1979) Responsiveness of units in the auditory neosttiatum of the guinea fowl (Numida meleagris) to spe-
ties-specific calls and synthetic stimuli. I. Tonotopy and functional zones of field L. J Comp Physiol 132:243-255.
Bottjer SW, Miesner EA, Arnold AP (1984) Forebrain lesions disrupt development but not maintenance of song in passerine birds. Science 224:901-903.
Braun K, Scheich H, Schachner M, Heizmann CW (1985) Distribution of parvalbumin, cytochrome oxidase activity and 14C-2-deoxyglucose uptake in the brain of the zebra finch. I. Auditory and vocal motor systems. Cell Tissue Res 240:101-l 15.
Brenowitz E (1991) Altered perception of species-specific song by female birds after lesions of a forebrain nucleus. Science 251:303- 305.
Christy B, Lau L, Nathans D (1988) A gene activated in mouse 3T3 cells by serum factors encodes a protein with “zinc finger” sequences. Proc Nat1 Acad Sci USA 85:7857-7861.
Christy B, Lau L, Nathans D (1989) DNA binding site of the growth factor-inducible protein Zif268. Proc Nat1 Acad Sci USA 86:8737- 8741.
Clark SJ, Nottebohm F (1990) Perception of birdsong by female zebra finches and canaries. Sot Neurosci kbstr 16:2.1106 -
Clayton DF, Huecas ME, Sinclair-Thompson EY, Nastiuk KL, Not- tebohm F (1988) Probes for rare mRNAs reveal distributed cell subsets in canary brain. Neuron 1:249-26 1.
Cole AJ, Saffen DW, Baraban JM, Worley PF (1989) Rapid increase of an immediate early gene messenger RNA in hippocampal neurons by synaptic NMDA receptor activation. Nature 340:474-476.
Doupe AJ, Konishi M (199 1) Song-selective auditory circuits in the vocal control svstem of the zebra finch. Proc Nat1 Acad Sci USA 88: 11339-11343.-
Falls JB (1982) In: Acoustic communication in birds (Kroodsma DE, Miller DH. eds). DD 237-278. New York: Academic.
Fortune E, Margoliash D (1992a) Cytoarchitectonic organization and morphology of cells of the field L complex in male zebra finches (Taenopygia g&tutu). J Comp Neurol 325:388404
Fortune E, Margoliash D (1992b) Multiple auditory pathways into HVc. Sot Neurosci Abstr 18:2.1193.
Godard R (1991) Long-term memory of individual neighbors in a migratory songbird. Nature 350:228-229.
Goelet P, Castelucci V, Schacher S, Kandel E (1986) The long and the short of long-term memory-a molecular framework. Nature 332: 419422.
Heil P, Scheich H (199 1) Functional organization ofthe avian auditory cortex analogue. II. Topographic distribution of latency. Brain Res 539:121-125.
Karten HJ (1967) The organization of the ascending auditory pathway in the pigeon (Columba livia). I. Diencephalic projections of the in- ferior colliculus (nucleus mesencephalis lateralis, pars dorsalis). Brain Res 6~409427.
Karten HJ (1968) The ascending auditory pathway in the pigeon (Co- lumba livia). II. Telencephalic projections of the nucleus ovoidalis thalami. Brain Res 11:134-153.
Katz LC, Gurney ME (198 1) Auditory responses in the zebra finch’s motor system for song. Brain Res 221: 192-l 97.
Kellev DB. Nottebohm FJ (1979) Proiections of a telenceohalic au- ditory nucleus-field Llin the canary: J Comp Neurol 183!455469.
Konishi M, Akutagawa E (1985) Neuronal growth, atrophy and death in a sexually dimorphic song nucleus in the zebra finch brain. Nature 315:145-147.
Kroodsma DE (1976) Reproductive development in a female song- bird: differential stimulation by quality of male song. Science 192: 574-575.
Lemaire P, Revelant 0, Bravo R, Chamay P (1988) Two mouse genes encoding potential transcription factors with identical DNA-binding domains are activated by growth factors in cultured cells. Proc Nat1 Acad Sci USA 85:46914695.
Margoliash D (1983) Acoustic parameters underlying the responses of song-specific neurons in the white-crowned sparrow. J Neurosci 3:1039-1057.
Margoliash D (1986) Preference for autogenous song by auditory neu- rons in a song system nucleus of the white-crowned sparrow. J Neu- rosci 6:1643-1661.
Margoliash D, Fortune E (1992) Temporal and harmonic combina- tion-sensitive neurons in the zebra finch’s HVc. J Neurosci 12:4309- 4326.
Marler P, Peters S (1977) Selective vocal learning in a sparrow. Science 198:519-527.

8666 Mello and Clayton l ZENK Expression in the Songbird Brain after Song
Mello CV, Vicario DS, Clayton DF (1992) Song presentation induces neostriatum of the starling (Sturnus vulgaris). J Comp Neurol 198: gene expression in the songbird forebrain. Proc Nat1 Acad Sci USA 209-229. 8968 18-6822.
Milbrandt J (1987) A nerve growth factor-induced gene encodes a possible transcriptional regulatory factor. Science 238:797-799.
Miiller CM, Leppelsack H (1985) Feature extraction and tonotopic organization in the avian auditory forebrain. Exp Brain Res 59:587- 599.
Mtiller SC, Scheich HP (1985) Functional organization of the avian auditory field L-a comparative 2-deoxyglucose study. J Comp Phys- iol 156:1-12.
Nordeen KW, Nordeen EJ (1988) Projection neurons within a vocal motor pathway are born during song learning in zebra finches. Nature 344:149-151.
Nottebohm F (198 1) A brain for all seasons: cyclical anatomical changes in song control nuclei of the canary brain. Science 2 14: 1368-l 370.
Nottebohm F (1989) From birdsong to neurogenesis. Sci Am 260:74- 79.
Nottebohm F, Stokes T, Leonard CM (1976) Central control of song in the canary, Se&us cunarius. J Comp Neurol 165:457486.
Nottebohm F, Kelley DB, Paton JA (1982) Connections of vocal control nuclei in the canary telencephalon. J Comp Neurol207:344- 357.
Nottebohm F, Nottebohm ME, Crane L (1986) Developmental and seasonal changes in canary song and their relation to changes in the anatomy of song-control nuclei. Behav Neural Biol 46:445-47 1.
Saffen DW, Cole ?IJ, Worley PF, Christy BA, Ryder K, Baraban JM (1988) Convulsant-induced increase in transcription factor messen- aer RNAs in rat brain. Proc Nat1 Acad Sci USA 85:7795-7799.
Scharff C, Nottebohm F (199 1) A comparative study of the behavioral deficits following lesions of various parts of the zebra finch song system: implications for vocal learning. J Neurosci 11:2896-2913.
Scheich H, Bonke BA, Bonke D, Langner D (1979) Functional or- ganization of some auditory nuclei in the guinea fowl demonstrated by the 2-deoxyglucose technique. Cell Tissue Res 204: 17-27.
Sohrabji F, Nordeen EJ, Nordeen KW (1990) Selective impairment of song learning following lesions of a forebrain nucleus in the juvenile zebra finch. Behav Neural Biol 53:5 l-63.
Sukhatme VP, Cao X, Chang LC, Tsai-Morris CH, Stamenkovitch D, Ferreira PCP, Cohen DR, Edwards SA, Shows TB, Cut-ran T, LeBeau MM, Adamson ED ( 1988) A zinc finaer-encodina aene coreeulated with c-fos during growth and differeniiation, and after cellular de- polarization. Cell 53:37-t3.
Vicario DS, Yohay KH (1993) Song-selective auditory input to a forebrain vocal control nucleus in the zebra finch. J Neurobiol 24: 488-505.
Welty JC, Baptista L (1988) The life of birds. New York: Saunders. Wild J M (1987) Nuclei of the lateral lemniscus project directly to the
thalamic auditory nuclei in the pigeon. Brain Res 408:303-307. Williams H, Nottebohm F (1985) Auditory responses in avian vocal
motor neurons: a motor theorv for song. uerceotion in birds. Science -- _ 229~279-282.
Wisden W, Errington ML, Williams S, Dunnett SB, Waters C, Hitchcock D, Evan G, Bliss TVP, Hunt SP (1990) Differential exuression of
. I
immediate early genes in the hippocampus and spinal cord. Neuron 4:603-6 14.
Sa&i KD, Leppelsack H ( 198 1) Cell types of the auditory caudomedial


![Gro[ve] 1140 William Zenk](https://static.fdocuments.in/doc/165x107/568c526d1a28ab4916b6a0f4/grove-1140-william-zenk.jpg)