SONANGOL E.P....The Sociedade Nacional de Combustíveis de Angola E.P. (hereinafter referred to as...
79
SONANGOL E.P. Consolidated Financial Statements 31 December 2018
Transcript of SONANGOL E.P....The Sociedade Nacional de Combustíveis de Angola E.P. (hereinafter referred to as...

SONANGOL E.P. Consolidated Financial Statements 31 December 2018

SOCIEDADE NACIONAL DE COMBUSTÍVEIS DE ANGOLA E.P.
2
Consolidated Balance Sheet as at 31 December 2018 31-12-2018 31-12-2017
AOA AOA ASSETS Non-current Assets Tangible fixed assets 4 1,427,791,135,519 833,867,089,852 Intangible assets 5 65,055,668,899 35,477,064,092 Oil and Gas upstream assets 4A 4,141,965,041,037 2,370,485,025,148 Exploration and evaluation assets 5A 827,989,641,342 451,174,932,728 Investments in other companies 6 972,054,921,174 601,791,286,099 Other financial assets 7 333,970,509,182 181,763,430,194 Other non-current assets 9 709,235,219,260 388,313,688,276 Bank deposits 10 663,068,655,566 274,858,738,713 Total Non-current Assets 9,141,130,791,979 5,137,731,255,102
Current assets Inventories 8 204,104,316,321 126,240,720,456 Accounts receivable 9 2,928,069,885,516 1,713,473,047,540 Cash and cash equivalents 10 1,551,278,689,546 858,596,499,882 Other current assets 11 34,052,186,449 7,298,087,974 Total current Assets 4,717,505,077,832 2,705,608,355,852
Total Assets 13,858,635,869,811 7,843,339,610,954 EQUITY AND LIABILITIES Equity Share capital 12 1,000,000,000,000 1,000,000,000,000 Supplementary capital contributions 12 1,846,949,307,988 1,846,949,307,988 Reserves 13 1,415,803,192,806 1,346,521,000,053 Retained earnings 13 (2,165,823,031,272) (2,062,527,331,053) Foreign exchange translation adjustments (financial statements conversion)
3,436,998,202,866 1,067,706,825,505
Net profit 79,976,761,360 27,365,021,947 Total Equity 5,613,904,433,748 3,226,014,824,440
Non-current liabilities Loans 15 971,075,480,862 610,597,380,607 Employee benefits 17 516,303,538,194 330,695,963,713 Provisions for other risks and charges 18 2,641,237,059,474 1,462,051,935,441 Other non-current liabilities 19 241,365,110,003 131,764,122,060 Total non-current liabilities 4,369,981,188,533 2,535,109,401,821 Current liabilities Accounts payable 19 3,000,193,523,996 1,693,082,336,491 Loans 15 412,779,795,245 221,508,809,620 Other current liabilities 21 461,776,928,289 167,624,238,582 Total Current liabilities 3,874,750,247,530 2,082,215,384,693 Total Liabilities 8,244,731,436,063 4,617,324,786,514
Total Equity and Liabilities 13,858,635,869,811 7,843,339,610,954
Chief Accountant Financial Director
SIGNED ON THE ORIGINAL
SIGNED ON THE ORIGINAL
Armando Sebastião Registration No. 20150382
Divaldo Palhares Registration No. 20140034
Chief Financial Officer Chairman of the Board of Directors
SIGNED ON THE ORIGINAL
SIGNED ON THE ORIGINAL
Baltazar A. Miguel Sebastião Pai Querido Gaspar Martins

SOCIEDADE NACIONAL DE COMBUSTÍVEIS DE ANGOLA E.P.
3
Consolidated Income Statement by nature for the year ended 31 December 2018 31-12-2018 31-12-2017
AOA AOA
Sales 22 4,797,793,439,306 2,824,956,212,364 Services rendered 23 75,693,819,252 66,306,650,759 Other operating income 24 26,584,254,864 24,781,109,444
4,900,071,513,422 2,916,043,972,567 Variation in finished products and work in progress 25 (27,142,136,997) 11,288,316,275 Concessionaire cost (sales on behalf of the State) 26 (2,213,143,931,123) (1,302,579,051,974) Cost of goods sold and raw materials consumed 27 (765,997,408,359) (401,832,108,410) Oil and Gas exploration and operating costs 27A (405,558,049,640) (275,095,318,224) Personnel Costs 28 (220,935,435,315) (152,952,645,840) Depreciation and amortisation 29 (728,410,199,287) (425,011,738,358) Other operating expenses 30 (166,816,801,231) (169,602,892,173)
(4,528,003,961,952) (2,715,785,438,704) Operating income: 372,067,551,470 200,258,533,863 Financial results 31 (401,828,679,971) 67,034,536,041 Results from investments in other companies 32 34,422,374,437 22,452,427,371 Non-operating results 33 294,601,650,260 (170,849,571,046)
(72,804,655,274) (81,362,607,634) Profit before tax: 299,262,896,196 118,895,926,229 Income tax 35 (229,724,462,900) (93,789,703,582) Net income from current activities: 69,538,433,296 25,106,222,647 Extraordinary results 34 10,438,328,064 2,258,799,300 Net profit 79,976,761,360 27,365,021,947
Chief Accountant Financial Director
SIGNED ON THE ORIGINAL
SIGNED ON THE ORIGINAL
Armando Sebastião Registration No. 20150382
Divaldo Palhares Registration No. 20140034
Chief Financial Officer Chairman of the Board of Directors
SIGNED ON THE ORIGINAL
SIGNED ON THE ORIGINAL
Baltazar A. Miguel Sebastião Pai Querido Gaspar Martins

SOCIEDADE NACIONAL DE COMBUSTÍVEIS DE ANGOLA E.P.
4
Notes to the Consolidated Financial Statements for the year ended 31 December 2018 1. BUSINESS ACTIVITY AND CORPORATE INFORMATION
The Sociedade Nacional de Combustíveis de Angola E.P. (hereinafter referred to as “Sonangol EP” or “Company” individually or “Sonangol Group” or “Group” when referred as Sonangol EP and the entities included in the consolidation perimeter, as defined by the Board of Directors of Sonangol E.P.) has its headquarters in Rua Rainha Ginga n.º 29-31 – Luanda, Angola. Its main activity is to operate in the oil and gas industry from the early stage of exploration, appraisal and production of hydrocarbons (upstream), to all the related activities up to sale to the final customer (midstream & downstream).
In accordance with Law No. 10/04 (Oil Activities Law), Sonangol EP was designated the Entity to which the Angolan State has granted the mining rights of exploration, development and production of liquid and gaseous hydrocarbons. This concession is valid until 18 April 2019, date from which Agência Nacional de Petróleo, Gás e Biocombustíveis (ANPG) will take on these roles, as disclosed in note 42. As the National Concessionaire, Sonangol E.P. is authorised to jointly perform petroleum operations together with foreign or Angolan companies in national territory. These operations are substantiated in Association Contracts, Production Sharing Agreements and Service Contracts with Risk.
The Group is present in various activities related with Oil and Gas, related activities and others, which are divided into 5 main
segments, as follows:
Corporate & Financing
This segment includes the activities related with core financial investments and with the Sonangol Group financing. Upstream This segment incorporates crude Oil and gas exploration and production activities onshore and offshore, either as operator or non-operator of joint arrangements. Midstream This segment includes the activities of refining and transportation of crude oil, natural gas and by-products. Downstream This segment includes storage, supply and distribution of crude oil and natural gas by-products to the final customer. Non-core This segment includes all other Group activities, not related with the value chain of the oil and gas business.
These consolidated financial statements were approved by the Board of Directors of Sonangol EP at the Board meeting held on 16 July 2019, being further subject to the approval of the Shareholder and Supervising Government member, which have the ability to change them after the authorisation for issue of the Board of Directors of Sonangol EP.
It is the opinion of the Board of Directors of Sonangol EP that these consolidated financial statements present a true and fair view of the Sonangol Group operations and its financial position, in accordance with the accounting policies and principles presented in Notes 2 and 3.

SOCIEDADE NACIONAL DE COMBUSTÍVEIS DE ANGOLA E.P.
5
2. ACCOUNTING POLICIES USED IN THE PREPARATION OF THE CONSOLIDATED FINANCIAL STATEMENTS
2.1 Basis of preparation and presentation of the Financial Statements
2.1.1 Basis of preparation and accounting framework used These consolidated financial statements and related notes were prepared in accordance with the accounting principles and policies established and approved by the Board of Directors in the Accounting Policies Manual of Sonangol (Manual de Políticas Contabilísticas da Sonangol) and which take by reference the National Accounting Standards and certain provisions from the International Financial Reporting Standards (IFRS) in force. These principles are fully explained throughout Notes 2 and 3 of these Financial Statements.
For the preparation of these Financial Statements, the Sonangol Group followed the historical cost principle, except for Note 2.3. r), under which the assets were recognised by the amount of cash or cash equivalents paid or payable, at the exchange rate for the presentation currency, at acquisition date, and the liabilities were recognised by the amount of products and services received in exchange for the present obligation or the amount of cash payable, at the exchange rate for the presentation currency, at transaction date.
The carrying amounts of monetary items nominated in foreign currencies (against the presentation currency) are updated using the exchange rate at reporting date, based on the reference selling exchange rates published by the National Bank of Angola (Banco Nacional de Angola) at that date. As at 31 December 2018, the last sale rate published by the National Bank of Angola was considered. The carrying amounts of non-monetary items recorded at historical cost and nominated in foreign currencies (against the presentation currency) are translated at the exchange rate of the transaction date and are not updated at each reporting date. Favourable and unfavourable exchange rate differences are recognised in the Income Statement, under Financial income or Financial expenses, respectively, either these are favourable or unfavourable to the Group. Non-monetary assets and liabilities expressed in foreign currency recorded at fair value are translated at the exchange rate prevailing on the date the fair value was determined.
The Financial Statements were prepared in accordance with the characteristics of relevance and reliability and were prepared on a going concern and accrual basis assumptions in compliance with the accounting principles of consistency, materiality and comparability. 2.1.2. Basis of presentation of the Consolidated Financial Statements
The Group’s Consolidated Financial Statements and related Notes are presented in Kwanzas, in accordance with the classification, format and order outlined in the General Accounting Plan (Plano Geral de Contabilidade or PGC), in compliance with the Decree no. 82 of 16 November 2001, adjusted by the introduction of specific items relating to the Group's core activity (oil and gas industry) and by certain provisions absent from the PGC. Notes not mentioned are not applicable to the Sonangol Group, either for not being materially relevant, or as a result of the adopted accounting policies.
The Group has also considered the extent to which the currency of the financial statements of the entities included in the consolidation perimeter differs from the one used by Sonangol Group.
For entities that present their financial statements in a currency other than Kwanza, the Sonangol Group has translated those financial statements into the presentation currency of the Group, using the exchange rates of the National Bank of Angola as follows: (i) assets and liabilities were translated at the exchange rate in force at the reporting date; (ii) income and expenses were translated at the average exchange rate of the year and; (iii) equity was translated at the historical exchange rate, being the correction of fundamental errors recorded in retained earnings transposed considering the previous year’s average exchange rate. The resulting exchange differences are recognised in Equity under the caption Foreign exchange translation adjustments (financial statement conversion).
The exchange rates used to translate the balances presented in a currency other than Kwanza were as follows:

SOCIEDADE NACIONAL DE COMBUSTÍVEIS DE ANGOLA E.P.
6
Closing Exchange Rate 2018 2017 1 USD = 310.158 AOA 166.749 1 EURO = 354.728 AOA 186.303 1 GBP = 391.978 AOA 225.561 1 ZAR = 21.440 AOA 13.458 Average Exchange Rate 2018 2017 1 USD = 253.265 AOA 166.742 1 EURO = 297.482 AOA 186.296 1 GBP = 342.937 AOA 216.469 1 ZAR = 19.483 AOA 12.624
2.1.3 Comparability of the financial statements The elements included in these financial statements are, as a whole, comparable with the previous period, except for:
— situations considered as fundamental errors recognised under Other reserves and Retained earnings, as disclosed in Note 13;
— the disclosed in Note 2.4, regarding the change in the accounting policy related to the recognition of unrealised exchange rate differences generated by the application of the exchange rate at the reporting date to the provisions for abandonment.
2.1.4 Consolidation perimeter The Sonangol Group has prepared its Consolidated Financial Statements, for the first time, in 2013. The definition of the consolidation perimeter, of the entities to be included or excluded and the consolidation method to be applied, was defined by the Board of Directors for the purpose of providing the relevant information required by the Shareholder, the relevant authority and the financing entities of Sonangol Group, as well as to provide accurate information for the purpose to which these financial statements were prepared. The exclusion criteria from full consolidation were, among others, the immateriality of the subsidiary, the absence of financial information prepared in a timely manner and the existence of severe and long-term restrictions which, in accordance with the Board of Directors, substantially damage the control exercised by the Sonangol Group of its rights over the assets or the management of the subsidiary.
In the consolidation process, the following procedures were followed:
• Standardisation of accounting policies and conversion of the financial statements, when the accounting policies adopted and the currency of presentation differ from those used by the parent company;
• Sum of the financial statements of the subsidiaries included in the consolidation by the full consolidation method;
• Write-off of the financial investments held in the subsidiaries against related equity;
• Adjustments related with the use of the acquisition method – calculation of goodwill and of the non-controlling interests;
• Elimination of intra group balances and transactions;
• Other necessary consolidation adjustments.
The entities integrating the Group, the percentage of shares held and the nature of the financial investment (subsidiary, joint arrangements, associate, other) are disclosed in Note 3 for subsidiaries consolidated by the full consolidation method and Note 6 for other participated entities.
In comparison with the perimeter that was the basis for the preparation of the consolidated financial statements of 2017, no changes have occurred.
2.2 Judgements, estimates and significant assumptions used
The preparation of the Consolidated Financial Statements requires judgements, estimates and assumptions that affect the amount of income, expenses, assets and liabilities, and related disclosures, and the disclosure of contingent liabilities at the date of the consolidated financial statements.

SOCIEDADE NACIONAL DE COMBUSTÍVEIS DE ANGOLA E.P.
7
Estimates and judgements are reviewed on an ongoing basis and based on Management experience and other factors, including expectations of future events that are believed to be reasonable according to the circumstances. However, uncertainty related to assumptions used and the estimates made, may lead to conclusions that require material adjustments to book values of assets and liabilities in future periods.
In particular, the Group has identified the following areas where significant judgements, estimates and assumptions are required. Additional information on each of these areas and how these impact the various accounting policies are described below and also in the relevant notes to the consolidated financial statements.
Changes in estimates are treated prospectively.
2.2.1 Judgements
(i) Joint arrangements
The Board of Directors exercises judgement to determine when the Group has joint control over an arrangement, which requires an assessment of the relevant activities and when decisions relating to those activities require unanimous consent. The Group has determined that the relevant activities for its joint arrangements are those relating to the operations and equity decisions, such as the approval of the annual investment program and to nominate, remunerate and destitute the personnel responsible for the management or suppliers of the joint arrangement. See Note 2.3.b) for further details.
Judgement is also required to classify a joint arrangement. Classifying the joint arrangement requires the Board of Directors to assess their rights and obligations arising from the arrangement. In particular, the Board of Directors considers:
• The structure of the joint arrangement – whether it is structured through a separate vehicle; • When the arrangement is structured through a separate vehicle, the Board of Directors also considers the rights and
obligations arising from: − The legal form of the separate vehicle; − The terms of the contractual arrangement; − Other facts and circumstances (where relevant).
This assessment often requires significant judgement and may affect significantly the accounting treatment. Joint arrangements are measured at cost less impairment losses.
(ii) Contingencies
By their nature, contingencies are resolved only when one or more uncertain future events occur or fail to occur. The assessment of the existence and potential amount of contingencies inherently involves the exercise of significant judgement and the use of estimates regarding the outcome of future events.
The final cost of legal proceedings, settlements and other litigation may vary due to estimates based on different interpretations of the standards, opinions and final assessments of the amount of losses. Therefore, changes in circumstances related to contingencies may have a significant impact on the amount of provision for contingencies recorded.
(iii) Determination of the functional and the reporting currencies
In determining the functional currency, management uses its judgement to determine the currency of the principal economic environment in which each subsidiary operates, namely the currency that most accurately represents the economic effects of the transactions, events and related conditions. As a result of this assessment, as well as of the legal provisions in force, management considers that Kwanza (AOA) constitutes the functional currency of Sonangol E.P., which is the currency of presentation of these consolidated financial statements.

SOCIEDADE NACIONAL DE COMBUSTÍVEIS DE ANGOLA E.P.
8
2.2.2 Estimates and significant assumptions The key assumptions concerning the future and other key sources of uncertainty in estimates calculated at the reporting date that have a significant risk of causing a material adjustment to the carrying amounts of assets and liabilities during the subsequent period, are described below. The Group supports its assumptions and estimates based on parameters and information available when the consolidated financial statements are prepared. Circumstances and assumptions about future developments, however, may change due to market changes or circumstances arising beyond the control of the Group. Such changes are reflected in the assumptions when they occur. (i) Hydrocarbon reserves
The estimation of crude oil reserves are an integral part of the decision-making process relating to the assets of upstream activities, in addition to supporting the development or implementation of assisted recovery techniques (secondary and tertiary).
The volumes of proven crude oil reserves that the Group uses for the preparation of financial statements arise from external independent expert reports. This information is updated annually and is used to calculate the depreciation of assets relating to the oil and gas production activity according to the unit of production method as well as for the annual recognition of decommissioning costs of the blocks. For evaluation of impairment of investments in assets relating to upstream activity (see Note 2.2.2 v)), the Group uses sources of information certified by independent entities considering proven and probable reserves as well as the future investment to be made to access these reserves.
The estimate of reserves is subject to future revisions, based on new information available, for example, for development activities (drilling and production), prices, contract termination dates or development plans (sanctioning development projects), the arrival of new technologies, etc. The impact on depreciation and provisions for dismantling resulting from changes in estimated reserves is treated prospectively, written-off the remaining net value of assets and increasing the provision for decommissioning costs, respectively, according to the expected future production.
(ii) Exploration and evaluation expenditures
The application of the Group’s accounting policy for exploration and evaluation expenditure requires judgement to determine whether future economic benefits are probable, from either future use or sale, or whether activities will reach a stage which permits a reasonable assessment of the existence of reserves. The determination of reserves and resources is itself an estimation process that involves several degrees of uncertainty depending on how the resources are classified. The expenditure capitalisation policy requires management to make certain estimates and assumptions about future events and circumstances, in particular, whether an economically viable extraction operation can be established. Such estimates and assumptions may change as new information becomes available. If, after expenditure is capitalised, information is made available suggesting that the recovery of the expenditure is no longer probable, an impairment loss is recognised in the Income Statement for the amounts previously capitalised.
(iii) Depreciation of Oil and Gas assets – Units of production method
Oil and gas assets are depreciated according to the units of production method (UOP) method over total proven developed hydrocarbon reserves. This results in a depreciation charge proportional to the depletion of the remaining production from the field. The useful life of each asset, which is assessed at least on an annual basis, considers both its physical life limitations and current assessments of economically recoverable reserves from the field on which the asset is located. The calculation of the depreciation ratio using the UOP is impacted by changes in the estimated future reserves. Changes in proven reserves may occur due to changes in assumptions used in reserve estimates, namely estimated future prices. (iv) Useful lives and residual values of tangible fixed assets
The calculation of the assets residual values and useful lives and the depreciation/amortisation method to be applied is crucial to determine the amount of depreciation and amortisation to be recognised in the consolidated income statement for each period. These two parameters are defined according to the best judgement of the Board of Directors for the respecting assets.

SOCIEDADE NACIONAL DE COMBUSTÍVEIS DE ANGOLA E.P.
9
(v) Recoverability of oil and gas assets
The Group assesses its asset or cash-generating unit at each reporting period to determine whether any sign of impairment exists. For the specific situation of goodwill, this is assessed annually for impairment at each reporting date. Whenever an impairment sign is identified, an estimate of the recoverable amount is made, which is considered the higher of fair value less costs to sell and value in use.
In determining the recoverable amount of an asset, and particularly the fair value less costs to sell, in situations where there were no recent market transactions, the Group used discounted cash flow techniques, and the assumptions were adjusted based on the assumptions that market participants would use to evaluate the asset, cash-generating unit or a group of cash-generating units. According to this approach, cash flows and discount rates are considered after taxes.
Oil and gas upstream assets
The recoverable amount of oil and gas upstream assets was determined in accordance with the best estimate of the Group’s Board of Directors, based on its value in use, corresponding to the discounted value of the estimated cash flows for the exploration period of the blocks / fields considering the following assumptions:
• Proven and probable reserves (2P reserves) certified by external independent experts; • Oil and natural gas price curve and price differentials for each oil sector ($54.65/barrel in 2019, $62.65/barrel in
2020, $70/barrel in 2021 and a 2% growth in the following years); • Discount rates between 11% and 12%; • Operating costs (production cost per barrel); • Future capital expenditures (capex); • Dismantling costs (based on up-to-date information from operators); • Working interest and net entitlement rates.
Impairment losses recognised, resulting from impairment tests performed in USD are subsequently translated to AOA at the exchange rate at reporting date.
The oil and gas upstream assets tested are disclosed in Note 4.A. Oil and gas upstream assets, net of any impairment loss recognised in the period and in previous periods.
Exploration and evaluation assets
The Group uses the successful effort method for the capitalisation of its exploration and evaluation assets, i.e., expenditures incurred are capitalised to the extent that will result in the discovery of hydrocarbon resources with technical, economic and commercial viability and the outcome of the evaluation activities, such as additional well drilling or delineation wells would result to be positive and favourable to the extraction of the discovered hydrocarbons.
When determining the recoverable amount of exploration and evaluation assets, the Group’s Board of Directors has used its best estimate to determine if the expected future economic benefits with the extraction of the hydrocarbons are higher than the investment performed, having considered for the effect the probable reserves in the testing areas.
This analysis was performed in USD and subsequently translated to AOA at the exchange rate at reporting date.
The exploration and evaluation assets that were tested are disclosed in Note 5.A. Exploration and evaluation assets, net of any impairment loss calculated in the period and in previous periods.
Real Estate
The Group has several real estate investments (lands, buildings or part of buildings) held for capital appreciation to obtain income.
In determining the recoverable amount, the Group’s Board of Directors has considered the amounts determined according to the income approach method by external experts, considering the best use that the market would give to the asset.

SOCIEDADE NACIONAL DE COMBUSTÍVEIS DE ANGOLA E.P.
10
Real estate assets are disclosed in Note 7 Other financial assets – investment in real estate investments, net of impairment losses.
Goodwill
Sonangol Group has goodwill related to the acquisition of Luanda’s Refinery fom Fina Petróleos corresponding to an independent cash-generating unit (CGU).
The recoverable amount of goodwill was determined in accordance with the best estimate of the Group’s Board of Directors, based on cash flows projections for periods of five years and a perpetuity without growth rate and being considered assumptions regarding the oil and natural gas prices curves (considering current and historical prices, price trends and related factors), discount rates, operating costs, including downtime costs (where applicable), future capital requirements and operating performance.
For impairment tests, the Group has considered a nominal discount rate in AOA of about 18% for Luanda’s Refinery.
Goodwill is disclosed in Note 5 Other intangible assets, net of impairment losses.
Financial investment in Angola LNG
The recoverable amount of the financial investment held in Angola LNG was determined in accordance with the best estimate of the Group’s Board of Directors, based on value in use, which was determined based on the cash flows of the business, the natural gas prices curve (considering current and historical prices, price trends and related factors), discount rates, operating costs estimate, future capital requirements and operating performance (including production volumes and sales).
In the impairment test conducted in 2018, prepared in USD (the test result is subsequently converted to AOA at the exchange rate at the reporting date), the Group considered the study parameters, namely the discount rate which were tested within a range of 6.41% and 10.72%, that returned a Net Present Value (NPV) of USD 9.7 and USD 7.6 billion respectively. It should be noted that market risk was favourably appreciated considering the expectation of a market price recovery as well as the provision of additional gas from the free areas.
Financial investment held in Angola LNG is disclosed in Note 6.2.1 Financial investment in Angola LNG, at acquisition cost net of impairment losses. Estimates and assumptions related with the recoverability of the assets “Oil and gas upstream assets”, “Exploration and evaluation assets”, “Real estate investments” and “Goodwill” and other assets are subject to risk and uncertainties, therefore there is a possibility that changes in circumstances as well as in internal and external environment may impact these projections, which may affect the recoverable amount of assets and/or cash-generating units.
(vi) Decommissioning costs
Decommissioning costs will be incurred by the Group at the end of the operating life of some of the Group’s facilities and properties. The Group assesses its decommissioning provision at each reporting date, the extension of the evaluation depends of significant changes in key assumptions and market information. The ultimate decommissioning costs are uncertain and cost estimates can change in response to many factors, including changes to relevant legal requirements and development of new environmental restoration techniques. The expected timing, extent and amount of expenditure may also change — for example, in response to changes in reserves or changes in laws and regulations or their interpretation. Consequently, there could be significant adjustments to current provisions, which may affect the Group’s future operating and non-operating results. The evaluation of future decommissioning costs is supported by the work of external or internal evaluators. The involvement of independent evaluators is determined on an individual basis, taking into account factors such as the total value of the cost or time period of the decommissioning, and is approved by the Board of Directors. The selection criteria include market knowledge, reputation and independence.

SOCIEDADE NACIONAL DE COMBUSTÍVEIS DE ANGOLA E.P.
11
The exchange differences generated by the application of the exchange rate at the reporting date to the provisions for abandonment, are capitalised and not recognised in the income statement, as disclosed in note 2.4.The decommissioning provision at the reporting date represents the best estimate of the Board of Directors on the present value of the future decommissioning costs obligation. Regarding the upstream costs of abandonment, cost estimates are determined by development area or by block. Estimated costs include the costs forecasted to be incurred in a future date, with the removal of facilities, closure and abandonment of wells and support services required for these activities. An inflation rate of 2% was used to update the estimate of future abandonment expenditures according to the expectation of inflation associated with the US market. Decommissioning is considered a future liability that is presented each year at the present value. The nominal discount rate used was 4.94%, considering the current market conditions.
(vii) Pension post-employment benefits
Determining pension and other employee benefits liabilities requires the use of assumptions and estimates, including actuarial assumptions and projections, discount rates and pension and salary growth rates, estimated costs with future medical care and other factors that can impact the cost and liability of pension plans, medical plans and other benefits. Changes to these assumptions could materially affect the amounts determined. Employee benefits at the reporting date represent the Board of Director’s best estimate of the present value of the obligation. (viii) Impairment of accounts receivable
Impairment losses relating to doubtful debts are estimated by Sonangol based on the estimated recoverable amounts, the date of default, debt write offs and other factors. Certain circumstances and facts may change the estimated impairment losses of doubtful debts, namely changes in the economic environment, economic sector trends, increases in the main client’s credit risk and significant defaults. Changes to these estimates could affect the determination of different levels of impairment, thereby affecting results. (ix) Provisions for inventories
Inventories are reviewed for impairment purposes whenever there are facts or circumstances indicating that their net realisable value is below its cost. Considering the uncertainties regarding the recoverability of the net realisable value of inventories because they are based on the best available information at the time, changes in the assumptions used could result in impacts on the determination of the level of provisions for inventories and, consequently, on the results of the Group. (x) Contingent assets and liabilities
Contingent liabilities are not recognised in the financial statements, and they are disclosed, unless the possibility of an outflow of resources that incorporates economic benefits is remote, in which case they are not disclosed. Contingent assets are not recognised in the financial statements and are disclosed when an inflow of economic benefits is probable. Contingent assets and liabilities are evaluated periodically to ensure that updates are appropriately reflected in the financial statements. If it becomes probable that an outflow of future economic benefits will be required for an item previously treated as a contingent liability, a provision is recognised in the financial statements in the period in which the change in probability occurs. If it becomes virtually certain that an inflow of economic benefits will occur, the related asset and income are recognised in the financial statements in the period in which the change occurs. (xi) Tax Revisions
There are several transactions and calculations for which the determination of the final amount of tax payable is uncertain during the normal business cycle. Other interpretations and estimates could result in a different level of current income tax recognised in the period.

SOCIEDADE NACIONAL DE COMBUSTÍVEIS DE ANGOLA E.P.
12
In Angola, the fiscal and tax authorities are entitled to review the calculation of the taxable income determined by the Group for a period of 5 years. As a result, it is possible that there are corrections to the taxable income, resulting from differences in the interpretation of tax legislation. The Group recognises liabilities for additional tax settlements that may be derived from revisions made by the tax authorities. When the outcome of these matters is different from amounts initially recorded, the differences will have an impact on income tax and provisions, in the period in which such differences are identified. For the years in which the final amount to be paid is not fixed, the best estimate is calculated based on the limitations identified and the success history of previous years. It is the management's belief that there are no relevant, actual or contingent tax liabilities that have not been recorded or disclosed and that no corrections will occur by the tax authorities with a material effect on the Group's accounts. 2.3 Basis of valuation adopted in the preparation of the Consolidated Financial Statements
(a) Investments in subsidiaries, associates and other companies
The consolidated financial statements of Sociedade Nacional de Combustíveis de Angola – Empresa Pública (Sonangol E.P.) for the year ended 31 December 2018, comprise the financial statements of the parent company (Sonangol E.P.) and of the subsidiaries mentioned in Note 3, following the criteria set out in Note 2.1.4. Subsidiaries are those entities (including structured entities) over which the Group exercises control and for which the exclusions mentioned in Note 2.1.4 are not applicable. The Group considers that controls an entity when it is exposed, or has rights, to variable returns resulting from its involvement with the investee and has the potential to affect those same returns through its power over the investee. In particular, the Group controls an investee if, and only if, the Group presents:
• Power over the investee (e.g., existing rights that allow to direct the relevant activities of the investee); • Exposure or rights, to variable returns resulting from its involvement with the investee; • The ability to use its power over the investee to affect its returns.
When the Group has less than the majority of votes, or similar, rights over an investee, it considers all relevant facts and circumstances when considering whether it has control over an investee, including:
• Contracted agreements with other shareholders of the investee; • Rights arising from other contracted agreements; • Voting rights and potential voting rights of the Group.
The entities that are subsidiaries and are part of the consolidation perimeter defined by the Board of Directors of Sonangol, are consolidated by the full consolidation method and are listed in Note 3.
The Financial Statements of subsidiaries are prepared at the same reporting date, using consistent accounting policies between the subsidiaries and the Group.
When necessary, adjustments are made to the financial statements of subsidiaries to ensure that these accounting policies are consistent with the Group's accounting policies. All balances and transactions between Group companies are totally eliminated in the consolidation process.
A change in the ownership percentage of a subsidiary that does not result in a loss of control is treated as an equity transaction. When the Group loses control over a subsidiary, the Group proceeds as follows:
• Assets (including Goodwill) and liabilities of this subsidiary are derecognised; • Non-controlling interests are derecognised; • Accumulated translation adjustments are derecognised; • Fair value of the consideration received is recognised; • Fair value of the share capital retained is recognised; • Any difference in current year income and equity is recognised; and

SOCIEDADE NACIONAL DE COMBUSTÍVEIS DE ANGOLA E.P.
13
• Reclassification of the Group’s components formerly recognised in equity into income, expenses or retained earnings as appropriate, as if it would be recognised if the Group had sold the related assets and liabilities.
(b) Investments in joint agreements
A joint arrangement is an economic activity undertaken by two or more parties, subject to joint control through a contractual arrangement. Joint control is the contractually agreed control sharing of an arrangement, whereby the Strategic, Finance and Operating decisions of the business activity requires unanimous consent of the parties sharing control. i) Joint operations
Joint agreements are those in which two or more parties have shared control over a certain asset. Joint control happens only when decision on relevant activities (being these the activities that can affect the project’s profitability), require unanimous approval from the parties.
Joint operations are a type of joint arrangement whereby the parties that have joint control of an economic activity have rights to the assets and obligations for the liabilities, relating to the arrangement.
In relation to its interests in joint operations, the Group recognises its:
• Assets, including its share of any assets held jointly; • Liabilities, including its share of any liabilities incurred jointly; • Revenue from the sale of its share of the output arising from the joint operation; • Share of the revenue from the sale of the output generated by the joint operation; • Expenses, including its share of any expenses incurred jointly.
ii) Joint ventures Joint ventures are a type of joint arrangement whereby the parties that have joint control of the arrangement have rights to the net assets (equity) of the joint arrangement. The Group’s investments in its joint venture are recorded at its acquisition cost less impairment losses, and are disclosed in Note 6.1. (c) Other financial investments Except for financial investments measured at fair value (see Note 2.3 r), 6.3 and 7) the remaining financial investments (i.e. equity instruments in third party entities) are measured at acquisition cost net of impairment losses (where applicable), and are disclosed in Note 6.2. (d) Business combinations and Goodwill
Business combinations are accounted for by applying the acquisition method. The cost of an acquisition is measured at the fair value of the assets transferred, equity instruments issued and liabilities incurred or assumed at acquisition date. The identifiable assets acquired, liabilities and contingent liabilities assumed in a business combination are initially measured at fair value at acquisition date, regardless if there are any non-controlling interests. The excess of the acquisition cost over the fair value of the interest held in the identifiable net assets is recognised as goodwill.
Acquisition related costs are expensed as incurred.
If fair value of net assets acquired is greater than the aggregate consideration transferred, before recognising a gain, the Group reassesses whether it has correctly identified all of the assets acquired and all the liabilities assumed and reviews the procedures used to measure the amounts to be recognised at acquisition date. If the assessment still results in an excess of the fair value of net assets acquired over the aggregate consideration transferred, then the gain is recognised in the income statement.
SOCIEDADE NACIONAL DE COMBUSTÍVEIS DE ANGOLA E.P.
14
After initial recognition, goodwill is measured at cost less any accumulated impairment losses. For the purpose of impairment testing, goodwill acquired in a business combination is, from the acquisition date, allocated to each of the Group’s Cash Generating Unit´s that are expected to benefit from the business combination, irrespective of whether other assets or liabilities of the acquiree are assigned to those units. (e) Exploration and evaluation expenditure
The Group applies the Successful Effort method to account for the exploration and evaluation expenditure, and the subsequent development costs, as detailed in Notes 5A and 27A.
i) Pre-license costs
Pre-license costs are recognised in the income statement in the period in which they are incurred.
ii) License and property acquisition costs
Exploration and property licenses acquisition costs are capitalised in intangible assets under “Exploration and evaluation assets” caption and are amortised over the period covered by the license. Exploration and property licenses acquisition costs are reviewed at each reporting date to confirm that there is no indication that the carrying amount exceeds the recoverable amount. This review includes confirming that exploration drilling is still in progress or firmly planned, or that it has been determined, or work is already in progress to determine that the discovery is economically viable based on a range of technical and commercial considerations and that sufficient progress is being made on establishing development plans. If no future activity is planned or the license has been abandoned, cancelled or has expired, the carrying amount of the exploration and property license is written-off through the Income Statement. iii) Exploration and evaluation costs
Exploration and evaluation activity involves the search for hydrocarbon resources, the determination of technical feasibility and the assessment of commercial viability of identified resources.
Geology and geophysical costs are recognised in the Income statement as incurred.
Once the legal right to explore has been acquired, costs directly associated with exploration wells are capitalised as exploration and evaluation intangible assets until the drilling of the well is complete and the results have been evaluated. These costs include directly attributable employee remuneration, materials and fuel used, rig costs and payments made to contractors. If no potentially commercial hydrocarbons are discovered, exploration assets are recognised in the Income Statement as a dry well (non-operating costs). If extractable hydrocarbons are found and, subject to further appraisal activity (e.g., the drilling of additional wells), it is probable that they can be commercially developed, the costs continue to be carried as an intangible asset while sufficient/continued progress is made in assessing the size, characteristics and commercial potential of a reservoir following the initial discovery of hydrocarbons, including the costs of appraisal wells where hydrocarbons have not yet been found. Such capitalised costs are subject to technical, commercial and management review, as well as review for indicators of impairment at least once a year. This is to confirm the continued intention to develop or otherwise extract value from the discovery. When this is no longer the case, the costs are recognised in the Income Statement. When proven reserves of oil and natural gas are identified and development is approved, the relevant capitalised expenditure are first assessed for impairment signs and (if required) any impairment loss is recognised in the Income statement and the remaining balance is transferred to Oil and gas upstream assets. Other than license costs, amortised over the licence period, no amortisation is booked during the exploration and development phase. iv) Development costs
Expenditure incurred with the construction, installation or completion of infrastructure facilities such as platforms, pipelines and drilling of development wells are capitalised within oil and gas upstream assets as disclosed in the current Note.

SOCIEDADE NACIONAL DE COMBUSTÍVEIS DE ANGOLA E.P.
15
(f) Oil and gas upstream assets and Other tangible fixed assets
The Group considers as oil and gas upstream assets, those property, plant and equipment items directly related with oil and gas fields / blocks. These assets are disclosed separately on the face of the balance sheet under the caption Oil and gas upstream assets. i) Initial recognition
Oil and gas upstream assets and other tangible fixed assets are initially measured at acquisition cost, less accumulated depreciation and accumulated impairment losses (if and where applicable). The acquisition cost of the asset comprises its acquisition or construction cost, which includes the purchase, transportation, assembly and installation costs and other directly attributable costs to bring the asset into operation and the Group’s initial estimate for the decommissioning and removal obligation. As for qualifying assets, i.e., an asset that takes a substantial period to get ready for its intended use or sale (above 12 months), it also includes the associated borrowing costs. Specifically, for oil and gas upstream assets, when a development project moves into the production stage, the capitalisation of certain construction / development costs ceases, and costs are either regarded as part of the cost of inventories or as expenses, except for costs which qualify for capitalisation relating to oil and gas property asset additions, improvements or new developments. The subsequent costs are included in the assets carrying amount or recognised as separate assets, as appropriate, only when is likely that future economic benefits will flow to the Group and the respective cost can be reliably measured.
ii) Capitalisation of borrowing costs and other directly attributable costs
Interest on loans attributable to the acquisition or construction of assets is capitalised as part of the cost of these assets. An asset eligible for capitalisation is an asset that requires a substantial period of time to be available for sale or use. The amount of interest to be capitalised is determined by applying a capitalisation rate on the value of the investments made. The capitalisation rate corresponds to the weighted average interest rate on loans outstanding in the period. The capitalisation of borrowing costs begins when expenditures for the assets begins, borrowing costs have been incurred and activities necessary to prepare all or part of the assets for their intended use or sale are in progress. Capitalisation ceases when all activities necessary to place the asset as available for sale or use are substantially completed. The Group suspends the capitalisation of borrowing costs during extended periods when the development of a qualifying asset is suspended or if, because of such capitalisation, the adjusted cost of the asset exceeds the lowest of the amount of replacement, the recoverable amount from its sale (realisable value) or the value in use of the asset. iii) Amortisation
Amortisations of oil and gas upstream assets and other tangible fixed assets, begins when the asset has the conditions to be used, i.e., when it is located and in the necessary conditions for its intended use, and cease when the future economic benefits incorporated are extinct either for impairment or derecognition.
Oil and gas upstream assets Oil and gas upstream assets are amortised on a unit-of-production basis, determined in accordance with the ratio between the hydrocarbons production volume in each period and the total proven developed hydrocarbons reserves (Reserves 1PD) at the end of the year plus the volume of production of hydrocarbons verified in the period.

SOCIEDADE NACIONAL DE COMBUSTÍVEIS DE ANGOLA E.P.
16
Other tangible fixed assets
Other tangible fixed assets are depreciated on a straight-line basis over their estimated useful lives on a duodecimal basis. The main depreciation rates correspond to the following estimated useful life (except for major inspection costs, which are depreciated over three to five years, which represents the estimated period before the next planned major inspection):
Class of Assets Years
Building and other constructions 10-50
Basic equipment:
- Constructions, equipment 15 – 18
- Other 3 – 10
Transport equipment 3 – 8
IT equipment 3 – 7
Administrative equipment 3 – 10
The asset’s residual values, useful lives and methods of amortisation are reviewed at each reporting period and adjusted prospectively, if appropriate.
iv) Derecognition
Oil and gas upstream assets
In accounting for farm-out arrangements outside the exploration phase, the Group: • Derecognises the proportion of the asset sold; • Recognises a gain or loss on the transaction for the difference between the fair value of the farm out and its carrying
amount. A gain is only recognised when the value of the consideration can be determined reliably. Otherwise, the Group recognises the consideration received as a reduction in the carrying amount of the underlying asset. Gains or losses from write-offs or disposals are recognised in the income statement as Other non-operating results;
• Impairment tests are carried out to retained amounts if the terms of the arrangement indicate that retained interests may be impaired.
Other tangible assets
An item of tangible fixed assets is derecognised upon abandonment or when no future economic benefits are expected from its use or disposal. Any gain or loss arising on derecognition of the asset (calculated as the difference between the recoverable amount and its carrying amount) is included in the Income Statement when the asset is derecognised.
v) Major maintenance, inspections and repairs
Expenditure on major maintenance, inspections or repairs comprise the cost of replacement assets or parts of assets. When an asset, or part of an asset that was separately depreciated is replaced and it is probable that future economic benefits associated with the new item will flow to the Group, the replacement cost is capitalised.
When part of the asset replaced was not separately considered as a component and therefore not depreciated separately, the replacement value is used to estimate the carrying amount of the replaced asset(s) and is immediately written off.
Inspection costs associated with major maintenance programs are capitalised and amortised over the period until the next inspection. All other day-to-day repairs and maintenance costs are expensed as incurred.
(g) Reversible assets
Under the contracts signed between Sonangol EP, as National Concessionaire of the rights to explore, develop and produce liquid and gaseous hydrocarbons, with the Contractor Groups that operate oil blocks, there are several assets acquired by these Contactor Groups that, at the end of the concession arrangements, will return to Sonangol EP, known as reversible assets.

SOCIEDADE NACIONAL DE COMBUSTÍVEIS DE ANGOLA E.P.
17
Reversible assets correspond to assets that are deducted from the oil-profit concept of oil and gas operations, and as such are deducted from the contributions made by the Contractor Groups to the National Concessionaire. Sonangol EP recognises these assets as tangible fixed assets when the risks and rewards of the assets are substantially transferred to Sonangol EP. These transfers normally take place at the end of the contract with the Contractor Group, which is why these assets are not recorded in the Consolidated Financial Statements. When this transfer takes place, the assets are initially measured at fair value, recorded under Property plant and equipment and amortised prospectively in accordance with the remaining useful life.
(h) Intangible assets
Intangible assets acquired separately are measured at initial acquisition cost. The cost of intangible assets acquired in a business combination is their fair value at the date of acquisition. Following initial recognition, intangible assets with definite useful lives are carried at cost less any accumulated amortisation (calculated on a straight-line basis over their useful life) and accumulated impairment losses, if any. Intangible assets with indefinite useful life (e.g. Goodwill) are not amortised, instead these are tested for impairment on an annual basis, at the reporting date.
Intangible assets with finite useful life are amortised over their economic life and assessed for impairment whenever there is a sign that the intangible asset may be impaired. The amortisation period and the amortisation method for an intangible asset with a finite useful life is reviewed, at least, at the end of each reporting period. Changes in the expected useful life or consumption pattern of future economic benefits embodied in the asset are considered to modify the amortisation period or method, as appropriate, and are treated as changes in accounting estimates. The amortisation expense on intangible assets with finite useful life is recognised in the Income Statement under the caption Amortisations.
Gains or losses arising from the derecognition of an intangible asset are measured as the difference between the recoverable value and the carrying amount of the asset and are recognised in the Income Statement when the asset is derecognised.
(i) Impairment of assets i) Non-financial assets (excluding goodwill)
The Group assesses at each reporting date whether there is a sign that an asset (or cash-generating units) may be impaired. When there is any impairment indicator or if it is the Group’s policy to perform an annual impairment test, the Group estimates the recoverable amount of the cash-generating unit or of the asset. The recoverable amount of a cash-generating unit or of an asset is the higher of the fair value less costs to sell and value in use. The recoverable amount is determined for an individual asset, unless the asset does not generate cash inflows that are largely independent of other assets or groups of assets, in which case the asset is tested as part of a larger cash-generating unit where it belongs. When the carrying amount of an asset or cash-generating unit exceeds its recoverable amount, the asset or the cash-generating unit is considered impaired and is written down to its recoverable amount. For the oil and gas upstream assets, the Board has assessed its cash-generating units as being an individual well or block, which is the lowest level for which cash flows are largely independent of other assets. The calculation of fair value less costs to sell may be based: i) on the sales price contractually agreed in a transaction between non-related parties less costs to sell it; ii) the market price if the asset is traded on an active market; or (iii) the fair value calculated as an estimate of the future cash flows that any market player would expect to obtain from the asset. In accordance with the methodology in iii), cash flows and discount rates are consider after-taxes.
In calculating the value in use, the methodology of the discounted cash flows is used, and includes the following elements:
• an estimate of the future cash flows that the entity expects to obtain with the asset; • the expectations of variations and timing of the expected future cash flows; • the use of a post-tax discount rate associated to the weighted average cost of capital; and • other factors that should be considered in this analysis, such as the lack of liquidity that the market participants might
reflect in the future cash flows that the entity expects to obtain from the asset.

SOCIEDADE NACIONAL DE COMBUSTÍVEIS DE ANGOLA E.P.
18
The value in use does not reflect future cash flows associated with the restructuring and improvement or enhancing of operating performance of the asset. Instead, for the calculation of fair value less costs to sell, the discounted cash flows model includes the cash flows associated with the costs with restructuring and improvement when it corresponds to a market expectation. The Group bases its impairment calculation on detailed budgets and forecasts, which are prepared separately for each cash-generating unit to which the individual assets are allocated. These budgets and forecasts generally cover the period of six years. For longer periods, a long-term growth rate is calculated and applied to project future cash flow after the fifth year. Impairment losses on continuing operations, including impairment of inventories, are recognised in the Income Statement in those expense categories consistent with the function/nature of the impaired asset. For assets/ cash-generating units, excluding goodwill, an assessment is made at each reporting date to determine whether there is an indication that previously recognised impairment losses may no longer exist or may have decreased. If such indication exists, the Group estimates the asset’s or cash-generating units’ recoverable amount. A previously recognised impairment loss is reversed only if there has been a change in the assumptions used to determine the asset’s/ cash-generating units’ recoverable amount since the last impairment loss recognised. The reversal is limited up to the limit where the carrying amount of the asset/ cash-generating units does not exceed either its recoverable amount, or the carrying amount that would have been determined, net of depreciation/amortisation, had no impairment loss been recognised for the asset/ cash-generating units in prior years. Such reversal is recognised in the Income Statement.
When an impairment loss or its reversal is recognised, the amortisation of the related assets is recalculated prospectively in accordance with the recoverable amount adjusted by the impairment loss recognised. ii) Goodwill
Goodwill is tested for impairment on an annual basis at each reporting date or whenever circumstances indicate that the carrying amount may be impaired.
Impairment is determined for Goodwill by assessing the recoverable amount of each cash-generating unit (or group of cash-generating units) to which the Goodwill relates. When the recoverable amount of the cash-generating unit is less than its carrying amount, an impairment loss is recognised. Impairment losses relating to goodwill cannot be reversed in future periods.
iii) Financial investments and investments in Real Estate
The Group has financial investments and investments in real estate (recorded in other financial assets) measured at cost less impairment losses and financial investments in other financial assets measured at fair value through profit and loss. For financial investments and investments in real estate measured at cost, impairment is determined based on rules calculation methodologies similar to the ones used for non-financial assets.
For financial investments and other financial assets measured at fair value through profit and loss the calculation is based on the quotation reported by independent experts. For listed assets, market information is used.
Financial instruments A financial instrument is any contract that gives rise to a financial asset of one entity and a financial liability or equity instrument of another entity, and is recognised initially at the transaction cost, when the Group becomes part of the corresponding contractual arrangements.

SOCIEDADE NACIONAL DE COMBUSTÍVEIS DE ANGOLA E.P.
19
(j) Financial assets
The Group’s financial assets include accounts receivable (trade and others), other current and non-current assets, other non-current financial assets and cash and cash equivalents. The purchases and sales of financial assets that demand delivery of goods within a certain agreed timeframe are recognised on the date in which the Group commits to purchase or sell the good. Accounts receivable and other current and non-current assets
This is the most significant category for the Group. Accounts receivable, other current and non-current assets are non-derivative financial assets with fixed or determined payments that are not traded in an active market. After initial recognition, such financial assets are recorded at nominal value less any impairment loss, necessary to reflect their expected net realisable value. Losses are registered in the Income Statement when there is objective evidence that the total or part of the debt, according with the original conditions of the account receivables, will not be received. For the oil and gas activities, whenever the Group has performed “lifts” below or above its rights calculated in accordance with the production sharing agreements (PSA), it is considered that there is Underlifting or Overlifting, respectively, and the amounts are measured at its sale price, unit production costs and registered as an account receivable or payable, against profit and loss. Other non-current financial assets Financial investments in Real Estate The Group has several real estate properties classified as financial investments in real estate. These investments in real estate are initially recorded at acquisition or construction cost, including non-deductible taxes (e.g. SISA), installation and assembly costs, other directly attributable costs to bring the asset in the location and condition necessary to operate as intended, the estimated costs of dismantling, removing or restoring items (where applicable) and related borrowing costs of qualifying assets, net of impairment losses to ensure that the asset does not exceed its realisable value. Investment funds The Group owns participation units in investment funds. These financial investments held by Sonangol are measured at cost, which includes its purchase price, the charges related with the acquisition, such as brokerage commissions, fees and expenses and bank charges. Subsequently, these financial investments are measured at fair value, calculated based on the final report of the fund managers, against financial results. Bank Deposits The Group recognises in bank deposits the balances held in Banks (fixed-term deposits or deposits repayable on demand) subject to a reduced risk of changes in value, monetary means in transit and cash surplus applications in financial products (e.g. Angolan Treasury bonds) which are registered in Trading securities. Under the contracts between Sonangol EP and the Contractor Groups for each block, Sonangol EP is the beneficiary party of the bank deposits with restricted mobilization (escrow accounts) and which are related with the wells´ shutdown, assets decommissioning and environment recovery after the exploration of the blocks by each Contractor Group. These deposits are measured at cost. As these cash and cash equivalents are restricted for exchange or use in the payment of liabilities up to 12 months, the escrow accounts are recorded as a non-current asset under Bank deposits.
(k) Financial liabilities The Group's financial liabilities include accounts payable (suppliers and other accounts payable) and medium and long-term loans. A financial instrument is classified as a financial liability when there is a contractual obligation for the issuer to settle capital and / or interest, through the delivery of money or another financial asset, regardless of its legal form.

SOCIEDADE NACIONAL DE COMBUSTÍVEIS DE ANGOLA E.P.
20
Accounts payable
The trade suppliers and other current liabilities balances are recorded at their nominal value.
The trade suppliers and other current liabilities balances are, usually, measured at historical cost.
The historical cost corresponds to the initial amount recorded (nominal amount) eventually adjusted to reflect (i) accrued interests related with loans that were not paid on settlement date and (ii) unrealised exchange differences determined by the application of the exchange rate at the reporting date to the balances in foreign currencies.
Whenever, in exceptional circumstances, the payable amount is below the historical amount, as in the event of a reduction or a debt forgiveness, the nominal amount is reduced, directly, for its realisable amount, and an extraordinary gain is recognised in the Income Statement. The Group derecognises a financial liability only when the obligation under the liability is discharged, cancelled or expires. Loans These captions includes loans obtained from credit institutions and other entities, measured at its nominal amount in its current and non-current portions. Interest expense is recognised as incurred. Borrowing costs related to the acquisition, construction or development of a qualifying asset, are capitalised as part of the cost of the related asset. The capitalisation of these costs begins after the preparation of the construction or development of the asset and ceases when the asset is ready for its intended use or when the related project is suspended. Any financial income generated by loans related to the specific investment are deducted to the amount of financial charges eligible to be capitalised.
(l) Inventories Inventories are recorded at the lower of cost and net realisable value. The acquisition or production cost is determined, in accordance with the nature of the inventories and of the business developed. The Group has recognised the following types of inventories in its consolidated accounts: a. Raw materials and subsidiary products
• Crude oil - The cost of crude oil includes the invoice price, transportation and insurance expenses, for which the
costing method is FIFO (first in first out), applied to a unique family which includes all types of crude oil. • Other raw materials (excluding general materials) – The acquisition cost includes the invoice price, transportation and
insurance expenses, for which the costing method is FIFO, applied to product families which are created taking into consideration the characteristics of the several raw materials.
• General materials - The acquisition cost includes the invoice price, transportation and insurance expenses, for which the average weighted cost method is used to determine the cost of sales.
b. Products and work in progress
The production cost includes materials, external supplies and services e general expenditures. c. Finished products and intermediate goods
• Crude oil – Relates to crude oil produced in the oil and gas activities and which is in stock as at 31 December each
year, in the share part of the total crude oil produced in each development area. • Oil by-products – Finished products and intermediates goods are measured at production cost, which includes the
consumables of raw materials and other products, direct labour costs and overheads. In case of products acquired from third parties, these are measured at acquisition cost which includes the invoice price, transportation and

SOCIEDADE NACIONAL DE COMBUSTÍVEIS DE ANGOLA E.P.
21
insurance expenses, using the FIFO applied to product families, which are created considering the characteristics of the materials, as the method used to determine the cost of sales.
• Other finished and intermediates products – The production cost includes raw materials, variable and fixed industrial costs using the weighted average cost the method to determine the cost of sales.
d. Goods
The acquisition cost includes the invoice price, transportation and insurance expenses, using the weighted average cost method for natural gas (LPG), oil by-products and other goods as the method used to determine the cost of sales.
As goods in transit are not available to be consumed or sold, these are segregated from the remaining inventories and are measured at the specific acquisition cost.
The net realisable value of inventories is based on the estimated sales price on the ordinary course of business, deducted from the estimated costs to finalise the product and the necessary sales costs.
Differences between the acquisition cost and the related net realisable value, if positive, are recorded as Non-operating results (see Note 33); any reversals are also recorded under Non-operating results.
The variation of products and work in progress at each reporting date, when compared with the position at the beginning of the period, is recognised as variation in finished products and work in progress.
The Group recognises as Cost of inventories sold and materials consumed, the outflows of inventories under sub-items Goods and raw materials, subsidiaries and consumable goods.
(m) Leases
The Group recognises a lease when it is part of a lease contract (until the end of the contract), which is always recognised as operating lease. The Group has, currently, leases as lessor and as lessee, which are recognised and measured as follows:
• Operating leases as a lessee: rents payable are recognised as cost in the consolidated income statement in the period to which they are contractually related, by its nominal amount;
• Operating leases as a lessor: rents received are recognised as profit in the Consolidated Income Statement in the period to which they contractually relate by its nominal amount. The leased assets are predominantly recognised as Other financial assets – investments in real estate.
(n) Provisions for other risks and charges
Provisions are recognised when there is (i) a legal or constructive obligation as a result of past events; (ii) it is probable that an outflow of resources will be required to settle the obligation, and (iii) a reliable estimate can be made of the amount of the obligation.
No provision is recognised for future operating losses. Provisions are reviewed at each balance sheet date and are adjusted to reflect the best estimate at that date.
If the time effect of money is material, provisions are discounted to present value using a discount rate (before tax) that reflects, where appropriate, the specific risks associated with the liability. When discounting is used, the increase in the provision due to the passage of time is recognised as financial expenses. With the exception for decommissioning provisions, the cost of any provision is disclosed in the Income Statement.
(i) Decommissioning provisions
The Group recognises a decommissioning provision when it has an obligation (legal or constructive) as a result of past events; and it is probable that an outflow of resources will be required to settle the obligation and a reliable estimate can be made of the amount of the obligation.

SOCIEDADE NACIONAL DE COMBUSTÍVEIS DE ANGOLA E.P.
22
The obligation usually occurs when the asset is installed or when the environment is modified. When the liability is initially recognised, the present value of the estimated decommissioning total cost is capitalised by increasing the net value of the underlying oil and gas assets.
Changes in time or cost of the estimated decommissioning are treated prospectively through an adjustment to the provision made as well as to the related asset.
Any decrease in the provision for decommissioning and therefore any decrease in the value of related assets may not exceed the net book value thereof. If there is any excess over the net book value this is adjusted directly in the Income Statement.
If a change in the assessment of the dismantling obligation leads to an increase in the provision for decommissioning and consequently in an increase of the net value of the related assets, the Group considers whether this is an impairment indicator of the asset as a whole, and if so, tests the asset for impairment. If, for mature fields, the revised estimate of the value for the oil and gas assets net of decommissioning liabilities exceeds the recoverable amount, the proportion of the increase is recognised in the Income Statement.
The discount rates used to calculate the present value of the estimated cash flows is a risk-free interest rate, considering the temporal horizon of the associate cash flows and these are reviewed at each reporting date.
The amount of decommissioning provision is increased at the reporting date, to reflect the time value of money, and the variation is recognised as a financial expense in the Income Statement.
When the decommissioning provision is adjusted to reflect changes in the discount rates, the effect of the change in the liability is broken-down between i) the time value of money for one year more that has passed, which is recognised in financial results and ii) the effect of the variation on the present value of the liability, which is recognised in the related asset for which the decommission provision was recognised.
Over time, the discounted liability is increased by the change in present value based on the discount rate that reflects current market assessments and specific liability risks.
The effect of the dollar appreciation (USD) against the Kwanza (AOA) of the decommissioning provisions is recorded against the respective fixed assets, and the new net book value of the asset is amortised prospectively based on the production units method.
The estimate of the decommissioning costs for the assets related with participating interests on the blocks that the Group operates as an investor (in its share in the participating interest) is not related with the Group acting as the National Concessionaire.
(ii) Abandonment fund (Concessionaire)
The amounts allocated to the abandonment fund (Concessionaire) are the responsibility of the field operators and are transferred to the custody of the Group, as National Concessionaire. The fund is intended to cover future costs related to the decommissioning of oil wells, removal of platforms and other facilities when reserves are exhausted, as disclosed in Note 18.1.

SOCIEDADE NACIONAL DE COMBUSTÍVEIS DE ANGOLA E.P.
23
(o) Taxes
Oil taxes
Sonangol Group companies, involved in crude oil and natural gas exploration and production, are subject to Income Tax on oil activities disclosed in Note 19.3, and are exempt from other income taxes due by other companies in Angola. This oil taxation is defined and regulated by Law 13/04 – Law of Taxation of Petroleum Activities.
According to this Law, the taxable income of each block is based on the monthly estimated production, communicated to the competent tax authorities through provisional tax declarations and paid within the time limits established by law.
The provisional tax returns are replaced at the end of the period by final tax returns, corrected by "tax reference prices", by the final costs incurred in petroleum operations and by operating costs incurred by the companies.
Taxes, duties and fees above include:
• Tax on oil production - applied on the quantities of crude oil and natural gas produced in the year, valued at tax reference prices;
• Transaction Fee of oil – applied to the annual profit of Concession Contracts at a 70% rate and deductible for the purpose of determining the taxable amount of income tax on oil;
• Income tax on oil – applied to annual profits (net of oil production tax and oil transaction fee) applied to Concession Contracts and Production Sharing contracts. The tax payable is calculated in accordance with the tax regime regulated in Law 13/04, complemented by the Concession Decree. The percentage referring to cost recovery, also referred to as Cost Recovery Crude Oil, is deducted from the total of the charges, resulting in the "Profit Oil “ on which a rate of 30% is applied in accordance with Law No. 3/12 - Tax Incentives Law for National Companies in the Oil Sector (“Lei dos Incentivos Fiscais às Empresas Nacionais do Sector petrolífero”).
The annual tax amount determined is subject to adjustments resulting from the annual examination of the tax returns submitted by the company. This process is triggered by the Ministry of Finance in its function of regulatory and oversight body for this area.
Group companies not affiliated to the petroleum sector are subject to taxation under Industrial Tax - Group A. The income tax is calculated on the basis of taxable profit (accounting result adjusted for tax purposes) using a nominal rate of 30%, in accordance with the tax rules in force at the balance sheet date. The delivery of tax is made through reverse-charge upon delivery of a return that is subject to review and correction by the tax authorities for a period of five years.
The Group is also subject to Urban Property Tax ("IPU"), which is levied on the taxable value of urban buildings or their income when they are leased, at a rate of 15% on the total lease value. The payment of this tax is made by the customer (withholding tax) upon completion of the DLI (Tax Settlement Document). Deferred taxes
The calculated tax refers exclusively to current income tax. The Group does not recognise any other deferred tax, asset or liability, resulting from temporary differences between the accounting and tax basis.
(p) Deliveries to the State of the Concessionaire sales
In accordance with the applicable law, Sonangol E.P. shall deliver to the State the amount of revenue equivalent to the sales made as National Concessionaire, at least 95% of this revenue valued at the fiscal reference price of the State Budget.
This amount is considered a tax charge and, as such, is included in the costs of the year. Law no. 3 / 18 of 1 March defined the fiscal reference price of the General State Budget for the fiscal year under analysis at USD 50 / Barrel.

SOCIEDADE NACIONAL DE COMBUSTÍVEIS DE ANGOLA E.P.
24
(q) Sales, services rendered and other operating income
Revenue is recognised to the extent that it is probable that economic benefits will flow to the Group and the revenue can be reliably measured. Revenue is measured at the fair value of the consideration received or receivable, net of discounts, taxes and other obligations relating to their realisation.
The main Group revenue categories are as follows:
a) Sales of crude oil – participant in the Contractor Groups; b) Sales of crude oil – concessionaire; c) Sales of refined products; d) Deliveries to Refinaria de Luanda; e) State grants (subventions); f) Services rendered – leases; g) Services rendered – shipping; h) Services rendered – logistics.
Sales of crude oil – participant in the Contractor Groups
Revenue from the sale of crude oil and natural gas and oil by-products is recognised when the significant risks and rewards of ownership have been transferred, which is considered to occur when the asset is transferred to the customer. This usually occurs when the product is physically transferred to the ship or other delivery mechanism.
Revenue from oil and gas production where the Group has participating interests with other producers is recognised based on the Group’s share in accordance with the production sharing contracts (PSC).
When the forward contracts (to buy or sell) on oil and natural gas are signed, the sales and purchases are disclosed by the net amount. Sales of crude oil - Concessionaire
As the National Concessionaire (“NC”), Sonangol EP holds the mining rights attributed by the Angolan State (Law 10-04 article 4). The NC may associate with other entities to execute the oil and gas operations or request the Government to directly attribute the concession, subject to approval of the Ministry and to a public tender.
NC decides who its associates are as well as the content of the contract to execute the oil and gas operations (e.g. production sharing contracts), subject to approval of the Ministry in what relates to the association as well as to the contents of the contract.
The premium for the contract signing which is paid by the associates to the NC reverts fully to the State and are not considered as part of the revenue.
Receivables from NC correspond mainly to the share of Petroleum- Profit as established in each contract, which is the crude oil produced and collected and not used in the oil and gas operations, deducted from the crude oil for cost recovery.
The crude oil share usually results from the application of a formula defined in each production sharing agreement (PSA) in accordance with the profitability of the Contractor Group in the development area and with the depth of groundwater where it was obtained. On the other hand, also in accordance in the law in force, Sonangol has to deliver to the State the amount corresponding to the sales performed as National Concessionaire deducted from its margin (in 2018, 5%), determined over the sales measured at the reference price of the State Budget. Law No. 03/18 of 1 March has set the fiscal reference price of the State Budget in 50 USD/Barrel for 2018. The retained margin should cover the expenses related with the supervision and control of its associates and of the oil and gas operations. This amount is recognised as an expense under the caption Concessionaire cost (sales on behalf of the State).
SOCIEDADE NACIONAL DE COMBUSTÍVEIS DE ANGOLA E.P.
25
Sales of refined products Sales of refined products relate to sales of gasoline and diesel, among others, and the revenue is recognised when the sale occurs in accordance with the price list in force. Deliveries to Refinaria de Luanda The sales of crude oil to Refinaria de Luanda correspond to grants (subventions) for the production of refined products by the State. According to Executive Decree 706/15 of 30 December, which defines that supplies of crude oil to Refinaria de Luanda should be assured through a part of the state's oil profit in the oil concessions, according to the production-sharing agreements. According to the same decree, the sale price and the exchange rate are set at USD 39.98 per barrel and AOA 155,612 per USD, respectively. In cases of insufficiency of the types of crude oil of the State necessary for the operation of the Refinery, it is established the possibility to use the State partners in the Oil Concessions, in which case Refinaria de Luanda pays the price and exchange rate defined in the Decree. However, in this transaction there are two types of differentials: (i) price differentials (between the price of the Decree and the reference price) and (ii) exchange rate differentials (between the exchange rate of the Decree and the exchange rate of the date of the supply). These differentials are attributable to the State. These differentials from the sales to the Refinery of Luanda are accounted for as sales of crude oil as disclosed in note 22. Sales and the price and exchange differentials charged to the State are recognised as an amount receivable as disclosed in Note 9.5.1 Revenue from the Concessionaire.
State grants (subventions) In accordance with the Executive Decree No. 17/95 updated by Executive Decree No. 127/04 and complemented by Executive Decree No. 27/05, by Order No. º77/10 and by Presidential Decree No. 1/12, the Group recognises on the basis of the defined structure of charges, margins and selling prices to the public, a subvention at prices resulting from the quantities of products sold in the period. During the period in which revenue from the sale of products is recognised in accordance with the table enclosed to Executive Decree No. 97/12 of 26 March, the corresponding subvention is also recognised. Executive Decree No. 706/15 of 30 December 2015 has defined that with the exception of the kerosene and butane gas, all other refined products would pass to the free price regime, ceasing the State obligation to compensate with any subventions, and Sonangol Group would define the new price.
Services rendered – leases
Revenue from leases relates mainly to leased aircrafts and real estate, including variable and fixed rent components, in accordance with the contracts. Rents are recognised in profit and loss in the related period.
Services rendered – shipping Revenue from shipping is recognised in the moment of arrival at the port of destination, when all performance obligations are fulfilled.
(r) Fair value measurement
The Group measures at each reporting period the investments in listed companies and investments in investment funds at fair value.
Fair value is the price that would be received to sell an asset or pay to settle a liability in an ordinary transaction between independent market participants. The fair value measurement is based on the assumption that the transaction to sell an asset or to settle a liability takes place:
• In the active market of the asset or liability; or • In the absence of an active market/asset, in the most advantageous market for the asset or liability.

SOCIEDADE NACIONAL DE COMBUSTÍVEIS DE ANGOLA E.P.
26
The fair value of an asset or liability is measured based on the assumption that market participants will consider the price of the asset or liability, assuming that these act, based on of their best economical interest.
The measurement at fair value of a financial asset considers the ability of the market participant to generate economic benefits for the use of the asset in its best consideration, or for its sale to other market participant.
When necessary, the Group uses appropriate valuation techniques for which has enough available information to measure fair value, maximizing the use of relevant observable inputs and minimizing the use of non-observable inputs.
The Group uses listed prices to value investments in listed companies and reports from the entities responsible for the management of investment funds to measure the participations in high risk capital investments.
(s) Balances and Transactions in currencies other than functional currencies Favourable and unfavourable exchange differences arising from the differences between the exchange rates in force at the date of the transactions and those in effect at the date of collection, payments or at the balance sheet date are recorded as income and / or expenses in the Income Statement for the period under the caption of exchange gains / losses.
(t) Current and non-current classification The Group has assets and liabilities in its financial position based on the current / non-current classification. An asset is current when:
• Expected realisation or intention to be sold or consumed in the normal operating cycle; • Held for the main purpose of sale; • Forecasted realisation in 12 months after the balance sheet date; • Cash and cash equivalents that are not restricted to be exchanged or used for the payment of a liability until 12
months after the balance sheet date.
All other assets are classified as non-current.
A liability is current when:
• it is expected that the liability will be settled in 12 months after the balance sheet date; • is held mainly for trading; • It is due in a 12-month period after the balance sheet date:
a. As defined in a contract; or b. According to a formal request for payment from the creditor, after verifying contract default.
(u) Employee benefits plans i) Short-term benefits Short-term benefits correspond to the expenses incurred with remunerations, fixed or variable, other expenses directly related with employees, and other liabilities recognised in the period associated with services rendered by employees, which will be paid in the future, excluding termination benefits and post-retirement benefits. These are usually recognised under Staff costs caption when incurred.
In accordance with legislation in force, the Group’s employees are entitled annually to one month’s holiday and one month’s allowance, and this right is obtained in the year prior to the payment. Therefore, this liability is recognised in the period when the employee earns this right, regardless of the related payment.

SOCIEDADE NACIONAL DE COMBUSTÍVEIS DE ANGOLA E.P.
27
ii) Termination benefits Termination benefits are recognised when the Group ceases employment before the retirement date, or when the employee accepts the contract termination in exchange for these benefits. Sonangol group recognises the responsibility with termination benefits at the earliest of the following dates: on the date when the Group is no longer able to withdraw the benefits offer or when the Group recognises the restructuring costs under the scope of a provision. Benefits due with a maturity of more than 12 months, after the reporting period, are discounted to its present value. iii) Post-employment benefits Until the end of 2011, the Group personnel was covered by a “Defined Benefit Plan” of Sonangol that was closed to new admissions with effect from 1 January 2012, and the active participants were transferred into a new “Defined Contribution Plan” to be financed by the employees as from this date. The new plan covers all future Sonangol employees. The defined benefit plan remains in place to service the pension obligations of retirees and pensioners, and the curtailment made will correspond to the amount that the subsidiaries included in the new plan will have to finance to the new management entity when of the constitution and operationalization of this entity. Nevertheless, employees who retired or ceased their relationship with the Group until 13 October 2017, date of legal implementation and approval of the new plan by the relevant authorities (Order No. 685/17 of the Ministry of Finance), were covered by the defined benefit plan. In 2014, the responsibility for the management of the fund constituted for Sonangol Pension Plan was transferred to Sonangol Vida. Sonangol Vida is responsible for the responsibilities associated with the Sonangol Pension Plan and, after the incorporation of the fund, will be responsible for its management. Pension Plan Benefits are normally determined by a combination of one or more factors, such as age, years of service and base salary (pension). The Group’s pension liability is calculated annually by independent experts, for each plan, at each reporting date, using the Projected Unit Credit Method. The discount rate used in the calculation is determined based on market rates of high quality corporate bonds and that have similar maturity to the related pension liability. The liabilities are covered by provisions recorded in the balance sheet of the Sonangol Group companies. Actuarial gains and losses resulting from: (i) differences between financial and actuarial assumptions used and actual amounts; and (ii) changes in the actuarial assumptions are recognised against equity. The Group recognises as operating income and expense, in the income statement, current and past service costs and net interest on the liability (asset). Health care plan The companies of the Sonangol Group grant benefits in Angola under which employees and immediate eligible family members have favourable conditions in medical assistance and health care services, through the provision of medical care provided through infrastructures owned and managed internally in Clínica Girassol. The medical benefits plans are classified as defined benefit plans. The liabilities are covered by provisions recorded in the balance sheet of the Sonangol Group companies. Measurement and recognition of the medical benefits liabilities are similar to the defined benefit pension liabilities, explained above.

SOCIEDADE NACIONAL DE COMBUSTÍVEIS DE ANGOLA E.P.
28
(v) Accrual basis
Gains and losses are recorded on an accrual basis, therefore these are recognised when they occur, regardless or when paid or received. Differences between amounts paid or received and the related costs and revenues are recognised in Other current assets and Other current liabilities, respectively, as the differences correspond to a right or a liability for the Group. Consequently, the captions Deferred expenses and Deferred income include expenses and income that have already been incurred but which relate to future periods and that will be recognised in profit and loss of the related periods by the correspondent amount. Accrued income and Accrued expenses relate to income and expenses already incurred and that will be invoiced in the future.
(w) Under/Overlifting As a member of the Contractors Group
It is industry practice to make Underliftings or Overliftings of its share of crude oil produced, which is expected to optimise transportation costs between partners.
Underlifting is in fact, under a substance over form principle, a sale made by the stock partner that rightfully belongs to Sonangol. Thus, in case of Underlifting, the partner made a sale on behalf of Sonangol, which is why Sonangol has an account receivable against sales. If the market price of crude oil at the end of each reporting period is lower than the price considered in the valuation of the receivable, an impairment loss is recorded in the income statement against accounts receivable.
Overlifting is a stock sale made by Sonangol which rightfully belongs to the partner. Thus, in case of Overlifting, the Group records an expense under mining activity related costs against Accounts Payable.
Receipts and payments of Underlifting and Overlifting balances are later offset through barrels of crude oil as established in the sharing agreement (physical settlement). The Group considers that the substance over PSA form is not subject to price risk, since the operation is for own use of the petroleum contracting groups and the settlement of Under and Overlifting balances is made through physical product (Barrels of Crude Oil) . Therefore, accounts receivable and payable are not valued at fair value (own use exemption). As National Concessionaire
In its role of National Concessionaire, Sonangol may also be in an Underlift or Overlift position towards its share of oil profit, which is recorded as an account receivable or payable against Concessionaire cost (sales on behalf of the State, respectively).
(x) Results policy
i) Extraordinary and non-operating results
Extraordinary income includes extraordinary costs and revenues from activities that are distinguishable from the operating activities and are, therefore, not expected to occur regularly and frequently.
Non-operating results is intended to record facts or events of a non-recurring or non-recurring nature.
ii) Financial results
Financial results include interests paid on loans, default interests, interests received from applications, gains and losses from exchange rate differences, realised or unrealised, and fair value variations related with financial instruments. Interests are recognised on an accrual basis.
iii) Income from subsidiaries and associates
Income from subsidiaries and associates include only dividends received from companies that the Group owns as financial investment. Dividends are recognised when the right to its receivable is established.

SOCIEDADE NACIONAL DE COMBUSTÍVEIS DE ANGOLA E.P.
29
(y) Mining activity related costs This caption includes the share of the Sonangol Group on the costs related with joint operations that are charged by the contract operators and its share on the costs incurred as a block operator.
(z) Related parties The entities included in the consolidation perimeter are considered as related parties by the Sonangol Group.
(aa) Subsequent events
Events occurring after the balance sheet date that provide additional information about conditions that existed at the reporting date are recognised in the Group’s Financial Statements. Events occurring after the balance sheet date that provide information on conditions that occur after the reporting date are disclosed in the notes to the consolidated financial statements, if considered material.
(bb) Segment reporting The Group presents operating segments based on Management information according to activities carried out by the various companies included in the consolidation perimeter. An operating segment is deemed a Group component:
i) that develops business activities from which is possible to obtain revenue and incur in expenses; ii) whose operating results are regularly reviewed by the person responsible for the Group’s operating decision-
making on the allocation of resources to the segment and evaluation of its performance; iii) for which different financial information is available.
The amounts reported for each operating segment result from the aggregation of subsidiaries and business units defined in the perimeter of each segment. The write-offs of intra-segment transactions are made in the segment itself and inter-segments are carried out under Consolidation adjustments.
(cc) Accounting policies, accounting estimates and errors Accounting estimates Estimation involves a high degree of judgement based on the latest available, reliable information. An accounting estimate may need revision if changes occur in the circumstances on which the estimate was based or as a result of new information or more experience. The effect of a change in an accounting estimate, shall be recognised in profit and loss of the current period in the same caption used to register the accounting estimate. Given the accounting principles of consistency and comparability of balances, changes in accounting policies should only be made in the following scenarios:
• If required by accounting provisions issued by an appropriate Authority for this purpose; • If the change results in a more appropriate presentation of events or transactions in the entity's financial
statements.
Errors The correction of errors, when preparing the financial statement, from one or more prior periods discovered in the current period, is corrected in profit and loss of the current period, except if it fulfils the characteristics of a fundamental error, in which situation shall be recognised in retained earnings. Fundamental errors are those errors that have such a significant impact on the financial statements of one or more prior periods that those financial statements cannot be considered to have been reliable at the date of issue.
SOCIEDADE NACIONAL DE COMBUSTÍVEIS DE ANGOLA E.P.
30
Changes in Accounting policies A change in an accounting policy is generally applied retrospectively, i.e., the new accounting policy is applied to the events and transactions as if the new accounting policy had always been applied, being its impact on opening balances recognised in Retained earnings.
2.4 CHANGES IN ACCOUNTING POLICIES With the exception of the following, there were no changes in the accounting policies when compared to the prior year.
In 2018, the Group changed the accounting policy regarding the recognition of unrealised exchange rate differences generated after the exchange rate adjustment of the provision for abandonment of the mining activity presented in Note 18.4 Decommissioning provision – Sonangol Investor. The method applied in 2018 foresees that the unrealised exchange rate differences from the provision for abandonment measured in USD should be capitalised and incorporated in the value of the recognised asset (see note 4.A Oil and Gas upstream assets). Additionally, the asset’s adjusted depreciable amount is depreciated during its remaining useful life. Up to the year of 2017, and as established by the IAS 21 and the PGC, these exchange differences were recognised as exchange gains and losses in the Income Statement (see Note 31. Financial Results).
However, in 2018 the Board of Directors reassessed the accounting policy adopted and concluded that the treatment under IFRIC 1 "Changes in Decommissioning, Restoration and Similar Existing Liabilities" that determines that changes in the measurement of a provision for abandonment resulting from changes in the timing or estimated amount of the outflow of resources that incorporate the economic benefits required to settle the obligation, or a change in the discount rate, should be recorded against the cost of the respective asset, which more appropriately reflects the substance of this transaction instead of the general rule of IAS 21 which determines that the exchange differences associated with provisions should be recorded in the Income Statement for the year. This policy was applied retrospectively and the impacts of prior years were recorded in retained earnings and are disclosed in Note 13 Reserves and Retained Earnings. "
3. OPERATING SEGMENTS
For management purposes, the Group is organised into business units based on products and services provided, subdivided in five reportable segments:
• Corporate & Financing, which includes core financial investments and loans obtain and made by the Group;
• Upstream, representing research and crude oil and natural gas production;
• Midstream, which includes refining and transport of products based on crude oil and natural gas;
• Downstream, this segment includes storage, supply and distribution of the products based on crude oil and natural gas to the final customer;
• Non-Core Activities such as aviation services, healthcare services, training activities, real estate investments, telecommunications and other non-core financial investments.
Management monitors the operating results of its business separately, with the purpose of making decisions about resources allocation and performance evaluation. The performance of a segment is evaluated based on their operating income and expenses which are valued consistently with the consolidated operating income and expenses.
The Group financing and the financial results of Sonangol E.P. and Sonangol Finance are managed from a consolidated perspective and are not allocated to segments, being included in the Corporate & Financing segment. Additionally, the income and expenses of Sonangol E.P. and Sonagás – Sonangol Gás Natural, S.A. were allocated across the segments of Corporate & Financing or Upstream and Upstream or Downstream, respectively, based on the nature of the underlying assets and liabilities. It should be noted that for Sonangol E.P., costs with personnel and other operational costs and losses were fully allocated to the Corporate & Financing Segment.
The table below shows, as mentioned above, the entities included in the consolidation perimeter as defined by the Board of Directors of Sonangol EP and their respective operating segments:

SOCIEDADE NACIONAL DE COMBUSTÍVEIS DE ANGOLA E.P.
31
Company Segments Sonangol E.P Corporate & Financing Sonangol Finance Limited Corporate & Financing Sonangol E.P Upstream Sonangol Pesquisa e Produção, S.A. Upstream Sonangol Hidrocarbonetos Internacional, S.A. Upstream Sonagás - Sonangol Gás Natural, S.A. Upstream Sonaref, S.A. Sonangol – Refinaria de Luanda, S.A. Refinaria do Lobito, S.A. Sonaref Investimentos e Participações, S.A.
Midstream Midstream Midstream Midstream
Sonangol Shipping Holding, Limited Midstream Sonangol Shipping Angola, Limited Midstream Sonangol Shipping Services, Limited Midstream Sonangol Chartering Services limited Midstream Sonangol LNG Shipping Service Limited Midstream Sonangol Marine Transportation limited Midstream Sonangol Marine Services Inc Midstream Sonangol Shipping Angola (Luanda) Limitada Midstream Stena Sonangol Suezmax Pool Midstream Sonangol Shipping Girassol Limited Midstream Sonangol Huila Limited Midstream Sonangol Shipping Kassanje Limited Midstream Sonangol Kalandula Limited Midstream Sonangol Shipping Kizomba Limited Midstream Sonangol Shipping Luanda Limited Midstream Sonangol Rangel Limited Midstream Sonangol Porto Amboim Limited Midstream Sonangol Shipping Namibe Limited Midstream Sonangol Cabinda Limited Midstream Sonangol Etosha Limited Midstream Sonangol Benguela Limited Midstream Sonangol Sambizanga Limited Midstream Ngol Bengo Limited Midstream Ngol Chiloango Limited Midstream Ngol Zaire Limited Midstream Ngol Cunene (Clyde) Limited Midstream Sonangol Shipping Ngol Luena Limited Midstream Sonangol Shipping Ngol Cassai Limited Midstream Ngol Dande Limited Midstream Ngol Kwanza Limited Midstream Cumberland Limited (Ngol Cubango) Midstream Sonangol Maiombe Limited Midstream Sonangol Cazenga Limited Midstream Sonangol Comercialização Internacional, Lda. Midstream Sonangol Asia Midstream Sonangol Limited Midstream Sonangol Hong Kong Limited Midstream Sonangol USA Midstream Sonagás - Sonangol Gás Natural, S.A. Downstream Sonangol Distribuidora, S.A. Downstream Sonangol Logística, Lda. Downstream

SOCIEDADE NACIONAL DE COMBUSTÍVEIS DE ANGOLA E.P.
32
Sonangol Holdings, Lda. Non-core activities SIIND – Sonangol Investimentos Industriais, S.A. Non-core activities SONIP - Sonangol Imobiliária e Propriedades, Lda. Non-core activities Sonair - Serviços Aéreos, S.A. Non-core activities Clínica Girassol, Sarl. Non-core activities MS TELCOM – Mercury Serviço de Telecomunicações, S.A. Non-core activities Instituto Superior Politécnico de Tecnologias e Ciências (ISPTEC) Non-core activities CFMA - Centro de Formação Marítima de Angola Lda Non-core activities Academia Sonangol S.A. Non-core activities Sonangol Vida Non-core activities Pessoas Desenvolvimento e Associações – PDA Non-core activities Solo Properties Non-core activities

SOCIEDADE NACIONAL DE COMBUSTÍVEIS DE ANGOLA E.P.
33
Segment reporting Consolidated Income Statement by Segment for the year ended 31
December 2018
CORPORATE &
FINANCING UPSTREAM MIDSTREAM DOWNSTREAM NON CORE Consolidation
Adjustments Total
AKZ AKZ AKZ AKZ AKZ AKZ AKZ
Sales
- 3,789,282,854,260 166,575,800,259 1,001,933,013,894 3,255,783,845 (163,254,012,952) 4,797,793,439,306
Services rendered
- -
51,017,443,392
50,640,864
53,102,022,515 (28,476,287,519) 75,693,819,252
Other operating income 27,339,909 86,171,494
7,251,127,672
2,960,481,323 27,299,689,756
(11,040,555,290) 26,584,254,864
27,339,909 3,789,369,025,754 224,844,371,323 1,004,944,136,081 83,657,496,116 (202,770,855,761) 4,900,071,513,422
Variation in finished products and work in progress
- (24,849,320,629) (2,707,858,539) 415,042,171 -
- (27,142,136,997)
Concessionaire costs (sales on behalf of the State)
- (2,213,143,931,123) -
- -
- (2,213,143,931,123) Costs of goods sold and raw materials consumed
- (9,861,564,416) (87,245,393,162) (835,235,032,771) (5,736,167,691) 172,080,749,681 (765,997,408,359)
Oil and Gas exploration and operating costs
- (414,186,294,468) -
- - 8,628,244,828 (405,558,049,640)
Personnel Costs (66,362,504,698) (12,515,936,045) (22,824,748,270) (67,110,383,973) (60,720,565,878) 8,598,703,549 (220,935,435,315)
Depreciation and amortisation (2,800,754,539) (667,104,844,534) (16,851,503,145) (20,186,404,792) (21,466,692,277)
- (728,410,199,287)
Other operating expenses (32,889,600,982) (3,972,426,146) (44,615,545,688) (55,990,535,313) (43,239,406,306) 13,890,713,204 (166,816,801,231)
(102,052,860,219) (3,345,634,317,361) (174,245,048,804) (978,107,314,678) (131,162,832,152) 203,198,411,262 (4,528,003,961,952)
Operating income: (102,025,520,310) 443,734,708,393 50,599,322,519 26,836,821,403 (47,505,336,036) 427,555,501 372,067,551,470
Financial results (38,761,740,575) (97,625,804,150) (11,462,817,958) (259,668,813,913) 6,288,053,347 (597,556,722) (401,828,679,971)
Results from investments in other companies
-
- -
- 34,422,374,437
- 34,422,374,437
Non-operating results (10,541,015,703) 370,061,014,643 5,475,489,227 (35,244,911,925) (35,148,925,982) -
294,601,650,260
(49,302,756,278) 272,435,210,493 (5,987,328,731) (294,913,725,838) 5,561,501,802 (597,556,722) (72,804,655,274)
Profit before taxes: (151,328,276,588) 716,169,918,886 44,611,993,788 (268,076,904,435) (41,943,834,234) (170,001,221) 299,262,896,196
Income tax
- (178,433,581,476) (21,934,486,918) (15,914,270,485) (13,442,124,021) - (229,724,462,900)
Net profit from current activities: (151,328,276,588) 537,736,337,410 22,677,506,870 (283,991,174,920) (55,385,958,255) (170,001,221) 69,538,433,296
Extraordinary results
- 10,282,057,738 - 1,008,490
155,261,836
- 10,438,328,064
Net profit (151,328,276,588) 548,018,395,148 22,677,506,870 (283,990,166,430) (55,230,696,419) (170,001,221) 79,976,761,360
The above segment reporting presents the aggregated values of the companies comprising the respective operating segments net of Intra-group elimination adjustments within each segment in order to best reflect the economic substance of each Sonangol Group operating segment. The consolidation adjustments column reflects Intra-group elimination adjustments between companies within different operating segments. The translation to USD follows the exchange rate policy described in Note 2.1.2.

SOCIEDADE NACIONAL DE COMBUSTÍVEIS DE ANGOLA E.P.
34
4. Tangible fixed assets
4.1 Tangible fixed assets
4.1.1 Detail by nature
As at 31 December 2018, tangible fixed assets are detailed as follows:
Items 2018 Gross Amount
2018 Accumulated Depreciation 2018 Net Amount 2017 Net Amount
Land and natural resources 10,059,783,927 - 10,059,783,927 7,732,931,617 Buildings and other construction 602,994,622,295 (202,551,555,235) 400,443,067,060 319,205,129,033 Basic equipment 721,298,774,022 (364,581,679,251) 356,717,094,771 257,279,104,688 Transport equipment 30,535,067,314 (26,016,447,301) 4,518,620,013 3,263,952,035 IT equipment 52,133,803,297 (50,773,214,705) 1,360,588,592 1,664,313,007 Administrative equipment 55,046,559,829 (47,727,940,681) 7,318,619,148 7,358,167,363 Other tangible fixed assets 6,935,929,548 (5,970,366,664) 965,562,884 607,545,258 Assets under construction 646,368,389,419 - 646,368,389,419 236,754,443,421 Advance payments for tangible fixed assets 39,409,705 - 39,409,705 1,503,430
2,125,412,339,356 (697,621,203,837) 1,427,791,135,519 833,867,089,852
During 2018, the main Group’s assets under construction were related with:
• Construction of Refinaria do Lobito within the midstream segment; • Construction of 2 drill ships within the upstream segment; • Construction of logistics facilities at Barra do Dande within the downstream segment.
Refinaria do Lobito
In 2016 and considering the macroeconomic context, Sonangol's Board of Directors decided to suspend the construction works of Refinaria do Lobito.
In the meantime, in 2017, the Angolan State reaffirmed its commitment to carry out the construction of Refinaria do Lobito, as it is a national strategic project focused on self-sufficiency in the production of refined products and reduction of imports.
By the end of 2017, Sonangol launched an international public tender for investors interested in obtaining an interest in Refinaria do Lobito. 64 Proposals were received, of which 7 were selected, at an initial stage, among which and based on the selection criteria, will be selected the company(ies) that will be part of the joint venture to implement the project. By the end of 2018, the proposal with the companies selected to form the joint venture for the construction of Refinaria do Lobito was sent to the Angolan President, being the project in the approval phase for the construction of the mentioned refinery, which is expected to be concluded by 2022. At the date of approval of the financial statements, the selection process was in the final stage of negotiations between Sonangol and the finalist entities and should culminate with the creation of the Contractor Group, which will form the joint venture, and is expected to occur throughout 2019. Sonangol’s Board of Directors believes that this new strategic outlook shall incorporate the investments already made and its profitability with the exploration of the future refinery and with the creation of industrial projects associated, namely petrochemical industry projects fuelled by the discoveries of hydrocarbons in offshore blocks near Lobito. The net amount of this asset, as at 31 December 2018, amounts to AOA 185,415,278 thousand, which is deducted from impairments recorded in 2016 in the amount of AOA 186,094,800 thousand (USD 600 million). Drill ships
In previous years, Sonangol E.P. contracted the building of two drill ships, on a turnkey basis, to the Daewoo Shipbuilding and Marine Engineering Co., Ltd – DSME shipyard, in South Korea.

SOCIEDADE NACIONAL DE COMBUSTÍVEIS DE ANGOLA E.P.
35
These 7th generation drill ships named “Hull 3620 – Sonangol Libongos” and “Hull 3621 - Sonangol Quenguela”, are capable of drilling in ultra-deep water, and are expected to be delivered during the first half of 2019, with no additional costs to the company. As at 31 December 2018, these ships were in a final stage of construction and will be available to be delivered against Sonangol payment of the last instalment foreseen in the contract (see Note 21). The capitalised amount of these assets amounts to AOA 341,315,146 thousand, included in Assets under construction and corresponds to the final purchase price of the ships, as agreed with DSME.
In 2018, Sonangol concluded the process of negotiation and partner identification, as well as the definition of the business model for the profitability of the two drill ships, which led to the signature, with Seadrill, of an agreement in February 2019 with five years of initial term, leading to the creation of the joint venture Sonadrill, with the purpose of performing the technical, commercial and operational management of four drilling units in the oil operations in Angolan waters. Seadrill resorted to its own fleet and Sonangol resorted to its two drill ships: “Sonangol Libongos” and “Sonangol Quenguela”. Empresa de Serviços e Sondagens de Angola, Lda. – ESSA represents Sonangol EP in this joint venture, where each party has a participation of 50%. In accordance with the respective business model, the beginning of the operation of the drill ships shall be carried out in accordance with the Angolan legislation's Compliance rules (Decree-Law No. 48/06) and competitive daily average tariffs shall be applied, indexed to the industry’s benchmark prices. 4.1.2 Movements in gross amount during the year
In 2018, the movements occurred in the gross amount of tangible fixed assets were as follows:
Items Opening balance Increases Decreases Transfers Other movements Exchange rate differences Closing balance
Land and natural resources 7,732,931,617 57,643,950 - - 371,592,500 1,897,615,860 10,059,783,927 Buildings and other construction 466,361,762,819 2,566,087,977 (2,512,799,681) - (576,649,540) 137,156,220,720 602,994,622,295 Basic equipment 445,851,578,090 2,567,918,741 (17,257,569,850) 6,182,770,776 893,412,176 283,060,664,089 721,298,774,022 Transport equipment 23,723,233,010 717,612,987 (504,445,953) - 50,213,383 6,548,453,887 30,535,067,314 IT equipment 33,159,430,328 132,626,455 (7,377,356) - (215,321,413) 19,064,445,283 52,133,803,297 Administrative equipment 40,457,481,820 130,783,179 (7,349,560) - 324,637,569 14,141,006,821 55,046,559,829 Other tangible fixed assets 3,681,388,138 270,691,633 - - 53,550,402 2,930,299,375 6,935,929,548 Assets under construction 236,754,443,421 320,845,767,172 (6,014,567,190) (6,182,770,776) (2,134,020,207) 103,099,536,999 646,368,389,419 Advance payments for tangible fixed assets 1,503,430 19,717,073 - - 18,189,202 - 39,409,705
1,257,723,752,673 327,308,849,167 (26,304,109,590) - (1,214,395,928) 567,898,243,034 2,125,412,339,356
The increase in the period mainly relates to the investments in the Drill ships, which amounted to AOA 309,945,756 thousand. 4.1.3 Movements in accumulated depreciation during the year In 2018, the movements occurred in the accumulated depreciations of Tangible fixed assets were as follows:
Items Opening balance Increases Decreases Other movements Exchange rate differences Closing balance
Building and other construction 147,156,633,786 23,841,493,806 (31,057,408) 464,640 31,584,020,411 202,551,555,235 Basic equipment 188,572,473,402 69,367,379,886 (15,256,920,142) 590,879,739 121,307,866,366 364,581,679,251 Transport equipment 20,459,280,975 1,263,564,920 (482,521,483) (570,687,524) 5,346,810,413 26,016,447,301 IT equipment 31,495,117,321 602,644,937 (7,377,356) - 18,682,829,803 50,773,214,705 Administrative equipment 33,099,314,457 3,512,932,304 (7,280,293) 21,459,097 11,101,515,116 47,727,940,681 Other Tangible fixed assets 3,073,842,880 362,178,858 - 53,433,130 2,480,911,796 5,970,366,664
423,856,662,821 98,950,194,711 (15,785,156,682) 95,549,082 190,503,953,905 697,621,203,837
Depreciation increases for the year include the effect of impairments and exceptional amortisation in the non-core segment recognised against Retained Earnings in the amount of AOA 35,162,273 thousand (see note 13) and exceptional amortisation regarding the non-core segment recognised in Non-operating results in the amount of 3,939,834 thousand also regarding the non-core segment (see note 33).
SOCIEDADE NACIONAL DE COMBUSTÍVEIS DE ANGOLA E.P.
36
4.A. Oil and gas upstream assets
4.A.1 Detail by nature All exploration and development investments directly related to mining activity are included in this caption. Costs incurred with the drilling of exploration wells until they result in commercial discovery are considered as an investment in progress, otherwise if the discovery is considered as not commercial these will be recorded as expenses. On the other hand, expenses related to the construction, installation and completion of infrastructures such as platforms, pipelines as well as other development costs are recorded in Assets under construction until the date on which they become available for use. Development costs are depreciated using the production units method, which represents the coefficient calculated by the proportion of the production volume of hydrocarbons recorded in each period over the volume of proven developed reserves of hydrocarbons (1PD reserves) at the end of the period plus the production volume of hydrocarbons observed in the period. As at 31 December 2018, oil and gas upstream assets are analysed as follows:
4.A.2 Movements in gross amount during the year
In 2018, movements in the gross amount of oil and gas upstream assets were as follows:
Items 2017 Increases Decreases Transfers Exchange rate differences
Other movements 2018
Development costs 3,909,565,039,125 248,809,049,582 - 754,677,348,270 2,499,828,429,004 (10,274,467,183) 7,402,605,398,798 Abandonment costs 301,383,506,420 179,802,558,910 (4,564,437,849) - 167,910,462,903 59,306,325,196 703,838,415,580 Work in progress (mining assets) 1,111,239,149,425 76,047,499,788 - (720,190,155,367) 810,998,993,614 - 1,278,095,487,460
5,322,187,694,970 504,659,108,280 (4,564,437,849) 34,487,192,903 3,478,737,885,521 49,031,858,013 9,384,539,301,838
Increases in the development costs and work in progress during the year mainly relates to investments made in blocks 15.06 and 32.00. The net value of transfers mainly relates to the reclassification of exploration and evaluation assets associated with block 21.09 (Note 5A). Additionally, a group of assets relating to blocks 15.06 and 32.00, were transferred from the caption Work in progress (mining assets) to the caption Development costs, after entry of those blocks into production.
Increases and other movements regarding Abandonment costs are mainly related to the change in the accounting policy disclosed in Note 2.4, relating to the capitalization of exchange rate differences generated by the revaluation of the provision for decommissioning disclosed in note 18.3 Provisions for decommissioning, can be broken down into the following blocks:
• Block 0: AOA 222,438,516 thousand; • FS/FST: AOA 6,178,436 thousand.
The caption Other movements in Development costs relates to the regularisation of the asset related to Sonangol P&P Iraque as a result of the revision of this entity’s corporate documentation outlined in Note 5A.
Items 2018 Gross amount 2018 Accumulated depreciation
2018 Accumulated impairments 2018 Net amount 2017 Net amount
Development costs 7,402,605,398,798 (4,766,187,633,485) (39,375,902,547) 2,597,041,862,766 1,148,778,356,646 Abandonment costs 703,838,415,580 (356,139,979,208) (501,518,384) 347,196,917,988 110,467,519,077 Work in progress (mining assets) 1,278,095,487,460 - (80,369,227,177) 1,197,726,260,283 1,111,239,149,425
9,384,539,301,838 (5,122,327,612,693) (120,246,648,108) 4,141,965,041,037 2,370,485,025,148

SOCIEDADE NACIONAL DE COMBUSTÍVEIS DE ANGOLA E.P.
37
4.A.2.1 Movements, during the year, in the gross amount of Development costs of Mining Assets by Block:
Block 2017 Increases Decreases Transfers Other movements
Exchange rate differences 2018
B02.05 125,523,946,241 - - - - 107,954,252,238 233,478,198,479 B03.05 97,756,969,080 4,274,620,470 - - - 85,034,085,749 187,065,675,299 B03.5A 9,267,245,050 (1,925,893) - - - 7,969,668,213 17,234,987,370 B04.05 72,134,041,057 - - - - 62,037,377,699 134,171,418,756 B14.00 443,739,763,503 768,392,876 - - - 381,801,740,087 826,309,896,466 B14.KU 43,441,058,682 (124,762,720) - - - 37,332,550,106 80,648,846,068 B15.06 565,014,663,158 88,945,668,285 - 170,781,728,503 - 544,273,779,351 1,369,015,839,297 B17.06 48,189,111 - - (73,191,534) - 25,002,423 - B31.00 1,184,015,739,178 3,831,787,823 - (25,789,522) - 1,019,143,017,407 2,206,964,754,886 B32.00 0 109,493,033,988 - 583,994,600,823 - 155,783,831,194 849,271,466,005 BFS/FST 16,426,451,233 1,231,688,254 - - - 1,332,134,903 18,990,274,390 BOC.ST 8,946,378,959 (482,297,402) - - - 7,585,804,220 16,049,885,777 Bloco 0 1,336,485,912,104 40,872,843,901 - - - 86,045,400,000 1,463,404,156,005 Iraque 6,764,681,769 - - - (10,274,467,183) 3,509,785,414 - Total 3,909,565,039,125 248,809,049,582 - 754,677,348,270 (10,274,467,183) 2,499,828,429,004 7,402,605,398,798
4.A.2.2 Movements, during the year, in the gross amount of Abandonment costs of Mining Assets by Block:
Block 2017 Increases Decreases Transfers Other movements Exchange rate differences 2018
B02.05 10,096,268,507 - (78,259) - - 8,683,067,598 18,779,257,846 B03.05 37,310,508,646 5,476,278,973 - - - 33,318,306,460 76,105,094,079 B03.5A 319,590,123 124,488,919 - - 511,595 302,936,714 747,527,351 B04.05 12,223,154,350 53,155,304 - - - 10,524,209,705 22,800,519,359 B14.00 53,898,257,244 - (561,953,001) - - 46,227,836,002 99,564,140,245 B14.KU 750,841,791 - (193,864,111) - - 602,196,534 1,159,174,214 B15.06 28,801,562,135 3,524,916,460 - - - 25,562,013,851 57,888,492,446 B31.00 34,220,637,388 1,213,101,699 - - - 29,703,254,685 65,136,993,772 B32.00 15,517,558,491 - (3,807,612,983) - - 12,490,217,150 24,200,162,658 BFS/FST 4,946,823,420 6,178,169,552 (929,495) - 1,399,500 332,364,367 11,457,827,344 BOC.ST 165,020,932 98,326,267 - - 218,963 164,059,837 427,625,999 Bloco 0 103,133,283,393 163,134,121,736 - - 59,304,195,138 - 325,571,600,267 Total 301,383,506,420 179,802,558,910 (4,564,437,849) - 59,306,325,196 167,910,462,903 703,838,415,580
4.A.2.3 Movements, during the year, in the gross amount of Work in Progress (Mining Assets) by Block:
Block 2017 Increases Decreases Transfers Other movements
Exchange rate differences 2018
B03.5A 8,317,462,925 173,489,952 - - - 7,192,233,008 15,683,185,885 B04.05 (1,144,263) 928,644,448 - - - 207,624,941 1,135,125,126 B05.06 (40,610,162) - - - - (34,925,923) (75,536,085) B09.09 (22,687,307) - - - - (19,511,745) (42,199,052) B14.00 38,393,434,740 1,275,638 - - - 33,019,759,433 71,414,469,811 B15.06 108,319,545,937 (64,892) - (170,845,635,919) - 54,779,491,602 (7,746,663,272) B17.06 8,476,019,890 55,097,033 - 73,191,534 - 7,318,442,660 15,922,751,117 B21.09 60,812,861,567 - - 32,840,871,076 - 59,678,148,354 153,331,880,997 B22.11 (119,843,812) - - - - (103,069,171) (222,912,983) B31.00 76,058,323,762 715,176,403 - 186,703,384 - 65,614,972,016 142,575,175,565 B32.00 806,413,717,789 74,176,253,200 - (582,445,285,442) - 579,362,647,486 877,507,333,033 B35.11 (10,297,995) (2,371,994) - - - (9,389,416) (22,059,405) B36.11 3,796,781,361 - - - - 3,265,342,630 7,062,123,991 B37.11 845,584,993 - - - - 727,227,739 1,572,812,732 Total 1,111,239,149,425 76,047,499,788 - (720,190,155,367) - 810,998,993,614 1,278,095,487,460
4.A.3 Movements in accumulated depreciation during the year
In 2018, movements in accumulated depreciation of oil and gas upstream assets were as follows:
Items 2017 Increases Decreases Transfers Exchange rate differences
Other movements 2018
Development costs (2,492,660,447,430) (630,121,506,884) - - (1,643,405,679,171) - 4,766,187,633,485 Abandonment costs (181,631,410,445) (36,494,786,803) - - (118,073,904,364) (19,939,877,596) 356,139,979,208
(2,674,291,857,875) (666,616,293,687) - - (1,761,479,583,535) (19,939,877,596) 5,122,327,612,693
Other movements in Abandonment costs are related to the recalculation of depreciation of previous years in Block 0, whose impacts were recorded in Retained Earnings. This recalculation results from a change in the accounting policy disclosed in Note 2.4, regarding the capitalization of exchange rate differences resulting from the foreign currency revaluation of decommissioning provision disclosed in Note 18.3 Provisions for decommissioning. As a result of changes in the accounting policy disclosed in Note 2.4, the net impact in retained earnings, resulting from adjustments of the gross amount (Note 4A.2) and accumulated depreciation of investments in the mining activity, amounted to AOA 39,394,257 thousand (Note 13).

SOCIEDADE NACIONAL DE COMBUSTÍVEIS DE ANGOLA E.P.
38
4.A.3.1 Movements, during the year, in accumulated depreciation of Development Mining Assets by Block:
Block 2017 Increases Decreases Transfers Other movements
Exchange rate differences 2018
B02.05 (125,523,946,241) - - - - (107,954,252,238) (233,478,198,479) B03.05 (79,205,760,364) (10,868,382,703) - - - (70,560,716,609) (160,634,859,676) B03.5A (608,459,814) - - - - (523,293,174) (1,131,752,988) B04.05 (72,132,750,116) - - - - (62,036,267,452) (134,169,017,568) B14.00 (421,716,574,168) (13,914,735,705) - - - (365,814,326,495) (801,445,636,368) B14.KU (13,823,146,306) (4,845,021,340) - - - (12,976,685,700) (31,644,853,346) B15.06 (218,546,546,877) (191,492,081,056) - - - (230,972,841,134) (641,011,469,067) B31.00 (779,058,672,890) (224,305,584,385) - - - (720,400,773,105) (1,723,765,030,380) B32.00 - (82,484,433,756) - - - (18,529,156,771) (101,013,590,527) BFS/FST (11,876,904,664) (523,157,193) - - - (947,166,027) (13,347,227,884) BOC.ST (3,422,092,572) (524,179,070) - - - (3,060,850,007) (7,007,121,649) Bloco 0 (766,745,593,418) (101,163,931,676) - - - (49,629,350,459) (917,538,875,553) Total (2,492,660,447,430) (630,121,506,884) - - - (1,643,405,679,171) (4,766,187,633,485)
4.A.3.2 Movements, during the year, in accumulated depreciation of Abandonment Mining Assets by Block:
Block 2017 Increase Decreases Transfers Other movements
Exchange rate differences 2018
B02.05 (10,096,268,507) - - - 78,302 (8,683,067,588) (18,779,257,793) B03.05 (29,180,338,343) (1,122,164,698) - - - (25,348,022,539) (55,650,525,580) B03.5A (3,332,610) - - - (511,595) (2,981,066) (6,825,271) B04.05 (12,223,154,350) - - - - (10,512,268,992) (22,735,423,342) B14.00 (51,766,829,139) (424,797,611) - - - (44,616,407,616) (96,808,034,366) B14.KU (196,324,103) (199,901,571) - - (26,070,739) (219,606,469) (641,902,882) B15.06 (9,183,979,329) (7,916,544,841) - - - (9,676,848,475) (26,777,372,645) B31.00 (19,108,849,550) (8,530,132,122) - - (3,168,443) (18,351,073,082) (45,993,223,197) B32.00 - (1,291,505,592) - - - (290,121,523) (1,581,627,115) BFS/FST (2,916,597,649) (418,892,290) - - - (332,364,423) (3,667,854,362) BOC.ST (47,781,409) (218,960) - - - (41,142,591) (89,142,960) Bloco 0 (46,907,955,456) (16,590,629,118) (19,910,205,121) - (83,408,789,695) Total (181,631,410,445) (36,494,786,803) - - (19,939,877,596) (118,073,904,364) (356,139,979,208)
4.A.4 Movements, during the year, in Impairment by Blocks:
In 2018, the movements occurred in accumulated impairment losses of oil and gas upstream assets by blocks were as follows:
Block 2017 Reversals Other movements Exchange rate differences 2018
B03.05 3,429,506,673 (5,208,870,863) - 1,779,364,190 - B03.5A 47,648,527 (550,475,783) 478,105,309 24,721,947 - B14.00 3,932,820,354 (5,973,323,660) - 2,040,503,306 - B14.KU 20,357,797,286 (5,575,934,413) - 16,255,730,998 31,037,593,871 B15.06 33,025,599,591 (50,160,591,550) - 17,134,991,959 - B17.06 3,381,678,558 - - 2,908,342,121 6,290,020,679 B21.09 7,298,675,265 - - 6,277,073,452 13,575,748,717 B31.00 28,921,054,780 (43,926,445,969) - 15,005,391,189 - B32.00 167,059,538,163 (211,382,499,582) - 96,191,482,405 51,868,520,986 B36.11 3,796,781,351 - - 3,265,342,621 7,062,123,972 B37.11 845,585,013 - - 727,227,756 1,572,812,769 BFS/FST 335,261,875 - (75,380,275) 271,401,375 531,282,975 BOC.ST 4,978,864,511 (777,608,394) - 4,107,288,022 8,308,544,139 Total 277,410,811,947 (323,555,750,214) 402,725,034 165,988,861,341 120,246,648,108
As disclosed in Note 2.2.2 Estimates and assumptions (v), to assess the impairment of investments in Oil and Gas upstream assets and in Exploration and Evaluation Assets in the various oil fields, the Group uses sources of information certified by independent entities, considering the proven and probable reserves. For the year ended 31 December 2018, Sonangol used this assumption for all the blocks except Block 15/06 where the oil reserve information was provided by the block operator. The adoption of this methodology is essentially justified by the significant divergence observed in Campo Ochiguvo’s reserves evaluated by the independent entity at approximately 42% below the reserves established by the Operator of that above-mentioned block. In view of the scenario of disagreement of information presented above, the Group carried out a set of internal procedures and evaluations and technical discussions and concluded that it is more appropriate to use the oil reserves reported by the operator of Block 15/06.
Regarding the impairment tests performed to the mining assets in production, there was an increase in their recoverable amount compared to the previous year, mainly due to the update of the estimate of the price curve and the revision of the discount rate, which resulted in the reversal of impairments for mining assets in the amount of AOA 323,555,750 thousand (of which approximately 65% refer to block 32.00), recognised under Non-operating Results.
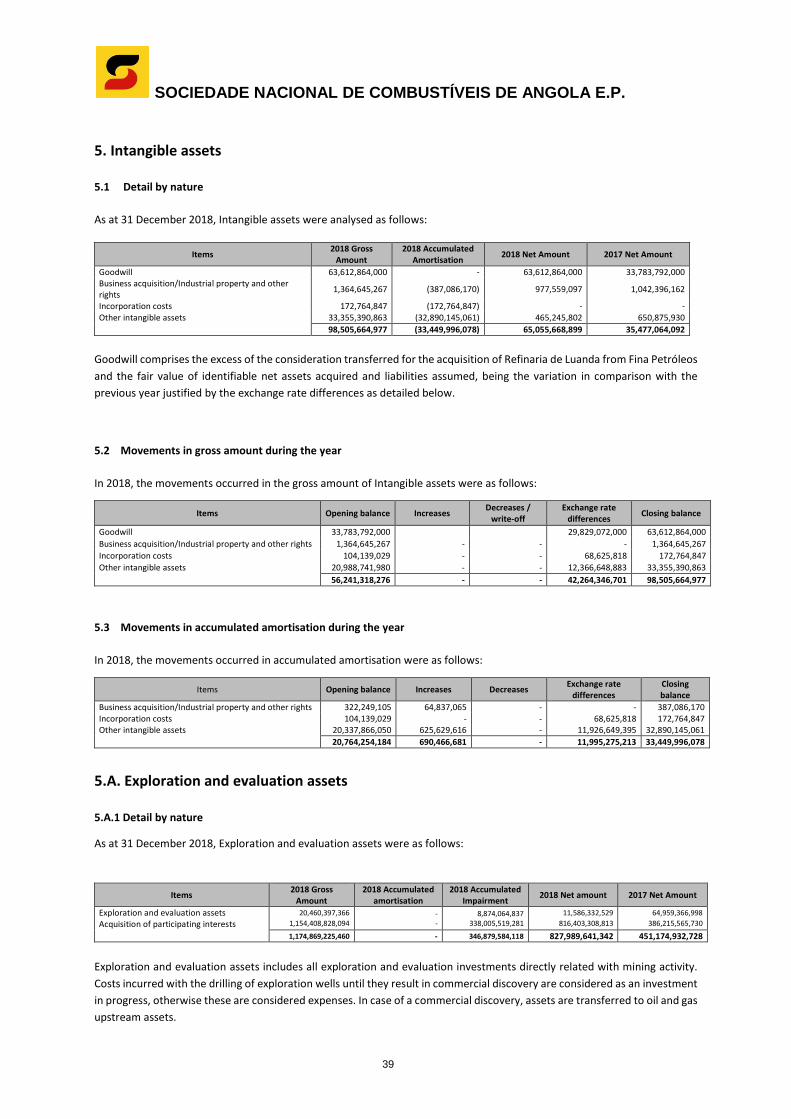
SOCIEDADE NACIONAL DE COMBUSTÍVEIS DE ANGOLA E.P.
39
5. Intangible assets 5.1 Detail by nature
As at 31 December 2018, Intangible assets were analysed as follows:
Items 2018 Gross Amount
2018 Accumulated Amortisation 2018 Net Amount 2017 Net Amount
Goodwill 63,612,864,000 - 63,612,864,000 33,783,792,000 Business acquisition/Industrial property and other rights 1,364,645,267 (387,086,170) 977,559,097 1,042,396,162
Incorporation costs 172,764,847 (172,764,847) - - Other intangible assets 33,355,390,863 (32,890,145,061) 465,245,802 650,875,930
98,505,664,977 (33,449,996,078) 65,055,668,899 35,477,064,092
Goodwill comprises the excess of the consideration transferred for the acquisition of Refinaria de Luanda from Fina Petróleos and the fair value of identifiable net assets acquired and liabilities assumed, being the variation in comparison with the previous year justified by the exchange rate differences as detailed below.
5.2 Movements in gross amount during the year
In 2018, the movements occurred in the gross amount of Intangible assets were as follows:
Items Opening balance Increases Decreases / write-off
Exchange rate differences Closing balance
Goodwill 33,783,792,000 29,829,072,000 63,612,864,000 Business acquisition/Industrial property and other rights 1,364,645,267 - - - 1,364,645,267 Incorporation costs 104,139,029 - - 68,625,818 172,764,847 Other intangible assets 20,988,741,980 - - 12,366,648,883 33,355,390,863
56,241,318,276 - - 42,264,346,701 98,505,664,977
5.3 Movements in accumulated amortisation during the year
In 2018, the movements occurred in accumulated amortisation were as follows:
Items Opening balance Increases Decreases Exchange rate differences
Closing balance
Business acquisition/Industrial property and other rights 322,249,105 64,837,065 - - 387,086,170 Incorporation costs 104,139,029 - - 68,625,818 172,764,847 Other intangible assets 20,337,866,050 625,629,616 - 11,926,649,395 32,890,145,061
20,764,254,184 690,466,681 - 11,995,275,213 33,449,996,078
5.A. Exploration and evaluation assets 5.A.1 Detail by nature
As at 31 December 2018, Exploration and evaluation assets were as follows:
Items 2018 Gross Amount
2018 Accumulated amortisation
2018 Accumulated Impairment 2018 Net amount 2017 Net Amount
Exploration and evaluation assets 20,460,397,366 - 8,874,064,837 11,586,332,529 64,959,366,998 Acquisition of participating interests 1,154,408,828,094 - 338,005,519,281 816,403,308,813 386,215,565,730
1,174,869,225,460 - 346,879,584,118 827,989,641,342 451,174,932,728 Exploration and evaluation assets includes all exploration and evaluation investments directly related with mining activity. Costs incurred with the drilling of exploration wells until they result in commercial discovery are considered as an investment in progress, otherwise these are considered expenses. In case of a commercial discovery, assets are transferred to oil and gas upstream assets.

SOCIEDADE NACIONAL DE COMBUSTÍVEIS DE ANGOLA E.P.
40
5.A.2 Movements in gross amount during the year
During 2018, movements in the gross amount of Exploration and evaluation assets were as follows:
Items 2017 Increases Decreases Transfers Other movements
Exchange rate differences 2018
Exploration and evaluation assets: B15.06 1,477,656,434 3,891,617,012 - 63,907,416 - 2,159,389,588 7,592,570,450 B21.09 21,622,341,830 - - (32,840,871,030) - 11,218,529,200 - B22.11 (162,080,361) - - - - (139,393,834) (301,474,195) B31.00 567,159,538 - - (160,913,691) - 451,626,229 857,872,076 B32.00 1,035,274,006 - - (1,549,315,598) - 542,330,792 28,289,200 B37.11 840,653,911 - - - - 722,986,864 1,563,640,775 Bloc 2 - S.Tomé 3,409,075,000 - - - - - 3,409,075,000 Iraq 37,009,940,550 - - - (56,212,166,750) 19,202,226,200 - Venezuela 3,930,273,930 - - - - 3,380,150,130 7,310,424,060
69,730,294,838 3,891,617,012
-
(34,487,192,903)
(56,212,166,750)
37,537,845,169
20,460,397,366
Acquisition of participating interests:
B09.09 23,308,999,961 - - - - 20,046,419,321 43,355,419,282
B.20.11 e 21.09 235,151,949,985 80,049,028,375 - - - 220,219,602,364 535,420,580,724 B31.00 309,475,165,746 - - - - 266,157,662,342 575,632,828,088
567,936,115,692
80,049,028,375
- -
-
506,423,684,027
1,154,408,828,094
637,666,410,530
83,940,645,387
-
(34,487,192,903) (56,212,166,750)
543,961,529,196
1,174,869,225,460
Iraq As at 31 December 2018, the Group reviewed the corporate documentation and the model of operations of the assets in Iraq and concluded that the presentation of the participating interest in Note 6.2 Detail by entity – financial investments – cost less impairment losses, reflects more appropriately the operational nature of such participation, so, the Company's assets and liabilities have been adjusted in accordance with the activity in Iraq Investments in other companies and retained earnings (see Note 4A, 6, 9, 13 and 18).
Subjacent to this adjustment is the fact that the oil operations in Iraq are carried out by Sonangol P&P Iraque (a subsidiary of Sonangol Hidrocarbonetos Internacional), a non-consolidated entity based in the Cayman Islands that holds, through a branch in Iraq, participating interests in the two oilfields in Iraq. Block 2 - S.Tomé This Item refers to the acquisition of 30% of the participating interests of block 2 in São Tomé and Príncipe. At the date of the approval of the financial statements, negotiation have begun on the extension of the exploration license for the mentioned block, with the Republic of São Tomé e Príncipe’s authorities. The Board of Directors expects the process to have a favourable outcome for Sonangol E.P., given the fact that the delays occurred in the beginning of the works are not attributable to Sonangol. Blocks 20.11 and 21.09
Sonangol’s Board of Directors believes that these blocks have potential for profitability due to the contingent resources of oil and gas. The potential of these blocks is associated with the existence of a contractual gas matrix, which is currently under development by an inter-ministerial workgroup of which Sonangol EP is a member. In the absence of a clear regulation allowing the gas resources valuation, it is difficult to perform a reasonable evaluation, based on solid and consistent assumptions with the eventual results of the inter-ministerial work group. However, Sonangol’s Board of Directors expects that the efforts already initiated by the Angola Government will allow the valuation and monetization of those resources in line with the returns’ expectations foreseen at the date of the investment in the blocks.
Block 31 Sonangol’s Board of Directors believes that the second Hub of Block 31 has potential for profitability due to the total estimated contingent resources of oil and gas. The related resources are divided and distributed over 15 small fields, thereby increasing development costs as opposed to a conventional development. However, efforts have been made to find more efficient techniques that can reduce the investment needs in infrastructures, increasing its economic attraction and, therefore, allowing the recovery of its net book value.
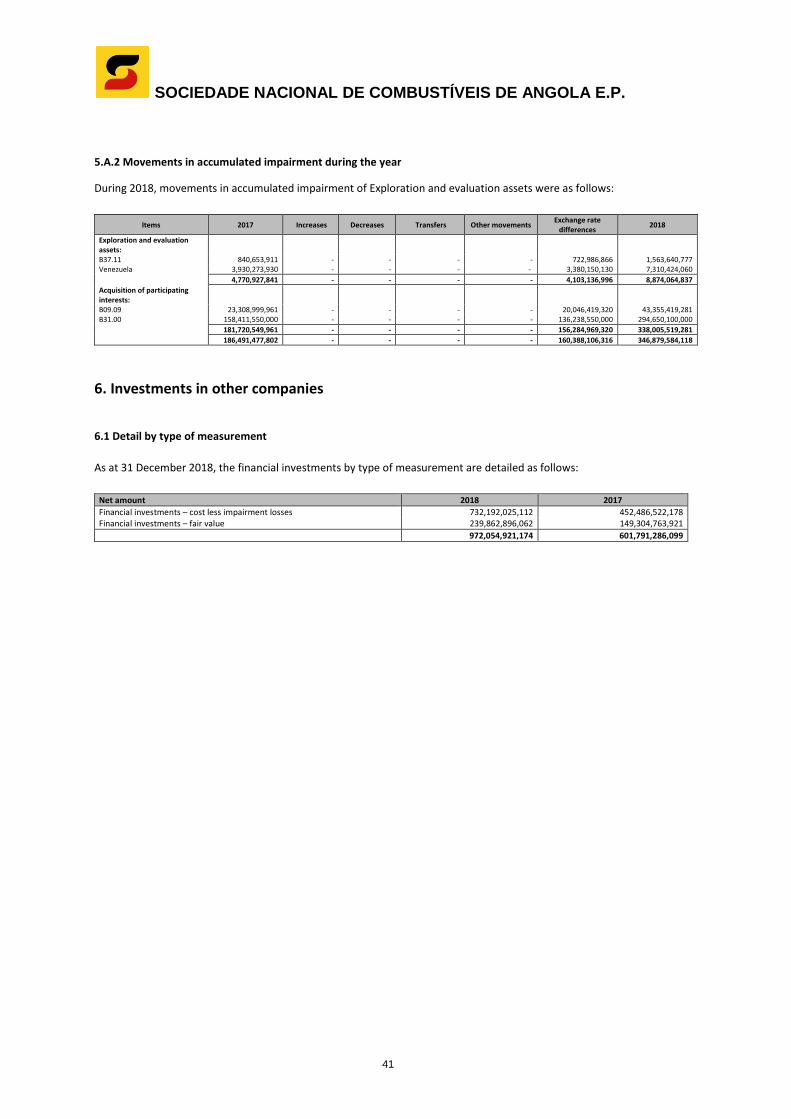
SOCIEDADE NACIONAL DE COMBUSTÍVEIS DE ANGOLA E.P.
41
5.A.2 Movements in accumulated impairment during the year
During 2018, movements in accumulated impairment of Exploration and evaluation assets were as follows:
Items 2017 Increases Decreases Transfers Other movements Exchange rate differences 2018
Exploration and evaluation assets:
B37.11 840,653,911 - - - - 722,986,866 1,563,640,777 Venezuela 3,930,273,930 - - - - 3,380,150,130 7,310,424,060 4,770,927,841 - - - - 4,103,136,996 8,874,064,837 Acquisition of participating interests:
B09.09 23,308,999,961 - - - - 20,046,419,320 43,355,419,281 B31.00 158,411,550,000 - - - - 136,238,550,000 294,650,100,000 181,720,549,961 - - - - 156,284,969,320 338,005,519,281 186,491,477,802 - - - - 160,388,106,316 346,879,584,118
6. Investments in other companies
6.1 Detail by type of measurement As at 31 December 2018, the financial investments by type of measurement are detailed as follows:
Net amount 2018 2017 Financial investments – cost less impairment losses 732,192,025,112 452,486,522,178 Financial investments – fair value 239,862,896,062 149,304,763,921 972,054,921,174 601,791,286,099
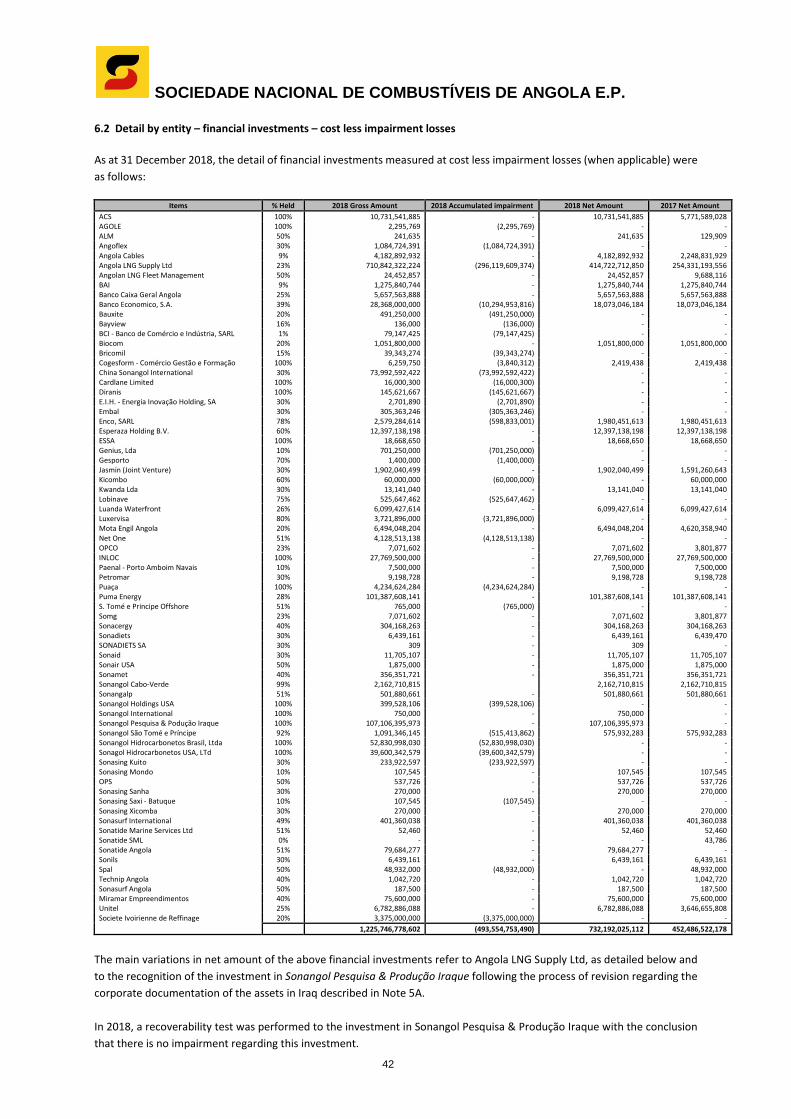
SOCIEDADE NACIONAL DE COMBUSTÍVEIS DE ANGOLA E.P.
42
6.2 Detail by entity – financial investments – cost less impairment losses As at 31 December 2018, the detail of financial investments measured at cost less impairment losses (when applicable) were as follows:
Items % Held 2018 Gross Amount 2018 Accumulated impairment 2018 Net Amount 2017 Net Amount ACS 100% 10,731,541,885 - 10,731,541,885 5,771,589,028 AGOLE 100% 2,295,769 (2,295,769) - - ALM 50% 241,635 - 241,635 129,909 Angoflex 30% 1,084,724,391 (1,084,724,391) - - Angola Cables 9% 4,182,892,932 - 4,182,892,932 2,248,831,929 Angola LNG Supply Ltd 23% 710,842,322,224 (296,119,609,374) 414,722,712,850 254,331,193,556 Angolan LNG Fleet Management 50% 24,452,857 - 24,452,857 9,688,116 BAI 9% 1,275,840,744 - 1,275,840,744 1,275,840,744 Banco Caixa Geral Angola 25% 5,657,563,888 - 5,657,563,888 5,657,563,888 Banco Economico, S.A. 39% 28,368,000,000 (10,294,953,816) 18,073,046,184 18,073,046,184 Bauxite 20% 491,250,000 (491,250,000) - - Bayview 16% 136,000 (136,000) - - BCI - Banco de Comércio e Indústria, SARL 1% 79,147,425 (79,147,425) - - Biocom 20% 1,051,800,000 - 1,051,800,000 1,051,800,000 Bricomil 15% 39,343,274 (39,343,274) - - Cogesform - Comércio Gestão e Formação 100% 6,259,750 (3,840,312) 2,419,438 2,419,438 China Sonangol International 30% 73,992,592,422 (73,992,592,422) - - Cardlane Limited 100% 16,000,300 (16,000,300) - - Diranis 100% 145,621,667 (145,621,667) - - E.I.H. - Energia Inovação Holding, SA 30% 2,701,890 (2,701,890) - - Embal 30% 305,363,246 (305,363,246) - - Enco, SARL 78% 2,579,284,614 (598,833,001) 1,980,451,613 1,980,451,613 Esperaza Holding B.V. 60% 12,397,138,198 - 12,397,138,198 12,397,138,198 ESSA 100% 18,668,650 - 18,668,650 18,668,650 Genius, Lda 10% 701,250,000 (701,250,000) - - Gesporto 70% 1,400,000 (1,400,000) - - Jasmin (Joint Venture) 30% 1,902,040,499 - 1,902,040,499 1,591,260,643 Kicombo 60% 60,000,000 (60,000,000) - 60,000,000 Kwanda Lda 30% 13,141,040 - 13,141,040 13,141,040 Lobinave 75% 525,647,462 (525,647,462) - - Luanda Waterfront 26% 6,099,427,614 - 6,099,427,614 6,099,427,614 Luxervisa 80% 3,721,896,000 (3,721,896,000) - - Mota Engil Angola 20% 6,494,048,204 - 6,494,048,204 4,620,358,940 Net One 51% 4,128,513,138 (4,128,513,138) - - OPCO 23% 7,071,602 - 7,071,602 3,801,877 INLOC 100% 27,769,500,000 - 27,769,500,000 27,769,500,000 Paenal - Porto Amboim Navais 10% 7,500,000 - 7,500,000 7,500,000 Petromar 30% 9,198,728 - 9,198,728 9,198,728 Puaça 100% 4,234,624,284 (4,234,624,284) - - Puma Energy 28% 101,387,608,141 - 101,387,608,141 101,387,608,141 S. Tomé e Principe Offshore 51% 765,000 (765,000) - - Somg 23% 7,071,602 - 7,071,602 3,801,877 Sonacergy 40% 304,168,263 - 304,168,263 304,168,263 Sonadiets 30% 6,439,161 - 6,439,161 6,439,470 SONADIETS SA 30% 309 - 309 - Sonaid 30% 11,705,107 - 11,705,107 11,705,107 Sonair USA 50% 1,875,000 - 1,875,000 1,875,000 Sonamet 40% 356,351,721 - 356,351,721 356,351,721 Sonangol Cabo-Verde 99% 2,162,710,815 2,162,710,815 2,162,710,815 Sonangalp 51% 501,880,661 - 501,880,661 501,880,661 Sonangol Holdings USA 100% 399,528,106 (399,528,106) - - Sonangol International 100% 750,000 - 750,000 - Sonangol Pesquisa & Podução Iraque 100% 107,106,395,973 - 107,106,395,973 - Sonangol São Tomé e Príncipe 92% 1,091,346,145 (515,413,862) 575,932,283 575,932,283 Sonangol Hidrocarbonetos Brasil, Ltda 100% 52,830,998,030 (52,830,998,030) - - Sonagol Hidrocarbonetos USA, LTd 100% 39,600,342,579 (39,600,342,579) - - Sonasing Kuito 30% 233,922,597 (233,922,597) - - Sonasing Mondo 10% 107,545 - 107,545 107,545 OPS 50% 537,726 - 537,726 537,726 Sonasing Sanha 30% 270,000 - 270,000 270,000 Sonasing Saxi - Batuque 10% 107,545 (107,545) - - Sonasing Xicomba 30% 270,000 - 270,000 270,000 Sonasurf International 49% 401,360,038 - 401,360,038 401,360,038 Sonatide Marine Services Ltd 51% 52,460 - 52,460 52,460 Sonatide SML 0% - - - 43,786 Sonatide Angola 51% 79,684,277 - 79,684,277 - Sonils 30% 6,439,161 - 6,439,161 6,439,161 Spal 50% 48,932,000 (48,932,000) - 48,932,000 Technip Angola 40% 1,042,720 - 1,042,720 1,042,720 Sonasurf Angola 50% 187,500 - 187,500 187,500 Miramar Empreendimentos 40% 75,600,000 - 75,600,000 75,600,000 Unitel 25% 6,782,886,088 - 6,782,886,088 3,646,655,808 Societe Ivoirienne de Reffinage 20% 3,375,000,000 (3,375,000,000) - -
1,225,746,778,602 (493,554,753,490) 732,192,025,112 452,486,522,178
The main variations in net amount of the above financial investments refer to Angola LNG Supply Ltd, as detailed below and to the recognition of the investment in Sonangol Pesquisa & Produção Iraque following the process of revision regarding the corporate documentation of the assets in Iraq described in Note 5A. In 2018, a recoverability test was performed to the investment in Sonangol Pesquisa & Produção Iraque with the conclusion that there is no impairment regarding this investment.

SOCIEDADE NACIONAL DE COMBUSTÍVEIS DE ANGOLA E.P.
43
Financial investment in Angola LNG
The financial investments in Angola LNG Supply Ltd, Angola LNG Operating Company - Sociedade Operacional Angola LNG (OPCO) and Angola Gas Pipeline Company - Sociedade de Operações e Manutenção de Gasodutos, SA (SOMG), correspond to a 22.8% share in companies responsible for refining natural gas in Angola, in which Sonangol Gás Natural participates together with other operators, namely Chevron (operator) with 36.4% and Total, BP Amoco and ENI, all with 13.6%. In addition, the Group holds a 50% interest in Angola LNG Marketing Limited (ALM).
LNG Supply Ltd. is the gas refinery and is the main focus of the consortium investment. SOMG is the company responsible for the maintenance and repair of the refinery infrastructure and OPCO is the company responsible for providing technical expertise to operate the refinery. Finally, ALM is responsible for the marketing and distribution of gas.
During 2018, the movements in the financial investment in Angola LNG Supply Ltd were as follows:
Entity 2017 Net Amount Amounts Paid Amounts Received Provisions Other adjustments
Exchange rate differences 2018 Net Amount
Angola LNG Supply Ltd 254,331,193,556 - (47,639,146,500) - - 208,030,665,794 414,722,712,850
254,331,193,556 - (47,639,146,500) - - 208,030,665,794 414,722,712,850
In 2015 and 2016, the Group recognised accumulated impairment losses in this financial investment in the amount of approximately USD 954,7 million (corresponding to the amount of AOA 296,119,609 thousand as at 31 December 2018). New impairment tests were performed on the financial investment in Angola LNG Ltd, which did not result in additional impairment losses. It should be noted that the market risk had a positive impact considering the expectation of recovery of the market price and the additional gas from the free areas. The strategic goal of Angola LNG is to ensure additional natural gas resources in order to fully comply with the refinery’s needs. Within this scenario, the Angola LNG’s plan for gas supply includes the development of a diversified portfolio of natural gas sources, namely:
— In the short term, additional resources from Associação de Cabinda, with the development of the Sanha and Nemba fields, which are expected to start supplying gas to Angola LNG as of 2022;
— In the medium term, the development of the existing non-associated gas reserves by a new joint venture to be formed by Angola LNG’s shareholders.
The recent approval of the Gas Law - Presidential Legislative Decree No. 7/18 of 18 May, will allow new developments in the industry. The shareholders of Angola LNG are in line with this legal initiative, and are willing to invest in new sources of gas supply. Consequently, other specific measures are under discussion with the national authorities that will allow Angola LNG to play an even greater role as investor in new gas projects as well as gas buyer thus enabling new upstream investments to be promoted by other players. During 2018, the shareholders of Angola LNG Ltd. decided to reduce the share capital by USD 825 million, of which USD 188 million (AOA 47,639,146 thousand) were attributable to Sonangol, whose receipt was recognised as a reduction in the carrying amount of the investment. 6.2.1 Movements, during the year, in provisions In 2018, the movements occurred in the accumulated provisions of financial investments were as follows:
Items 2017 Increases Decreases Financial Statements
conversion 2018
Associates 312,372,600,356 108,932,000 (2,218,725,450) 183,291,946,584 493,554,753,490
Total 312,372,600,356 108,932,000 (2,218,725,450) 183,291,946,584 493,554,753,490

SOCIEDADE NACIONAL DE COMBUSTÍVEIS DE ANGOLA E.P.
44
6.3 Detail by entity – financial investments – fair value As at 31 December 2018, the financial investments measured at fair value relate to the investment in Banco Millennium BCP, as follows:
Item % held 2018 Fair value 2017 Fair value
Banco Millennium BCP 19.49% 239,862,896,062 149,304,763,921 239,862,896,062 149,304,763,921
In 2017, following the share capital increase of Millennium BCP, Sonangol E.P. acquired 2,163,186,020 shares for AOA 37,882,756 thousand. In addition, during 2017 Sonangol EP acquired 642,713,023 shares, in the amount of AOA 28,427,943 thousand. Accordingly, as at 31 December 2018, the Group holds 2,946,353,914 shares representing a qualified participation in the Bank’s share capital of 19.49% valued at fair value, based on market price as at 31 December 2018. The table below details the position in the balance sheet of the Group:
Year No. of Shares
Fair Value
EUR AOA
31-12-2007 180,000,000 525,600,000 58,030,181,977 31-12-2008 469,000,000 379,890,000 42,032,258,380 31-12-2009 469,000,000 397,008,500 51,025,914,471 31-12-2010 685,138,638 398,750,687 48,676,293,902 31-12-2011 794,933,620 108,110,564 13,671,878,185 31-12-2012 3,803,587,403 285,268,647 13,671,878,185 31-12-2013 3,803,587,403 635,877,509 85,245,738,843 31-12-2014 10,534,115,358 695,251,614 86,982,929,381 31-12-2015 10,534,115,358 516,171,653 76,689,170,933
31-12-2016* 140,454,871 150,427,167 28,021,873,581 31-12-2017 2,946,353,914 801,408,265 149,304,763,921 31-12-2018 2,946,353,914 676,188,224 239,862,896,062
(*) upon conversion of shares
Fair value changes were as follows:
Opening balance Exchange rate changes Fair Value Changes Closing balance
Amount in Euro 801,408,265 - (125,220,041) 676,188,224
Amount in Akz 149,304,763,921 134,977,186,967 (44,419,054,826) 239,862,896,062
Sonangol’s investment in Millennium BCP constitutes a strategic investment, since it is a relevant support for diversification of investments, of Sonangol E.P., in geographies such as Africa and Europe and enhances the Group’s internationalisation.
These securities are in the custody of Millennium BCP under a contract signed between this bank and Sonangol EP in 2017.

SOCIEDADE NACIONAL DE COMBUSTÍVEIS DE ANGOLA E.P.
45
6.4 Details on the more relevant investments on associates
As of 31 December 2018, the financial investments on the more relevant associates in the investment portfolio is broken down below:
Company Equity Net Profit for the Year Currency %[1] Head Office Parent company / Other relevant
shareholders Net Investment Amount
(AOA)
Banco Millennium BCP 5,591,163,000 59,267,000 EUR 19,49% Portugal
Fosun Group 27,25%
239,862,896,062
BlackRock, Inc 3,39%
EDP Group Pension Fund 2,09%
Other Shareholders 47,78%
Angola LNG Supply Ltd 5,987,242,541 953,876,891 USD 22,80% Bermuda Islands
Cabinda Gulf Oil Company 36,4%
414,722,712,850
BP Exploration (Angola) – 13,6%
Total LNG Angola – 13,6%
ENI Angola Production – 13,6%
Sonangol P&P Iraque 273,277,377 (72,051,120)
USD 100% Cayman Islands N/A 107,106,395,973 c) c)
Puma Energy Ltd 1,445,157,000 (25,208,000)
USD 27,99% Singapore
Trafigura (49,41%)
101,387,608,141 Cochan Holdings (15,48%)
a) a) Outros (7,12%)
INLOC 86,342,220 55,853
USD 100% Isle of Man N/A 27,769,500,000 b) b)
Banco Económico 48,413,256,000 b)
6,012,325,000 b) AKZ 39,40% Angola
Geni SA (19,90%)
18,073,046,184 Lektron Capital (30,98%)
Other (9,72%)
a) The information relating to Puma Energy refers to the consolidated financial statements of the entity, excluding non-controlling
interests.
b) The amounts presented refer to the financial information for 2017, since there is no financial information available for 2018 up to the
date of issuance of the Sonangol Group’s and consolidated financial statements.
c) Preliminary financial information for 2018.
7. Other financial assets
7.1 Detail by nature
As at 31 December 2018, Other financial assets are detailed as follows:
Items 2018 2017 Real Estate Investments 217,754,138,036 124,016,334,672 Energy Fund II & III 23,186,615,594 11,250,920,211 Gateway Fund I 93,028,711,898 46,495,131,658 Other financial assets 1,043,654 1,043,653
333,970,509,182 181,763,430,194

SOCIEDADE NACIONAL DE COMBUSTÍVEIS DE ANGOLA E.P.
46
7.1.1 Real Estate investments
As of 31 December 2018, Real estate investments were detailed as follows:
Items 2018 2017
Real Estate investment:
- Hotels 24,453,887,878 13,534,883,496 - Overseas properties 13,106,779,460 13,316,705,054 - Other properties 24,402,899,211 13,554,923,474 61,963,566,549 40,406,512,025
Real Estate investment in progress:
- Hotels 148,535,152,674 79,693,946,673
- Other properties 7,255,418,813 3,915,875,974
155,790,571,487 83,609,822,647
217,754,138,036 124,016,334,672
The caption Hotels includes investments in Hotels, such as, HCTA (AOA 18,239,210 thousand), Maianga (AOA 1,796,800 thousand), Florença (AOA 3,748,122 thousand) and Base do Kwanda (AOA 669,775 thousand). The operations of these Hotels are managed by third parties under exploration contracts and the Group receives rents for its operation (Note 24). The caption Overseas properties relates to the building owned outside the country which is operated by the Solo Properties Group.
The caption Real Estate investment in progress relates mainly to investments in Hotel Eixo Viário (formerly known as Hotel Intercontinental - Hotel & Casino) and Hotel Riomar, in the amount of AOA 139,303,706 thousand and AOA 9,231,446 thousand, respectively, whose conclusion is scheduled for 2019. During the period, no provision was booked for these assets and it is expected that they will be evaluated in 2019 by an independent entity after entering into operation. Outlook for Hotel Assets Within future actions aimed at obtaining a return on investments made in hotels (HCTA, Hotel Florence, Hotel Suite Maianga, Hotel Riomar, Hotel Eixo Viário), ensuring a better monitoring of the management of those hotels, maximising revenue and reducing costs , the Group intends to develop, among others, the following actions:
• Ensure the entry into operation of Hotel Eixo Viário; • Setting-up of a Committee to monitor the Hotels activities; • Technical evaluation of hotels and analysis of management and operating contracts in force; • Ensure that operators improve marketing and commercial policy in order to attract new customers, promote new
services and penetrate other market segments; • Revenue Assurance and debt recovery; • Cost reduction with an emphasis on administrative and maintenance costs; • Revaluation of the investment decisions to be made, considering the current macroeconomic context and the
economic life cycle of each hotel.
7.1.1.1 Movements, during the year, in real estate investments
Items Opening balance 31/12/2017 Other movements Increase Decreases Exchange rate
differences Closing balance
31/12/2018 Hotels 54,134,839,138 - - - 46,557,539,357 100,692,378,495 Overseas properties 13,316,705,054 - - - 9,849,530,020 23,166,235,074 Other properties 21,197,338,967 - - (190,391,964) 18,187,560,225 39,194,507,228 Real Estate investment in progress 96,358,617,442 - 246,676,587 (23,047,320) 82,921,454,668 179,503,701,377
185,007,500,601 - 246,676,587 (213,439,284) 157,516,084,270 342,556,822,174

SOCIEDADE NACIONAL DE COMBUSTÍVEIS DE ANGOLA E.P.
47
7.1.1.2 Movements, during the year, in accumulated depreciation In 2018, the movements occurred in Accumulated depreciation of real estate investments were as follows:
Items Opening balance 31/12/2017 Other movements Increases Decreases Exchange rate differences Closing balance
31/12/2018 Hotels (5,857,014,436) - (636,661,647) - (5,121,931,289) (11,615,607,372)
Overseas properties - (3,905,044,857) (819,068,420) - (5,335,342,337) (10,059,455,614)
Other properties (3,589,051,453) - (470,745,188) - (3,192,436,124) (7,252,232,765)
(9,446,065,889) (3,905,044,857) (1,926,475,255) - (13,649,709,750) (28,927,295,751)
7.1.1.3 Movements, during the year, in provisions In 2018, the movements occurred in provisions were as follows:
Opening balance 31/12/2017 Other movement Increases Decreases Exchange rate
differences Closing balance
31/12/2018
Hotels (34,742,941,205) - - - (29,879,942,040) (64,622,883,245) Overseas properties - - - - - - Other properties (4,053,364,040) - - - (3,486,011,212) (7,539,375,252) Real Estate investment in progress (12,748,794,795) - - - (10,964,335,095) (23,713,129,890)
(51,545,100,040) - - - (44,330,288,347) (95,875,388,387)
7.1.2 Energy Fund II & III e Gateway Fund
In 2018, the movements occurred in the Energy Fund II & III and Gateway Fund were as follows:
Items Movements in the year
Opening balance Gains / Losses Other movements Exchange rate differences Closing balance
Energy Fund II 893,371,774 (163,618,576) - 763,265,222 1,493,018,420 Energy Fund III 10,357,548,437 2,344,171,277 - 8,991,877,460 21,693,597,174 Gateway Fund 46,495,131,658 5,010,990,784 - 41,522,589,456 93,028,711,898
Amounts in AOA 57,746,051,869 7,191,543,485 - 51,277,732,138 116,215,327,492 Amounts in USD 346,305,236 28,391,943 - - 374,697,179
In 2018, gains in the amount of AOA 7,355,162 thousand were recognised under Gains on investments and financial assets and losses in the amount of AOA 163,619 thousand were recognised under Losses on investments and financial assets related to these funds (see note 31). 7.1.2.1 Energy Fund II & III
The table below details the accumulated movements occurred in investment funds since their incorporation:
Items Energy Fund II Energy Fund III 2018 Closing Balance 2017 Closing Balance
Original cost (invested capital) 37,510,548,841 115,669,589,135 153,180,137,976 82,353,622,435
Realised gain / losses 39,163,470,768 50,037,197,738 89,200,668,506 54,623,415,643
Distributions (Gross) (76,674,019,609) (155,488,032,338) (232,162,051,947) (124,717,956,917)
Unrealised gains / losses - 922,009,478 922,009,478 (7,635,495,906)
Fair value of investment - 11,140,764,013 11,140,764,013 4,623,585,255
Other contributions and assets associated to the fund 6,277,463,001 22,875,196,802 29,152,659,803 15,572,962,745
Management fees (4,784,444,581) (12,322,363,641) (17,106,808,222) (8,945,627,789)
Investment Value 1,493,018,420 21,693,597,174 23,186,615,594 11,250,920,211
The amount reported for the capital risk investments - Energy Fund II and Energy Fund III – represent their market fair value, according to the independent manager final reports, as at 31 December 2018. At the balance sheet date, Energy Fund II & III had investments in the entities Talen (FKA RJS Power Hld. or Jade Partners) and Targe Energy, LLC.

SOCIEDADE NACIONAL DE COMBUSTÍVEIS DE ANGOLA E.P.
48
The following table details the investment commitments of Songangol E.P. with the Fund Management of Energy Fund II and Energy Fund III:
Description Energy Fund II Energy Fund III % held 9.94% 10,45%
USD AOA USD AOA Value/Commitment 100,000,000 31,015,800,000 397,000,000 123,132,726,000 Current investments 120,940,130 37,510,548,841 372,937,628 115,669,589,135
Revocable distributions 25,039,053 7,766,062,600 31,487,833 9,766,203,308 Remaining commitment 4,098,923 1,271,313,759 55,550,205 17,229,340,173
7.1.2.2 Gateway Fund
The table below details the position of this investment fund:
Items 2018 2017
USD AOA USD AOA
Investment portfolio 210,492,534 65,285,943,360 155,714,469 25,965,231,991 Balance in Liquidity Management 89,447,213 27,742,768,538 123,118,577 20,529,899,667 Fair value of investment 299,939,747 93,028,711,898 278,833,046 46,495,131,658
The reported value for venture capital investment Gateway Fund with investment commitment in the initial amount of AOA 77,539,500 thousand (USD 250,000 thousand) represents its fair value according to the independent fund manager report as at 31 December 2018 and corresponds mainly to investments associated to companies in Africa and Asia and to the balance in the liquidity management portfolio. The table below details the accumulated movements occurred in the investment portfolio since its incorporation:
Items 2018
USD AOA Invested capital 210,775,783 65,373,795,304 Accumulated portfolio gains/ (losses) 46,919,010 14,552,306,304 Distributions (43,434,407) (13,471,528,806) Management fees (10,971,463) (3,402,887,021) Other income and expenses related to the portfolio 7,203,611 2,234,257,579 Investment value 210,492,534 65,285,943,360
The following table details the movements occurred in Gateway Fund during the period:
Items Liquidity Management Portfolio Investment Portfolio
USD AOA USD AOA Opening balance 123,118,577 20,529,899,667 155,714,469 25,965,231,991 Investment (contributions) (60,564,854) (18,784,673,987) 60,564,854 18,784,673,987 Management fees - - (2,843,447) (881,917,835) Portfolio gains/ (losses) 3,274,722 1,015,681,226 20,675,426 6,412,648,777 Divestment / Distributions 23,618,768 7,325,549,845 (23,618,768) ((7,325,549,845) Foreign Exchange adjustments - 17,656,311,787 - 22,330,856,285 Closing balance 89,447,213 27,742,768,538 210,492,534 65,285,943,360
The amounts expressed in AOA for investment funds correspond to USD amounts converted at the closing exchange rate at 31 December 2018.

SOCIEDADE NACIONAL DE COMBUSTÍVEIS DE ANGOLA E.P.
49
8. Inventories
8.1 Detail by nature
As at 31 December 2018, Inventories are analysed as follows:
Items 2018 Gross Amount 2018 Accumulated Provisions 2018 Net Amount 2017 Net Amount Raw materials, subsidiaries and consumables 38,814,158,321 (12,704,012,350) 26,110,145,971 19,612,596,341 Product and work in progress 101,878,979,394 (18,312,476,731) 83,566,502,663 44,885,614,008 Finished and intermediate goods 4,236,906,719 (158,699,425) 4,078,207,294 6,121,550,195 Goods 116,628,521,564 (27,127,191,588) 89,501,329,976 52,882,788,269 Raw materials, good and materials in transit 848,130,417 - 848,130,417 2,738,171,643
262,406,696,415 (58,302,380,094) 204,104,316,321 126,240,720,456
The caption Raw Materials, subsidiaries and consumables represents mainly the materials supporting oil operations (not including crude oil), stored in the company’s onshore and offshore logistics bases, as well as the crude oil stock for production of refined products in Refinaria de Luanda.
Materials are valued at its purchase price and subsequently deducted from the respective provisions for value losses. The value presented is net of cutback in the amount of AOA 17,753,576 thousand, corresponding to the value of the materials under the control of Sonangol P&P as operator, but already allocated to the contracting groups.
The caption Products and work in progress essentially includes land for which housing projects and condominium under construction are planned by the Group’s real estate company, in the amount of AOA 101,731,397 thousand, and the variation is justified by the exchange rate difference in the period.
Goods mainly include the stock of refined oil products in the downstream segment and crude oil being recorded at the lower of their acquisition cost and their net realisable value.
8.2 Movements, during the year, in provisions
Items 2017 Other movements Increases Decreases Exchange rate
differences 2018
Raw materials, subsidiaries and consumables (7,177,159,298) - - 136,825,291 (5,663,678,343) (12,704,012,350) Products and work in progress - (9,845,263,325) - - (8,467,213,406) (18,312,476,731) Finished and intermediate goods (181,214,855) - - 22,515,430 - (158,699,425) Goods (6,929,540,881) (2,851,608,999) (17,077,409,097) 6,851,321,741 (7,119,954,352) (27,127,191,588)
(14,287,915,034) (12,696,872,324) (17,077,409,097) 7,010,662,462 (21,250,846,101) (58,302,380,094)
The provision for inventories recorded in the period for goods relate mainly to the downstream segment since the net realisable amount of certain products is lower than their respective acquisition cost, due to the fact that the selling price of these products did not follow the large increase in importation costs.
The decreases include write-offs in the amount of AOA 6,390,955 thousand referring to the write-off of assets and the related provisions recorded in the financial statements of Mercury Serviço de Telecomunicações, SA (MS Telcom) subsidiary.
Other movements include the allocation of provisions recorded in prior periods to the caption Inventories provisions and that were previously recorded as a deduction from the gross amount, thus not having any impact on the results of the period.

SOCIEDADE NACIONAL DE COMBUSTÍVEIS DE ANGOLA E.P.
50
9. Other non-current assets and accounts receivable
9.1. Detail by nature
As at 31 December 2018, Other non-current assets and accounts receivable are detailed as follows:
Items Current Non-current
2018 2017 2018 2017 Clients 397,187,316,706 205,916,312,053 36,262,618,711 21,740,870,521 Suppliers – debt balances 31,673,539,292 6,173,990,086 - - State and Public entities 2,965,542,815 3,399,467,597 - - State and Public entities (PNUH - Centralities) 226,685,041,301 130,209,218,927 299,381,494,521 282,827,039,063 Subsidiaries and associates 36,714,848,092 19,685,805,285 58,999,538,439 54,392,493,075 Personnel 2,235,243,380 2,462,621,731 - - Concessionaire Rights - Assets 365,464,539,835 232,793,159,247 - - Transactions as Concessionaire 1,424,525,923,859 667,824,753,952 - - Receivables – Mining activities 28,056,085,146 135,295,853,721 - - Working capital 33,892,851,351 - - - Receivables - Underlift 316,435,379,711 238,223,804,130 - - Receivables – Sales price differential - - 251,011,007,349 - Other receivables 62,233,574,028 71,488,060,811 63,580,560,240 29,353,285,617
2,928,069,885,516 1,713,473,047,540 709,235,219,260 388,313,688,276
Trade receivables are mainly related with foreign customers of crude oil and natural gas. This balance also includes AOA 25,223,762 thousand relating to the accounts receivable from China Sonangol International which were fully provisioned since 2015, but whose provision was reverted in 2018 against non-operating results (see Note 33), as a result of the agreement in progress with this entity, the Group considers that the prospects of receipt are certain. The balance of non-current trade receivables is mainly related to sales of real estate assets in the non-core segment. The caption Receivables – Underlift refers to the settlement of withdrawal rights due by the contractor groups within the perspective of the entity as a partner in the blocks in which the Group holds participating interests and as a National Concessionaire. As a partner entity of the blocks and as National Concessionaire the amount of underlift is AOA 68,091,186 thousand and AOA 248,344,193 thousand, respectively. The caption PNUH refers to the Angolan state debt related with the transfer of houses under the National Urbanism and Housing Program (Programa Nacional de Urbanismo e Habitação) to EMOGESTIM, which occurred in 2014. The reimbursement of this expense is deducted from the revenue of the Concessionaire disclosed in Note 9.5.1. In 2018 the reimbursement amounted to AOA 200,003,991 thousand, with the remaining variation in the item resulting from the exchange rate adjustment of the amount receivable denominated in USD in the amount of AOA 313,034,269 thousand. The caption Working capital represents the Group's share in the net position of the working capital of the non-operated Blocks. The caption Receivables – Sales price differential is related with the amount of AOA 251,011,007 to be recovered by Sonangol Group as a result of the recognition of income pursuant number 3 of article 3 of Executive Decree No. 77/16, of 25 February in the Downstream segment, as disclosed in Note 22. 9.2 Subsidiaries and associates
As at 31 December 2018, the amounts receivable from subsidiaries and associates valued at cost less impairment losses (where applicable), are detailed as follows:

SOCIEDADE NACIONAL DE COMBUSTÍVEIS DE ANGOLA E.P.
51
9.2.1 Subsidiaries and associates (non-current)
Items 2018 Gross Amount 2018 Accumulated Provisions 2018 Net Amount 2017 Net Amount Puaça 19,780,707,207 - 19,780,707,207 10,504,217,845 Genius 56,734,568,864 (56,734,568,864) - - Embal 353,645,667 (353,645,667) - - Lobinave 2,176,461,775 (2,176,461,775) - - Biocom 22,091,177,915 - 22,091,177,915 13,659,002,656 Bauxite 155,079,000 (155,079,000) - - Paenal 15,859,929,330 (15,859,929,330) - 8,526,249,900 Luanda Waterfront 5,666,586,660 - 5,666,586,660 3,046,339,800 Diranis 13,768,392,960 (4,565,744,076) 9,202,648,884 335,044 Angoflex 429,396,971 (429,396,971) - - Sonangol Hidrocarbonetos Brasil, Ltda 215,415,111,368 (215,415,111,368) - - Sonangol Hidrocarbonetos USA, Ltd. 38,265,863,281 (38,265,863,281) - - Esperaza Holding B.V. 2,224,344,974 - 2,224,344,974 1,168,225,062 Sonangol São Tomé 62,031,600 (37,916,676) 24,114,924 21,636,917 Iraque - - - 17,466,485,851 Other 9,957,875 - 9,957,875 - 392,993,255,447 (333,993,717,008) 58,999,538,439 54,392,493,075
Intercompany loans to each of the above entities are subject to the respective contracts. These intercompany loans are investments made by the Group in investees and the payment terms are deferred in accordance with the respective contracts.
In 2018, the Group started a set of proceedings with the indebted entities, in order to ensure the recovery of debts. The strategy followed has proved to be very favourable, as the repayments of the loaned capital are being made.
9.2.2 Subsidiaries and associates (current)
Items 2018 Gross Amount 2018 Accumulated Provisions 2018 Net Amount 2017 Net Amount
ESSA 52,881,264 - 52,881,264 1,215,769 OPS Angola 3,538,998,158 (878,880,554) 2,660,117,604 3,935,429,982 Sonangol Cabo Verde, SA - - - 167,621,219 Mota Engil Angola 650,247,050 - 650,247,050 650,247,050 SONAID 9,153,268,993 - 9,153,268,993 4,806,245,099 Paenal 887,893,065 - 887,893,065 438,119,496 Porto STP - - - 402,961,132 Aeroporto STP - - - 874,896,074 Sonadiets Sevices 557,953,703 - 557,953,703 1,331,811,870 Sonamet/Sonacergy 1,661,039,589 - 1,661,039,589 942,545,376 Cajueiro 5,626,947,588 - 5,626,947,588 - Kwanda 3,378,343,772 - 3,378,343,772 1,144,653,437 Petromar 186,094,800 - 186,094,800 897,339,511 ACS 212,876,022 - 212,876,022 699,958,764 Net One 3,058,947,843 (2,943,886,058) 115,061,785 - Angola Cables 730,341,927 - 730,341,927 - Angola LNG 7,585,238,616 - 7,585,238,616 - Paz-Flor 2,591,572,988 - 2,591,572,988 2,127,015,684 SHI Brasil 664,969,326 - 664,969,326 - Puma Energy - - - 1,100,543,437 Other - - - 165,201,385 40,537,614,704 (3,822,766,612) 36,714,848,092 19,685,805,285
9.3 Other receivables
The detail of other receivables is analysed as follows:
9.3.1 Other receivables (non-current) Items 2018 Gross Amount 2018 Accumulated
Provisions 2018 Net Amount 2017 Net Amount
Cohydro (Nessergy) 57,870,388,600 - 57,870,388,600 29,188,588,599 Monumental 348,927,750 (348,927,750) - - Space Group 460,584,630 (460,584,630) - - Force Petroleum Angola 56,469,429,847 (55,653,622,568) 815,807,279 162,657,992 Geni 4,894,364,361 - 4,894,364,361 - Lektron 27,506,795,410 (27,506,795,410) - - Others - - - 2,039,026
147,550,490,598 (83,969,930,358) 63,580,560,240 29,353,285,617
On 25 October 2012, Sonangol EP agreed with Nessergy Ltd. to purchase its holding in the Common Interest Zone (CIZ) in the Democratic Republic of Congo (95%) for later transfer to Cohydro (NOC Congolese) for the amount of USD 200 million.
The "Preliminary Commercial Agreement" signed between Sonangol EP and Cohydro, dated 27 January 2015, establishes that the amount due to Sonangol EP shall be refunded by Cohydro through Profit Oil obtained as concessionaire in CIZ to be defined in the PSA to be concluded between both parties.

SOCIEDADE NACIONAL DE COMBUSTÍVEIS DE ANGOLA E.P.
52
Sonangol’s Board of Directors expects that negotiations will continue with RDC– Cohydro to define a PSA for the CIZ, with profitability and return ensured for both parties.
Given the nature of part of the loans granted, the terms and conditions ensuring the fair and effective return of funds to the Group are, at the reporting date, being analysed by the appropriate State entities, under the scope of oil operations.
9.3.2 Other receivables (current)
In accordance with the ordinance regarding the contractual obligations of Sonangol EP employees towards the Group, the variance in the balance Social Fund refers mainly to the recognition of provisions for doubtful debts against Retained Earnings (Note 13). This debt is related to the reduction of trade receivables resulting from the sale of residential housing through the subsidiary SONIP. 9.4 Concessionaire Right - Assets
Assets identified as Concessionaire rights – Assets, refer to the number of barrels corresponding to 5% in 2018 (remaining rights) attributable to Sonangol EP acting as National Concessionaire and include the share of profit oil attributable to the Angolan State under the PSAs, corresponding to 95%.
9.5 Transactions as National Concessionaire
As at 31 December 2018, the breakdown of balances associated with transactions as a National Concessionaire was as follows:
Items 2018 2017 Concessionaire’s revenue 1,424,525,923,859 667,824,753,952 1,424,525,923,859 667,824,753,952
9.5.1 Concessionaire’s revenue
In 2018, the following movements occurred in the deliveries of the National Concessionaire:
Items
General outline of the movements with the Concessionaire
2017
Amounts payable Amounts receivable Settled amounts Offsets Other
adjustments 2018
Concessionaire’s revenue (364,715,882,492) (2,280,973,551,105) 86,118,690,993 377,934,960,750 1,834,126,061,076 - (347.509.720.778) Receivables from OGE customers 490,313,525,056 - 182,283,941,712 - - (4,599,276,580) 667.998.190.188 Subventions 138,644,087,789 - 164,487,673,545 - - - 303.131.761.334 ZEE Industries Settlement 10,446,117,920 - 5,998,479,552 - - - 16.444.597.472 PNUH settlement (capital and interest) 311,864,098,390 - 229,931,063,331 - - - 541.795.161.721 Payments to State entities 96,997,496,601 - - - - - 96.997.496.601 Deliveries to Refinaria de Luanda - - 73,662,899,841 - - - 73.662.899.841 ENCO – Fuel supply - - 51,351,481,030 - - - 51.351.481.030 Other movements (15,724,689,312) - 36,378,745,762 - - - 20.654.056.450
Total 667,824,753,952 (2,280,973,551,105) 830,212,975,766 377,934,960,750 1,834,126,061,076 (4,599,276,580) 1.424.525.923.859
Receivables from OGE customers refers to the sale of goods and the provision of services by the various Group companies to state entities in the period from 2014 to 2018, namely the supply of oil products, air services, telecommunications services, medical services among others. Subventions includes the 2015, 2016 and 2017 unpaid amounts as at 31 December 2018, and also the 2018 subventions amounting to AOA 164,487,674 thousand. This balance will be gradually settled by the Angolan State. The amount of AOA 73,662,900 thousand corresponds to the selling price and exchange rate differentials to be received from the State as a result of the delivery of crude oil owned by the group to Refinaria de Luanda, in accordance with Note 2.3.q).
Items 2018 2017
Social Fund 1,848,373,778 24,114,756,727 Social Fund – Advanced payment 4,248,768,100 4,210,758,100 Exem África 26,475,291,992 13,904,812,487 Pension Fund 9,003,728,333 4,827,266,989 Receivables from Real Estate activities 8,248,560,330 7,757,392,917 Other 12,408,851,495 16,673,073,591 62,233,574,028 71,488,060,811
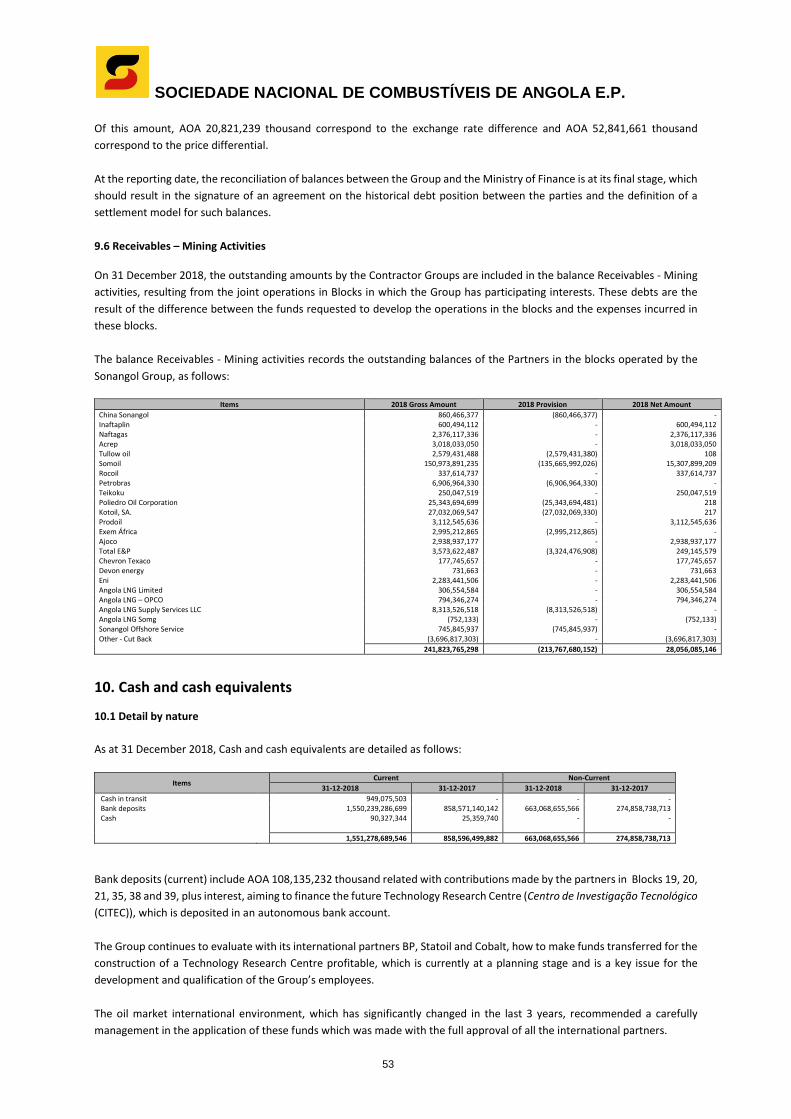
SOCIEDADE NACIONAL DE COMBUSTÍVEIS DE ANGOLA E.P.
53
Of this amount, AOA 20,821,239 thousand correspond to the exchange rate difference and AOA 52,841,661 thousand correspond to the price differential. At the reporting date, the reconciliation of balances between the Group and the Ministry of Finance is at its final stage, which should result in the signature of an agreement on the historical debt position between the parties and the definition of a settlement model for such balances. 9.6 Receivables – Mining Activities On 31 December 2018, the outstanding amounts by the Contractor Groups are included in the balance Receivables - Mining activities, resulting from the joint operations in Blocks in which the Group has participating interests. These debts are the result of the difference between the funds requested to develop the operations in the blocks and the expenses incurred in these blocks. The balance Receivables - Mining activities records the outstanding balances of the Partners in the blocks operated by the Sonangol Group, as follows:
Items 2018 Gross Amount 2018 Provision 2018 Net Amount China Sonangol 860,466,377 (860,466,377) - Inaftaplin 600,494,112 - 600,494,112 Naftagas 2,376,117,336 - 2,376,117,336 Acrep 3,018,033,050 - 3,018,033,050 Tullow oil 2,579,431,488 (2,579,431,380) 108 Somoil 150,973,891,235 (135,665,992,026) 15,307,899,209 Rocoil 337,614,737 - 337,614,737 Petrobras 6,906,964,330 (6,906,964,330) - Teikoku 250,047,519 - 250,047,519 Poliedro Oil Corporation 25,343,694,699 (25,343,694,481) 218 Kotoil, SA. 27,032,069,547 (27,032,069,330) 217 Prodoil 3,112,545,636 - 3,112,545,636 Exem África 2,995,212,865 (2,995,212,865) - Ajoco 2,938,937,177 - 2,938,937,177 Total E&P 3,573,622,487 (3,324,476,908) 249,145,579 Chevron Texaco 177,745,657 - 177,745,657 Devon energy 731,663 - 731,663 Eni 2,283,441,506 - 2,283,441,506 Angola LNG Limited 306,554,584 - 306,554,584 Angola LNG – OPCO 794,346,274 - 794,346,274 Angola LNG Supply Services LLC 8,313,526,518 (8,313,526,518) - Angola LNG Somg (752,133) - (752,133) Sonangol Offshore Service 745,845,937 (745,845,937) - Other - Cut Back (3,696,817,303) - (3,696,817,303) 241,823,765,298 (213,767,680,152) 28,056,085,146
10. Cash and cash equivalents
10.1 Detail by nature
As at 31 December 2018, Cash and cash equivalents are detailed as follows:
Items Current Non-Current
31-12-2018 31-12-2017 31-12-2018 31-12-2017 Cash in transit 949,075,503 - - - Bank deposits 1,550,239,286,699 858,571,140,142 663,068,655,566 274,858,738,713 Cash 90,327,344 25,359,740 - - 1,551,278,689,546 858,596,499,882 663,068,655,566 274,858,738,713
Bank deposits (current) include AOA 108,135,232 thousand related with contributions made by the partners in Blocks 19, 20, 21, 35, 38 and 39, plus interest, aiming to finance the future Technology Research Centre (Centro de Investigação Tecnológico (CITEC)), which is deposited in an autonomous bank account. The Group continues to evaluate with its international partners BP, Statoil and Cobalt, how to make funds transferred for the construction of a Technology Research Centre profitable, which is currently at a planning stage and is a key issue for the development and qualification of the Group’s employees. The oil market international environment, which has significantly changed in the last 3 years, recommended a carefully management in the application of these funds which was made with the full approval of all the international partners.

SOCIEDADE NACIONAL DE COMBUSTÍVEIS DE ANGOLA E.P.
54
Bank deposits (non-current) include AOA 663,068,656 thousand deposited in escrow accounts (accounts with movements restricted to authorization)) owned by Sonangol EP which reflect the contributions made by the Contractor Groups of blocks 15 and 17 to cover future decommissioning costs.
11. Other current assets
As at 31 December 2018, Other current assets are analysed as follows:
Items 2018 2017
Accrued income: Refined products 10,118,488,195 2,182,502,857 Others 4,051,410,873 4,162,425,120 Crude oil 17,073,203,580 - 31,243,102,648 6,344,927,977 Deferred costs: Docking and freight 773,537,333 101,295,583 Other 2,035,546,468 851,864,414 2,809,083,801 953,159,997 34,052,186,449 7,298,087,974
The caption Accrued income: Crude oil in 2018 essentially includes the accrued income from sales of crude oil occurred until 31 December 2018 of Blocks 32 and 3/05 that will be invoiced at the beginning of 2019.
12. Share capital and supplementary capital contributions Sonangol E.P. is fully owned by the Angolan State. As at 31 December 2018, the Company's share capital was fully subscribed and paid up in the amount of AOA 1,000,000,000 thousand. The table below shows the movements of Share capital and Supplementary capital contributions in 2018:
Items 2017 2018 Share capital 1,000,000,000,000 1,000,000,000,000 Supplementary capital contributions 1,846,949,307,988 1,846,949,307,988 2,846,949,307,988 2,846,949,307,988

SOCIEDADE NACIONAL DE COMBUSTÍVEIS DE ANGOLA E.P.
55
13. Reserves and retained earnings
As of 31 December 2017, Reserves and retained earnings are analysed as follows:
Items 2017 Net profit application 2018 Actuarial gains
and losses Prior year
adjustments Other movements 2018
Legal reserves 23,033,763,387 - - - - 9,299,415 23,043,062,802 Other reserves 204,086,471,831 - - 82,729,403,760 - (13,456,510,422) 273,359,365,169 Evaluation fund 178,850,413,504 - - - - - 178,850,413,504 Investment fund 940,550,351,331 - - - - - 940,550,351,331 Retained earnings (2,062,527,331,053) 27,365,021,947 - - (183,424,441,631) 52,763,719,465 (2,165,823,031,272) (716,006,331,000) 27,365,021,947 - 82,729,403,760 (183,424,441,631) 39,316,508,458 (750,019,838,466) Foreign Exchange translation adjustments (financial statements conversion)
1,067,706,825,505 - - -
- 2,369,291,377,361 3,436,998,202,866
Net profit 27,365,021,947 (27,365,021,947)
79,976,761,360 - -
- 79,976,761,360
1,095,071,847,452 (27,365,021,947) 79,976,761,360 - - 2,369,291,377,361 3,516,974,964,226
379,065,516,452 - 79,976,761,360 82,729,403,760 (183,424,441,631) 2,408,607,885,819 2,766,955,125,760
In accordance with the Presidential Law No. 42/10, of 10 May (that establishes the rules of profit distribution), the Company´s net profit should be distributed as follows:
• 10% to legal reserve, whose cumulative value should not exceed 2% of the statutory capital; • At least 10% for the constitution of the fund to evaluate the potential for extraction of hydrocarbon resources; • At least 5% to fund other investments; • Up to 5% to the social fund; • Distribution of individual incentives to employees and members of the governing body, as profit participation within
the limits established by the applicable legislation; • Other voluntary funds that are approved by the Board of Directors and approved by the appropriate State agencies.
The net profit for the year 2017 was fully applied to cover the negative retained earnings of previous years. The purpose of this allocation is the need to ensure the sustainability of the company, the continuity of the implementation of growth strategy and solidity. Actuarial gains and losses reflects the movements arising from the Group's post-retirement benefit plans (pensions and health care) as well from the curtailment (see Note 17). The very significant variation in the caption Foreign Exchange translation adjustments reflects essentially the sharp devaluation of the exchange rate AOA against the USD in the period and its impact on the translation of the financial statements of the subsidiaries whose functional currency is the USD. In order to standardise the Group’s financial reporting with the generally accepted accounting principles and in accordance with the best practices, defined by national and international standards, some adjustments were deemed as fundamental errors or resulting from changes in accounting policies and therefore recognised under Other reserves or Retained Earnings, as applicable. Capitalisation of unrealised exchange differences in decommissioning liabilities As disclosed in Note 2.4. Changes in accounting policies, the effects of the retrospective application of the Policy of recognition of unrealized exchange differences of the decommissioning liabilities for the years 2015, 2016 and 2017 were recognised in Retained Earnings (in the column Other movements) and amounted to AOA 39,394,257 thousand.

SOCIEDADE NACIONAL DE COMBUSTÍVEIS DE ANGOLA E.P.
56
Correction of Fundamental Errors The table below details the movements occurred in Retained earnings in 2018 relating to prior year adjustments, deemed as fundamental errors:
Description AOA
Creditors and debtors of mining activity 82.724.619.524 Tax and customs charges 46.638.338.661 Impairment of accounts receivable – Social fund 23.018.703.118 Impairment of non-core assets 35.162.273.007 Settlement of the investment in Sonangol P&P Iraque (8.011.366.292) Other movements 3.891.873.613 Total 183.424.441.631
Creditors and Debtors of mining activity In 2018, the Group, through Sonangol P&P, assessed the collectability and recoverability of balances with significant ageing of debtors and creditors of mining activity disclosed in Notes 9.6 and 19.4 respectively, and made adjustments in the amount of AOA 82,724,620 thousand against Retained Earnings. To the extent that the facts and support to the collectability, which determined these adjustments occurred in previous years, they were considered as a fundamental error. Tax and customs charges This caption includes the amount of AOA 29,588,210 thousand resulting from the increase of tax contingencies related to prior years in the Upstream segment and the amount of AOA 17,050,129 thousand related to settlement of customs notes from 2011 to 2017 in the scope of the reconciliation process that is in progress with Administração Geral Tributária (Local Tax Authority) in the "Downstream" segment. Impairment of accounts receivable – social fund As disclosed in Note 9.3.2 Other debtors (current), the group recognised impairment for the amount receivable from the social fund in the amount of AOA 23,018,703 thousands, related to the real estate business. Since these assets already presented impairment triggers in prior years, the impairment losses were recognised in retained earnings. Impairment of non-core assets In 2018, the Group completed the technical, operational and financial evaluation of non-core assets, which resulted in the calculation of exceptional amortisation and impairments of the telecommunication business amounting to AOA 19,346,652 thousand for obsolete basic equipment, unused or with a lower use of the installed capacity, and in the aviation business, namely in the fleet of Super Puma aircrafts (see also Note 38. Subsequent events) in the amount of AOA 15,815,621 thousand. As these assets already presented impairment triggers in previous years, these amounts were recognised in retained earnings. Settlement of the investment in Sonangol P&P Iraque As disclosed in Note 5A of these financial statements, the Group revaluated all the corporate documentation associated with the assets in Iraq, and adjusted the assets and liabilities relating to the activity in Iraq in Investments in other companies and Retained Earnings. The impact of this adjustment in Retained earnings amounted to AOA 8,011,366 thousand.
15. Loans
The position of the Group's loans in the short, medium and long term, as at 31 December 2018, is detailed as follows:
Items Current Non-current
2018 2017 2018 2017
International bank loans
412,779,795,245 205,246,243,620 971,075,480,862
610,597,380,607 Bank overdrafts - 16,262,566,000 - - 412,779,795,245 221,508,809,620 971,075,480,862 610,597,380,607
During 2017, the Group, through Sonangol E.P., resorted to a bank overdraft with national banks in the amount of AOA 16,262,566 thousand to meet current treasury requirements with maturity of 12 months. This debt was fully settled during 2018.

SOCIEDADE NACIONAL DE COMBUSTÍVEIS DE ANGOLA E.P.
57
15.1 International bank loans Current and non-current Group's loans from International banks, as at 31 December 2018, are detailed as follows:
Items Acquisition year 2017 Increases Reimbursements Exchange rate
differences 2018 Current Non-current Maturity (Months)
International bank loans: SNL Finance $1Bi (SCB-KS) 2011 56,972,575,361 - (25,673,099,990) 43,655,375,306 74,954,850,677 31,015,800,000 43,939,050,677 29 SNL Finance $1Bi (CDB) 2012 50,024,700,367 - (61,158,600,000) 11,133,899,633 - - - 0 SNL Finance $2Bi (SCB) 2014 186,758,880,000 - (84,870,480,000) 146,238,000,000 248,126,400,000,00 99,250,560,000 148,875,840,000 30 SNL Finance $1,5Bi (SCB) 2014 173,998,931,019 - (64,305,391,300) 133,038,760,761 242,732,300,480 80,910,735,245 161,821,565,235 34 SNL Finance $2Bi (CDB) 2014 233,448,599,980 - (51,346,200,010) 190,087,199,980 372,189,599,950 62,031,600,000 310,157,999,950 72 SNL Finance $1Bi (SCB) 2015 114,639,937,500 - (66,305,062,500) 87,359,250,000 135,694,125,000 77,539,500,000 58,154,625,000 20 SNL Finance $1,5 Bn (SCB) 2018 - 310,693,000,000 - (535,000,000) 310,158,000,000 62,031,600,000 248,126,400,000 60
Total 815,843,624,227 310,693,000,000 (353,658,833,800) 610,977,485,680 1,383,855,276,107 412,779,795,245 971,075,480,862
In December 2018, Sonangol E.P. contracted a new loan with Standard Chartered Bank of USD 1,500 million, with maturity scheduled for December 2023. Of the total loan amount, USD 1,000 million was received in December 2018 and the remaining amount was received in February 2019. In 2019, a new loan was contracted with Standard Chartered Bank and K-SURE in the amount of USD 1,000 million, which was received in full in March 2019. The aforementioned loans have a corporate guarantee, which requires Sonangol, E.P. to comply with the following debt covenants:
(a) The amount of the “Net equity” should never fall below AOA 1,200,000,000,000.00; (b) The “EBITDA/ Net Debt” ratio should not be less than 0.5; (c) The “EBITDA / Debt Service” ratio should not be less than 1.3; (d) The “Net Debt/EBITDA” ratio should not exceed 2.5; (e) “Gearing Ratio” should not exceed 100%.
The National Housing and Urban Development Program (Programa Nacional de Urbanismo e Habitação (PNUH)) is a Government initiative, partially implemented by the Group using the financing obtained from international banks. With regard to the investment made within PNUH, the State recognises the total outstanding amount and its repayment takes place on a monthly basis by offsetting through Revenue of the Concessionaire, under the terms of the repayment plan agreed between the parties. This is a relevant issue regarding the technical appraisal of the Group's financial covenants, as it is the understanding of the Sonangol’s Board of Directors, that a certain inconsistency weighs on these ratios in the calculation parameters used. This is due to the fact that the value of the debt contracted by Sonangol Finance is being fully considered for the calculation of “DEBT” and “NET DEBT”. However, the State reimbursements on investments made in PNUH are not being reflected on the “EBITDA” calculation. Given the above and the relevance of such finding in 2016, Sonangol submitted a proposal for correction of the contractual definition of Sonangol EP's "EBITDA" with the purpose of including in its calculation the PNUH Reimbursements, which received the approval of some of the international partners. Early repayment of bank loans: In January 2018, the Group completed the restructuring process of the financial debt, which resulted in the early termination of SNL Finance CDB $1,0Bn debt in the amount of AOA 61,158,600 thousand, contracted in 2012. Financing conditions
The outstanding loans during 2018 are indexed to Libor, plus an average spread of 3.5%. All contracts have as collateral the mandatory requirement to allocate monthly revenues at the rate of 125% of the debt service value to be performed in a certain period.

SOCIEDADE NACIONAL DE COMBUSTÍVEIS DE ANGOLA E.P.
58
17. Employee benefits As at 31 December 2018, the Group's provisions for post-employment benefits is detailed as follows:
Items 2018 2017
Sonangol Pension Plan 202,876,528,521 114,183,727,744 Sonangol Healthcare Plan 297,792,902,548 208,049,725,818 ENSA Pension Plan 15,634,107,125 8,462,510,151 516,303,538,194 330,695,963,713
17.1 Post-employment benefits
The liabilities related with post-employment benefits, by type of benefit, are as follows:
Sonangol Pension Plan Sonangol Healthcare Plan ENSA Pension Plan Total Balance as at 31 December 2017 Defined benefit obligation 114,183,727,744 208,049,725,818 13,575,825,062 335.809.278.624 Fair value of plan assets - - (5,113,314,911) (5.113.314.911) 114,183,727,744 208.049.725.818 8.462.510.151 330.695.963.713 Balance (receivable) / payable 114,183,727,744 208,049,725,818 8.462.510.151 330.695.963.713 Balance as at 31 December 2018 Defined benefit obligation 202,876,528,521 297,792,902,548 23,524,119,798 524,193,550,867 Fair value of plan assets - - (7,890,012,673) (7,890,012,673) 202,876,528,521 297.792.902.548 15.634.107.125 516.303.538.194 Balance (receivable) / payable 202.876.528.521 297,792,902,548 15,634,107,125 516,303,538,194
17.2 Type of benefits
Defined benefit plans The types of defined benefits plans are as follows:
Plan Type Beneficiaries Location
Sonangol Pension Plan ENSA Pension Plan
Defined benefit Defined benefit – fund set in ENSA
Retirees and pensioners from Sonangol Former employees with acquired rights Retirees and pensioners from ex-Fina
Angola Angola
Until the end of 2011, Group’s employees were covered by Sonangol’s Defined Benefit Plan, which was closed to new admissions with effect from 1 January 2012, and the active participants were transferred into a new Defined Contribution Plan. Therefore, the Sonangol Pension Plan retains responsibility for retirees and pensioners, including all employees who have retired or have ceased their labour contract between 1 January 2012 and 13 October 2017, date of legal implementation and approval of the defined contribution plan by the relevant authorities (Order No. 685/17 of the Ministry of Finance). The past service liabilities of active employees at the cut-off date (curtailment) will be financed by contributions that the subsidiaries included in the new plan will transfer to the Sonangol Pension Fund. This liability, updated as at 31 December 2018, is disclosed under Accounts payable (see Note 19). The Group is depositing in a bank account held by Sonangol EP the amounts of the contributions to the defined contribution plan and to the defined benefit plan. As at 31 December 2018, the balance of this bank account is of AOA 279,973,223 thousand (2017: AOA 136,599,217 thousand). Sonangol Healthcare Plan The existing Sonangol Healthcare Plan is as follows:
Plan Type Beneficiaries Location
Sonangol Healthcare Plan Defined benefit Retirees and close family members Angola
The post-employment health care plan of the Group corresponds to the constructive obligation related to the provision of medical assistance and medication to pensioners and their close family members within the Sonangol Healthcare Plan (as

SOCIEDADE NACIONAL DE COMBUSTÍVEIS DE ANGOLA E.P.
59
established in the Internal Standard for Medical Assistance and Medication Co-participation), provided mainly by the Group company, Clínica Girassol. The accounting and reporting of future liabilities with post-employment benefit plans is temporarily excluded from the General Accounting Plan, until the provisions of international accounting standards are subject to regulation. The Group acknowledges that accounting for liabilities arising from the application of international accounting standards is a fundamental step towards a true and fair view of its financial position and performance. Therefore, the Board of Directors decided on the recognition of future liabilities with past services costs associated with the Sonangol Group’s healthcare plan. This liability, although identified in previous years, was not recognised due to the unreliability in its valuation, a situation that was overcome in 2017, with a substantial improvement in the quality of the database. The initial recognition of this liability, as at 1 January 2017, was recognised against Retained earnings. Defined contribution plans The Defined contribution plan is as follows:
Plan Type Beneficiaries Location
Sonangol Pension Plan Defined contribution Sonangol employees
Sonangol retirees and pensioners Former employees with acquired rights
Angola
The defined contribution pension plan is based on contributions made by the participants (employees or members of the board of Sonangol E.P. and its subsidiaries). Every month, the Group carries out the withholding of the employees’ wages. The amount capitalised in the participant's accumulated account under this pension plan, is subject to positive or negative variation, as a result of the evolution of the investments made and of the financial market. Associates (subsidiaries) will not be liable, now or in the future, for the level of income generated or for the benefits provided under the plan. The financing method for the pension plan will be chosen by the associates and the vehicle will correspond to the defined risk profile at the associates’ discretion. 17.3 Movements of the liabilities with post-employment benefits The reconciliation between the opening and closing balances of the defined benefit obligation present value is as follows:
Sonangol Pension Plan Sonangol Healthcare Plan ENSA Pension Plan Total Defined benefit obligation as at 1 January 2018 114,183,727,744 208,049,725,818 13,575,825,062 335,809,278,624 Interest cost 6,169,814,553 11,599,097,492 743,539,022 18,512,451,067 Current service cost - 8,774,136,973 324,077,613 9,098,214,586 Benefits paid (19,300,851,063) (4,700,117,829) (1,621,016,167) (25,621,985,059) Actuarial gains and losses 1,826,275,908 (89,361,390,861) (1,154,660,462) (88,689,775,415) Exchange rate differences 99,997,561,379 163,431,450,955 11,656,354,730 275,085,367,064 Defined benefit obligation as at 31 December 2018 202,876,528,521 297,792,902,548 23,524,119,798 524,193,550,867
According to the 31 December 2018 actuarial study, the estimated payment of pension benefits in 2019 amounts to AOA 17,536,770 thousand relating to the Sonangol Plan, AOA 1,509,253 thousand relating to the ENSA Plan and AOA 6,693,671 thousand relating to the Sonangol Healthcare Plan.
Sonangol Pension Plan Sonangol Healthcare Plan ENSA Pension Plan Total
Defined benefit obligation as at 1 January 2017 97.421.350.369 - 12.834.968.031 110.256.318.400 Initial recognition of healthcare liability - 175.348.643.819 - 175.348.643.819 Interest cost 3.983.206.196 7.392.556.734 532.495.402 11.908.258.332 Current service cost - 4.875.169.530 223.115.461 5.098.284.991 Benefits paid (7.491.885.353) (2.684.105.387) (848.199.761) (11.024.190.501) Actuarial gains and losses 20.257.768.297 23.093.890.805 831.916.634 44.183.575.736 Exchange rate differences 13.288.235 23.570.318 1.529.295 38.387.847 Defined benefit obligation as at 31 December 2017 114.183.727.744 208.049.725.818 13.575.825.062 335.809.278.624

SOCIEDADE NACIONAL DE COMBUSTÍVEIS DE ANGOLA E.P.
60
The main actuarial assumptions used at the reporting date to determine the defined benefit obligation were as follows:
2018 2017 Financial assumptions for all plans (Sonangol, LGT & ENSA) Discount rate * 4.27% 3.70% Future salary growth 3.00% 3.00% Normal retirement age 60 60 Expected pension growth rate (only Sonangol plan) 1.00% 1.00% Healthcare costs growth rate 5.00% 5.00% Percentage of married (a) 90.00% 90.00% Age difference (a) Men 3 years older Men 3 years older Mortality table (adjusted to reflect the experience acquired) ANGV2020P ANGV2020P Turnover table Cost per medical act USD (USD / per household)
Crocker Sarason 6,031
Crocker Sarason 7,500
17.4 Fair value of plan assets
The reconciliation between the opening and closing balances of the assets’ fair value of the ENSA Pension Plan, the only one with an independent fund set-up, is as follows:
ENSA Pension Plan Defined benefit (funded)
Fair value of plan assets as at 1 January 2018 (5,113,314,911) Expected return on plan assets (267,965,064) Benefits paid 1,621,016,167 Actuarial gains and losses 267,965,064 Exchange rate differences (4,397,713,929) Fair value of plan assets as at 31 December 2018 (7,890,012,673)
ENSA Pension Plan
Defined benefit (funded)
Fair value of plan assets as at 1 January 2017 (5,950,702,886) Expected return on plan assets (239,893,083) Benefits paid 848,199,761 Actuarial gains and losses 229,759,853 Exchange rate differences (678,556)
Fair value of plan assets as at 31 December 2017 (5,113,314,911)
17.5 Actuarial gains and losses As mentioned in Note 2.3 u), the Group recognises all actuarial gains and losses in equity (reserves). Actuarial gains and losses in 2018 amounted to AOA 82,729,403 thousand, as disclosed in Note 13, which includes AOA 87,535,115 thousand relating to actuarial gains on the liabilities for past services of the Sonangol Pension and Healthcare Plans, AOA 886,695 thousand actuarial losses on ENSA’s pension plan assets, as described above, and AOA 5,692,407 thousand relating to actuarial losses arising from the movement of the curtailment liability (see Note 19). The actuarial gains recognised in 2018 are mainly from the downward revision of the actuarial assumption regarding the estimate of future medical costs with the medical plan, which resulted in an actuarial gain of AOA 75,231,298 thousand, and the upward revision of the financial assumption related to the discount rate of 3.7% in 2017 to 4.27% in 2018, which led into a gain in the liabilities of Sonangol's pension plan, ENSA pension plan and healthcare plan in the amounts of AOA 8,466,107 thousand, AOA 1,186,160 thousand and AOA 28,548,304 thousand, respectively.

SOCIEDADE NACIONAL DE COMBUSTÍVEIS DE ANGOLA E.P.
61
17.6 Sensitivity analysis
The tables below set out the results of the sensitivity analysis to the discount rate, pension growth rate, future salary growth of the Pension Plans and growth rate of healthcare costs.
AOA
4.27% 4.02% 4.52%
Sensitivity to discount rate Accounting scenario .- 25 p.b Var. .+ 25 p.b Var.
Pension Plan 202,876,528,521 207,231,798,173 2% 198,612,968,868 -2%
Healthcare Plan 297,792,902,548 312,125,871,249 5% 284,129,039,115 -5%
ENSA 23,524,119,798 24,133,490,749 3% 22,930,135,089 -3%
524,193,550,867 543,491,160,171 4% 505,672,143,072 -4%
1.00% 0.75% 1.25%
Sensitivity to the Pension’s growth rate Accounting scenario .- 25 p.b Var. . + 25 p.b Var.
Pension Plan 202,876,528,521 198,556,220,189 -2% 207,290,882,031 2%
ENSA 23,524,119,798 22,967,997,006 -2% 24,093,707,713 2%
226,400,648,319 221,524,217,195 -2% 231,384,589,744 2%
3.00% 2.75% 3.25%
Sensitivity to future salary growth rate Accounting scenario .- 25 p.b Var. .+ 25 p.b Var.
ENSA 23,524,119,605 23,450,815,312
0% 23,597,653,104
0%
23,524,119,605 23,450,815,312 0% 23,597,653,104 0%
5.00% 4.00% 6.00%
Sensitivity to the growth rate of healthcare costs Accounting scenario .- 100 p.b Var. .+ 100 p.b Var.
Healthcare Plan 297,792,902,548 248,660,486,493
-16% 356,740,923,740
20%
297,792,902,548 248,660,486,493 -16% 356,740,923,740 20%
Additionally, considering the mortality table SA 85-90 instead of the mortality table ANGV-2020P would give rise to an increase of 9% in the Sonangol Pension Plan liability, 10% in the ENSA Plan and 17% in the Healthcare Plan in the amount of AOA 18,489,264 thousand, AOA 2,317,388 thousand and AOA 51,533,952 thousand, respectively.
18. Provisions for other risks and charges 18.1 Detail of provisions for other risks and charges
The table below details the provisions for other risks and charges:
Items 2018 2017
Provisions for legal proceedings 37,901,189,033 2,240,610,760 Dismantling provisions - Sonangol as an investor 571,223,705,334 294,706,399,278 Abandonment Fund (Concessionaire) 1,465,452,280,690 701,693,556,783 Tax contingencies 538,559,712,106 435,643,630,851 Other provisions 28,100,172,311 27,767,737,769 2,641,237,059,474 1,462,051,935,441
18.2 Provisions for legal proceedings The amount referring to Provisions for legal proceedings is the best estimate of liabilities for litigation in which the Group is involved for which future financial outflows are probable and essentially includes the provision for the arbitration process with PT Venture where Sonangol Group, based on the assessment made by its legal advisors, recognised a provision in the amount of AOA 36,745,807 thousand, corresponding to the amounts directly attributable to Mercury - Serviço de Telecomunicações, S.A. (MS Telecom), referring to indemnification and legal costs, as detailed in Note 37.

SOCIEDADE NACIONAL DE COMBUSTÍVEIS DE ANGOLA E.P.
62
18.3 Dismantling provisions – Sonangol as an investor
The table below details the movements occurred in 2018 in dismantling provisions where Sonangol participates as an investor:
Items 2017 Exchange rate differences Increases Decreases Abandonment
interest 2018
Dismantling provisions - Sonangol as an investor 294,706,399,278 255,994,560,112 10,301,428,032 (20,520,083,453) 30,741,401,365 571,223,705,334
Total 294,706,399,278 255,994,560,112 10,301,428,032 (20,520,083,453) 30,741,401,365 571,223,705,334
The change in this caption is mainly related with the exchange rate variation in the period, with the review of estimates at the reporting date and with the recognition of the financial interest associated to the provision update. The main assumptions inherent to the calculation of the dismantling provision, as mentioned in Note 2.2.2 vi), are as follows:
• Discount rate: 4.94%; • Inflation rate: 2%; • Maturity: Concession licence expiration date; • Estimated expenses of the Contractor Group.
18.4 Abandonment fund (Concessionaire) The movement in this balance is detailed as follows:
Items 2017 Increases Decreases Exchange rate differences 2018
Provisions for the Abandonment Fund – Concessionaire 701,693,556,783 145,874,012,453 - 617,884,711,454 1,465,452,280,690
701,693,556,783 145,874,012,453 - 617,884,711,454 1,465,452,280,690
In 2018, the bank accounts held by Sonangol E.P. with a positive outstanding balance of AOA 1,152,672,482 thousand relating to the amounts funded by the different Contractor Groups to cover the abandonment costs.
The abandonment fund (Concessionaire) referred to above was set-up by the operators and transferred to the Group's custody, as concessionaire for hydrocarbons. These provisions are intended to cover future expenses with the closure of oil wells, removal of platforms and other facilities, when reserves have been exhausted. The main inflows during the year relate to the funding of the abandonment of blocks 15 and 17 operated by ESSO and Total EP, respectively. Additionally, there is a significant increase in the provision resulting from the sharp devaluation of the exchange rate of the AOA against the USD. 18.5 Tax contingencies This balance includes, among others, provisions to cover tax contingencies resulting from audits to recoverable costs of the blocks in which the Group holds participating interests. These contingencies result mainly from the non-compliance with the provisions of production-sharing agreements and association agreements. The amounts booked represent the best settlement estimate and may differ from the final amounts payable as a result of subsequent revisions. The process of reconciliation and negotiation of tax and customs procedures between the General Tax Authority (Administração Geral Tributária – AGT) and the Group is ongoing, and no recognition of additional contingencies is expected.

SOCIEDADE NACIONAL DE COMBUSTÍVEIS DE ANGOLA E.P.
63
18.6 Other provisions The period’s main inflows and outflows in the caption Other provisions include the settlement (disregard) of the responsibility with the Iraqi personnel training fund, which amounted to AOA 11,840,904 thousand as at 31 December 2017, since as resulting from the process disclosed in Note 5A, Sonangol Pesquisa & Produção Iraque is responsible for it, and the constitution of provisions in the period for Sonagás and Sonangol Distribuidora, which as at 31 December 2018 amounted to AOA 5,038,456 thousand and AOA 3,330,808 thousand, respectively. These provisions relate to the amounts claimed by the supplier Andrade Guiterrez following the termination of the Falcão contract, still under discussion, in the case of Sonagás, and the effect of the Executive Decree 4/18 for the reduction in the Jet A1 price, in the case of Sonangol Distribuidora.
19. Other non-current liabilities and accounts payable
19.1 Detail of other non-current liabilities and accounts payable
As at 31 December 2018, the detail of Other non-current liabilities and accounts payable was as follows:
Items Current Non-current
2018 2017 2018 2017 Suppliers - current 837,922,080,006 377,932,941,322 - - Transactions as National Concessionaire 161,624,143,203 186,262,266,908 - - Trade receivables – credit balances 8,594,025,864 1,224,721,834 - - State 416,127,833,894 224,217,220,777 1,988,371,867 1,987,294,000 Subsidiaries and associates 8,400,000 1,351,506,983 - - Personnel 1,673,191,945 1,073,411,111 - - Creditors – acquisition of assets 241,727,320 85,834,058 2,144,612,431 1,852,294,953 Creditors – Mining activities Working Capital
538,741,061,811 144,175,993,014
345,438,074,703 -
236,681,850,205 -
127,246,312,653 -
Creditors – Overlift 569,497,650,872 18,103,179,837 - - Pension Fund - Curtailment (Note 17) 210,500,565,319 110,378,000,258 - - Concessionaire Rights - Liability 78,530,950,548 425,326,526,699 Pension Fund - Withholdings 50,793,142,109 37,692,215,204 - - Other creditors 18,234,448,436 31,130,010,725 550,275,500 678,220,454 Mining Activity - Cut Back - Liability (36,471,690,345) (67,133,573,928) - - 3,000,193,523,996 1,693,082,336,491 241,365,110,003 131,764,122,060
The increase in Suppliers is essentially justified by the sharp depreciation of the AOA exchange rate against the USD and by the difficulties to access to foreign currency in the domestic market. The variation verified in the caption Working Capital is essentially explained by the change in the presentation format compared to the previous year, since as in 2017 this amount was presented as the net amount difference between the accounts receivable and accounts payable from Creditors – Mining activities. 19.2 Transactions as National Concessionaire
As at 31 December 2018, the detail of the balances associated with transactions as the National Concessionaire is as follows:
Items 2018 2017 Transaction as National Concessionaire Bonus (20,233,217,300) 45,654,321,935 Price Cap 82,072,328,936 82,072,328,936 CITEC 99,785,031,567 58,535,616,037 161,624,143,203 186,262,266,908
The captions Bonus and CITEC refer to the contributions defined in the production sharing agreements and delivered by the contractor groups to the national concessionaire, the latter acting on behalf of the Angolan State. 19.2.1 Price Cap
During 2018, there were no movements in Price Cap, as shown below:
Items 2017 Increases Decreases Other movements 2018
Price cap 82,072,328,936 - - - 82,072,328,936
82,072,328,936 - - - 82,072,328,936

SOCIEDADE NACIONAL DE COMBUSTÍVEIS DE ANGOLA E.P.
64
19.3 State
As at 31 December 2018 the detail of the State balances is as follows:
Items Current Non-current
2018 2017 2018 2017 State Corporate income tax 275,691,755,067 94,987,558,592 1,988,371,867 1,987,294,000 Production and consumption tax 305,650,414 1,739,190,835 - - Withholding taxes 47,280,734,210 30,241,694,691 - - Other taxes 92,849,694,203 97,248,776,659 - - 416,127,833,894 224,217,220,777 1,988,371,867 1,987,294,000
Other taxes includes several types of taxes due by the Group at the balance sheet date, namely capital gains tax, consumption tax, stamp duty and others.
19.4 Creditors – Mining Activities As at 31 December 2018, the amounts due from joint operations in blocks on which the Group holds participating interests are included in this caption. These debts result from the difference between the cash calls for the development of the block operations and the expense incurred in these blocks.
As at 31 December 2018, the detail of the creditors of Mining Activities is as follows:
Items Current Non-current
2018 2017 2018 2017 Inaftaplin 155,240,837 540,427,006 - - Ajoco 777,204,502 241,582,449 - - ENI 47,997,573,024 830,030,333 - - Chevron Texaco 2,930,288,796 10,831,026,885 - - Philips - 6,676,126,378 - - Total Fina ELF EP - JP Morg 375,405,593,536 158,838,430,608 - - Cobalt - 30,601,322,589 - - Cabgoc 60,853,837,270 78,366,118,188 - - Somoil 24,043,025,399 13,939,395,413 - - Bp amoco 21,352,839,997 35,467,954,352 - - Rocoil 1,121,467,739 - - - Vaalco 1,089,961,946 510,232,264 - - Norsk Hydro/Statoil Hydro 1,472,373,962 - - - China Sonangol Holding 398,829,347 - - - Devon energy 731,629 - - - Naftagas 46,701,666 43,105,283 - - Repsol 802,792,841 - - - Petrobras 15,639,097 2,295,982,655 236,681,850,205 127,246,312,653 Soco 276,960,223 - - - Other - 6,256,340,300 - - 538,741,061,811 345,438,074,703 236,681,850,205 127,246,312,653
19.5 Pension Fund
The Pension Fund – Curtailment relates to the amount that the Group has to deliver to the management Company of the new pension plan (Defined Contribution) as mentioned in the Note 17. Its increase is mainly due to the exchange rate differences for these liabilities expressed in USD. The Pension Fund - withholdings refers to Sonangol’s withholdings from the employees’ salary accumulated between 2012 and 2018 as stated in the defined contribution pension plan. The increase in this caption refers to the amounts withheld in 2018. 19.6 Creditors - Overlift Creditors - Overlift refers to the oil lifting rights due to the Contractor Groups from the perspective of the Group as partner in the different blocks and National Concessionaire. This balance will be adjusted in the corresponding blocks rights during 2019. This balance is mainly due to the non-operated block 31, 32 and 15 and to operated blocks 3/05 and 3/05A.
In 2017, the amount of AOA 373,641,868 thousand regarding the caption Creditors – Overlift as national concessionaire was presented in the caption Concessionaire Rights – Liabilities, disclosed in Note 19.1.

SOCIEDADE NACIONAL DE COMBUSTÍVEIS DE ANGOLA E.P.
65
19.7 Other creditors 19.7.1 Other creditors (current)
As at 31 December 2018, this balance is detailed as follows:
Items 2018 2017 Sales on behalf of third parties 5,568,533,275 6,647,856,166 Social Fund 8,218,705,782 3,540,798,761 EXEM - 11,888,704,792 Other 4,447,209,379 9,052,651,006 18,234,448,436 31,130,010,725
The amounts payable regarding sales on behalf of third parties result from the sale of crude oil on behalf of Somoil and Force Petroleum at the end of 2018, which will be delivered in the following year.
21. Other current liabilites
As at 31 December 2018, Other current liabilities is detailed as follows:
Items 2018 2017 Accrued expenses Staff costs 31,578,319,164 15,951,607,462 –Advisory costs - 20,916,543,368 Specialised services/technical assistance 7,434,998,515 22,440,728,446 Mining activity (non-operated blocks) - 4,448,320,093 Mining activity (operated blocks) 36,599,044,228 20,694,093,358 Acquisition and construction work in condominiums 8,337,543,293 4,482,480,002 Bank interest 2,455,339,276 1,301,086,863 Docking and freight (Suexmax, LNG, other) 16,674,714,625 5,549,348,350 Drill ships acquisition 308,207,456,000 - Other 45,859,454,052 68,487,040,587 457,146,869,153 164,271,248,529 Deferred income Exchange rate adjustment - 367,053,630 Billing 4,375,778,928 2,676,761,332 Other 254,280,208 309,175,091 4,630,059,136 3,352,990,053 461,776,928,289 167,624,238,582
Accrued expenses with staff costs refer mainly to the employees’ holiday pay and allowances to be settled in 2018. The decrease in Advisory costs and Specialised services/technical assistance is essentially justified by the booking, in 2018, of invoices in the current account of suppliers which were accrued as at 31 December 2017. The Mining Activities relate to accrued expenses arising from mining activities (oil and gas) in blocks operated by the Sonangol Group. Docking and freight (Suezmax, LNG, Other) corresponds to accrued expenses with the docking of Suezmax and LNG ship fleet, as well as with ships not belonging to the Group, but whose responsibility falls on the Group, as stated in Bare boat agreements.
In 2018, charges with rents and acquisition and construction work in condominiums are presented in the caption Other. The caption Drill ships acquisition refers to the final portion to settle regarding the price of acquisition of drill ships, in the amount of AOA 308,207,456 thousand (see Note 4).

SOCIEDADE NACIONAL DE COMBUSTÍVEIS DE ANGOLA E.P.
66
22. Sales
The table below details the sales by product during 2018.
Items 2018 2017 Crude Oil - Association 1,398,535,000,868 715,995,187,415 Crude Oil - Concessionaire 2,268,447,531,432 1,273,392,537,501 Refined - Gas 205,190,170,265 194,000,637,580 Refined – Diesel Oil 397,340,278,316 392,914,496,052 Jet A1 38,081,098,522 44,514,244,632 Jet B 8,363,268,554 13,063,542,926 LPG 53,119,738,199 36,444,764,446 Kerosene 4,165,775,708 6,361,200,561 Fuel Oil 84,423,328,473 63,302,803,236 Naphtha 38,445,462,834 22,575,783,734 Subvention 36,850,684,859 27,329,197,705 Accrued income regarding the price differential 251,011,007,349 - Other sales 13,820,093,927 35,061,816,576 4,797,793,439,306 2,824,956,212,364
During the period there was a significant increase in the sales of Crude Oil, essentially explained by the increase in the average price of the barrel of crude oil, which increased from USD 54/BBL in 2017 to USD 70/BBL in 2018, due to the sharp depreciation of the exchange rate of AOA against the USD, and due to the production increase in block 15/6 and the entry into production of Kaombo North camp in Block 32 since July 2018. The sales of crude oil Association and Concessionaire include the variation of underlift which led to a decrease in the amount of AOA 6,818,350 thousand and the increase of AOA 53,275,072 thousand, respectively, regarding the variation in the position with the contractor groups as at 31 December 2018. Additionally, the sales of LPG include the variation on underlift position of Sanha gas which led to a decrease in the amount of AOA 2,520,599 thousand. In 2017, the caption Other included a positive effect of AOA 19,154,360 thousand regarding the underlift of Sonangol P&P. The caption Accrued income regarding the price differential in the amount of AOA 251,011,007 thousand refers to the revenues pursuant the application of no. 3 of Article 3 of the Executive Decree no. 77/16, approved by the Supervisory Bodies, which establishes an unconditional right to the recovery of these revenues plus interest due, through the mechanism of fixing prices in future sales of refined products (diesel and gasoline) over an estimated period of 7 years.
23. Services rendered
The table below details the services rendered by activity and nature during 2018.
Items 2018 2017 Aircraft renting 20,302,907,388 18,156,142,362 Ship freight 11,583,524,413 50,994,093 Communication services 10,061,692,789 9,460,280,806 Healthcare and medical services 6.570.623.503 7,461,795,146 Training activities 2,215,527,232 1,859,624,217 Pension Fund management 1,163,387,783 562,582,319 Other 769,453,391 1,892,019,408 Services rendered – Domestic Market 52.667.116.499 39,443,438,351 Aircraft renting 1,255,302,688 4,874,708,079 Ship freight 21,740,855,752 21,450,357,848 Real Estate leases 30,544,313 538,146,481 Services rendered – Foreign Market 23.026.702.753 26,863,212,408 75,693,819,252 66,306,650,759

SOCIEDADE NACIONAL DE COMBUSTÍVEIS DE ANGOLA E.P.
67
24. Other operating income The table below details the Other operating income in 2018.
Items 2018 2017 Supplementary services 6,528,556,842 3,318,706,988 Management fees 1,587,578,337 48,788,547 Royalties 75,455,657 75,735,552 Real Estate management (Hotels) 2,960,461,477 1,284,108,258 Other operating income 15,432,202,551 20,053,770,099 26,584,254,864 24,781,109,444
Supplementary services relates to recharges made in order to compensate technical costs incurred by the technical manager of the LNG fleet ships.
The amount of AOA 75,455 thousand concerns the royalties charged to Oil & Gas Providers for the sale of gas cylinders with the Group branding (Sonagás).
The caption Other operating income essentially concerns the activity related to the central laboratory and the activities related to the non-core business segment relating to Sonangol Gás natural, Sonangol Academia, Sonair and others.
25. Variation in finished products and work in progress
The table below details the movements in finished products and work in progress during 2018.
Items 2018 2017
Finished products and intermediates (2,292,816,368) (818,890,956) Underlift/Overlift - 841,046,973 Concessionaire rights (24,849,320,629) 11,266,160,258
(27,142,136,997) 11,288,316,275
In 2018, the effect of the underlifts associated with Sonagás are booked under Sales (see Note 22) and the effect of overlifts on Sonagás and Sonangol P&P are recorded under the caption Oil and Gas exploration and operating costs – Other (see Note 27).
26. Concessionaire cost (sales on behalf of the State)
The table below details the cost with the sales on behalf of the State:
Concessionaire revenue 2018 2017 Sales on behalf of the State Concessionaire - Block 2-05 297,449,226 400,420,798 Concessionaire - Block 3-05 13,355,516,895 23,409,612,367 Concessionaire - Block 3-05A - 629,232,683 Concessionaire - Block 4-05 2,533,866,163 1,410,488,005 Concessionaire - Block 14 84,541,389,779 65,289,848,617 Concessionaire - Block 15 615,996,557,592 293,376,404,610 Concessionaire - Block 15/06 62,071,495,603 27,018,593,170 Concessionaire - Block 17 1,267,220,725,436 584,259,776,733 Concessionaire - Block 18 75,193,072,582 71,150,181,441 Concessionaire - Block 31 53,298,020,313 31,426,441,607 Concessionaire - Block 0 Cabinda Sul 517,526,249 303,323,130 Concessionaire - Block 32 11,271,820,986 - 2,186,297,440,824 1,098,674,323,161 Final position of crude oil liftings as Concessionaire Underlifts (23,415,515,016) 185,716,912,340 Overlifts 50,262,005,315 18,187,816,473 26,846,490,299 203,904,728,813 2,213,143,931,123 1,302,579,051,974
This amount corresponds to the difference between the revenues from the sale of crude oil – Concessionaire’s rights and the mark-up rate of the National Concessionaire. According to Law No. 3/18 of 1 March, Chapter IV, Article 8, this mark-up rate is determined at 5% (2017:7%) based on the barrel price used in the 2018 State Budget. There is a significant increase in Sales on behalf of the state when compared with the same period of the previous year, due to the increase in sales and the strong depreciation of the AOA exchange rate against the USD.

SOCIEDADE NACIONAL DE COMBUSTÍVEIS DE ANGOLA E.P.
68
The amounts of underlifts and overlifts reflect the National Concessionaire business in which the Group has conducted liftings of profit oil share allocated to the Angolan State, below (underlifting) or above (overlifting) its rights calculated in accordance with the production-sharing agreement (PSA).
27. Cost of goods sold and raw materials consumed
The table below details the cost of goods sold and raw material consumed in 2018.
Items 2018 2017 Raw materials and consumables 9,885,538,573 8,377,052,863 Goods 756,111,869,786 393,455,055,547 765,997,408,359 401,832,108,410
This caption essentially includes the costs with goods associated with the downstream segment, sold to clients during the year. The increase in costs of goods sold against the same period of the previous year was strongly influenced by the increase of purchasing prices on the external market, as well as the sharp depreciation of the AOA exchange rate against the USD, equally affecting all services inherent to the use of products.
27A. Oil and gas exploration and operating costs
The table below details the Oil and Gas exploration and operating costs in 2018.
Items 2018 2017 Research costs 1,407,148,019 2,599,036,254 Production costs 263,896,237,407 200,988,209,374 Custom fees 7,305,553,287 4,232,649,900 Royalties 130,607,207,564 67,273,008,014 Other 2,341,903,363 2,414,682 405,558,049,640 275,095,318,224
In caption Research cost are booked the costs with seismic acquisition and the costs with geology and geophysics. In caption Production costs, are booked the direct operation costs relating to blocks in which the Group holds participating interest and that are in the production stage. The increase verified in Oil and gas exploration and operating costs is influenced by the variation in costs with the Production Rate (IPP), which is directly related with the increase in the value of sales in the year in comparison with the previous year and due to the effect of the sharp depreciation of the AOA exchange rate against the USD.
27A.1. Detail of research and production costs The table below details the Research and production costs in 2018.
2018 2017 Items Production Research Total Total Bloco 0 128,727,239,989 (588,132,231) 128,139,107,758 92,396,994,310 FS/FST 11,765,103,518 - 11,765,103,518 7,045,531,359 B03.05 (6,903,853,064) - (6,903,853,064) 13,268,760,102 B03.05A 2,445,597,425 - 2,445,597,425 583,310,821 B04.05 4,602,365,150 (8,485,778) 4,593,879,372 6,002,884,298 B05.06 4,239,598 110,827,024 115,066,622 116,868,092 B09.09 - - - 1,056,676 B14.00 14,444,746,048 - 14,444,746,048 8,280,622,162 B14.KU 770,620,939 - 770,620,939 588,205,882 B15.06 60,082,456,823 387,958,299 60,470,415,122 32,863,822,562 B17.06 3,034,054 29,292,977 32,327,031 22,431,808 B18.06 - - - (822,435) B21.09 - 265,096,287 265,096,287 571,660,319 B22.11 - 524,240,961 524,240,961 490,586,076 B31.00 40,461,824,718 - 40,461,824,718 38,406,878,534 B32.00 3,039,712,725 8,015,288 3,047,728,013 714,454,801 B35.11 - 112,766,196 112,766,196 208,850,071 B36.11 - 6,418,933 6,418,933 145,978,087 B37.11 - 6,594,111 6,594,111 111,668,775 BOC.ST (37,160,272) 505,756,688 468,596,416 954,939,864 GEP -Total - - - 597,818 SHI CUBA - 46,799,264 46,799,264 508,818,849 Other 4,490,309,756 - 4,490,309,756 279,805,085 TOTAL 263,896,237,407 1,407,148,019 265,303,385,426 203,587,245,628

SOCIEDADE NACIONAL DE COMBUSTÍVEIS DE ANGOLA E.P.
69
28. Personnel Costs
The table below details the personnel costs in 2018.
Items 2018 2017 Wages and salaries 175,072,224,784 123,705,741,595 Extraordinary services 314,801,692 185,538,424 Shift allowance 920,547,957 671,155,732 Training expenses 2,882,726,857 1,586,303,360 Family allowance 370,573,269 256,066,257 Social security expenses 6,595,223,919 4,873,564,801 Celebration parties and social action expenses 3.233.227.225 190,041,950 Accommodation expenses 1,506,939,195 897,849,195 Insurance expenses 1,017,086,884 1,143,703,467 Post-employment benefits 27.342.700.589 16,766,650,240 Uniforms - 2,309,999 Other 1,679,382,944 2,673,720,820 220,935,435,315 152,952,645,840
The increase with Personnel costs when compared with the previous year is essentially due to the effect of the exchange rate depreciation of the AOA against the USD. Expenses with post-employment benefits
Expenses with post-employment benefits are recognised under Personnel costs and are detailed as follows:
Sonangol Pension Plan Sonangol Healthcare Plan ENSA Pension Plan Defined benefit Defined benefit Defined benefit Total 2017 Net cost Current service costs - 4,875,169,530 223,115,461 5,098,284,991 Interest cost 3,983,206,196 7,392,556,734 532,495,402 11,908,258,332 Expected return arising from plan assets - - (239,893,083) (239,893,083)
Total 3,983,206,196 12,267,726,264 515,717,780 16,766,650,240 2018 Net cost
Current service costs - 8,774,136,973 324,077,613 9,098,214,586 Interest cost 6,169,814,553 11,599,097,492 743,539,022 18,512,451,067 Expected return arising from plan assets - - (267,965,064) (267,965,064)
Total 6,169,814,553 20,373,234,465 799,651,571 27,342,700,589
29. Depreciation and amortisation
The table below details the other operating expenses in 2018.
Items 2018 2017 Tangible fixed assets and other financial assets – Real Estate investments 61,103,438,919 52,891,750,691 Intangible assets 690,466,681 938,491,053 Oil and Gas assets - Development 630,121,506,884 350,239,436,329 Oil and Gas assets - Abandonment 36,494,786,803 20,942,060,285 728,410,199,287 425,011,738,358
The caption Tangible fixed assets and other financial assets – Real Estate investments is deducted from the amount of AOA 671,124,090 relating to the amortisation of goods associated with the management and services charged to the blocks through the model of cost allocation in force. The increase in amortisation in comparison with 2017 is essentially due to the exchange rate effect but also to the entry into operation, in 2018, of the Kaombo North area of Block 32 and the areas of Vandumbu and Ochigufu of Block 15/06.

SOCIEDADE NACIONAL DE COMBUSTÍVEIS DE ANGOLA E.P.
70
30. Other operating expenses As at 31 December 2018, this balance is analysed as follows:
Items 2018 2017 Water and energy 624,708,547 667,192,018 Technical assistance 2,219,506,675 1,902,095,586 Audit and advisory services 8,424,274,650 21,779,702,534 Fuel and lubricants 1,630,450,684 2,202,434,149 Commissions and intermediaries 185,829,602 146,740,036 Communication 7,311,956,154 4,105,898,628 Maintenance and repair 13,773,626,917 12,554,695,071 Litigation and notaries 2,084,968,708 483,409,093 Travel and accommodation 890,126,196 1,262,290,351 Representation expenses 318,961,014 171,811,434 Meals 1,127,050,952 422,815,636 Fees 3,586,657,501 1,709,674,134 Taxes and duties 14,830,230,470 19,682,183,018 Books and technical documentation 79,976,714 36,441,913 Office equipment 1,288,835,098 697,089,681 Health and comfort material 2,111,900,152 3,433,396,419 IT equipment 502,253,538 4,075,712,248 Offerings and donations 216,859,848 29,964,409 Marketing 5,915,284,964 3,698,739,197 Rents and leases 14,094,310,059 9,021,950,716 Insurance 2,196,294,190 2,552,122,064 Surveillance and security services 6,030,848,489 6,428,784,794 Subcontracts 16,889,707,167 14,052,774,449 Specialised services 22,521,840,597 17,920,675,382 Houston Express Operation 3,075,527,861 5,819,945,942 Block charges / Ship maintenance and operation 22,464,214,851 20,987,105,670 Other-Third Party Supplies 12,420,599,633 13,757,247,601
166,816,801,231 169,602,892,173
Other Operating expenses decreased 2% compared to the previous year, mainly due to the policy of reducing costs and renegotiating the contracts of the Group's main suppliers.
31. Financial results
The table below details the financial results in 2018.
Items 2018 2017 Financial income:
Interest income 46,213,785,458 44,014,528,403 Income from investments in Real Estate 697,421,025 190,139,844 Gains on investment and financial assets 7,355,162,060 67,445,309,384 Reversal of provisions for investments in associates 1,873,689,264 12,466,431,918 Payment discounts received 2,104,859 33,694 Other 89,496,942 540,341,947 56,231,659,608 124,656,785,190
Financial expenses: Interest expense (65,564,723,728) (58,139,414,667) Bank expenses (221,217,726) (629,222,922) Financing charges (7,643,754,822) (2,084,275,000) Losses on investments and financial assets (44,691,605,401) (1,982,309,031) Abandonment interest (30,741,401,365) (13,595,963,318) Default interest (cost) (60,623,753,793) (26,490,731,296) Other financial expenses (216,077,549) (248,622,156)
(209,702,534,384) 103,170,538,390 Exchange rate differences (net) (248,357,805,195) 45,548,289,241 (401,828,679,971) 67,034,536,041
Interest expense includes the amount of AOA 61,549,123 thousand (AOA 56,157,930 thousand in 2017) related to financial expenses resulting from the loans shown in Note 15. The caption Losses on investments and financial assets includes the amount of AOA 44,419,055 thousand related to changes in the fair value of the financial investment (Millennium BCP) in 2018. The foreign exchange gain for the period associated with this investment in the amount of AOA 134,977,187 thousand is recorded under Exchange rate differences (net). In 2017, the changes in fair value of this financial investment generated a gain of AOA 54,972,191 thousand recorded under Gains on investment and financial assets. The caption Default interest (cost) in the amount of AOA 60,623,754 thousand is essentially related with the delays in payments to suppliers of oil derivatives import and the interest arising from the non-liquidation of the funds requested by the operators of the blocks for operations (essentially Block 32 and Block 31).

SOCIEDADE NACIONAL DE COMBUSTÍVEIS DE ANGOLA E.P.
71
In 2018, the financial results are affected by the significant Kwanza exchange rate fluctuation against the US Dollar. These exchange rate differences relate, mainly, to the unrealised exchange rate differences, resulting from the debt update from and with third parties (bank counterparties, suppliers, clients, other various debtors and creditors, subsidiaries, associates and State bodies), as well as realised exchange rate differences, resulting from the settlement of debts from and with third parties. During 2018, the variation of Exchange rate differences (net) caption is essentially justified by the depreciation of the exchange rate of the Kwanza against the US Dollar (52% when considered the average exchange rate for the periods and 86% when considered the final exchange rate of each period). This exchange rate difference had a more significant impact on the Downstream segment, where a financial loss in the amount of AOA 242,162,280 was verified, essentially resulting from the difficulties in getting access to foreign currency in the country and which give rise to delays in the payment to suppliers, which, in addition to the default interest identified above, impact the exchange rate differences due to the depreciation of the AOA (Kwanza).
32. Net gains/ (losses) arising from subsidiaries and associates
The table below details the results from subsidiaries and associates in 2018.
Items 2018 2017 BAI 1,982,312,968 1,331,811,870 Banco Caixa Geral Angola 934,144,747 1,363,985,836 Enco - 105,567,966 Esperaza - 14,699,306,700 Kwanda - 194,939,996 Mota Engil Angola - 295,234,450 Petromar 186,094,800 - Puma Energy - 1,100,543,437 Sonadiets Lda 48,603,220 157,919,377 Sonadiets Services 306,153,369 101,721,306 Sonatide Marine Services Ltd 3,255,916,500 - Sonangalp - 872,371,701 Sonasing Kuito 51,842,700 100,049,400 Sonasurf International 708,620,850 1,278,038,580 ALNG Fleet Management - 17,211,752 Unitel 26,948,685,283 - OPS - 833,725,000
34,422,374,437 22,452,427,371
33. Non-operating results
As at 31 December 2018, this balance is analysed as follows:
Items 2018 2017 Non-operating income and gains:
Provisions write-back – Inventories 619,707,291 793,240,819 Provisions write-back – Bad debts 60,864,006,022 70,299,620,304 Provisions write-back – Abandonment Fund 16,117,327,492 586,279 Provisions write-back – Tax contingencies 6,937,586,979 4,512,520,668 Provisions write-back – Other 6,372,429,616 5,192,374,656 Gains on fixed assets 323,817,117,577 85,041,197,092 Gains on inventories 4,563,326,720 3,798,981,825 Bad debt recovery 24,868,162 - Other non-operating income and gains 20,598,447,980 17,057,804,651 439,914,817,839 186,696,326,294
Non-operating expenses and losses: Provisions – Inventories (17,077,409,097) (2,966,434,808) Provisions – Bad debts (40,971,191,871) (42,017,798,300) Provisions – Legal proceedings (30,309,424,569) (71,082,899) Provisions – Work accidents - (240,286) Provisions – Client guarantees (68,587) - Provisions – Tax contingencies (3,855,556,333) (30,826,198,976) Provisions – Other (4,909,307,193) (351,701,451) Extraordinary amortisations (3,939,833,949) (589,448) Losses on fixed assets (4,138,863,631) (231,144,917,485) Losses on inventories (7,331,822,570) (5,092,348,777) Bad debts (86,907,262) (62,734,390) Other non-operating expenses and losses (29,671,918,627) (32,390,428,939)
(142,292,303,689) (344,924,475,759) Adjustments relating to prior years (3,020,863,890) (12,621,421,581) 294,601,650,260 (170,849,571,046)
The caption Gains on fixed assets includes the amount of AOA 323,555,750 thousand related to impairment reversals of mining assets arising from impairment tests performed during the current period, as disclosed in Note 4A.3.

SOCIEDADE NACIONAL DE COMBUSTÍVEIS DE ANGOLA E.P.
72
The caption Provisions write-back – Bad debts includes the reversal of the provision regarding the amount receivable from China Sonangol International in the amount of AOA 25,223,762 thousand, as referred in note 9.
The caption Provisions – Legal proceedings relates essentially to the recognition of the provision for the arbitration process with PT Ventures, as disclosed on Note 18, in the amount of AOA 30,005,439 thousand (impact on the results of the period converted at the average rate). The caption Other non-operating expenses and losses includes the amount of AOA 17,060,014 thousand relating to charges with scholarship grantees overseas.
34. Extraordinary results
The table below details the extraordinary results in 2018.
Items 2018 2017 Extraordinary income and gains Claims 1,008,489 2,496,953 Other extraordinary income and gains 155,261,837 2,256,302,347 Write-off of the ineligible liabilities 10,282,057,738 - 10,438,328,064 2,258,799,300
The caption Extraordinary income and gains relates to the cancellation of the debt with the operator of blocks 36 e 37 (debt write-off).
35. Income tax
The table below details income tax expense in 2018.
Items 2018 2017
Oil income tax and oil transaction fee 178,244,679,017 61,152,057,652
Industrial tax 50,050,679,797 31,708,122,829
Other taxes 1,429,104,086 929,523,101
229,724,462,900 93,789,703,582
The Group’s companies with activities on the research, exploration, development and production of crude oil and natural gas onshore and offshore business, either as operator or non-operator, in joint agreements and production sharing agreements are subject to Oil income taxes.
35.1 Details on Oil income tax by block:
Block 2018 2017 Variance Variance %
Block 0 103,979,990,000 9,957,292,833 94,022,697,167 944.3%
Block 03.05 2,668,757,734 3,339,199,411 (670,441,677) (20.1%)
Block 03.5A - 552,661,657 (552,661,657) (100.0%)
Block 04.05 573,972,238 572,396,606 1,575,632 0.3%
Block 14.00 7,862,068,745 2,158,530,200 5,703,538,545 264.2%
Block 14.KU 670,648,648 600,511,140 70,137,508 11.7%
Block 15.00 17,062,323,154 9,123,319,614 7,939,003,540 87.0%
Block 31.00 39,327,749,478 34,691,197,670 4,636,551,808 13.4%
Block 32.00 5,942,340,965 - 5,942,340,965 -
BOC.02 72,431,685 134,724,500 (62,292,815) (46.2%)
FST.00 84,396,370 22,224,041 62,172,329 279.8% 178,244,679,017 61,152,057,672 117,092,621,345 191.5%

SOCIEDADE NACIONAL DE COMBUSTÍVEIS DE ANGOLA E.P.
73
Tax associated with Block 0 respects to Sonangol E.P. oil transaction taxes in the amount of AOA 60,511,579 thousand and the amount of AOA 43,468,411 thousand related to the oil income tax, from which AOA 35,394,615 thousand are related to the Sonangol E.P operation and AOA 8,073,496 thousand are related to the Sonangol Gás Natural Lda (Sonagás) operation.
36. Commitments not reflected in the balance sheet
As at 31 December 2018, the Group assumed commitments not reflected in the balance sheet, the most significant of which are as follows:
• Sonangol Pesquisa & Produção holds participating interests in some blocks. However, as result of signed financing agreements, the contribution of the exploration costs is financed by the partners of the respective contractor groups, which will be recovered in accordance with the terms of the production sharing agreements:
Area Operator Carry Carry Stage
Block 5/06 Vaalco 10.00% Exploration Block 6/06 Petrobras 20.00% Exploration Block 8/06 Maersk 20.00% Exploration Block 9/09 Cobalt 12.50% Exploration Block 15/06 ENI 11.14% Exploration Block 16 Total 20.00% Development Block 17/06 Total 17.50% Exploration Block 18/06 Petrobras 20.00% Development Block 19 BP 40.00% Transition Block 20/11 Cobalt 30.00% Transition Block 21/09 Cobalt 12.50% Exploration Block 22/11 Repsol 21.43% Development Block 23/06 Maersk 20.00% Exploration Block 24 BP 50.00% Exploration Block 25/11 Total 30.00% Transition Block 26/06 Petrobras 20.00% Exploration Block 31 BP 31.25% Production Block 32 Total 17.50% Development Block 33 Total 20.00% Exploration Block 35/11 ENI 23.57% Exploration Block 36/11 ConocoPhillips 21.43% Exploration Block 37/11 ConocoPhillips 21.43% Exploration Block 38/11 Statoil Angola 30.00% Exploration Block 39/11 Statoil Angola 30.00% Exploration Block 40 Total 30.00% Exploration Block 48/18 Total 50.00% Exploration BOC Pluspetrol 20.00% Production BCN ENI 20.00% Exploration
37. Contingent assets and liabilities
During 2018 and throughout the development of the activity, contingencies related to possible administrative risks related to legal proceedings, tax risks and other with related entities at the level of clients, suppliers or state entity are recorded. These possible risks are susceptible to adjustment if there are changes in the elements and factors that contributed to the assessment of these situations as contingent liabilities at the balance sheet date.
Contingencies whose losses were estimated as possible do not require the booking of provisions and are periodically revalued. In the opinion of the Board of Directors, the outcome of these contingencies will not materially affect the Group's financial position.
PT Venture Arbitration
In 2016, PT Ventures, SGPS, S.A. (PT Ventures), one of Unitel S.A.R.L (Unitel)’s shareholders, intended an action against the remaining shareholders of Unitel (including Mercury - Serviços de Telecomunicações, S.A.) for an alleged breach of the shareholders' agreement entered into between the various shareholders, in particular the non-payment of dividends distributed in previous periods to PT Ventures, as well as possible losses allegedly suffered.
As of 20 February 2019, the arbitration decision was partially favourable to PT Ventures, according to which the remaining shareholders of Unitel are jointly condemned:
a) To the payment of compensation for losses arising from non-compliance with the shareholder agreement in the amount of USD 339 million, plus interest from the date of the decision;

SOCIEDADE NACIONAL DE COMBUSTÍVEIS DE ANGOLA E.P.
74
b) The payment of the dividends from previous years, in the total amount of USD 411 million (including interest), although the Court established the primary obligation to pay the dividends as an obligation of Unitel itself;
c) The payment of the fees and other costs of the process, in the amount of USD 15 million.
Based on the assessment carried out by its legal advisors, the Group recognised a provision of USD 118 million, corresponding to the amounts directly attributable to Mercury - Serviços de Telecomunicações, S.A., in relation to the compensation and legal costs, presented in items a) and c) (see note 18) . Despite the joint nature of the payments, the Board of Directors considers that the payment portion attributable to the remaining shareholders of Unitel sets a contingent liability for Mercury - Serviço de Telecomunicações, S.A..
Regarding the value of past dividends, presented in letter b), according to the assessment made by the Company's legal advisors, the payment of dividends by Unitel extinguishes the liability of Mercury - Serviço de Telecomunicações, S.A., whose primary obligation is recognised by the Court as Unitel’s. Supported by this assessment, the Board of Directors considered this component as a contingent liability of remote risk, and therefore as of 31 December 2018 no provision was booked in relation to this instalment. The Board of Directors expects that these amounts will be assumed directly by Unitel, taking into account the debt formalised at the General Shareholders' Meeting of that company and duly recognised in its financial statements, and the fact that Unitel is provided with sufficient net financial resources to pay the dividends owed to PT Ventures.
Tax contingencies
As at 31 December 2018, there was a set of possible tax contingencies arising from tax inspections and other events that are in dispute with the State. As mentioned in Note 9.5.1, the reconciliation of non-oil debts between the Group and the Ministry of Finance is at its final stage, which should lead to the signature of an agreement on the historical debt position between both parties and the definition of a settlement model for such balances.
Legal proceedings against Airbus
On 29 April 2016, an H225 Super Puma helicopter, operated by the company CHC Helicopter Services was involved in a fatal accident in the North Sea (Norway). Due to this accident, the civil aviation authorities of Norway and the United Kingdom immediately set up an independent investigation, coordinated by the Accident Investigation Board Norway (AIBN), deciding on the immediate suspension of all commercial passenger operations with Super-Puma aircraft (H225 and AS332 L2) in Norway and the United Kingdom, followed by European Union (EASA) and Angolan civil aviation authorities (INAVIC).
According to the AIBN preliminary report, dated 28 April 2017, the accident was due to mechanical issues.
As operator of 16 (sixteen) Super Puma aircraft, of which twelve (12) of the H225 model directly owned and four (4) of the AS332 L2 model owned by third parties, SonAir filled a proceeding on 26 April 2018 in the Commercial Court of Marseille claiming, with reference to April 2018, a compensation of USD 1,27 billion relating mainly, but not limited to, i) operating losses due to the lack of helicopters operation, ii) operating and maintenance costs, insurance and other costs, and iii) amounts received by Airbus in exchange for the sale of the helicopters. At the date of preparation of the financial statements, the process was in the stage of hearings and oral presentations, and its outcome was not known and therefore the amount claimed was classified as a contingent asset as at 31 December 2018.

SOCIEDADE NACIONAL DE COMBUSTÍVEIS DE ANGOLA E.P.
75
38. Subsequent events
After the balance sheet date, the relevant events with potential impacts on the Group’s financial statements were:
Changes in the selling prices of refined products By virtue of Executive Decree no. 706/15 of 30 December, Sonangol is obliged to perform the sale of refined products to end customers and remaining market operators at the platts of 2015 price with a fixed exchange rate of AOA 155,612 for each USD (although the same decree provides for the regime of fluctuating prices). This situation, associated with the increase in acquisition price in the international market of refined products and the Kwanza depreciation against the US Dollar, led into a significant increase in the acquisition cost of products in 2018.
As a result of the above mentioned, Sonangol together with MIREMPET/IRDP - Instituto Regulador de Derivados de Petróleo (after hearing other operators) and MINFIN/IPREC presented to MINFIN a proposal to reformulate the calculation of the prices of refined products commercialized in the domestic market which, after adjustments, was sent to the Executive Economic Commission, for review, having recommended the revision of the proposal for the transition from the Weighted Average Prices model to the Import Parity model. As mentioned in notes 9 and 22, with reference to 31 December 2018, the company booked sales and accounts receivable, pursuant to number 3 of Executive Decree no. 77/16 of 25 February, taking into account that this right is unconditional even in the event of a transfer of the activity. In this context, according to the agreed work program, at the balance sheet date a study is being made to analyse the main components of the oil derivatives price structure, based on the agreed Import Parity Methodology, as well as the process of evaluation of the value chain of the Downstream segment (logistics, distribution and commercialisation), for further definition of the margins and determination of the sale price to the public. By the end of this process (estimated for late 2019), the group may incur in negative margins throughout the downstream segment value chain. Entry into operation of Block 32
In April 2019 Sonangol E.P., Total E&P Angola and their Block 32 associates began production of Kaombo Sul, the second Floating production, storage and offloading unit (FPSO) in the Kaombo project, located 260km off the shore of Luanda, between 1,400 and 2,000 meters deep where, through Sonangol P&P, the Group holds a 30% participating interest, under the PSA. This event occurred exactly 8 months after the beginning of production in FPSO Kaombo Norte (FPSO operating in the northern part of the Block). The production capacity of Kaombo Sul amounts to 115,000 barrels of crude oil/day and increases the general production capacity of Block 32 to 230,000 barrels of crude oil/day, the equivalent to 15% of Angola’s production. The gas associated with the production of the Kaombo Sul will be directed to the Angola LNG plant in compliance with the contractor's Group environmental commitment to eliminate the gas burning. As disclosed in Note 6.2 Detail by entity – financial investments – cost less impairment losses, the Group holds a 22.8% interest in Angola LNG, and this situation should contribute favourably to the increase in gas reserves and the volume of sales of the factory. 39. Government and other entities grants Apart from the grants defined by the Executive Decree no. 17/95, amended by the Presidential Decree 1/12 and by the Executive Decree no. 289 of 2014, the Group did not receive any grant from the Government or from other entities.
40. Balances and transactions with related parties Balances and transactions with related parties were eliminated in the consolidation process, therefore there were no outstanding balances and transactions as at 31 December 2018.
41. Information required by law
No information required by law.

SOCIEDADE NACIONAL DE COMBUSTÍVEIS DE ANGOLA E.P.
76
42. Other information Financing guarantees
Sonangol EP is the guarantor of the Republic of Angola external financing with international financial institutions. These guarantees are based on the consignment of quantities of future crude oil loadings/sales contractually defined.
Organisational Model of the Oil Sector
The current strategy for the development of the Oil Sector has substantially changed the assumptions on which the models for the management of oil resources have been constructed by both the State and other industry players. After a rigorous assessment of the possible impacts on Sonangol 's financial stability and efficiency gains in the industry, a new model for the organisation of the oil sector was approved by the Angolan authorities, separating the Concessionaire (Supervision) function from the Operator (investor) function which ensures the financial stability of Sonangol E.P. and its sustainability as a strategic company of the Angolan State. As a result of the foregoing, Presidential Decree No. 49/19 of 6 February 2019 created the National Oil, Gas and Biofuel Agency (ANPG), approved its organic status and defined this new entity as the regulator of the exploration of oil and gas activity and as the new National Concessionaire. The reorganization of the Angolan oil sector and the creation of the ANPG required the introduction of changes to the Petroleum Activities Law (Law no. 10/04, of 12 November), which was implemented through Law 5/2019 of 18 April. Additionally, Law no. 6/19 amends article 2 of Law no. 13/04, of 24 December, on the Petroleum Activities Tax, laying the legal bases for the exercise of the activity of National Concessionaire by ANPG. In this context, 18 April 2019 is the cut-off date of the operations and all revenues and expenses inherent to the Concessionaire function will no longer be recognised by Sonangol E.P. and will be recognised by the ANPG. Thus, Sonangol E.P. will no longer recognise in its accounts the following main transactions with impact on the results for the year:
• Sale of Crude Oil from the Concessionaire, disclosed Note 22;
• Delivery of Sales to Concessionaire, disclosed Note 26;
• Underlifting and Overlifting of the Concessionaire disclosed in Notes 22 and 26;
• Margin of the Concessionaire;
• Concessionaire's rights;
• Operating and structural costs associated with the exercise of the concessionary function, among which salaries.
Regeneration Program In 2018, the Board of Directors of Sonangol E.P. approved the Regeneration Program of the Sonangol Group, which was approved by the sole Shareholder, trough Presidential Decree No. 146/18 of 25 October. The program aims to regenerate the Sonangol Group and maximize the potential of the assets with a greater focus on the core business of the oil industry, based on the need to make Sonangol more competitive and profitable, particularly in oil drilling, exploration and production of crude oil and natural gas, refining, liquefaction of natural gas, transportation, storage, distribution and commercialization of derivative products. This extensive and comprehensive Regeneration Program was officially launched on 15 November 2018 and will have an estimated duration of 30 months, with actions to be implemented in the short and long term. The foundations for the restructuring of Sonangol have been laid, which include the analysis and evaluation of the oil exploration and production business, and will also include a program of change management, digitalisation and information systems and knowledge transfer through Academia Sonangol, in order to achieve the following strategic objectives for the five-year period from 2018 to 2022:
a) Optimise the organisational development, human and technological capital to increase the productivity of the company and improve the performance of the oil sector in Angola;

SOCIEDADE NACIONAL DE COMBUSTÍVEIS DE ANGOLA E.P.
77
b) To boost and intensify its activity in order to allow the substitution of reserves and increase in the production of hydrocarbons, in the medium / long term;
c) Promote the Prospection, Research, Development and Production of Natural Gas; d) Promote the domestic production quota of Crude Oil, reinforcing the role of Sonangol Pesquisa e Produção, making
it more efficient; e) Consolidate the integration of the refining, transport, storage and commercialization of refined products
businesses, with a focus on promoting efficiency and liberalising the fuel market.
The regeneration program foresees the sale of non-core participating interests, and the Board of Directors has prepared a proposal for the non-core assets to be included in the said program, which is being analysed and pending shareholder approval. In view of the foregoing, the Board of Directors considers that, at the balance sheet date, the sale is not highly probable since the assets are not available for immediate sale in their present condition. Agreement with Total
Sonangol Distribuidora has identified a new business opportunity in the Oil derivatives sector, aimed at raising the standards of the industry, especially in the service sector, retail activity, which could also be extended to storage and logistics, has made efforts to materialise the intention, having taken significant steps as at 12 February 2019, by sending an official letter to the Competition Authority to express the interest of effecting an act of concentration of Companies.
The materialisation of the project will take place by the constitution of a corporation, which includes Sonangol Distribuidora, Total Outre Mer, Goal Investimentos, Lda. Sonangol Comercio Internacional, Lda., Sonagás and Sonaref, S.A, with the following Social capital structure:
• Sonangol will hold 50% of the representative shares and will be represented by its subsidiaries (Sonangol Distribuidora, Sonagás, Sonaci, and Sonaref), and Sonangol Distribuidora, S.A will subscribe its share capital portion, through the transfer of the property of 45 (forty-five) fuelling stations. The remaining companies of the group will subscribe their shares fully in cash;
• TOM will hold 49% of the representative shares, will subscribe their shares fully in cash;
• GOAL will hold 1% of the representative shares, will subscribe their shares fully in cash;
The Company's business will be the supply, distribution and storage of oil derivatives and lubricants, the production, storage and commercialisation of electric renewable energy sources, including, but not limited to, solar energy and biofuels, as well as the provision of related or complementary services, in accordance with Angolan legislation. The Company will operate 45 (forty-five) fuelling stations, subject to the contribution of Sonangol Distribuidora, as soon as it has the authorisation of all related public entities. The Company will carry out its activity at the fuelling stations under the TOTAL brand and at the convenience stores under the BONJOUR brand, under the terms and conditions of the license to use the brand to be concluded between the Company and TOTAL, S.A.
In the first year of operation, the Company intends to concentrate its activities in fuelling stations and expects to reach a market share of 4% to 10% over the next 5 years.
43. Explanation added for Translation
These financial statements are a free translation of the financial statements originally issued in Portuguese. In the event of discrepancies, the Portuguese language version prevails.

SOCIEDADE NACIONAL DE COMBUSTÍVEIS DE ANGOLA E.P.
78
Chief Accountant
Divaldo Palhares Registration No. 20140034
Financial Director
Chief Financial Officer
Baltazar Miguel
Chairman of the Board of Directors
Sebastião Pai Querido Gaspar Martins
Armando Sebastião Registration No. 20150382
SIGNED ON THE ORIGINAL
SIGNED ON THE ORIGINAL
SIGNED ON THE ORIGINAL
SIGNED ON THE ORIGINAL