Some Physical Constants for the Marshall Islands …Some Physical Constants for the Marshall Islands...
45
Some Physical Constants for the Marshall Islands Area GEOLOGICAL SURVEY PROFESSIONAL PAPER 260-AA
Transcript of Some Physical Constants for the Marshall Islands …Some Physical Constants for the Marshall Islands...

Some Physical Constants for
the Marshall Islands Area
GEOLOGICAL SURVEY PROFESSIONAL PAPER 260-AA

Some Physical Constants for
the Marshall Islands AreaBy J. H. SWARTZ
BIKINI AND NEARBY ATOLLS, MARSHALL ISLANDS
GEOLOGICAL SURVEY PROFESSIONAL PAPER 260-AA
Data for IJ groups of physical properties and
discussion of the methods used in their measurement
UNITED STATES GOVERNMENT PRINTING OFFICE, WASHINGTON : 1962
UNITED STATES DEPARTMENT OF THE INTERIOR
STEWART L. UDALL, Secretary
GEOLOGICAL SURVEY
Thomas B. Nolan, Director
For sale by the Superintendent of Documents, U.S. Government Printing OfficeWashington 25, D.C.

CONTENTS
Abstract_ ________________________________________Introduction _______________________________________Method of arrangement and presentation of data_______Acknowledgments—_____ ____________________________Physical constants __________________________________
Absorption of water_____________________________Attenuation constants___________________________
Coefficient of absorption___-_._______________Specific damping capacity____________________
Density and specific gravity____________________Elastic constants-______________________________
The elastic moduli for tension or compression: Young's modulus _________________________
Poisson's ratio____________________________Modulus of rigidity_________________________Bulk modulus (modulus of incompressibility)___ Units used for elastic constants-..____________Determination of the elastic constants.--______
Static methods-______________^_________Dynamic methods ______________________
Hardness-___________________________________Impact toughness_ — _________________
Page 953 953953954954954955955957958961
962962963964964964964965969970
Page Physical constants—Continued
Magnetic constants________-___________._____-__ 971Susceptibility.---___----_--- — ____________ 971Permeability (magnetic)_____________________ 972Remanent magnetization____________________ 972
Permeability (hydraulic)_______________________ 975Porosity____________________________ 976Radioactivity (natural)_____________________-_-__ 978Seismic speeds; speeds of transmission of seismic
waves-_____----_--------------_---_-_------- 979Strength,.. ___________._.__.__________._. 981
Compressive strength- __________-_-____---__ 981Triaxial compressive strength (shearing
strength)...____________________ 981 Flexural strength (modulus of rupture)________ 982
Thermal data....--___________________ 983Temperature profiles__________________---___ 983Thermal conductivity-_.________-____-__-_-_ 983Thermal flux (heat flow)___________-__ 986Thermal gradients_____-_-___----___-------_ 987
References.--.-__-_---_-__-----------_--_—_--_-__ 987
ILLUSTRATIONS
Page
FIGURE 290. Map of west Pacific Ocean_________________________________________________________________________ 954291. Map of northwestern Marshall Islands._-__--________-_________-__-_-__________--______---__------__- 955292. Map of Eniwetok AtolL________._______________________________________________________ 956293. Map of Bikini Atoll------____.______________________________________________ 957294. Variation of relative amplitudes of first arrivals with distance___________________________________________ 957295. Stress-strain curve and elastic moduli___________________________________________________________-____ 962296. Shearing strains____________________________________________________________________________________ 963297. Shifting stress-strain cycles. _--__--_-______-_________________-______-_-__-___-_-________-____-__---- 964298. Narrowing of stress-strain cycles._____________________________________________________________________ 965299. Diagram of U.S. Bureau of Mines sonic equipment____________________-_____-______-__-_--_____--_--_ 966300. Young's modulus plotted against specific gravity-___-__________-_______________---______-_-_---_----_- 967301. Diagram of Michelsen susceptibility bridge_--_________________________________________-_-_-___-_--__- 971302. Diagram of Michelsen remanent magnetometer___________________________________-_______-_____---_--- 973303. Variable head permeameter______________________________________________________________________-_- 975304. Mohr's circles and envelope for core MU-5___________________________________________________________ 982305. Thermal-conductivity apparatus.____________________________________________________________________ 984
TABLES
Page TABLE 1. Percent absorption of water in limestone drill cores from Eniwetok Atoll, Marshall Islands________________ 955
2. Mean values of the coefficient of absorption for refracted waves in layers 2 and 3 in Bikini Atoll_____________ 9583. Specific damping capacity for some drill cores from Eniwetok Atoll, Marshall Islands______________________ 9584. Densities and specific gravities of drill cores from Eniwetok Atoll, Marshall Islands________________________ 9615. Bulk specific gravity computed from porosity and mean value of true specific gravity._____________________ 961
in

IV CONTENTS
Page TABLE 6. Densities of some Mid-Pacific ocean-bottom sediments, Scripps Institution of Oceanography Mid-Pacific
Expedition of 1950_____________________________________________________. 9617. Observed static-test data for the seventh stress-strain cycle for four drill cores from Eniwetok Atoll__________ 9688. Mean elastic constants, observed and derived, for some Eniwetok drill cores______________________________ 9699. Hardness of some Eniwetok drill cores in arbitrary "scleroscope units"-_________________-___--_______---- 970
10. Comparison hardness measurements on a series of U.S. Bureau of Mines standards_______________________ 97011. Impact toughness of some Eniwetok Atoll drill cores_______--__-___-_-_---_-_-_-_-_--------_-_-_------- 97112. Acid-bottle surveys of Eniwetok drill holes____________________________________-_--__---_---_-_-__ 97413. Magnetic constants for both induced and remanent magnetization of some Eniwetok drill cores____________ 97414. Coefficient of permeability (hydraulic) for Eniwetok cores._________-__--_-_-_--_--_-----_-_---_---_---- 97615. Porosities of Eniwetok drill cores, percent by volume_________________________________________________ 97716. Natural radioactivity of coral limestone in drill hole E-l, Parry Island, Eniwetok Atoll, December 1952______ 97817. Natural radioactivity of the basalt_________________________---_-__------------_-_---__------___------ 97818. Helium content of the basalt_______________________-_____-______--__-__-_-______--------_-_--------- 97819. Speeds of seismic-wave transmission: laboratory measurements.__________________-______-__-_---__--_- 97920. Speeds of seismic-wave transmission: ground surface refraction surveys, Eniwetok Atoll ____________________ 98021. Speeds of seismic-wave transmission: in-hole measurements in drill hole 2B, Bikini island, Bikini Atoll_______ 98022. Speeds of seismic-wave transmission: marine-refraction surveys. A, Bikini Atoll; B, Bikini and Kwajalein
Atolls and Sylvania Guyot; C, Eniwetok Atoll--------___-____----_--_-_-_--__--— _ — __--___-_-_ 98023. Compressive, triaxial-compression, and flexural strengths of some Eniwetok drill cores__-_-_-_-_______-_--_- 98224. Temperature profiles in Eniwetok and Bikini drill holes, and in the Pacific Ocean, Marshall Islands area____ 98325. Thermal conductivity of drill cores from Eniwetok Atoll, Marshall Islands-_____________-___-__-__-___---- 98526. Thermal conductivity of sea-floor sediments collected by the 1950 Mid-Pacific Expedition of the Scripps Institu
tion of Oceanography.____________________________-_______-___-______--_----------------_---- 98627. Heat flow. A, Heat flow in Eniwetok Atoll; B, Heat flow through the ocean floor in the Mid-Pacific area— 98628. Thermal gradients in Eniwetok and Bikini Atolls and for the Pacific Ocean in the Marshall Islands area: gra
dients for linear segments fitted to the data by least squares._________________________________________ 98729. Thermal gradients in Eniwetok and Bikini Atolls and for the Pacific Ocean in the Marshall Islands area: actual
gradients for each measured interval-___________________________________________--_-----_---__----- 987

BIKINI AND NEARBY ATOLLS, MARSHALL ISLANDS
SOME PHYSICAL CONSTANTS FOR THE MARSHALL ISLANDS AREA
By J. H. SWARTZ
ABSTRACT
Measured values of physical properties of some geologic materials in the west Pacific Ocean and the Marshall Islands area, particularly Eniwetok and Bikini Atolls, and including sea-bottom muds, loose coral sands, coral limestone, dolomite, and olivine basalt are as follows: absorption, 6.0 to 20.05 percent; density (grams per cm3) and specific gravity, 1.18 to 2.97; coefficient of absorption for seismic waves, 0.003 to 0.2 per 1,000 feet; elasticity, Young's modulus 0.084 to 10.72 million psi, modulus of rigidity 0.35 to 5.29 million psi, bulk modulus 0.44 to 57.58 million psi, compressibility 0.25 to 33.0 millionths reciprocal bars, Poisson's ratio 0.01 to 0.53; hardness, 13 to 71 scleroscope units; heat flow, 0.74 to 1.4 microcalories per square centimeter per second; impact toughness, 1.01 to 2.86 inches per square inch; magnetic constants, volume susceptibility from less than 2X10~5 to 0.85 X10⁻³ cgs, magnetic permeability 1.0048 to 1.0107 cgs, intensity of remanent magnetization 0.0044 to 0.0183 cgs, Koenigsberger Q factor 21 to 120, inclination 11° to 69°, north end down (no inverse magnetization was observed); hydraulic permeability, 0.00004 to 12.7 meinzers; porosity, 0 to 56.0 percent; mean radioactivity, 0.01 to 0.04 milliroentgens per hour for the upper 924 feet of drill hole E-l, 0.575X 10~12 grams of equivalent radium per gram of basalt; seismic speeds, 1,000 to 27,250 fps or 0.3 to 8.3 kmps; specific damping capacity, 0.007 to 0.03; strength, compressive strength 240 to 28,200 psi, modulus of rupture 850 to 4,100 psi; temperatures, 29.1° to 6.4°C in the drill holes, 27.8° to 4.4°C in the ocean; thermal conductivity 0.00168 to 0.0065°C cal per cm sec °C; and thermal gradients, thermocline —0.030° to — 0.124°C per meter, asthenocline -0.003° to -0.018°C per meter, epeirocline +0.021°C per meter.
INTRODUCTION
During the years 1951-52 several geophysical investi gations were conducted in the Marshall Islands area of the western Pacific Ocean (figs. 290-293). In connec tion with these studies physical constants of some geologic materials were evaluated, both in the field and in the laboratory. As there are very few data on physical properties available for this part of the world it has seemed worth while to gather these data together for easy reference.
The measurements presented were made both in the field and in the laboratory and represent the work or assistance of numerous individuals. Some are the
work of the writer and his associates; some are measure ments made through the cooperation of others on materials furnished by the writer; some, especially the field measurements, were made by others who have very kindly placed their results at the writer's disposal.
The cores used in the measurements came from drill holes on Parry Island, and Elugelab, Engebi, and Mujinkarikku islands, Eniwetok Atoll, and on Bikini island, Bikini Atoll. (See figs. 1-4 for locations.) In some of the measurements, portions of the original cores were used; in others, smaller cores cut from the original cores were used, usually in the form of right circular cylinders 1 inch in diameter and 1 inch long, with ends accurately squared and ground.
As detailed descriptions of the lithology and petrog raphy of the various cores are given in other chapters of Professional Paper 260 (Ladd and Schlanger, 1960; Schlanger, 1962; Macdonald, 1962) only the most generalized statement of rock type is given for the various specimens cited in the present discussion. The reader is referred to the more detailed descriptions for additional petrographic data.
METHOD OF ARRANGEMENT AND PRESENTATION OF DATA
To facilitate reference the physical properties dis cussed are listed in alphabetical order.
The physical constants are presented in 29 tables. Each table is placed at the end of its appropriate section. It is preceded by a discussion in which the property is defined to avoid any question as to its meaning, par ticularly where a term may be used in the literature in different senses; methods of measurement are discussed, units of measurement given, and both instruments and measurement techniques described to permit judgments as to the adequacy of procedures and the accuracy and precision of results. Introductory discussions have been made somewhat detailed for the sake of those readers who have not previously had occasion to famil iarize themselves with the particular property under
953

954 BIKINI AND NEARBY ATOLLS, MARSHALL ISLANDS
Sea-floor heaf-flow station of the 1950 mid-Pacific cruise of the Scripps Institution of Oceanography
500 0
FIGURE 290.—Map of the west Pacific Ocean showing the location of the Marshall Islands and of Mid-Pacific Expedition stations.
discussion or its methods of measurement, or who do not have ready access to reference literature.
ACKNOWLEDGMENTS
It is not possible to acknowledge individually the assistance of the many persons who aided in the collection of the data and the determination of the constants. The writer is greatly indebted to the Office of Naval Research and to the Atomic Energy Commission for their support of the field projects; to C. T. Cooper and H. H. Lewis, of the Atomic Energy Commission; to C. L. Coray, S. P. Howell, J. P. Ryan, and others, of the Holmes and Narver Co., for assist ance with field logistics and field measurements; to the Bureau of Reclamation, and the Bureau of Mines; and especially to Leonard Obert and Byron E. Blair, of the Bureau of Mines, and Arnold I. Johnson, of the Geological Survey, for laboratory measurements on field specimens and drill cores. Particular acknowl edgment is due Rudolph Raspet, W. L. Smith, and C. J. Spengler, Jr., for assistance with field measure ments; to M. E. Lilliard, W. J. Huff, E. D. Saunders, A. L. Baldwin, and S. A. H. Goldstein for laboratory
measurements; to G. E. Manger for numerous helpful discussions; and to H. S. Ladd, who placed at his disposal the drill cores from the various Marshall Islands drill holes.
The writer is indebted also to Professor Francis Birch, of Harvard University, for permission to present his data on heat flux; to Dr. P. M. Hurley, of the Massachusetts Institute of Technology, for permission to present his measurements of radioactivity; and to Drs. Roger Revelle, Arthur E. Maxwell, Russell W. Raitt, and Walter Munk, of Scripps Institution of Oceanography, for sea-floor heat-flow, seismic, and ocean-temperature profile data.
PHYSICAL CONSTANTS
ABSORPTION OF WATER
Absorption of water may be defined as the percentage increase in weight of a dry body when saturated with water. Methods of determining the dry and saturated weights and of drying and saturating specimens are discussed hi detail in the section on "Density and specific gravity".

SOME PHYSICAL CONSTANTS FOR THE MARSHALL ISLANDS AREA 955
EXPLANATIONo
Capricorn Expedition. Scripps Institution of Oceanography therrnal station
oB Bathythermograph station
oN Nansen-bottle station
0 E-1 Drill hole
10-14-52 Date
Y. TAONGI I/ ATOLL
N ?0-15-52
B 10-14-52
. BIKAR ATOLL
E-li Parry Island
Eniwetok Island
o B11-12-52
BIKINI ATOLL
Blkmi Island RONGELAP
ATOLL
AILINGINAE ATOLL
RONGERIK ATOLL
UTIRIK ATOLL
ATOLL
pi WOTHO N) ATOLL
AILUK ATOLL
Mejit Island
LIKIEP ATOLL
KWAJALEIN ATOLL
LAE ATOLL
WOTJE ATOLL
Kwajalein Island
ERIKUB k ATOLL
MALOELAP ATOLL
FIGUBE 291.—Map of northwestern Marshall Mands showing the location of Eniwetok and Bikini Atolls and of ocean-temperature observation stations.
If a is the percent absorption, w0 the oven-dried weight, wa the air-dried weight, and ws the saturated, surface-dried weight,
(1)
The use of the air-dried instead of the oven-dried weights introduces negligible error. Experiments by the Bureau of Mines (Obert, Windes, and Duvall, 1946, p. 47) have indicated that the two weights rarely differ by more than about 0.02 percent.
Values of the absorption of water by drill cores from Eniwetok Atoll, Marshall Islands, are given in table 1.
TABLE 1.—Percent absorption of water in limestone drill coresfrom Eniwetok Atoll, Marshall Islands
[Measured by U.S. Bureau of Reclamation]
Core
EN-8. — — -EN-9...—-.EN-10————
Depth (feet)
90. 5-91. 095. 0-96. 081. 0-82. 0
Absorption (percent
by weight)
7.1220.0520.05
Core
EN-11- — ——MU-5— —— .MU-7-. -----
Depth(feet)
8.0- 9.038. 1-70. 581. 5-82. 0
Absorption (percent
by weight)
6.017.820.05
ATTENUATION CONSTANTS
Two types of attenuation constants were measured in the present investigation: the coefficient of absorp tion and the specific damping capacity, the former in the field, and the latter in the laboratory.
COEFFICIENT OF ABSORPTION
Perkins (1952) has derived values of the absorption coefficient for the refracted seismic waves in the second and third layers (Dobrin, Perkins, and Snavely, 1949) in Bikini Atoll on the assumption that, for the shot-detector distances involved, the refracted waves along the layers may be represented adequately by a cylindrical wave whose equation is
- (2)
where AI and A2 are the amplitudes of the waves at distances r\ and r2 respectively from the shot point, and a is the coefficient of absorption. Solving for a,
logi iri— logip A 2r2 Z— ri)logi0 e
(3)

956 BIKINI AND NEARBY ATOLLS, MARSHALL ISLANDS
162°00' 162° 10' 162°20'
162°10' 162°20'
FIGURE 292.—Map of Eniwetok Atoll showing locations of Elugelab, Engebi, and Mujinkarikku islands and of Parry Island, and of drill holes E-1, F-1, EN-8, EN-9, EN-10,EN-11, MU-5, and MU-7.

SOME PHYSICAL CONSTANTS FOR THE MARSHALL ISLANDS AREA 957165° 30'
I65°30'
FIGURE 293.—Map of Bikini Atoll showing location of Bikini and of drill hole 2B.
The observed values of A and r are shown in figure 294, after Perkins (1952) and Dobrin and Perkins (1954), where the relative amplitudes of the first arrivals, whose frequencies ranged from 9 to 10.5 cycles per second, are plotted against the corresponding distances from the shot, using logarithmic scales. Solution of equation (3) for these points has yielded the mean values of a given in table 2.
SPECIFIC DAMPING CAPACITY
The specific damping capacity is defined as the ratio of the energy dissipated per cycle to the total vibra- tional energy of the wave (Obert, Windes, and Duvall, 1946, p. 7). It is determined by a small additional step in the procedure for determining seismic speeds dynamically by the sonic method. (See p. 965 to 966, 979 of this report.) After the maximum amplitude (Am) has been attained and the corresponding resonant frequency (fr) determined, the frequency of oscillation is altered until the amplitude of vibration (^4.) drops to K V^m- Two such points will be found, one at a higher and one at a lower frequency than the resonant fre quency. If A/ is the difference in frequency between these two points, 5 the specific damping capacity, AC7 the wave energy dissipated per cycle, and U the total vibrational energy of the wave,
U fr(4)
The values of the specific damping capacity for Eniwetok drill cores, as determined by the Applied Physics Branch of the U.S. Bureau of Mines, are given in table 3. As seen in equation (4), 8 is a dimensionless quantity.
It may be noted (Obert, Windes, and Duvall, 1946, p. 7) that in the sonic method of the Bureau of Mines
63130&—162———2
the signs vibratior Duvall ( such as resonanc curve in
1000-
800-
600-
500-
300-
150-
100-
C/5 DUUJ
D l5 40-a. ^ < 30 .UJ !> oc
<UJ *Uor
10-
6-
5-
4-
2-
1-
u
il amplitude is a function of the velocity of i, not of its amplitude. However, Obert and 1941) have shown that for small values of A/, are here involved, the use of the velocity- e curve instead of the amplitude-resonance troduces negligible error.
i 1 »
••
e
j
•
)
X
X X
X
>DO OO O OOO OOO OO
8 00 o ooo ooo oo OO O OOO OOO OO
•) 10 co Q in o m" o o o o" o o"-H -H Cvj CJ CO ^^Jfi~ (O 00 O
SHOT-DETECTOR DISTANCE, IN FEET
FIGURE 294.—Variation of relative amplitudes of first arrivals with detector-shot distance. The relative amplitudes of the waves refracted along the second (11,000 fps) layer are shown by circles; those along the third (17,000 fps) layer shown by crosses.

958 BIKINI AND NEARBY ATOLLS, MARSHALL ISLANDS
TABLE 2.—Mean values of the coefficient of absorption for refracted waves in seismic layers 2 and S, Bikini Atoll
[Data by Beauregard Perkins, Jr. Computed from measurements made in a marine refraction seismic survey by Dobrin, Perkins, and Snavely (1949)]
Assumed rock
Limestone. _________________Igneous, probably basalt __
Seismic speed (fps)
11, 00017, 000
Coefficient of absorption: fractional
energy dissipated per 1,000 feet
0.2.003
TABLE 3.—Specific damping capacity (5) for three drill cores from Elugelab island, Eniwetok Atoll, Marshall Islands
[Measurements by Applied Physics Branch, U.S. Bureau of Mines]
Rock
Dolomite. ____
Core
F-l-5-4______F-l-6-2______F-l-12-6 _ .
Depth (feet)
1, 978-2, 0032, 662-2, 6874, 316-4, 341
Specific damping capacity: fractional energy dissipated
per cycle
0.01.007.03
DENSITY AND SPECIFIC GRAVITY
Two types of density are customarily determined: bulk density and true or grain density. Bulk density is the mass of the body divided by its external volume. It is thus the density of the specimen rather than of the material composing it. It includes within its volume not only the volume of the solid portion of the specimen but also of its voids and pores, both per meable and impermeable. True or grain density is the density of the material composing the body. It equals the mass of the solid portion of the body divided by the volume of the solid portion, that is, by the external or bulk volume minus the volume of the permeable and impermeable voids and pores.
Specific gravity is the ratio of the weight of the body to the weight of an equal volume of distilled water. The weights should be determined in vacuo and the distilled water should be air-free, but for practical reasons these conditions are rarely met. Weights are usually measured in air, and the water usually contains the volume of air that can be dissolved at the ambient temperature and pressure. For most purposes this procedure is adequate. When it is not adequate, air- free water must be used and weighing done in vacuo as required.
The American Society for Testing Materials recog nizes four types of specific gravity: absolute specific gravity, specific gravity, apparent specific gravity, and bulk specific gravity. Absolute specific gravity is de fined (ASTM, 1952c, p. 1594-1595) as the "ratio of the weight referred to vacuum of a given volume of the material at a stated temperature to the weight
referred to vacuum of an equal volume of gas-free distilled water at a stated temperature." Specific grav ity is defined as the "ratio of the weight in air of a given volume of the material at a stated temperature to the weight in air of an equal volume of distilled water at a stated temperature". Apparent specific gravity is defined as the "ratio of the weight in air of a given volume of the impermeable portion of a per meable material—that is, the solid matter including its impermeable pores or voids—at a stated tempera ture to the weight in air of an equal volume of dis tilled water at a stated temperature". Bulk specific gravity is defined as the "ratio of the weight in air of a given volume of a permeable material (including both permeable and impermeable voids normal to the material) at a stated temperature to the weight in air of an equal volume of distilled water at a stated tem perature". The "material" in the terms "absolute spe cific gravity" and "specific gravity" refers to the solid material of which the body is composed, excluding any voids or pores, permeable or impermeable. The ASTM term "specific gravity" is frequently referred to in the literature as "true specific gravity". The term "bulk spe cific gravity" is frequently referred to in the literature as "apparent specific gravity". To avoid confusion, in the present discussion the term ''true specific grav ity" will be used for the specific gravity of the solid material excluding voids and pores, both permeable and impermeable, and the term "bulk specific gravity" will be used for the specific gravity of the specimen including all voids and pores, both permeable and impermeable.
The weight of the body should be, strictly speaking, the weight of the specimen minus its included mois ture. This is difficult to obtain as all bodies contain both adsorbed and capillary water, and frequently free moisture as well. It is standard practice to use the oven-dried weight, (w0 ) as the weight of the body. To obtain this the body is dried for 24 hours or more in an oven at a temperature of 105° to 110°C, then cooled to room temperature, preferably in a dessicator, and then weighed on a balance in air.
In the present investigation, because of the danger of altering other and more critical properties by heat ing, the specimens investigated by the Bureau of Mines and by the Geological Survey could not be oven-dried, and the air-dried weight (wa ) of the specimen was used. In determining the air-dried weight the specimen was dried, actually for a period of several months, in the laboratory under normal atmospheric conditions of temperature, pressure, and humidity. This would re move free water and part of the capillary water but would still leave the adsorbed water and part of the capillary water, especially that in the finer pore spaces.

SOME PHYSICAL CONSTANTS FOB THE MARSHALL ISLANDS AREA 959
The air-dried weight is thus slightly greater than the oven-dried weight. However, as previously noted on page 955, error from this source is negligible for most practical purposes.
The volume of the specimen or material for density measurements, or the weight of an equivalent volume of distilled water for specific gravity measurements may be obtained in several ways, depending upon the par ticular volume or weight desired, and the particular technique most convenient. The external or bulk vol- UEi6 (Vi>) of the specimen, that is the volume including the volume of its voids and pores, both permeable and impermeable, may be gotten geometrically, or by weighing. In the present investigation the specimens were all carefully prepared right circular cylinders, with accurately squared and ground ends. After carefully measuring the length of the cylinder and making a number of micrometer measurements of the diameter of the cylinder the bulk volume may be calculated from the equation
F6=I^ (5)
where D is the mean diameter and h is the height of the cylinder. Because the micrometer will not fit into re entrants in the sides of the cylinder, the external volume so determined will be slightly too large, but the differ ence for most practical purposes may be regarded as negligible.
The external volume may also be obtained by weigh ing in a fluid of known density. In one method, the method used by the U.S. Geological Survey, the specimen is dipped in melted paraffin to seal the external pores. The coated specimen is first weighed in air, and then completely immersed in water. If wa is the weight in air before being coated with paraffin, wpe the weight in air after being coated with paraffin, wpi the weight com pletely immersed in water after being coated with paraffin, pw and pP the densities of the water and paraf fin at the temperature of the measurements, and F6 is the bulk volume, we have
_Wvc — UJpj t
Pw(6)
All quantities must, of course, be measured in the same system of units.
If the units are all in the cgs system the equation may be still further simplified. At room temperature the cgs density for water differs by only three parts per thousand from unity. It is usually adequate therefore to accept its value as pw=l. The density of paraffin is 0.9 gm per cm3 at room temperatures. Inserting these values, equation (6) reduces to
=1.11 Wa — 0.11 Wpe — (7)
In a second method, employed by the Bureau of Mines, the Bureau of Reclamation, the Geological Survey, and others, the specimen is not coated. In stead the air-dried specimen is first thoroughly satu rated with water. This may be done in a number of ways with varying degrees of completeness. It may simply be soaked for several days completely immersed in water. It may be similarly soaked but under a partial vacuum (usually 20 inches or less of mercury), or under pressure (on the order of 500 psi). Or, while completely immersed in water, it may be heated or boiled under vacuum, pressure, or both alternately.
After the specimen has been saturated, all surface water must be removed, but none of the pore water. This may be done by rolling the specimen on a piece of linen or cotton cloth which has first been saturated with water and then squeezed until it barely stops dripping. If the cloth is too dry it will remove some of the pore water; if it is too wet it will not remove all the free surface water. The saturated specimen— usually referred to in the literature as "saturated, surface-dried"—is then weighed in air in a balance and its saturated surface-dried weight, w3, recorded. It is then suspended completely immersed in water and its weight when so immersed, wi} recorded. The loss of weight on immersion is, of course, the weight of the water displaced by the external or bulk volume of the specimen. From this
(8)P«r
Or, if all measurements are in cgs units, and if pw at room temperature is accepted as effectively equal to 1,
Vb=wt-Wi (9)
It is immediately apparent that the bulk density, p6, of the specimen is then given by the equation
Wapa,
or, if ptc=l and cgs units are used,
(10)
(11)
Similarly, if 76 is the bulk specific gravity, we have
76= (12)
which holds for any system of units.The true density and true specific gravity require
the elimination of the effects of the pores and voids, both permeable and impermeable. This may be accomplished by pulverizing a portion of the specimen to break down the septa between the communicating

960 BIKINI AND NEARBY ATOLLS, MARSHALL ISLANDS
and noncommunicating pores, thus making all the voids permeable, and then weighing the powdered sample first dry and then completely immersed in water in a pycnometer (ASTM, 1942e, p. 281-282). In this method the sample is pulverized to pass a 100-mesh screen. An empty pycnometer, together with its capillary stopper, is weighed. Let this weight be WP . A small portion of the pulverized sample is placed in the pycnometer and both are weighed, to gether with the capillary stopper. Let the weight of pycnometer, stopper, and sample be wps . The pycnom eter is then partly filled with distilled water and the sample stirred until thoroughly mixed with the water. It is then placed under a vacuum of 0.5 to 1.0 inch of mercury long enough to remove all the entrapped air. The pycnometer is then filled to the top of the stopper with distilled water at room temperature and any excess water at the tip of the capillary removed by filter paper. Let its weight so filled be wpsw . Let the pycnometer then be completely emptied and refilled with distilled water alone, again to the top of the stopper, with any excess water being removed by a piece of filter paper. Let wpw be the weight of the water-filled pycnometer. If wg is the weight of the pulverized sample placed in the pycnometer, often called the grain weight, and Vg the volume of its solid portion, often called the grain volume, wd the weight of the water displaced by the solid portion of the sample, ww the weight of the water required to fill the empty pycnometer, and p t and jt the true density and true specific gravity, respectively, of the specimen, we have
v —*~ (13)
from which
7(=^= _ MM-"* _ (14)
Pt=ytPw (15)
The densities and specific gravities determined for drill cores from the Marshall Islands are given in table 4.
Additional values of the bulk specific gravity were obtained indirectly by computation from the porosities. If Pt is the total porosity in percent of volume,
Pt_vb-vt xiooor
Vb 100
It may be shown that
76.
so that, from equation (17)
>=« *—165,
(16)
(17)
(18)
(19)
Determinations by the Bureau of Keclaniation of the true specific gravities of 13 specimens of coral limestone from Eniwetok Atoll gave an average value of 2.77. This value was used in computing the bulk specific gravities given in table 5.
The wet densities of a series of sea-bottom samples collected by the Scripps Institution of Oceanography during the Mid-Pacific Expedition of 1950 (fig. 290) are given through the courtesy of Drs. Roger Revelle and Arthur E. Maxwell in table 6. Densities and moisture content were determined by D. W. Butler, of the National Physical Laboratory of England.

SOME PHYSICAL CONSTANTS FOR THE MARSHALL ISLANDS AREA
TABLE 4.—Densities and specific gravities of drill cores from Eniwetok Atoll, Marshall Islands
Measured by USBM=Applied Physics Branch, U.S. Bureau of MinesUSBR=Concrete Laboratory, U.S. Bureau of Reclamation USQS=U.S. Geological Survey
961
Rock
Basalt. _ _______ _
Core
E-l-1-13 __ _ ..E-l-3-21.— __-._E-l-4-3 A__— .._E-1-4-3B-— _--.E-1-4-9-- _-__ __E-l-5-l_.________E-l-5-2— .-._._.E-l-5-5__________E-l-5-6-___-_.___E-l-5-ll__..__.._E-l-6-2A________E-1-6-2B-— _.__
F-l-3-6--_--_-___F-l-4-l__________F-l-5-4____ ______F-l-6-2__________F-l-ll-31.____.__F-l-12-6- ______F-l-14-18— _____F-l-14-19 _ _ _ _
EN-8—— —————EN-9____._-_____EN-10——— ————EN-11___________
MU-5__---___.__MU 7_. _________
Depth (feet)
2, 003-2, 128 4, 078-4, 100 4, 208-4, 211 4, 208-4, 211 4, 208-4, 211 4, 211-4, 216 4, 211-4, 216 4, 211-4, 216 4, 211-4, 216 4, 211-4, 216 4, 216-4, 222 4, 216-4, 222
1, 232-1, 248 1, 718-1, 740 1, 978-2, 003 2, 662-2, 687 4, 197-4, 222 4, 316-4, 341 4, 500-4, 525 4, 500-4, 525
90. 5-91. 0 95. 0-96. 0 81. 0-82. 0
8. 0- 9. 0
38. 1-70. 5 81. 5-82. 0
Location
———do———— ————— —
——— do———— ———— ————— .do— — ——— _. —————— do—— ——— ———— ————do.——— ———— — —
do _. .——— do————— —— ———————do——— —— ——————.....do— . _ _ — ._ — _.._———do—————— —————
———do— ——— ——————.....do.. .-_-__ -----------——— do———— ————— .———— do———— ——— ————_.___do— ____ — .._- ———.....do— . — --_ — . — .———do——— —— ——— ———
..__. do... — ———— ————
.....do— ————— _ ————_____do__--_--_--_--__--_-
——— do——— ——— —————
Specific gravity
Bulk
1. 212. 31
2. 251. 832. 512.391.842. 531. 891 RQ
2.25 1. 79 1.79 2.35
1.82 1. 79
True
2. 75 2.82 2.82 2.75
2.76 2.82
Density
Bulk (gper cm3)
2.832.972. 862. 842. 962.932. 752. 692. 562. 66
True (gper cms)
Measured by-
USBM USBMUSGS USGS USBMUSGS USGS USGS USGS USGS USGS USGS
USBM USBM USBM USBM USBM USBM USBM USBM
USER USER USER USER
USER USER
TABLE 5.—Additional values of bulk specific gravity computed from total porosity and mean value of true specific gravity
Rock
Limestone-
Core
E-l-2... F-l-1... F-l-9... F-l-10.. F-1-13-.
Depth (feet)
2,802-2,808 170-191
3, 655-3, 665 3,963-3,988 4, 406-4, 431
Location
Parry Island __ Elugelab island ...
.....do _ ........—— _do— — .... .
Specific gravity
Bulk
1.98 1.58 1.78 1.74 2.24
True
2.77 2.77 2.77 2.77 2.77
Total porosity (percent)
28.7 43.0 35.9 37.1 19.1
TABLE 6.— Densities of some mid-Pacific ocean-bottom sediments, Scripps Institution of Oceanography, Mid-Pacific Expedition of 1950
[Measurements by D. W. Butler, National Physical Laboratory of England. Courtesy of Eevelle and Maxwell]
Station
21-1.————————32.. ——— . —— — — ———35-2._ _ ....... ___ ...35-2......-..-- ....... —36. — — .—36—————— ——— —— —38.——————— ——— —38 .. .. „
Location
Lat. N.
20°48' 18°18' 19°28' 19°28' 16°45' 16°45' 19°2' 19°2'
Long. W.
159°42' 173°23' 174°35' 174°35' 176°24' 176°24' 177° 19' 177°19'
Depth below sea
floor (inches)
38^-42^ 24-28 24-27 76-79^ 53-57 79-84^
271-2-31^ 75}|-79^
Moisture content (percent
wet weight)
52 -56.5 50
42. 5-43. 5 58 52.5 52
67. 5-71. 5 61 -62.5
Wet density
(g per ml)
1.43-1.38 1.47
1. 58-1. 57 1.35 1.41 1.40
1. 22-1. 18 1.27
ELASTIC CONSTANTS
When an elastic body is subjected to an external force it is changed in size or shape, or both. When the force is relieved, the body will return to its original size or shape, provided the force is less than a certain critical value. If it is greater than that value, the body receives a permanent set. The external force exerted on the body is termed the load. It is resisted by internal elastic forces which at equilibrium are equal and oppo site to the external force and thus determine and limit the amount of the distortion. The intensity, or force per unit area, of the external force and of the equal but opposite internal elastic reaction are called the stress. The stress at which the first permanent set appears is termed the elastic limit of the body.
The amount of change under load in the size or shape of the body per unit original dimension is called the strain. It may be a change in a lineal direction, in the angle between lineal dimensions, or a change in volume. Whatever its type it is always expressed as the amount of change per unit original quantity.
Hooke in 1676 discovered experimentally that as long as stresses did not exceed (or closely approach) the
962 BIKINI AND NEARBY ATOLLS, MARSHALL ISLANDS
elastic limit the strain or elongation in a given wire under tension from different suspended weights was proportional to the applied load; in other words, inversely,
stressstrain
= constant (20)
Later investigators have extended this from the case of tension to any type of elastic stress and strain. The constant so determined is referred to as the elastic constant or modulus for that type of stress.
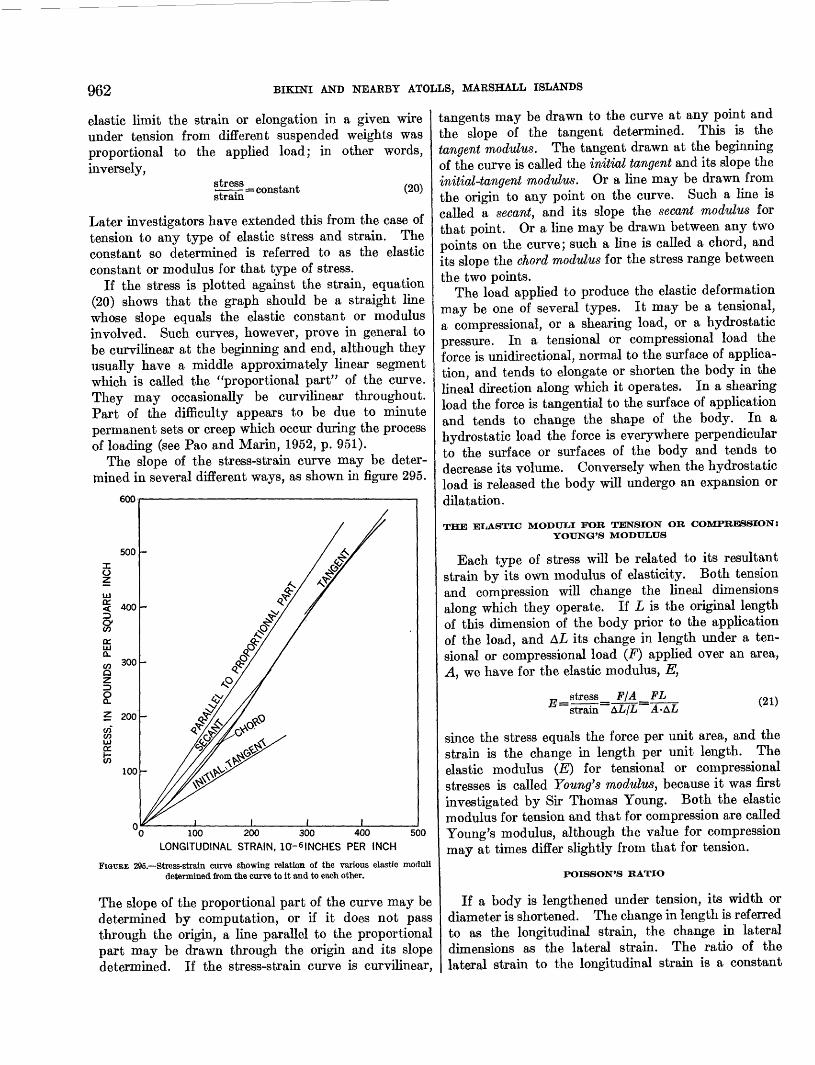
If the stress is plotted against the strain, equation (20) shows that the graph should be a straight line whose slope equals the elastic constant or modulus involved. Such curves, however, prove in general to be curvilinear at the beginning and end, although they usually have a middle approximately linear segment which is called the "proportional part" of the curve. They may occasionally be curvilinear throughout. Part of the difficulty appears to be due to minute permanent sets or creep which occur during the process of loading (see Pao and Marin, 1952, p. 951).
The slope of the stress-strain curve may be deter mined in several different ways, as shown in figure 295.
UJ DC
ceUJQ.
en QzoCL
600
500
400
300
5 200en enUJa:
100
100 200 300 400
LONGITUDINAL STRAIN, 1Q-6INCHES PER INCH
500
FIGURE 295.—Stress-strain curve showing relation of the various elastic moduli determined from the curve to it and to each other.
The slope of the proportional part of the curve may be determined by computation, or if it does not pass through the origin, a line parallel to the proportiona part may be drawn through the origin and its slope determined. If the stress-strain curve is curvilinear
•angents may be drawn to the curve at any point and the slope of the tangent determined. This is the angent modulus. The tangent drawn at the beginning of the curve is called the initial tangent and its slope the initial-tangent modulus. Or a line may be drawn from the origin to any point on the curve. Such a line is called a secant, and its slope the secant modulus for jhat point. Or a line may be drawn between any two points on the curve; such a line is called a chord, and ts slope the chord modulus for the stress range between lihe two points.
The load applied to produce the elastic deformation may be one of several types. It may be a tensional, a compressional, or a shearing load, or a hydrostatic pressure. In a tensional or compressional load the force is unidirectional, normal to the surface of applica tion, and tends to elongate or shorten the body in the lineal direction along which it operates. In a shearing load the force is tangential to the surface of application and tends to change the shape of the body. In a hydrostatic load the force is everywhere perpendicular to the surface or surfaces of the body and tends to decrease its volume. Conversely when the hydrostatic load is released the body will undergo an expansion or dilatation.
THE ELASTIC MODULI FOR TENSION OB COMPRESSION: YOUNG'S MODULUS
Each type of stress will be related to its resultant strain by its own modulus of elasticity. Both tension and compression will change the lineal dimensions along which they operate. If L is the original length of this dimension of the body prior to the application of the load, and Ai its change in length under a ten sional or compressional load (F) applied over an area, A, we have for the elastic modulus, E,
_steess__FM_.fX_ "strain A.L/L A -A
(21)
since the stress equals the force per unit area, and the strain is the change in length per unit length. The elastic modulus (E) for tensional or compressional stresses is called Young's modulus, because it was first investigated by Sir Thomas Young. Both the elastic modulus for tension and that for compression are called Young's modulus, although the value for compression may at times differ slightly from that for tension.
POISSON'S RATIO
If a body is lengthened under tension, its width or diameter is shortened. The change in length is referred to as the longitudinal strain, the change in lateral dimensions as the lateral strain. The ratio of the lateral strain to the longitudinal strain is a constant

SOME PHYSICAL CONSTANTS FOR THE MARSHALL ISLANDS AREA 963
known as Poisson's ratio (/*). Its value usually approx imates 0.25, although it may depart widely from that value. For the core cylinders used in the present investigation,
AD
where L and D are the original length and diameter of the cylinder and AL and AZ> are their respective changes under the applied load.
MODULUS OP RIGIDITY— SHEAR OR TORSIONAL LOADS
If a cube is pushed askew by an applied force, or a cylinder twisted by a torque, the body is distorted by the motion of one plane over another, either trans- lational, rotational, or both. Such a displacement is said to be a shear and the stresses so developed are referred to as shearing stresses. The elastic resistance of the body to such shearing forces is called its rigidity and the ratio of shearing stress to shearing strain is a constant called the modulus of rigidity, usually repre sented by the letter G.
The shearing strain is measured by the displacement in the shear plane per unit length of the body. Thus if the displacement is translational, as in figure 296A, a line perpendicular to the shear plane is rotated through an angle 8 and the displacement, s, in the shear plane is given by
s=L tan 0 (23)
As the angle 0 is small it may replace the tan 8 with negligible error. From this, recalling that the strain is the displacement per unit length,
strain =9
and G, the modulus of rigidity, is given by
~ F
(24)
(25)
where A is the area over which the force F is applied.If a torque, r, is applied to a cylindrical core, such
as those investigated in the present study, a rotational displacement or twist, s, is produced in the cylinder, figure 2965; a longitudinal line is rotated through the angle 8, as before, and the top of the cylinder is rotated through the angle <£. If R is the radius of the cylinder,
Strain = (26)
As the stress is proportional to the strain, which in turn is proportional to the distance from the center of the cylinder, it is obvious that the stress is not a con stant throughout the cylinder. However, it will be a constant for an incremental cylindrical tube of mean
A. TRANSLATIONAL SHEAR
B. ROTATIONAL SHEARFIGURE 296.—Strains produced by (A) translational and (B) rotational shearing
radius, r, and thickness dr. If the increment of stress on this tube is d<r we have, as G is a constant for the material
d<r=G r-£ (27) LI
Also, if dr is the torque on the incremental tube, we have
drda-
whence, combining equations (27) and (28),
(28)
(29)
964 BIKINI AND NEARBY ATOLLS, MARSHALL ISLANDS
Integrating in r from 0 to R, and rearranging,
„ 2Lr(30)
BULK MODULUS (MODULUS OF INCOMPRESSIBILITY)
If an elastic body is placed under hydrostatic pres sure, its volume will decrease with increasing pressure. The elastic constant that represents the ratio of vol umetric stress to volumetric strain is called the bulk modulus or modulus oj incompressibUity, and may be represented by the letter B. We then have
B=AV/V
(31)
where AF" is the change in volume under pressure P, and Vis the original volume before compression. Note that if V is not the volume at zero pressure, this equa tion must be modified to
B=- P2 -Pi (32)
where PI and V\ are the initial pressure and volume, and V2 is the volume at a different pressure, P2 .
The reciprocal of the bulk modulus is called the compressibility or coefficient of compressibility, often des ignated by the letter k.
UNITS USED FOR ELASTIC CONSTANTS
The strain factor is dirnensionless, as both numerator and denominator of the strain are in the same units. The elastic moduli, therefore, which represent the ratio of stress to strain, have the dimensions of the stress, that is of force per unit area. In the English system of units used in engineering practice they are given in pounds per square inch (psi), whereas in the metric system they are usually expressed in kilograms per square centimeter (kg per cm 2). Conversion factors are
1 psi=0.070307 kg per cm2= 68947 d per cm2= 0.068947 bar
1 kg per cm2=14.223 psi.
Poisson's ratio is of course dirnensionless, as both numerator and denominator are in the same units.
The coefficient of compressibility is the reciprocal of the bulk modulus and as such is expressed in reciprocal units. In the cgs system it is usually given in terms of reciprocal bars (bar" 1).
DETERMINATION OF THE ELASTIC CONSTANTS
STATIC METHODS
The elastic constants can be determined either by static or dynamic methods. Under static methods the
core is placed in a testing machine and subjected to a load that is slowly increased at a definite rate. The strain developed is measured, usually at regular inter vals, either directly by a dial indicator sensitive to changes as small as 0.0001 inch, or electrically by means of suitably mounted strain gauges.
In making such tests the time element is important, since creep may occur and invalidate the measurements if too long a time is allowed to elapse during a run. Other factors such as temperature, moisture content, and core dimensions, may also affect the measured values. For these reasons the rate of loading is kept fixed at a standard value, the measurements are carried out at as nearly a constant temperature, usually room temperature, as is possible and convenient, and the core dimensions are either kept to a standard size or are corrected to such a size.
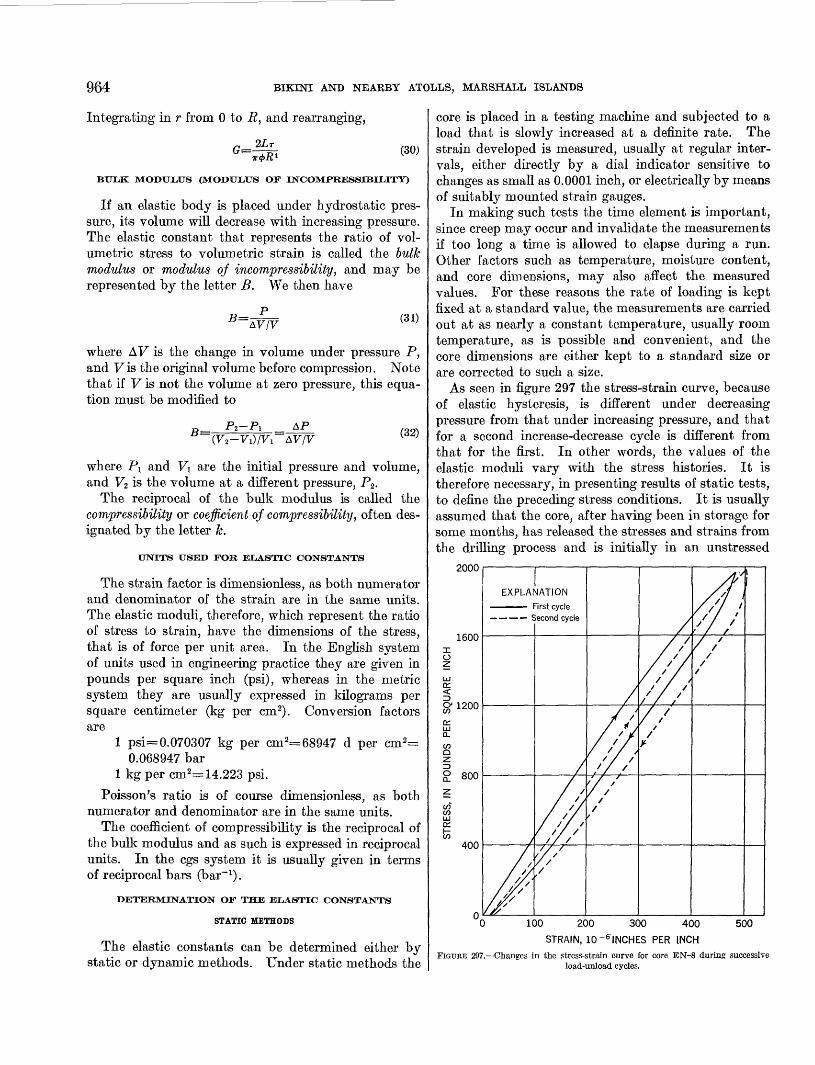
As seen in figure 297 the stress-strain curve, because of elastic hysteresis, is different under decreasing pressure from that under increasing pressure, and that for a second increase-decrease cycle is different from that for the first. In other words, the values of the elastic moduli vary with the stress histories. It is therefore necessary, in presenting results of static tests, to define the preceding stress conditions. It is usually assumed that the core, after having been in storage for some months, has released the stresses and strains from the drilling process and is initially in an unstressed
2000
1600
O- 1200
800
400
0
EXPLANATION———— First cycle
• — — — Second cycle
0 500100 200 300 400
STRAIN, 10 ~6 INCHES PER INCH
FIGURE 297.—Changes in the stress-strain curve for core EN-8 during successive load-unload cycles.
SOME PHYSICAL CONSTANTS FOE THE MARSHALL ISLANDS AREA 965
condition. In any particular case this may or may not be true, but in general it is probably not too seriously in error.
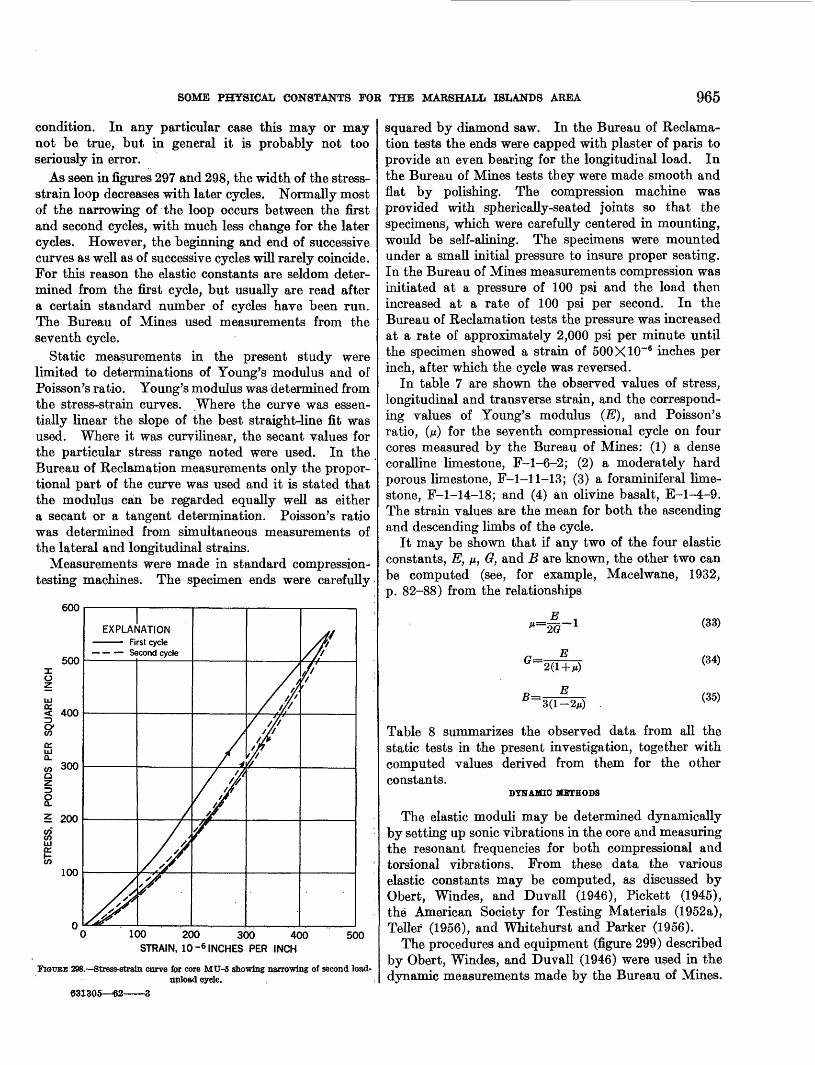
As seen in figures 297 and 298, the width of the stress- strain loop decreases with later cycles. Normally most of the narrowing of the loop occurs between the first and second cycles, with much less change for the later cycles. However, the beginning and end of successive curves as well as of successive cycles will rarely coincide. For this reason the elastic constants are seldom deter mined from the first cycle, but usually are read after a certain standard number of cycles have been run. The Bureau of Mines used measurements from the seventh cycle.
Static measurements in the present study were limited to determinations of Young's modulus and of Poisson's ratio. Young's modulus was determined from the stress-strain curves. Where the curve was essen tially linear the slope of the best straight-line fit was used. Where it was curvilinear, the secant values for the particular stress range noted were used. In the Bureau of Reclamation measurements only the propor tional part of the curve was used and it is stated that the modulus can be regarded equally well as either a secant or a tangent determination. Poisson's ratio was determined from simultaneous measurements of the lateral and longitudinal strains.
Measurements were made in standard compression- testing machines. The specimen ends were carefully
600
EXPLANATION—— First cycle— — Second cycle
100 200 300 400 STRAIN, 10 ~6 INCHES PER INCH
500
"FIGURE 298.—Stress-strain curve for core MU-^5 showing narrowing of second load- unload cyde.
931305—-62——3
squared by diamond saw. In the Bureau of Reclama tion tests the ends were capped with plaster of paris to provide an even bearing for the longitudinal load. In the Bureau of Mines tests they were made smooth and flat by polishing. The compression machine was provided with spherically-seated joints so that the specimens, which were carefully centered in mounting, would be self-alining. The specimens were mounted under a small initial pressure to insure proper seating. In the Bureau of Mines measurements compression was initiated at a pressure of 100 psi and the load then increased at a rate of 100 psi per second. In the Bureau of Reclamation tests the pressure was increased at a rate of approximately 2,000 psi per minute until the specimen showed a strain of 500X10"6 inches per inch, after which the cycle was reversed.
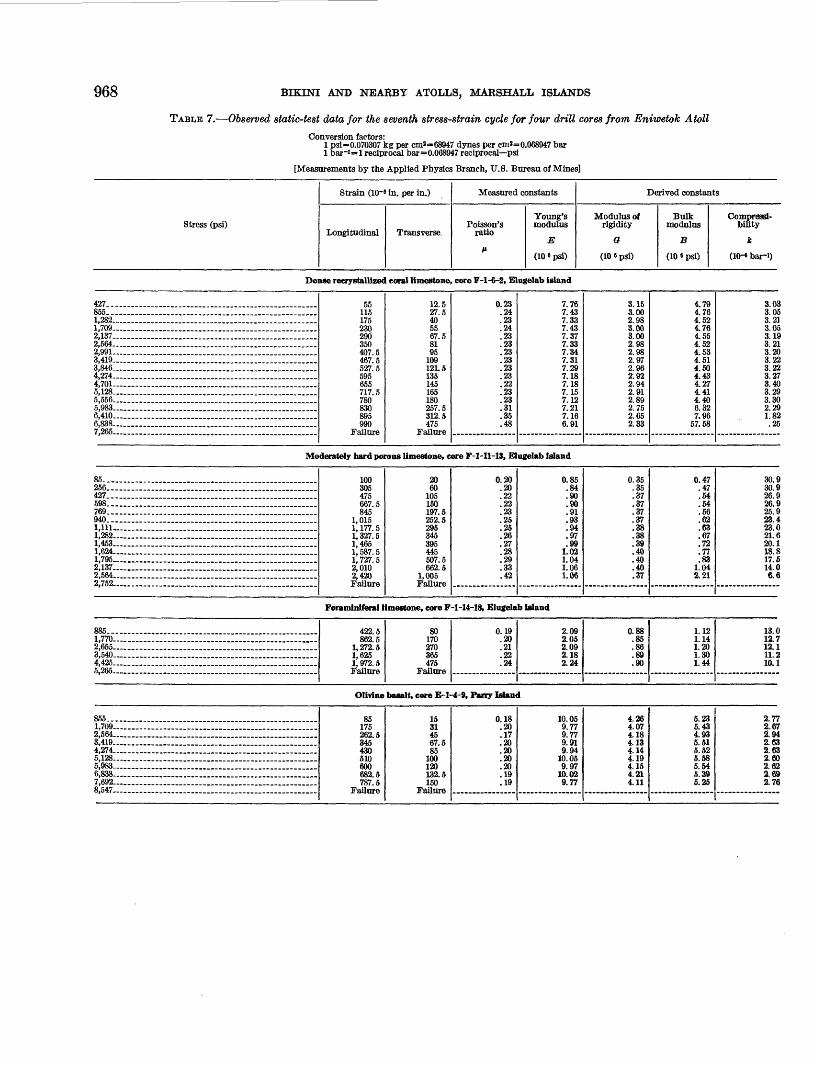
In table 7 are shown the observed values of stress, longitudinal and transverse strain, and the correspond ing values of Young's modulus (£"), and Poisson's ratio, (/z) for the seventh compressional cycle on four cores measured by the Bureau of Mines: (1) a dense coralline limestone, F-l-6-2; (2) a moderately hard porous limestone, F-l-11-13; (3) a foraminiferal lime stone, F-l-14-18; and (4) an olivine basalt, E-l-4-9. The strain values are the mean for both the ascending and descending limbs of the cycle.
It may be shown that if any two of the four elastic constants, E, p, G, and B are known, the other two can be computed (see, for example, Macelwane, 1932, p. 82-88) from the relationships
E
E
B=
'2(1 + M>
B 3(1-2M)
(33)
(34)
(35)
Table 8 summarizes the observed data from all the static tests in the present investigation, together with computed values derived from them for the other constants.
DYNAMIC METHODS
The elastic moduli may be determined dynamically by setting up sonic vibrations in the core and measuring the resonant frequencies for both compressional and torsional vibrations. From these data the various elastic constants may be computed, as discussed by Obert, Windes, and Duvall (1946), Pickett (1945), the American Society for Testing Materials (1952a), Teller (1956), and Whitehurst and Parker (1956).
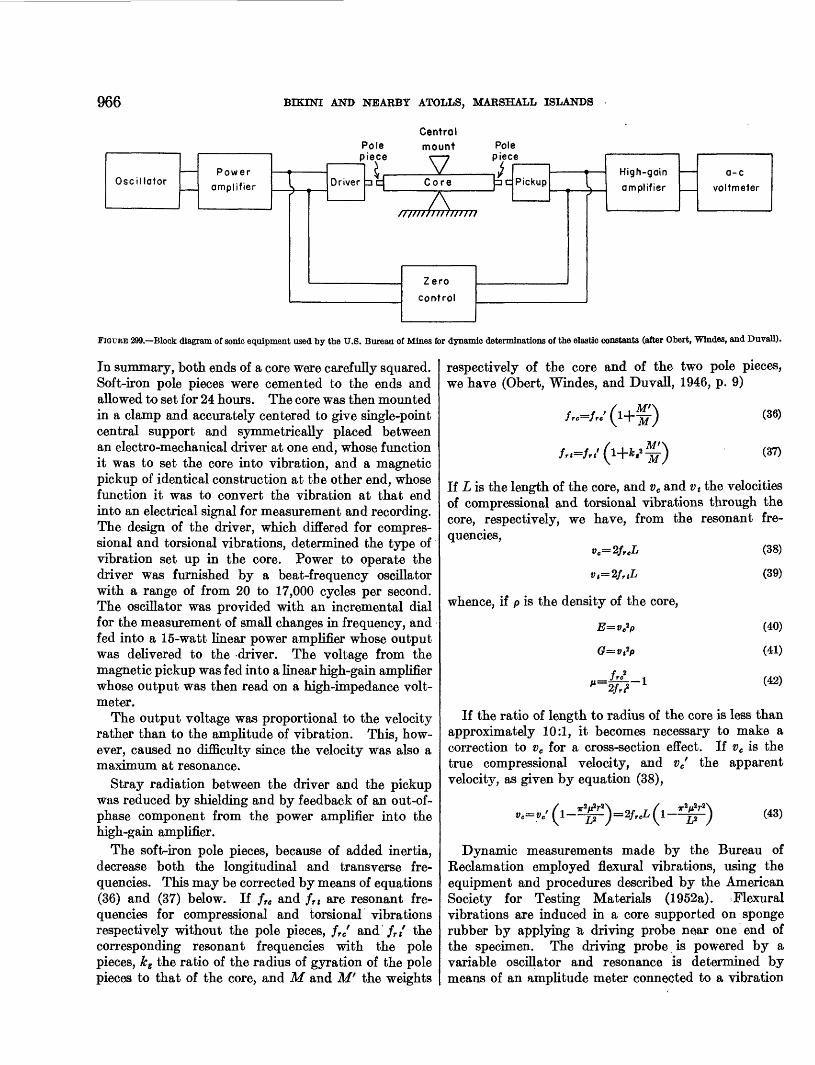
The procedures and equipment (figure 299) described by Obert, Windes, and Duvall (1946) were used in the dynamic measurements made by the Bureau of Mines.
966 BIKINI AND NEARBY ATOLLS, MARSHALL ISLANDS
Oscillaior amplifier 1^
Polepiece
Driver 3 q
/
Central mount
VCore
,U,L,HH///////////////i
Zero
control
Polepiec
•>5e
Pickup 1• —— High-gain — a-c
j amplifier ,,,.,. voltmeter
FIGUEE 299.—Block diagram of sonic equipment used by the U.S. Bureau of Mines for dynamic determinations of the elastic constants (after Obert, WIndes, and Duvall).
In summary, both ends of a core were carefully squared. Soft-iron pole pieces were cemented to the ends and allowed to set for 24 hours. The core was then mounted in a clamp and accurately centered to give single-point central support and symmetrically placed between an electro-mechanical driver at one end, whose function it was to set the core into vibration, and a magnetic pickup of identical construction at the other end, whose function it was to convert the vibration at that end into an electrical signal for measurement and recording. The design of the driver, which differed for compres- sional and torsional vibrations, determined the type of vibration set up in the core. Power to operate the driver was furnished by a beat-frequency oscillator with a range of from 20 to 17,000 cycles per second. The oscillator was provided with an incremental dial for the measurement of small changes in frequency, and fed into a 15-watt linear power amplifier whose output was delivered to the driver. The voltage from the magnetic pickup was fed into a linear high-gain amplifier whose output was then read on a high-impedance volt meter.
The output voltage was proportional to the velocity rather than to the amplitude of vibration. This, how ever, caused no difficulty since the velocity was also a maximum at resonance.
Stray radiation between the driver and the pickup was reduced by shielding and by feedback of an out-of- phase component from the power amplifier into the high-gain amplifier.
The soft-iron pole pieces, because of added inertia, decrease both the longitudinal and transverse fre quencies. This may be corrected by means of equations (36) and (37) below. If fre and frt are resonant fre quencies for compressional and torsional vibrations respectively without the pole pieces, fref and /,/ the corresponding resonant frequencies with the pole pieces, kg the ratio of the radius of gyration of the pole pieces to that of the core, and M and M' the weights
respectively of the core and of the two pole pieces, we have (Obert, WIndes, and Duvall, 1946, p. 9)
'TT)
(36)
(37)
If L is the length of the core, and ve and v t the velocities of compressional and torsional vibrations through the core, respectively, we have, from the resonant fre quencies,
ve=2frcL (38)
v t=2frtL
whence, if p is the density of the core,
(39)
(40)
(41)
(42)
If the ratio of length to radius of the core is less than approximately 10:1, it becomes necessary to make a correction to ve for a cross-section effect. If ve is the true compressional velocity, and ve' the apparent velocity, as given by equation (38),
(43)
Dynamic measurements made by the Bureau of Keclamation employed flexural vibrations, using the equipment and procedures described by the American Society for Testing Materials (1952a). •. Flexural vibrations are induced in a core supported on sponge rubber by applying "a driving probe near one end of the specimen. The driving probe is powered by a variable oscillator and resonance is determined by means of an amplitude meter connected to a vibration

SOME PHYSICAL CONSTANTS FOB THE MARSHALL ISLANDS AREA 967
pickup near the center or near one end of the specimen. The type and mode of vibration are determined by checking the number and location of nodes and the direction of vibration.
If frf is the resonant frequency of the first mode of flexural vibration, w the weight of the core, and Cf a flexural constant whose value is dependent on the shape and physical dimensions of the specunen, the mode of vibration, and on Poisson's ratio,
E= Cfwffj3 (44)
If frt is the resonant torsional frequency, and Ct a similar torsional constant,
G=Ctwfr t* (45)
The evaluation of C/ and Ct is discussed by Pickett (1945, p. 850-853). From these equations and the
values of E and 0 so obtained, the values of Poisson's ratio and of the bulk modulus may be computed from equations (33) and (35), or Poisson's ratio may be computed from the equation
_Cffrj* (46)
Table 8 lists the mean elastic moduli, both observed and derived, as determined by static and dynamic methods.
In figure 11 the values of Young's modulus are plotted against the bulk specific gravities. There is a general increase in E with increase in the bulk specific gravity. However, the points show so much scatter as to make difficult the recognition of a specific relationship.
12.0
11.0
10.0
o? 9.0
E>
USBM sta
i it
USBN
USE
. USBR
+
CPLANATIO o
tic, limestone or a
3BM static, basaX
1 dynamic, limes A
R static, limesti +
dynamic, limes
O
^o—
N
dolomite
It - ————
tone
ane
tone
A
X0
+
A
X
X
Q
-
I<rUJ CL
V) QZ
1
8.0
7.0
6.0
5.0
4.0
3.0
2.0
1.0
1.5 1.6 1.7 1.8 1.9 2.0 2.1 2.2 2.3 2.4 2.5 2.6 2.7 2.8 2.9 3.0
SPECIFIC GRAVITY
FIGURE 300.—Qraph of Young's modulus plotted against specific gravity.
968 BIKINI AND NEAEBY ATOLLS, MARSHALL ISLANDS
TABLE 7.—Observed static-test data for the seventh stress-strain cycle for four drill cores from Eniwetok AtollConversion factors:
1 psi=0.070307 kg per cm*=68947 dynes per em*=0.068947 bar 1 bar-'=1 reciprocal bar=0.068947 reciprocal—psi
[Measurements by the Applied Physics Branch, U.S. Bureau of Mines]
Stress (psi)
Strain (10-« in. per in.)
Longitudinal Transverse,
Measured constants
Young's Poisson's modulus
ratio E
** (10 « psi)
Derived constants
Modulus of Bulk rigidity modulus
O B
(10 « psi) (10 « psi)
Compressi bility
k
(10-« bar-J)
Dense recrystallized coral limestone, core F-l-6-2, Elugelab island
427.... _ ..... _ ..... __ . _ ..... __ ........... ...855.. ........... __ . _ ........ __ . _ ......... _ ..1,282....................................................1,709....................................................2,137... _________________________________________________2,564....................................................2,991....................................................3,419— __..__.___._..„__.___._.._______._._____________3,846....................................................4,274....................................................4,701— .................................................5,128.... _______ .......5,556... _ ........... _ .......... ___ ___ _ .. ...5,983....................................................6,410— .—....—......................................6,838... __________ . _____ .... . _ . _ . ...7,265....................................................
55 115 175 230 290 350 407.5 467.5 527.5 595 655 717.5 780 830 895 990
Failure
12.5 27.5 40 55 67.5 81 «5
109 121.5 135 145 165 180 257.5 312.5 475
Failure
0.23 .24 .23 .24 .23 .23 .23 .23 .23 .23 .22 .23 .23 .31 .35 .48
7.76 7.43 7.33 7.43 7.37 7.33 7.34 7.31 7.29 7.18 7.18 7.15 7.12 7.21 7.16 6.91
3.15 3.00 2.98 3.00 3.00 2.98 2.98 2.97 2.96 2.92 2.94 2.91 2.89 2.75 2.65 2.33
4.79 4.76 4.52 4.76 4.55 4.52 4.53 4.51 4.50 4.43 4.27 4.41 4.40 6.32 7.96
57.58
3.03 3.05 3.21 3.05 3.19 3.21 3.20 3.22 3.22 3.27 3.40 3.29 3.30 2.29 1.82 .25
Moderately hard porous limestone, core F-l-11-13, Elugelab island
85......................................................256 ___ . ___ . _ . ___ . ____ . ___ ...... ......... ...427...., _____ . _____ ... . ... ..... . .... ...598.....................................................769.....................................................940............. ..................... ...................1,111....................................................1,282.— ................................................1,453—— __ . ___ . _ . _ __ .. _ _ . ... . ..1,624....................................................1,795— -.—.-...........,..............................2,137— -,-.-...—.._..—...___.._._._.__..._........„2,564....................................................2,752....................................................
100 305 475 667.5 845
1,015 1, 177. 5 1, 327. 5 1,465 1, 587. 5 1, 727. 5 2,010 2,420 Failure
20 60
105 150 197.5 252.5 295 345 395 445 507.5 662.5
1,005 Failure
0.20 .20 .22 .22 .23 .25 .25 .26 .27 .28 .29 .33 .42
0.85 .84 .90 .90 .91 .93 .94 .97 .99
1.02 1.04 1.06 1.06
0.35 .35 .37 .37 .37 .37 .38 .38 .39 .40 .40 .40 .37
0.47 .47 .54 .54 .56 .62 .63 .67 .72 .77 .83
1.04 2.21
30.9 30.9 26.9 26.9 25.9 23.4 23.0 21.6 20.1 18.8 17.5 14.0 6.6
Foraminlferal limestone, core F-l-14-18, Elugelab island
885.....................................................1,770— .................................................2,655...................................................3,540....................................................4,425— ____ . ___ .. ___ _ . ___ ___ __ ..5,265.. ___ . _____________________________
422.5 862.5
1,272.5 1,625 1, 972. 5 Failure
80 170 270 365 475
Failure
0.19 .20 .21 .22 .24
2.09 2.05 2.09 2.18 2.24
0.88 .85 .86 .89 .90
1.12 1.14 1.20 1.30 1.44
13.0 12.7 12.1 11.2 10.1
Olivine basalt, core E-l-4-9, Parry Island
855.. ____ . ___ . _____ . ______ _______ ...1,709— .................................................2,564....................................................3,419... .................................................4,274... ____________ . ____________ .........5,128— __ .. _____ _____ _ . .. .. ...5,983— ___________ . _________ .. .............6,838....................................................7,692. __________ _ ...8,547— .................................................
85 175 262.5 345 430 510 600 682.5 787.5
Failure
15 3145 67.5 85
100 120 132.5 150
Failure
0.18 .20 .17 .20 .20 .20 .20 .19 .19
10.05 9.77 9.77 9.91 9.94
10.05 9.97
10.02 9.77
4.26 4.07 4.18 4.13 4.14 4.19 4.15 4.21 4.11
5.23 5.43 4.93 5.51 5.52 5.58 5.54 5.39 5.25
2.77 2,67 2.94 2.63 2.63 2.60 2.62 2.69 2.76

SOME PHYSICAL CONSTANTS FOE THE MARSHALL ISLANDS AREA 969
TABLE 8.—Mean elastic constants, observed and derived, for some Eniwetok drill cores
Measured by:USBM=Applied Physios Branch, U.S. Bureau of Mines USB R = Concrete Laboratory, U.S. Bureau of Reclamation
Rock
Basalt _________ . _ . __
Dolomite.. _________ . .......
Core
E-1-4-9.. _._______.._.______
F-l-5-4.. .............. ..F-l-fr-2.. ...................F-l-11-31-.-.— - ..........F-1-12-6.. ________ ..F-l-14-18--- — - ... ... ......
EN-8— ................ ....EN-9.......................EN-10.. _ ............ . ..EN-11......... .............
MU-5—————————. ...MU-5..... ................ ..MU-7.. _ .............
Rock
Depth (feet)
4, 208-4, 222
1, 978-2, 003 2, 662-2, 687 4, 197-4, 2224, 316^, 3414, 528-4, 553
90. 5-91. 0 95. 0-96. 0 81. 0-82. 0
8. 0-9. 0
} 59. 0-70. 5 81. 5-82. 0
Location
Parry Island
Elugelab islar do
id..——— ..... ..... .....
——do-———————————— __ -—— do_.__— ....... ... _ .....———
do
Engebi island do
——.do..——.. ..... —— — — ... ——do — - ——
fMujinkarlkki 1 do::::: d0:::::: :::;: ::: ::: ::: ::: ;::: ::: :::
Core
E-1-4-9.............,.......— _ .... __ ..
F-l-5-4..-.. _ ................. __ .......F-l-6-2.. __ .. _ ............. __ —.....F-l-11-31———————————————————F-1-12-6--.———...—.—.- _ ........F-l-14-18---— _ .——....—— _
EN-8———————————————————EN-9... .......... ———— ————— ————— .EN-10—————————————————————EN-11—————— ............ ........ .... ....
MU-5.————... —————— ————— ————MU-5-....—. ... — - — —— ... —— ..... ..MU-7...... ..——. ... ....... —— ... ......
Depth (feet)
4, 208-4, 222
1,978-2,003 2, 662-2, 687 4, 197-4, 222 4, 316-4, 341 4, 528-4, 553
90. 5-91. 0 95. 0-96. 0 81. 0-82. 0
8.0-9.0
} 59.0-70.5 81. 5-82. 0
Static tests
Measured
JCT
(10« pSi)
9.92
7.28 .95
2.13
4.44 2.50 2.54 5.91
1.10 .95
2.38
M
0.19
.26
.26
.21
.12
.29
.17
.16
.14
.07
.17
Derived
G(10« psi)
4.17
2.89 .38
.88
1.98 .97
1.09 2.55
.48
.44 1.02
B(108 psi)
5.33
5.06 .66
1.22
1.95 1.98 1.28 2.90
.51
.37 1.20
fc (10-« bar-1)
2.72
2.87 21.98
11.85
7.45 7.33
11.30 5.00
28.48 39.39 12.07
Dynamic tests
Measured
E1
(106 psi)
9.18 7.51
10.72
2.82
6.96
{---
G(10« psi)
4.10 3.32
5.29
.92
2.75
Derived
M
0.12 .13
.01
.53
.27
B(106 psi)
4.03 3.38
3.67
4.94
ft (10-6 bar-i)
3.60 4.29
3.95
2.94
Measured by —
USBM
USBM USBM USBM USBM USBM
USERUSER USER USER
USER USER USER
HARDNESS
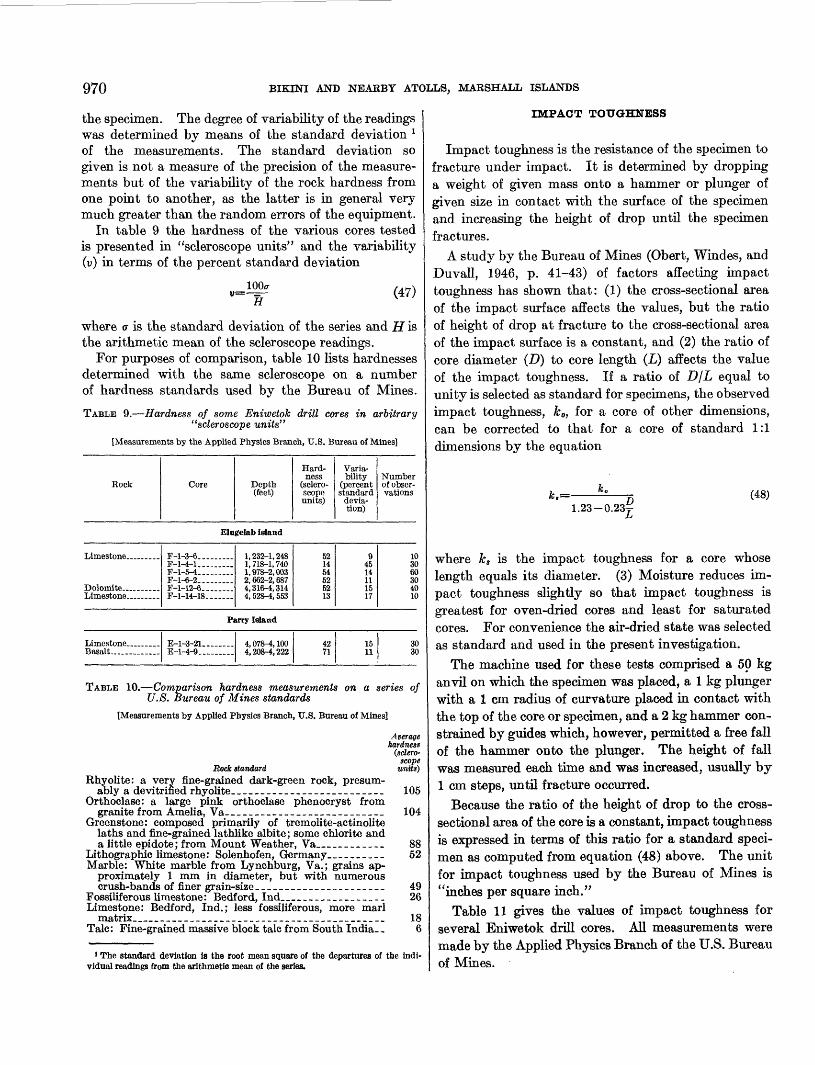
There is no generally accepted definition of hardness. In a general way, hardness may be described as the resistance of a body to penetration by another body (see Williams, 1942). This definition is not entirely satisfactory quantitatively, since it depends on the body doing the penetrating as well as on the body being penetrated, and depends also on the type of equipment being used and on its method of application. Because an absolute method of hardness measurement is not available, and measurements are relative in character, hardness cannot be expressed in terms of a definite and established quantitative unit, but will in general be measured in terms of an arbitrary unit established for a particular method and piece of equipment.
One widely used method of measuring hardness is the rebound method. In this method a hammer with a sharp point of definite dimensions and radius of curvature is dropped from a given height onto the body to be tested and the height of rebound measured. The height of rebound, other factors being constant,
631305—62———4
will depend on the amount of energy used up by the hammer point in penetrating the test body. This in turn will depend on the hardness of the body. Al though the relationship is not a simple one, the height of rebound may thus be used as a measure of the hardness.
The Shore Scleroscope, used by the Applied Physics Branch of the U.S. Bureau of Mines in making the present measurements, employs a hammer with a diamond tip which is dropped from a standard height onto the test body. The height of rebound is measured by a dial graduated in "scleroscope units" found by dividing the average rebound from quenched pure high-carbon steel into 100 equal parts. This will then normally range from 95 to 105 scale divisions, and the scale may be recalibrated at any time by the use of a standard block of such high-carbon steel.
Because hardness may vary from point to point in a rock sample, a series of scleroscope readings were made at different points on each specimen, and their arithmetic mean accepted as the hardness value for
970 BIKINI AND NEAKBY ATOHLS, MARSHALL ISLANDS
the specimen. The degree of variability of the readings was determined by means of the standard deviation * of the measurements. The standard deviation so given is not a measure of the precision of the measure ments but of the variability of the rock hardness from one point to another, as the latter is in general very much greater than the random errors of the equipment.
In table 9 the hardness of the various cores tested is presented in "scleroscope units" and the variability (u) in terms of the percent standard deviation
lOOo-v=—=— H
(47)
where a is the standard deviation of the series and H is the arithmetic mean of the scleroscope readings.
For purposes of comparison, table 10 lists hardnesses determined with the same scleroscope on a number of hardness standards used by the Bureau of Mines.
TABLE 9.—Hardness of some Eniwetok drill cores in arbitrary "scleroscope units"
[Measurements by the Applied Physics Branch, U.S. Bureau of Mines]
Rock Core Depth (feet)
Hard ness
(sclero scope units)
Varia bility
(percent standard
devia tion)
Number of obser vations
Elugelab island
F-l-3-6......—F-l-4-1 „_.___ ...F-l-5-4.-— . ...F-l-6-2-.-— ..F-l-12-6. .......F-l-14-18-.-—
1, 232-1, 248 1, 718-1, 740 1,978-2,003 2, 662-2, 687 4,316-4,314 4, 528-1, 553
52 14 64 52 52 13
9 45 14 11 15 17
10 30 60 30 40 10
Parry Island
Basalt— _____E-l-3-21.. _ ...E-l-4-9.-— ... .
4, 078-4, 100 4, 208-4, 222
42 71
15 11
30 30
TABLE 10.—Comparison hardness measurements on a series of U.S. Bureau of Mines standards
[Measurements by Applied Physics Branch, U.S. Bureau of Mines]
Rock standardRhyolite: a very fine-grained dark-green rock, presum
ably a devitrified rhyolite___._--_________--____-.Orthoclase: a large pink orthoclase phenocryst from
granite from Amelia, Va,----.----------------------Greenstone: composed primarily of tremolite-actinolite
laths and fine-grained lathlike albite; some chlorite and a little epidote; from Mount Weather, Va_________
Lithographic limestone: Solenhofen, Germany________Marble: White marble from Lynchburg, Va.; grains ap
proximately 1 mm in diameter, but with numerous crush-bands of finer grain-size_-____-_______________
Fpssiliferous limestone: Bedford, Ind________________Limestone: Bedford, Ind.; less fossiliferous, more marl
matrix________________________________________Talc: Fine-grained massive block talc from South India. _
Averagehardness
(sdero-scope
units)
105
104
52
4926
18
IMPACT TOUGHNESS
Impact toughness is the resistance of the specimen to fracture under impact. It is determined by dropping a weight of given mass onto a hammer or plunger of given size in contact with the surface of the specimen and increasing the height of drop until the specimen fractures.
A study by the Bureau of Mines (Obert, Windes, and Duvall, 1946, p. 41-43) of factors affecting impact toughness has shown that: (1) the cross-sectional area of the impact surface affects the values, but the ratio of height of drop at fracture to the cross-sectional area of the impact surface is a constant, and (2) the ratio of core diameter (D) to core length (L) affects the value of the impact toughness. If a ratio of D/L equal to unity is selected as standard for specimens, the observed impact toughness, k0, for a core of other dimensions, can be corrected to that for a core of standard 1:1 dimensions by the equation
(48)1.23- -0.23^
LI
1 The standard deviation is the root mean square of the departures of the indi vidual readings from the arithmetic mean of the series.
where ks is the impact toughness for a core whose length equals its diameter. (3) Moisture reduces im pact toughness slightly so that impact toughness is greatest for oven-dried cores and least for saturated cores. For convenience the air-dried state was selected as standard and used in the present investigation.
The machine used for these tests comprised a 50 kg anvil on which the specimen was placed, a 1 kg plunger with a 1 cm radius of curvature placed in contact with the top of the core or specimen, and a 2 kg hammer con strained by guides which, however, permitted a free fall of the hammer onto the plunger. The height of fall was measured each time and was increased, usually by 1 cm steps, until fracture occurred.
Because the ratio of the height of drop to the cross- sectional area of the core is a constant, impact toughness is expressed in terms of this ratio for a standard speci men as computed from equation (48) above. The unit for impact toughness used by the Bureau of Mines is "inches per square inch."
Table 11 gives the values of impact toughness for several Eniwetok drill cores. All measurements were made by the Applied Physics Branch of the U.S. Bureau of Mines.

SOME PHYSICAL CONSTANTS FOR THE MARSHALL ISLANDS AREA 971
TABLE 11. — Impact toughness of some Eniwetok Atoll drill cores [Measured by the Applied Physics Branch, U.S. Bureau of Mines]
Rock Core Depth (feet)
Impact toughness
(in. per in.*)
Number of observa
tions
Elugelab island
F-l-4-1. __F-l-5-4 _ .—.—..F-1-6-2-— — — —F-l-12-6. _ ._...—
1, 718-1, 740 1,978-2,003 2,662-2,687 4,316-4,341
1.18 1.68 1.01 2.86
2 3 1 2
Parry Island
E-l-3-21.. ..........E-l-4-9 _ -—.....
4,078-4,100 4,208-4,222
1.51 1.35
2 1
MAGNETIC CONSTANTS
Three primary magnetic quantities were determined in the present investigation: the susceptibility of the cores studied and the intensity and inclination of their remanent magnetization. The azimuth of the remanent magnetization could not be determined as the cores could not, of course, be oriented in their horizontal plane.
SUSCEPTIBILITY
Susceptibility was determined by the use of a Michel- sen susceptibility bridge (Michelsen, 1952). The Michelsen bridge is basically a Maxwell resistance- inductance bridge equipped with a Wagner ground to minimize the effect of ground admittances. It is pro vided with three identical resistances and three identical inductance coils, as shown in figure 301. Two of the inductance coils and two of the resistances form the four arms of the bridge; the third inductance coil and resistance form the arms of the Wagner ground.
The inductance coils are wound as modified Helm- holtz coils to assure uniformity of field over the sample volume (1X1X1 inches). The inductance coil in one arm of the bridge, the search coil, accepts the sample to be measured. The inductance coil in the other arm, the balance coil, is provided with a cone of ferrite ad mixed with enough permalloy to match the resistive component of magnetite and mounted on a lucite screw moving axially through the coil. Both the balance coil and the inductance coil of the Wagner ground are provided with small adjacent ferrite slugs and resistance
.Reference voltage channel
Preamplifier
Voltmeter Phase meter
FIGURE 301. -Block diagram of Michelsen susceptibility bridge.

972 BIKINI AND NEARBY ATOLLS, MARSHALL ISLANDS
elements which can be adjusted prior to the insertion of the specimen to insure an accurate bridge null before measurements are begun.
To determine the susceptibility of a specimen, it is placed in the search coil and the ferrite cone advanced axially into the balance coil until balance is achieved. The position of the ferrite cone at balance is noted on a^scale which has been carefully calibrated in advance in terms of specimen susceptibility by the use of a series of standard ferric chloride solutions introduced into the search coil.
Because the inductive and resistive components are 90° out of phase, they may be adjusted independently and the two variables separated by the use of phase detection.
Figure 301 gives a block diagram of the instrument setup. Detection of unbalance is accomplished by means of an oscilloscope and a phasemeter. The oscillo scope detects clipping and thus helps adjust proper amplifier amplification. Its primary function, however, is in the coarse adjustment of bridge balance, as the phasemeter quickly goes off scale with a small un balance. When the bridge is unbalanced the oscillo scope shows a typical Lissajous loop. Adjustment of the resistive component narrows this loop to a straight line. Adjustment of the inductive component rotates the straight line into a horizontal position. Final ad justment is then made by the phasemeter. The limit of reliable sensitivity is on the order of 1X10~6 cgs units 2 of susceptibility per cm3 of sample.
Two values of the susceptibility are given in table 13: K the volume susceptibility and x the mass susceptibil ity. The volume susceptibility represents the strength of the magnetic poles generated at any point of the body per unit area perpendicular to the field. If / is the intensity of magnetization per unit volume, or magnetic moment of the material per unit volume (per cm3 in the cgs system), and H the intensity of the magnetic field producing the magnetization,
I= KH (49)
If J is the intensity of magn etization per unit mass (per gram in the cgs system),
(50)
If p is the density of the material, it is obvious that
and(51)
(52)
a The unit of susceptibility has no name. It has the dimensions of p in the elec tromagnetic system of units.
The flux density (B) within the body is related to the intensity, H, of the field and the intensity (7) of magnet ization per unit volume of the material by the equation
(53)
PERMEABILITY (MAGNETIC)
The ratio of the flux density (B) of the field inside the body to the intensity (H} of the field in which the body is placed is called the magnetic permeability (j«), often referred to as the magnetic conductivity of the body:
M=|=l + 4,« (54)
The magnetic permeabilities of the cores are listed in table 13.
REMANENT MAGNETIZATION
Most ferromagnetic materials when subjected to a magnetic field become permanently magnetized to a greater or lesser extent, that is, they retain a measurable intensity of magnetization when the magnetizing field has been removed. Such residual, permanent magneti zation is called "remanent magnetization." If the magnetizing field has been the earth's field, it is called natural remanent magnetization.
Two types of remanent magnetization are observed in rocks: (1) isothermal remanent magnetization, where the permanent magnetization has occurred at ordinary temperatures; and (2) thermoremanent magnetization where the magnetization of the rock has occurred during cooling from a high temperature, usually from a melt or from a temperature higher than the Curie point. Thermoremanent magnetization is usually more perma nent as well as more intense than isothermal remanent magnetization.
To express quantitatively the relationship between remanent and induced magnetization, Koenigsberger (1938) has introduced the quantity Q, whose value is given by the relationship
(55)
where He is the total intensity of the earth's magnetic field; IT and Jr are the intensities of the remanent magnetization per unit volume and per unit mass, respectively; and K.He and xHe are the intensities of induced magnetization per unit volume and per unit mass, respectively, in the same field. Q might be called the coefficient of remanent magnetization. The value of Q usually ranges between 2 and 10: occasionally it exceeds 100, and rarely is less than unity.

SOME PHYSICAL CONSTANTS FOB THE MARSHALL ISLANDS AREA 973
Equation (55) may be written
Ir =QKH, and Jr =QxH. (56)
from which it is seen that the intensity of remanent magnetization is equivalent to induced magnetization under an effective susceptibility of either QK or Qx, as the case may be.
The orientation of the remanent magnetization vector may or may not agree with the earth's present magnetic field. Its relationship to the earth's present field becomes a matter of great interest since it must repre sent the integrated effects of the magnetic, thermal, and geologic history of the specimen. Unfortunately, in the present investigation only the inclination, i, and polarity of the down end of the magnetic remanence vector can be given, as the cores cannot be oriented as to azimuth.
The remanent magnetizations of the cores in the present investigations have been measured by the U.S.
Geological Survey, using the Michelsen remanent magnetometer (Michelsen, 1951). This instrument (figure 302), which was developed through the efforts of the Department of Terrestrial Magnetism of the Carnegie Institution of Washington, measures both the intensity and direction of the magnetization vector in a rock specimen. If the sample is an oriented speci men on which the position of the horizontal plane and the direction of either true or magnetic north have been marked, the orientation of the remanence vector with reference to the earth's present field, and to geographic coordinates is determined.
The remanent magnetometer consists of two coaxial coils, one larger in diameter than the other, con nected in opposition and balanced to cancel out the effects of stray a-c fields. This balance means that magnetic shielding can be omitted, except for materials of very low susceptibility, as the effect of a strong stray a-c field is reduced to about 0.001 of its value by the balanced coils. The sample to be tested is mounted,
Reference voltage channelBalanced coils
L. \~f
filter
Frequency meter I
Amplifier
Bandpass
filter
Amplifier
Attenuator
Voltmeter
FIGURE 302.—Block diagram of Michelsen remanent magnetometer.
Phase rneter Frequency meter

974 BIKINI AND NEARBY ATOLLS, MARSHALL ISLANDS
either as a cube or as a cylinder whose length equals its diameter, in a sample holder in the axis of the coils and spun by an air turbine at a speed of 280 rps, this speed being selected so that the electronic units of the susceptibility bridge can also be used with the rema nent magnetometer. The coupling of the remanent field of the specimen with the inner coil is much greater than with the outer coil, so that the signal from the bridge is effectively that due to the remanent magneti zation alone.
In operation the sample is spun in both direct and reversed rotation about three mutually perpendicular axes in the specimen. The intensity of the field thus induced and the orientation of the reman ence vector with respect to the three axes of rotation are determined and combined vectorially, usually with the use of an equiangular projection net, to give both the intensity and orientation of the remanent magnetization vector.
The drill holes from which the present cores came were satisfactorily vertical as seen in table 12 below, which gives the deviations from the vertical for different depths in the drill holes as determined by an acid-bottle survey.
The inclination of the remanence vector as deter mined by the measurements is therefore of significance, even though the azimuth cannot be determined.
TABLE 12.—Acid-bottle surveys of Eniwetok drill holes
Depth (feet)Deviation from
the vertical (degrees)
Drill hole E-l, Parry Island
1462,000 ___ ._ _.2,802-.-. _-__.4,078—— —— -. 1
Drill hole F-l, Elugelab island
160.- ____ .-1,232.— ______1,650. _________
KI
Depth (feet)Deviation from
the vertical (degrees)
Drill hole F-l, Elugelab island— Con.
19681*9752,470—— ______2,900—— ______3,350—— ____3 9634*1824,197— ___ -.A Aflfi
4,500—--.- ___
5% 3% 4 4
33/4
The direction of the magnetic-north end of the rema nence vector in the core can be determined by means of an astatic magnetometer. However, there is no certainty concerning its relationship to geographic north or to present magnetic north. Moreover, the intensity of magnetization is apt to be altered by proximity to the magents of the magnetometer. It was, therefore, felt desirable not to make this test. Table 13 lists the various magnetic constants for both induced and remanent magnetization determined during the present study.
TABLE 13.—Magnetic constants for both induced and remanent magnetisation of some Parry Island, Eniwetok Atoll drill cores
NOTE.—Susceptibility («) "very weak": less than 2X10-' cgs units, the smallest susceptibility for which the bridge was calibrated.Values of Q are based on the assumption that the intensity of the magnetic field on Eniwetok Atoll was approximately the same at the time of remanent magnetiza
tion as now; that is, 0.341 gauss. Polarity: N, north-seeking pole. Position: Small 1- by 1-in. cylinders were cut out of a large drill core: T from the top; B from the bottom; and M, from the middle of the large core.
[Measurements by the U.S. Geological Survey]
Rock
Limestone ____________
Basalt. ——— . —— __ ... __ .. ...
Core
S-l-1.. .........................E-l-2.. „_„__„ _ . __ .......E-l-3 _____ .... ..............
E-1-4-3-. -„.„...._..._.. __ .
E-1-5-1-. ___ . _ ..... ........
E-1-5-2-- .......................
E-l-5-5... _______ . .........
E-1-5-6.. ___ . _ .... ........
E-l-6-11..... __________ .E-1-6-2-. ___ .... __ . ........
Depth (feet)
170-191 2, 802-2, 808 4, 078-4, 100
4,208-4,211
4,211-4,216
4,211-4,216
4,211-4,216
4,211-4,216
4, 211-4, 216 4,216-4,222
Induced magnetization
(HHcgs)
Very weak Very weak Very weak
0.60 .79 .85
.45
.46
.38
.66
.70
.65
.64
.63
.63
.71
.71
.58
.52
.52
.60
.48
.48
.52
.49
(10-»cgs)
0.21 .28 .30
.16
.16
.13
.22
.24
.22
.22
.22
.22
.24
.24
.21
.19
.19
.22
.17
.18
.20
.19
M
1.0075 1.0099 1. 0107
1.0057 1.0058
1.0048 1.0083
1.0088 1.0082 1.0080 1.0079 1.0079 1.0089 1.0089
1.0073 1.0065 1.0065 1.0075 1.0060
1.0060 1.0065 1.0062
Remanent magnetization
Ir (10-»cgs)
4.4 10.4 7.8
8.66 9.14
15.50 18.30
16.5 12.5 16.0 14.5 17.9 17.9 17.5
12.9 8.0 6.7 7.0 9.3
6.01 12.8 5.8
Q
21 39 27
56 58
120 81
69 56 73 67 83 74 72
65 45 38 34 57
37 72 35
i (degrees)
44 69
58 37
53 53
60 62 63 67 55 62
68 60 48 48 48
30 29 11
Polarity (end
down)
N N
N N
N N
N N N N N N N
N N N N N
N N N
Core position
T BM
T B
T B
T B T M B T M
T B T M B
T T B

SOME PHYSICAL CONSTANTS FOR THE MARSHALL ISLANDS AREA 975PERMEABILITY (HYDRAULIC)
The hydraulic permeability, often called the coeffi cient of permeability, is the capacity of rocks or soils to transmit water under pressure. It is determined hi the laboratory by measuring the rate at which water will percolate through a specimen or sample of given cross-sectional area and length under a given gravity head.
If V is the volume of water passed through the specimen, h the hydraulic head—that is, the difference in the water levels at input and output points—A the cross-sectional area of water flow, and L the length of the flow path, we have, after Darcy,
KAhdt (57)
where dV/dt, often denoted by g, is the volume rate of flow, t is time, and K is the coefficient of permeability. In the determination of the permeability of relatively impermeable samples it is often more convenient to use a variable head, that is, to start out with a given volume of water and allow the head to decrease as the water percolates through the sample. If the change, dh, hi water level is measured in a graduated manometer (fig. 303) whose area of cross-section is a, it follows that
Time
FIGURE 303.—Variable head permeameter used by the U.S. Geological Survey in measuring the hydraulic permeability of Eniwetok cores. (After A. I. Johnson, 1953, written communication.)
dV dt
dh (58)
the minus sign indicating that h decreases as y increases. Combining this with equation (57) we have
dh ~dt~~ KAh a,L
whence, integrating from 2=0 to t=t,
hp_KAt h aL
(59)
(60)
where ho is the water level at the start of the measure ments (t=0) and h is the level at time t. Solving for K,
=— In ^ At 1 h (61)
The value of K will of course be affected by the vis cosity of the water, the rate of flow being greater the smaller the viscosity. For this reason the value of K is specified for a standard viscosity. The standard vis cosity may be directly specified in viscosity units, or it may be indirectly established by specifying a certain temperature for the water. If rjs is the standard vis cosity or the viscosity at the standard temperature, i\T the viscosity at the temperature of the measurements, and Ks the permeability at the standard viscosity or temperature, equation (61) becomes
aL ijT.•-*-, • — «" ^r (62) At its h
Converting natural to Briggs logarithms, equation (62) becomes
(63)-j- — At its
i logioj
It has been found convenient in the laboratory to measure L, ho, and h in centimeters, a and A hi square centimeters, and t in seconds. It is obvious dimen- sionally that a/A, i)Tfris, and ho/h are numerics. It therefore follows that jK"has the dimensions of a velocity, L/t, which in equation (63) is centimeters per second.
For engineering reasons it has been found convenient in the U.S. Geological Survey to express K hi Meinzer units. A Meinzer unit, or more simply, a meinzer, is a flow, when fully saturated, of 1 gal of water per day through a cross-sectional area of 1 sq ft under a hydraulic gradient of 1 ft per ft at a temperature of 60°F. Con verting to meinzers, equation (63) becomes
9J8Q(64)
where KM is the permeability in meinzers, L is in centimeters, t is in'seconds, and ^90 is the viscosity of the water at 60°F.

976 BIKINI AND NEARBY ATOLLS, MARSHALL ISLANPS
A more widely used unit of permeability is the darcy, which is defined as a flow of 1 cm3 per sec through a cross-sectional area of 1 cm2 of a fluid of 1 centipoise viscosity under a pressure differential of 1 atm per cm.
To convert meinzers into darcies it may be noted that
1 meinzer=4.877X10~2 darcies=48.77 milli-darcies
1 darcy=20.50 meinzers
The variable head permeameter used by the U.S. Geological Survey in measuring the hydraulic permea bility of Eniwetok cores is shown in figure 303. A graduated-tube manometer of internal cross-sectional area a, filled with water, is connected by a length of rubber hose to a sample holder, s. From the sample holder the water flows past a thermometer, T, and through a rubber hose to an overflow tank, 0, in which the water level is regulated by the position of a glass funnel, F. The height of the water head, h, driving the water through the specimen, is measured above the water level in the overflow tank. From the overflow tank the water flows out through the funnel and hose into a waste drain.
The sample holder is a cylinder of acrylic plastic seated against gaskets in two end plates. A seamless rubber tube is mounted inside the cylinder and over lapped over its ends. Through a valve in the side of the cylinder a vacuum is created between the rubber tube and the cylinder walls, drawing the tube against the walls and permitting the insertion of the core sample.
TABLE 14.—Coefficient of permeability (hydraulic) for Eniwetok cores
[Measurements by the U.S. Geological Survey, Denver, Colo.]
Bock Core Depth(feet)
Coefficient ofpermeability
(meinzers)
(milli-darcies)
Remarks
Parry Island
Limestone..
Basalt.. _ ._
E-l-1.....E-l-2.....E-l-3.. „_
E-l-3 _ ..
E-l-4.....
E-l-6.....E-l-6-.—
2,003-2.0282, 802-2, 8084,078-4,100
4,078-4,100
4,208-4,211
4,211-4,216
4,216-4,222
9.312.7
.12
.0032
.013
.00004
.09
454619
5.9
.16
.63
.002
4.4
Bottom of sample 5 ftabove base of core.
Bottom of sample 6 in.above base of core.
Top of sample 10 in.below top of core.
Top of sample 2 ftbelow top of core.
Top of sample 1 ft 8 inbelow top of -core.
Elugelab island
Limestone..
Dolomite-Limestone . -
F-l-1-1 _F-l-3-5 ...F-l-4-6...F-l-5-4...F-l-6-20..F-l-9-3...F-1-10-6-.F-l-11-31.F-l-12-6..F-l-13-5..F-l-14-19.
170-1911,232-1.2481, 718-1. 7401,978-2.0032,862-2,6873,665-3,6653, 963-3. 9884,197-4,2224,318-4,3414,406-4,4314, 600-4. 525
5.1.042
3.2.00013.00022
9.710.02.3
.000461.0.073
2492.0
156.006.011
473488112
.02248.83.6
The vacuum is then released and the tube allowed to snap back against the specimen to seal off the sides of the core. A porous bronze filter is then placed at each end of the cylinder to seal in the core and the whole assembly is tightly clamped together by three brass rods. Air pressure is then introduced between the cylinder walls and the rubber tube to make certain that the core sides are sealed off and that the water flows through the length of the core.
Several runs are made on each core for several time intervals and the maximum value of K obtained is accepted as the correct value for the saturated permea bility. These values are given in table 14.
POROSITY
Two types of porosity are recognized: permeable and impermeable or occluded. The permeable porosity comprises those pores and other voids which are inter communicating and open either directly or indirectly to the exterior of the specimen. The impermeable or occluded porosity comprises those pores and other voids which are sealed off from each other and from the exterior of the specimen. Pores differ greatly in size, ranging from large open lacunae to microscopic pores only a few angstroms in diameter.
Porosities of a series of Eniwetok drill cores have been determined by two different laboratories of the U.S. Geological Survey, by the Applied Physics Branch of the U.S. Bureau of Mines, and by the Concrete Laboratory of the U.S. Bureau of Reclamation in Denver, Colo. The method employed by the Hydro- logic Laboratory of the U.S. Geological Survey is as follows: The true specific gravity is first determined for a part of the core by the pycnometer method described under "Density and Specific Gravity." A section of the core dried at 105°C is next weighed 3 and then given a very thin paraffin seal by dipping it in a bath of melted paraffin. It is next reweighed and the weight of the paraffin coat thus determined. It is then completely immersed in water in a wire cradle attached to the arm of a balance and again weighed while so immersed. The loss in weight is the weight of the water displaced by the core and its paraffin coat. The external or bulk volume, F6, of the core alone is then obtained from the equation
PP(65)
where w0 is the weight in grams of the dry sample in
»Although the terms, "weight" and "weighed" are here used in accordance with standard custom, it is to be understood that the balance or other weighing equip ment used is so calibrated as to give the mass of the body in grams rather than the gravitational attraction on the body in dynes. The "weights" wa, wpe, wfi, and so on, are thus the masses rather than the weights, and are so treated in stating and solving the equations here used.

SOME PHYSICAL CONSTANTS FOR THE MARSHALL ISLANDS AREA 977
air, Wpc is the weight in grams of the coated sample in air, wpi is the weight in grams of the coated sample when suspended completely immersed in water, pw and pp are the densities of water and paraffin respectively at the temperature of the measurements. If the density of water at room temperature is assumed to be unity, and the density of paraffin is taken as 0.9, this reduces to
Vb =(wve —w pj) —0.9 (66)
If wd is the weight of the water displaced by the un- coated core, we have
if pw is regarded as unity. The bulk specific gravity, 76, of the core is then obtained from the equation
76=— (68)
If y t is the true specific gravity and Pt is the total porosity hi percent, that is the percent of the volume occupied by both permeable and impermeable voids,
t==T«-76x 100 (69)
The values so determined for the Eniwetok cores are listed in table 15.
The Bureau of Mines, the Bureau of Reclamation, and the Geological Survey laboratory determined the volume of the permeable voids and pores and from this determined the permeable or effective porosity, that is, the percentage of the specimen volume occupied by per meable pores and voids. As essentially the same proce dure was followed by all three, their methods will be described together. The specimen is first oven dried for a period of 24 hours or longer at a temperature of 105° to 110°C, and then cooled and weighed. It is next saturated with water, surface-dried as described under "Density and Specific Gravity," and reweighed in air. If w0 is the oven-dried weight and ws the saturated surface-dried weight, the volume Vp of the permeable pores is given by ,
,, _WS — W 0
Pw(70)
where pu is the density of the water filling the pores of the specimen. As the density of water at room temper ature departs from unity by only 3 parts hi 1,000, it is usually regarded as unity, with negligible error, and equation (70) can be written
Vp =w g —w0 (71)
If the external volume, V6, of the specimen is deter mined by the paraffin method described above, or by any of the methods discussed under "Density and
Specific Gravity," we have
(72)
where Pe is the permeable or effective porosity—that is, the percent of the volume occupied by permeable voids and pores.
If wt is the weight of the saturated specimen when completely immersed in water, we have, from equations (8), (70), and (72)
(73)
The values of the permeable or effective porosity for the Eniwetok cores are given in table 15.TABLE 15.—Porosities of Eniwetok drill cores, percent by volumePorosity: Values in parentheses have been computed by the writer from the bulk
specific gravities. All others are measured values.Measured by—
USBM=Applied Physics Branch, U.S. Bureau of Mines USBB=Concrete Laboratory, U.S. Bureau of Reclamation USGS=U.S. Geological Survey
Bock Core Depth (feet)
Porosity (percent)
Total Effective
Bulk specific gravity
Measured by-
Parry Island
Limestone _ E-l-1...... E-l-1-13— E-l-2......E-l-3.——E-l-3——E-l-3-21— E-l-4—— __E-l-4-3 A-.E-l-4-3 B_- E-l-4-3 C_. E-l-4-9— _ E-1-5- — - E-l-6......
E-l-6-2 B- E-l-6-2 C-.
2,003-2,028 2,003-2,028 2, 802-2, 808 4, 078-4, 100 4, 078-4, 100 4, 078-4, 100 4, 208-4, 211 4, 208-4, 2114, 208-4, 211 4,208-4,211 4, 208-4, 211 4, 211-4, 216 4, 216-4, 222 4, 216-4, 2224,216-4,222 4, 216-4, 222
47.6 (56. 3) 28.7
111.7 2 15.0 (16. 6) 33.0
(3.7) «7. 5 « 8.1
.06
.00
.04
2.94 1.50 2.50
1.21
2.31
2.96 2.97 2.99 2.86
2.61 2.68 2.62
USGS USBM USGS USGS USGS USBM USGS USGS USGS USGS USBM USGS USGS USGS USGS USGS
Elugelab island
Limestone- ...
Dolomite .....
Limestone. . ..
F-l-1-1 — _ F-l-3-5—— F-l-3-6 — . F-l-4-1 —— F-l-4-6—— F-l-5-4 ——F-l-5-4 ——F-l-6-2— . . F-l-6-20 — F-1-9-3-.F-l-10-6--. F-l-11-31 — F-l-11-31 —F 1 19— fiF-l-12-6— F-l-13-5 — F-1-14-18-.F-l-14-19.-
170- 191 1, 232-1, 248 1, 232-1, 248 1, 718-1, 740 1, 718-1, 740 1, 978-2, 003 1,978-2,003 2, 662-2, 687
3, 655-3, 665 3, 963-3, 988 4, 197-4, 222 4, 197-4, 222 4, 316-4, 341 4, 316-4, 341 4, 406-4, 431 4, 500-4, 525 4, 500-4, 525
43.0 12.1
(18.8) (33. 9)
9.9 7.4
(5.8) (13. 7)
7.6 35.9 37.1 31.1
(33. 6) (8.7) 12.0 19.1
(31.8) 32.7
4.0
2.251.83
2.61 2.39
1.84 2.53
1.89
USGS USGS USBM USBM USGS USGS USBM USBM USGS USGS USGS USGS USBM USBM USGS USGS USBM USGS
Engebi island
EN-8-— ..EN-9- ..... EN-10.——EN-11——.
90. 5-91. 095. 0-96. 0 81.0-82.0
8. 0-9. 0
16.04 36.0 36.0
14.09
2.25 1.79 1.79 2.35
USER USER USER USER
Mnjinkarikkn island
Limestone .... MU-5- ——MU-7_ ——
38. 1-70. 581. 5-82. 0
32.71 36.0
1.82 1.79
USER USER
i Bottom of sample 5 ft above base of core. 2 Bottom of sample 6 in. above base of core. 3 Top of sample 10 in. below top of core. * Top of sample 2 ft below top of core. 6 Top of sample 1 ft 8 in. below top of core.

978 BIKINI AND NEARBY ATOLLS, MARSHALL ISLANDS
RADIOACTIVITY (NATURAL)
An attempt was made to measure the radioactivity of the sediments in drill hole E-l on Parry Island, Eniwetok Atoll. An in-hole Geiger-Mueller tube was lowered into the drill hole by means of an electric cable connecting it to a counter at the surface. The counter was provided with three ranges: 0 to 0.2, 0 to 2.0, and 0 to 20.0 mr per hr.4 Prior to its use at the drill hole the counter was carefully calibrated against radiation standards in the Radiation Labora tory on Eniwetok. All readings in the drill hole were taken on the 0.2-mr-per-hour scale, which was found to be accurately calibrated. Before and after each run in the drill hole the operational functioning of tube and counter was tested by a pair of radioactive standards carried with the equipment.
The drill hole was filled with water almost to ground level. The Geiger-Mueller tube was protected by a thin-walled brass cylinder which was closed by a brass ferrule at the base and by a threaded cap and a packing gland at the top. Several types of packing and packing glands were tried at the top, but great difficulty was experienced, particularly with increasing depth, in keeping minute traces of moisture from getting inside the tube and interfering with counter operation. Eventually the ferrule was silver-soldered to the case at the base and a plastic coating sprayed over the out side of the tube and cable after reassembly to seal all possible leaks. Before its effect could be established, however, the protecting brass cylinder imploded at a depth of 924 feet below the water surface of the well, 928 feet below the top of the well casing. Table 16 shows the counter readings down to the depth of implosion.
The background radioactivity in the air at the top of the drill hole was measured at intervals of 5 seconds during two runs of 2 minutes each with the Geiger- Mueller tube held just above the top of the casing in the well. Individual readings ranged from 0.02 to 0.065 mr per hr. The average for the two runs was 0.041 mr per hr.
Measurements were made in the laboratory by P. M. Hurley of the radioactivity of the basalt from the bottom of drill core E-l-5-5 from a depth of 4,216 feet in drill hole E-l on Parry Island. (Written communication, to H. S. Ladd, January 12, 1954.) The specimen was described as an "unusually fresh olivine basalt, very hard, with a conchoidal fracture."
4 The abbreviation mr=milliroentgen. A roentgen was denned by the Inter national Commission on Eadiological Units hi 1950 (U.S. Bureau of Standards, 1951, p. 24) as "... the quantity of X- or gamma radiation such that the asso ciated corpuscular emission per 0.001293 g of air produces, hi air, ions carrying 1 electrostatic unit of quantity of electricity of either sign." It may be noted that 0.001293 g is the mass of 1 cm' of dry atmospheric air at 0°C and 760 mm of mercury pressure.
The radioactivity was determined by two methods: thick-source alpha count in an ionization chamber with a source area of 160 cm2 and in a proportional counter with a source area of 24 cm2. As seen in table 17, the ionization chamber gave a value of 0.57 X10~12 grams of equivalent radium per gram of basalt, and the proportional counter gave a value of 0.58 X10"~12 grams of equivalent radium per gram of basalt.
Hurley also made volumetric measurements of the pure helium extracted from two samples of the basalt, one sample of 10.255 grams, the other of 9.467 grams. The first sample gave 0.35 X10~5 and the second 0.36 X 10~5 cubic centimeters of helium per gram of basalt, as shown in table 18.
These values of helium content and radioactivity permit an estimate of the age of the basalt. The value of the age depends upon the value of helium retentivity assigned to the rock. Retention values
TABLE 16.—Natural radioactivity of the coral limestone in drillhole E-l, Parry Island, Eniwetok Atoll, December 1952
[Measured by the author with an in-hole Geiger-Mueller counter]
Depth below top of casing (feet)
0_-._-_ _ .....4 _________
0-100_. ________100-200 ________200-300 ________300-400 ____ _400-525 .____._.525-725 ________725-795.-- _ -_795-825 ________825-925 ____ .-
Radioactivity (mr per hr)
Maximum observed
0 065 030
04 028 025 025 03 035 04 04 043
Average
0 041 020
013 012 010 012 014 Oil 015 023 022
Remarks
In air above top of casing. At top of water in drill
hole.
TABLE 17.—Natural radioactivity of the basalt [Measured in the laboratory by P. M. Hurley]
Description of rock
Unusually fresh olivine basalt, very hard, with conchoidal fracture.
Core
E-l-5-5...
Depth (feet)
4,216
Method of measure ment
Ionization chamber. Proportional alpha
counter.
Radioactivity (grams of
equivalent radium per
gram of basalt)
0. 57X10-" 0. 58X10-"
TABLE 18.—Helium content of the basalt
[Measured in the laboratory by P. M. Hurley]
Description of rock
Unusually fresh olivinebasalt, very hard, withconchoidal fracture.
Core
E-l-5-5...
Depth (feet)
4,216
Sample
AB
Weight (grams)
10. 2559.467
Helium content (cm'
per gram ofbasalt)
0.35X10-'0.36X10-S

SOME PHYSICAL CONSTANTS FOR THE MARSHALL ISLANDS AREA 979
of 40 to 60 percent are found in the literature. If a retentivity of 50 percent is assumed, the age of the basalt would be 40,000,000 ±10,000,000 years. Dr. Hurley regards this value as very uncertain, however.
SEISMIC SPEEDS: SPEEDS OF TRANSMISSION OF SEISMIC WAVES
The speeds of transmission of sonic waves, both compressional and torsional, through a few of the Eniwetok cores have been measured by the U.S. Bureau of Mines using the dynamic method described earlier in the section on "Elastic Constants." As there noted, the resonant frequencies, /rc and /rt, for compressional and torsional vibrations are determined. From these the corresponding speeds of transmission, vc and ®t respectively, are computed from equations (38) and (39), given on p. 966,
where L is the length of the core being tested. The results of these measurements, made on air-dried cores, are listed in table 19.
The torsional waves generated in the Bureau of Mines measurements represent a rotational shear. The speeds so determined, however, apply equally well to waves involving translational shear, and thus to the general class of distortional waves — also called transverse, shear, equivoluminal, or rotational waves. (See Ewing, Jardetsky, and Press, 1957, p. 10.)
Speeds computed from equations (38) and (39) are "bar speeds", since they represent transmission in only one direction, along the axis of the core. Three- dimensional transmission in the earth would give rise to slightly higher speeds. Thus if vc is the bar speed for the compressional wave
(74)
where E is Young's modulus and p is the density.
The speed of transmission, vt, of a compressional wave in three dimensions in an isotropic medium is given by the equation (see Macelwane, 1932, p. 105),
(1-M) (75)
where p is Poisson's ratio. The computed values of vt found from the measured values of vc and n for the three cores tested dynamically by the Bureau of Mines are given in table 19. It may be noted that the change from bar speed to isotropic speed for these three cores is small because of the low values of their Poisson's ratios. Normal values of ju, around 0.25, would lead to a correction factor of 1.2, or an isotropic speed 20 percent higher than the bar speed.
Joesting, Swartz, and Farnham made a series of seismic-refraction surveys on a number of islands in Eniwetok Atoll. Their results, which are for shallow depths, are listed in table 20. Except for materials exposed at the surface, identifications of lithological units are based on extrapolation from nearby drill holes. They are, therefore, to be regarded as approximate only, particularly in view of the many local and rapid variations known to occur.
Perkins with Dobrin and Lill (Perkins and Lill, 1948; Dobrin and Perkins, 1954) made a series of in-hole velocity measurements in drill hole 2B on Bikini island, Bikini Atoll. Their results, together with the geologic column for the drill hole (Emery, Tracey, and Ladd, 1954) are given in table 21.
Perkins with Lill, Dobrin, and Snavely (Perkins and Lill, 1948; Dobrin, Perkins and Snavely, 1949; Dobrin, 1950; Dobrin and Perkins, 1954; Perkins, 1954) and Raitt (1951, 1954, 1956, 1957) made a series of marine seismic refraction surveys at and near Bikini, Eniwetok, and Kwajalein Atolls, and Sylvania Guyot. Data from these surveys are presented in table 22. The marine measurements were made and interpreted by standard seismic refraction methods, with some modi-
TABLE 19.—Speeds of seismic-wave transmission: laboratory measurements
[Measurements by Applied Physics Branch, U.S. Bureau of Mines]
Rock
Dolomite _______
Core
F-l-5-4.. ...........F-l-6-2. ________F-l-12-6.. ..„.„.„„
Depth (feet)
1,978-2,003 2,662-2,687 4,316-4,341
Measured
Speeds of transmission in core
Compressional wavesPC
Feet per sec.
16,400 15,100 17,500
Kilometers per sec.
5.00 4.60 5.33
Torsional waves PI
Feet persec.
11,000 10,100 12,300
Kilometers per sec.
3.35 3.08 3.75
Computed
Speeds of transmission of compressional wave in isotropic earth of same material as core
M
0.12 .13 .01
J 1-M
V (l+ji)(l-%)
1.03 1.04 1.00
Feet persec.
16,900 15,700 17,500
Kilo meters
per sec.
5.15 4.78 5.33
Method
Sonic. Sonic. Sonic.

980 BIKINI AND NEARBY ATOLLS, MARSHALL ISLANDS
fications in equipment and techniques to meet marine conditions. They are discussed in detail in papers by Raitt (1954, 1957) and by Dobrin and Perkins (1954), to which the reader is referred for additional details.
TABLE 20.—Speeds of seismic-wave transmission: ground-surface seismic refraction surveys
[Measurements by Joesting, Swartz, and Farnham]
Rock
Sand and gravel, unconsolidated to partly cemented.
Limestone, weakly to well con solidated.
Reef rock ___ . _________ ..
Compressional speeds
Feet per second
1,000- 1,350 4, 900- 5, 600 3, 800- 6, 600
6, 700-10, 500
7, 400-12, 000
11,400-11,800 13, 000-14, 000
Kilo meters
per second
0. 31-0. 41 1. 49-1. 71 1. 16-2. 01
2. 04-3. 20
2. 26-3. 66
3. 47-3. 60 3. 96-4. 27
Remarks
Average approxi mately 8,500 fps=2.59 kmps.
Measured on reef.
TABLE 21.—Speeds of seismic-wave transmission: in-hole measure ments, drill hole 2B, Bikini island, Bikini Atoll
[Measurements by Dobrin, Perkins, and Lill. Lithologic units from log of drill hole 2B (Emery, Tracey, and Ladd, 1954, p. 82-83 and fig. 35)]
Depth interval (feet)
150-200.... .....200-300.........
300-400————
400-450—— __450-500.—- _500-550.—- __550-600—— __600-650—————650-700————700-750—— ———750-800.—————800-900——— —900-1,100——..1,100-1, 400.... _
1,400-1,600---- 1,600-1,800-.--
Compressional speed
Feet per second
6,320 7,590
10, 100
11, 670 7,100 9,090 7,620
14,240 7,380
10, 450 10,000 6,400 8,430 7,250
9,080 10,200
Kilo meters
per second
1.93 2.31
3.08
3.56 2.16 2.77 2.32 4.34 2.25 3.19 3.05 1.95 2.57 2.21
2.77 3.11
Lithologic unit
Description
Chalky poorly consolidated de tritus.
Moderately consolidated recrys- tallized white limestone.
Porous friable, but recrystallized white to buff limestone.
Porous friable tan to light-brown limestone; crystalline calcite- fllled cavities.
Light- to medium-brown uncon solidated unsorted sand; well- preserved shells and corals.
Consolidated brown foraminif- eral limestone.
JTJnconsolidated brown sand .....
Depth interval
(feet)
100-187 187-290
290-425
425-550
550-715
715-1,120
1,120-1,155
1,155-2,556
TABLE 22.—Speeds of seismic-wave transmission: marine seismic refraction-surveys
Zone Layer
Compressional-wave speed
Kilometers per second
Feet per second
Estimated depth to top of layer
Kilometers FeetRemarks
A. Bikini Atoll[Measurements by Dobrin, Perkins, and Snavely]
12'
23
2. 12.7
3. 45. 2
7,0009,000
11, 00017, 000
00.6
0.82. 1-4. 0
(Mean 3. 0)
02,000
2,5007, 000-13, 000(Mean 10, 000)
Observed only near Enyuisland.
Assumed calcareous.Probably igneous.
B. Bikini and Kwajalein Atolls and Sylvania Guyot[Measurements by Raitt]
Crust__ _________
Mohorovidid discontinuity .Mantle. __ _ __. ___ _
12344'
5
6
2.453. 10
3. 84-4. 745. 546. 15
6. 53
8. 3±0. 21
8,00010, 200
12, 600-15, 50018, 20020, 200
21, 400
27, 250
00.71. 333.6
7-9
13
02,3004,3009,800
12, 000
23, 000-30, 000
43, 000
Assumed calcareous.Assumed volcanic.
Sylvania Guyot. Althougha significantly differentspeed, Raitt believes probably same as layer 4.
Raitt identifies with intermediate layer universallypresent in deep Pacific.
C. Eniwetok Atoll[Measurements by Raitt]
Crust _ ___ _ _______
Mohorovicid discontinuity.Mantle. ___ _ ______ __
01 2 3 4 5
6
1. 922. 44 3.06 4. 15 5. 59 6. 90
8.09
6,3008,000
10, 000 13, 600 18, 300 22, 600
26, 500
00. 1
0. 3-0. 7 1. 5-2.
3-7 9-10
16-17
0300
1, 000-2, 300 4, 900-6, 600
9, 800-23, 000 30, 000-33, 000
52, 000-56, 000
NW of Elugelab.
Calcareous. Believed volcanic.

SOME PHYSICAL CONSTANTS FOR THE MARSHALL ISLANDS AREA 981
STRENGTH
By strength is meant the stress at the time of frac ture—that is, the maximum stress or maximum load per unit area that the specimen can withstand without fracture. It is measured by placing a specimen in a testing machine and increasing the load until fracture occurs. The type of strength determined depends on the method of mounting the specimen and applying the load. Three major types are obtained: (1) com pressive strength, (2) tensile strength, and (3) flexural strength. A fourth—triaxial compressive strength—is found by applying a fixed hydrostatic pressure to the specimen while subjecting it at the same time to an increasing uniaxial load.
Factors affecting the result are the shape and relative dimensions of the specimen, the rate of application of the load, the moisture content of the specimen, and the alinement and uniformity of load application. For this reason, standard shapes, sizes, and procedures are employed. In the present investigation all tests were made on cylindrical specimens. Details of procedures will be described under the individual strength types discussed.
Specimens were tested for compressive strength, tri axial compressive strength, and flexural strength. Be cause of technical difficulties involved, no measurements were made of tensile strengths.
COMPRESSIVE STRENGTH
For these tests the cores were cut to a standard length, specified as a fixed ratio of length to diameter. For the Bureau of Mines tests this ratio was 1.0; for the Bureau of Reclamation tests it was 2.0. If for any reason the ratio of length to diameter departed mate rially from these values, the results were corrected to standard dimensions. For the Bureau of Mines tests this was done by use of the equation
C=- C0
0.778 + 0.222^ LI
(76)
where G is the compressive strength for the standard specimen (D—L), C0 is the observed compressive strength, D is the diameter, and L the length of the core cylinder. Although the equation was developed by the A.S.T.M. for cubic specimens (ASTM, 1942J), experiments by the Bureau of Mines (Obert, Windes, Duvall, 1946, p. 21-22) showed that it holds also for cylindrical specimens, and is subject to an error of only a few percent for values of L/D from % to 1%.
For the Bureau of Reclamation tests the correction was obtained from a standard curve (U.S. Bur. Recla mation, 1949, p. 456) which agrees within 1 percent with equation (76) above.
Experiments by the Bureau of Mines (Obert, Windes, Duvall, 1946, p. 22) showed the compressive strength to be reduced by moisture. All specimens tested by the Bureau of Mines were, therefore, air dried before testing. On the other hand, the report accompanying the tests made by the Bureau of Reclamation stated that the specimens tested "appeared to be nearly saturated."
In preparing the cores for testing, the ends were accurately squared and ground to a smooth accurately flat surface. In the Bureau of Reclamation tests the ends of the cores in addition were capped with plaster of paris to provide an even bearing surface. The cores were then mounted in a testing machine, where they were accurately centered between spherical bearing segments to assure proper alinement, a slight initial pressure applied, and the core positioned with the plates accurately parallel with the ends of the specimen. Pressure was then applied at a standard rate until fracture occurred. In the Bureau of Mines tests a 120,000-pound hydraulic testing machine was used, and pressure was increased at the rate of 100 psi per second. In the Bureau of Reclamation tests a 300,000- pound testing machine was employed and pressure was increased at the rate of 2,000 psi per minute.
If A is the area over which the load is applied, and Wf is the load at fracture, the compressive strength, G, is computed from the equation
(77)
The values of the compressive strengths measured for the Eniwetok drill cores are given in table 23.
TRIAXIAL COMPRESSIVE STRENGTH (SHEARING STRENGTH)
In triaxial compression tests the core specimen is placed under a lateral hydrostatic load of fixed amount, then subjected to an axial compressive load which is increased until fracture occurs. The triaxial compres sion test permits a determination of the shearing strength of the specimen, a quantity which it is not feasible to measure directly.
The axial and lateral stresses at failure are called the "principal stresses". If SA and SL are the axial and lateral principal stresses, a series of semicircles called "Mohr's semicircles" (Mohr, 1900, 1914; Balmer, 1952) may be drawn for the different values of SL used. Each semicircle has a radius of (SA —SL)/2 and is described about a center on the axis of abscissas at a distance of x=(SA +SL)!2 from the origin. The enve lope tangent to this series of semicircles is known as "Mohr's envelope". While actually curvilinear it may be approximated by a straight line whose equation can be determined by least squares. It may be shown

982 BIKINI AND NEARBY ATOLLS, MARSHALL ISLANDS
(Balmer, 1952) that in the resultant equation,
y=c+x tan * (78)
y is the shearing stress at fracture parallel to the plane of fracture, x is the stress at fracture normal to the plane of fracture, c is the unit cohesive strength of the specimen, and tan <i> its coefficient of internal friction.
As both x and y are stresses, c must also be expressed in the same units—that is, as a force per unit area. If x and y are expressed in terms of pounds per square inch, c must be expressed in terms of pounds per square inch. Tan <i> is of course a numeric.
Triaxial compression tests on the cores were made by the Bureau of Reclamation only. In these tests the cores, prepared as described under "compressive strength", were covered with rubber jackets to exclude the hydraulic fluid used to exert the lateral pressure, and placed in a small pressure chamber mounted on the 300,000-pound testing machine. Hydraulic pres sure was then built up through a flexible rubber hose by means of a hand pump and the hydraulic pressure applied measured by means of a Bourdon-tube pressure gauge. After the desired lateral pressure was thus established for the particular test being made, the axial load was increased by the testing machine ram at a uniform rate of 2,000 psi per minute until fracture occurred.
In figure 304, Mohr's semicircles and Mohr's envelope are shown for cores from drill hole MU-5. The best fitting tangent, determined by least squares and shown in the figure, has the equation
2/=180+0.6z (79)
where y, the shearing strength, is of course dependent on the normal stress, x. The unit cohesive strength is 180 psi. The coefficient of internal friction is 0.6.
The results of the triaxial compression tests on the Eniwetok drill cores are given in table 23.
1500
1000
500
500 1000 1500 NORMAL STRESS, IN POUNDS PER SQUARE INCH
2000
FIGUEE 304.—Mohr's circles and envelope for core MU-5 as determined by the U.S. Bureau of Reclamation.
ITLEXURAIj STRENGTH (MODULUS OP RUPTURE)
In testing for flexural strength the core is placed horizontally across two knife edges near the ends of the specimen. The load is then applied from the top by a third knife edge, midway between the supports, and the specimen bent until fracture occurs. In this test the specimens are subjected to compression above and tension below. As has previously been noted under elastic constants, such a flexure involves both torsional and compressional stresses.
The flexural strength is expressed as a modulus of rupture, R, whose value is given by the equation
8TT/L — (80)
where Wf is the load at fracture, L the length of the span between the supports, and D the diameter of the core. The error in the modulus, due primarily to the D3 factor, was estimated by the Bureau of Mines to be approximately 6 percent.
Flexural tests were made only by the Bureau of Mines. Previous tests by the Bureau (Obert, Windes and Duvall, 1946, p. 24) had shown that the modulus of rupture is independent of specimen diameter. Because of the small diameter of the cores, as well as their short length, the separation of the knife edges was made less than standard. The vertical load applied at the midpoint of the span was increased in the testing machine at the rate of 100 psi per minute until rupture occurred.
Values of the modulus of rupture so obtained are given in table 23.
TABLE 23.—Compressive, triaxial-compression, and flexural strengths of some Eniwetok drill cores
Rock Core Depth (feet)
Compres sive
strength (psi)
Triaxial compres sion stress at fail
ure (psi)
Lateral Axial
Modulus of
rupture (psi)
Elugelab island
[Measurements by Applied Physics Branch, U.S. Bureau of Mines]
Limestone —
Dolomite ....Limestone ...
F-l-3-6..—F-l-4-1-- —F-1-5-4-. ...F-l-6-2..... F-1-12-6-... F-14-18-.—
1, 232-1, 248 1, 718-1, 740 1, 978-2, 003 2, 662-2, 687 4,316-1,341 4, 500-4, 525
9,400 2,600
19,600 14, 100 17,700 5,200
850 4,100 2,450 3,200
Parry Island
[Measurements by Applied Physics Branch, U.S. Bureau of Mines]
Limestone-
Basalt ___
E l 1 1Q
E 1-4-fl _ ..
2,003-2,028 4,078^,100 4, 208-4, 211
240 13, 700 28,200

SOME PHYSICAL CONSTANTS FOR THE MARSHALL ISLANDS AREA 983
TABLE 23. — Compressive, triaxiaLcompression, and flexural strengths of some Eniwetok drill cores — Continued
Rock Core Depth (feet)
Compres sive
strength (P.s.i.)
Triaxial compres sion stress at fail
ure (p.s.i.)
Lateral Axial
Modulus of
rupture (p.s.i.)
Engebi island
[Measurements by the Concrete Laboratory, U.S. Bureau of Reclamation]
Limestone ... EN-8———— EN-9 A..... EN-9 B—— EN-9 C—— EN-10———EN-11 A.— EN-11 B..__ EN-11 C,...
90.5-91.0 95. 0-96. 0 95. 0-96. 0 95. 0-96. 0 81. 0-82. 0
8.0-9.0 8. 0-9. 0 8. 0-9. 0
2,750 2,550 2,140
1 3, 630 3,690 4,530 6,830 5,730
Mujinkarikkn island
[Measurements by the Concrete Laboratory, U.S. Bureau of Reclamation]
Limestone ... TWTT 7 AMU-7 B_ — MU-5 2MU-5...... MU-5.......MU-5— ....MU-5———.MU-5— ....MU-5—.... MU-5———
81. 5-82. 0 81. 5-82. 0
38.1 38.6 41.5 54.9 57.5 69.5 59.0 70.5
3,920 14,140
960
i Sample was oven dried. * Equation for Mohr's envelope for MU-5 cores, a
Reclamation, is #=180+0.6 x, where y= shearing s pounds per square inch. For the principal stresse is the axial stress and SL the lateral stress in pounds
THERMAL DA'1
TEMPERATURE PRO
Temperature profiles have been ] holes on Eniwetok Atoll (drill Island and drill hole F-l on Elugel drill hole on Bikini Atoll (drill hole The drill-hole temperatures wer author using thermistors as the
100 300 200 500 400 100
0 0
is determir. tress, and s, SA-610per squar
^A
FILES
measur hole E a,b islan 2Bon e meas tempe
600 2,010 1,410 1,780 1,440
610 770 960
led by the Bureau of x= normal stress, in
4-2.9 SL, where SA s inch.
ed in two drill i-l on Parry d), and in one Bikini island), sured by the rature-sensing
TABLE 24. — Temperature profiles in Eniwetok and Bikini drill holes, and in the Pacific Ocean, Marshall Islands area
Depth (feet)
Temper ature <°0)
Depth (feet)
Temper ature (°C)
Depth (feet)
Temper ature CO)
Depth (feet)
Temper ature CO)
A. Drill hole E-l, Parry Island, Eniwetok Atoll
[Field measurements (September 10, 1958) by D. L. Reid, Holmes and Narver Co. See also Swartz (1958), tables 4 and 5]
3.8..——27.8———52.8..—77.8-—102.8 __ 127.8——152.8—— 177.8 ....202.8——227.8. ...252.8. ... 277.8——
28.10 27.78 27.54 27.10 26.75 26.32 25.87 25.47 25.11 24.80 24.45 24.16
302.8—— 327.8 _ . 352.8——377.8—— 402.8 .... 450.3 _ . 500.3—— 600.3 .... 700.3.... 800.3 .... 900.3. ... 1,000.3—
23.81 23.57
22.75 22.40 21.52 20.34 19.26 18.23 16.92 14. 80(?) 1162
1,100.3... 1,200.3... 1,300.3—1,400.3— 1,500.3... 1,600.3... 1,700.3— 1,800.3— 1,900.3— 2,000.3... 2,080—— 2,280——
13.63 12.81 11.51 9.95 9.92 9.34 8.25(?) 8.99 8.68 8.47 8.27 7.90
2,380—— 2,580. ... 2,680—— 2,780—— 2,980—— 3,180—— 3,380—— 3,580.... 3,780 .... 3,980——
7.69 7.35 7.17 6.89 6.41 6.09 6.38 7.12 8.25 9.36
B. Drill hole F-l, Elugelab island, Eniwetok Atoll
[Measurements (October 1952) by J. H. Swartz, See also Swartz (1958), table 3]
24.1 __ . 58.1——73.1 98.1— -123.1... . 148.1 .... 173.1—. 198.1—— 223.1 _ . 248.1—— 273.1—— 298.1—— 323.1. ...
29.1 28.9 28.5 28.1 27.9 27.7 27.6 27.3 27.3 27.0 26.4 26.0 25.7
348.1—— 373.1.... 398.1 ....423.1 ....449.8 .... 500.5 __KAQ Q
600.5 .... 649.8—— 700.5—— 749.8.—Qf)A K
849.8 ....
25.3 24.8 24.2 23.623.5 22.0 20.319.0 17.2 14.8 14.0 13.212.8
900.5. ... 949.8—— 1.049.8— 1,100.5—1,149.8— 1,249.8— 1,300——1,400—— 1,449.8— 1,500—— 1,600——1 RAQ Q
1,700 _ .
11.9 11.5 10.6 10.410.2 10.09 79.6 9.7 9.7
10.0 10.010.1
1,800.... 1,849.8— 1,900—— 2,000——2,049.8... 2,100—— 2,249.8...2,300.,.. 2,500—— 2,700 .... 2,900—— 3,100....3,300——
9.8 10.4 9.8 9.7 9.6 9.3 8.9 8.6 8.7 8.7 8.9 8.8 9.8(?)
C. Drill hole 2B. Bikini island, Bikini Atoll
[Measurements (November 29, 1952) by J. H. Swartz. See also Swartz (1958), table 6]
4— ——28-——53— ....78103—— 128 ......153——
28.7 28.0 27.627.427.2 27.0 26.8
178— —203 __ .228———253 ......278 _ — 303——— 328———
26.4 26.4 26.2 25.925.9 25.7 25.6
353———378———403—— . 500———600——— 700 ___800———
25.5 25.3 25.2 24.6 23.1 22.1 20.5
1,000—— 1,200 ....1,400 .... 1,430 ....
18.0 17.0 15.8 15.7
D. The Pacific Ocean, Marshall Islands area
[Measurements (November 1952) by Scripps Institution of Oceanography, Capricorn Expedition. Courtesy of Dr. Walter Munk. See also Swartz (1958), table 7]
0-200— - 300——. 400 ......
27.8 26.7 23.3
500——. 600—— 700———
18.3 15.6 11.7
800——— 1,000—— 1,500 _ .
10.6 10.0 8.6
2,000 _ . 3,000—— 4,000——
7.5 5.8 4.4
elements (Swartz, 1954, 1958). To avoid introducing uncertainties the readings have not been corrected for thermistor drift with time. The construction and circuitry of the termistor measuring cables, the methods of their use, and their precision and accuracy are dis cussed in detail by Swartz (1958).
The temperature profile in the ocean in the Marshall Islands area was measured by the Scripps Institution of Oceanography during the Capricorn Expedition in 1952 (see fig. 291) using bathythermographs for depths down to 900 feet and sensitive reversing-thermometers for greater depths. The ocean temperatures were furnished through the kindness of Dr. Walter Munk.
Table 24 gives the temperature data for the Eniwetok and Bikini drill holes and for the ocean in the Marshall Islands area.
THERMAL CONDUCTIVITY
Thermal conductivity is the rate of flow of heat through a unit cross-section under a unit temperature gradient. The unit of heat conductivity will depend on the system of units employed. In the fph system it is one British thermal unit (Btu) per hour per square foot per degree Fahrenheit per foot. In the cgs system the unit is one calorie per second per square centimeter per degree centigrade per centimeter which may be abbreviated to cal per sec cm °C. In the present discussion all values will be given in cgs units.
Thermal conductivities of Eniwetok Atoll drill cores were measured both in the U.S. Geological Survey, and by Prof. Francis Birch in the Dunbar Laboratory at Harvard University.
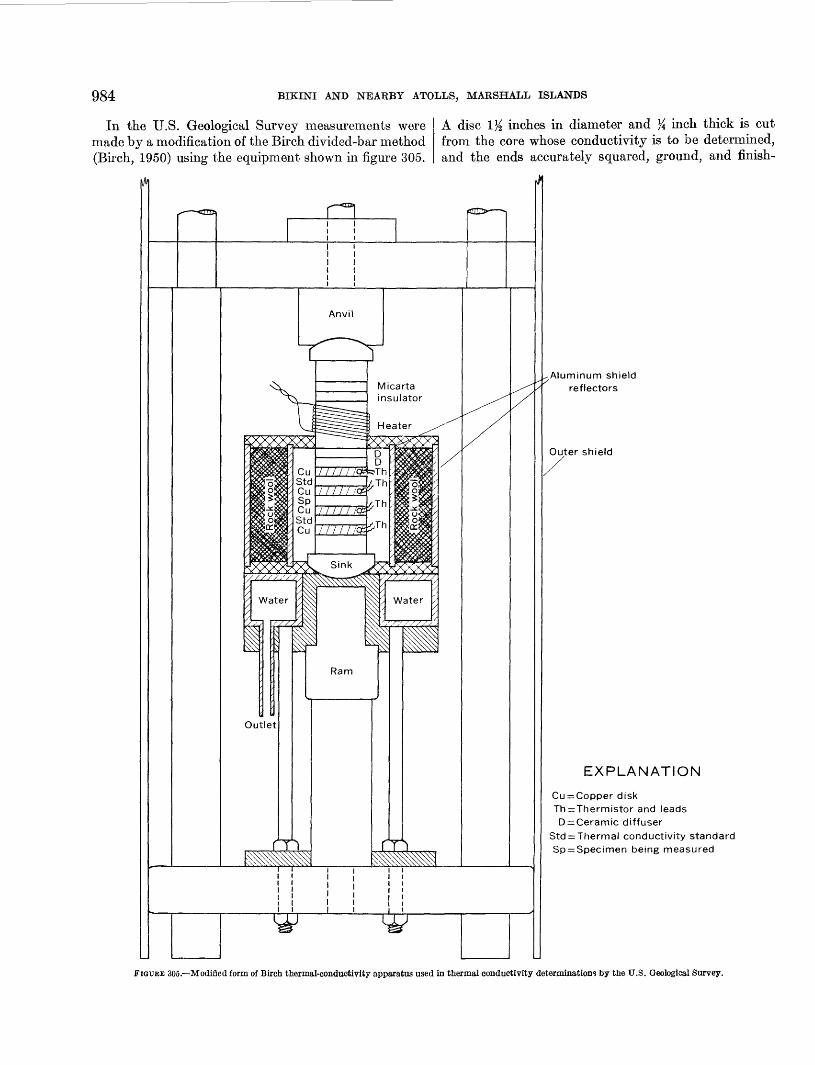
984 BIKINI AND NEARBY ATOLLS, MARSHALL ISLANDS
In the U.S. Geological Survey measurements were made by a modification of the Birch divided-bar method (Birch, 1950) using the equipment shown in figure 305.
A disc 1% inches in diameter and % inch thick is cut from the core whose conductivity is to be determined, and the ends accurately squared, ground, and finish-
Aluminum shield reflectors
Outer shield
EXPLANATION
Cu = Copper disk Th = Thermistor and leads
D = Ceramic diffuser Std = Thermal conductivity standard Sp^Specimen being measured
FIGURE 305.—Modified form of Birch thermal-conductivity apparatus used in thermal conductivity determinations by the U.S. Geological Survey.

SOME PHYSICAL CONSTANTS FOR THE MARSHALL ISLANDS AREA 985
lapped to a smooth flat. The disc, mounted in a stack of discs of the same size, is placed between two copper discs whose temperatures are measured by small bead- type thermistors. On either side of the two copper discs are two standard discs of known conductivity. A heat source at one end of the stack and a thermostatted heat sink at the other end provide a well-regulated heat flow through the entire stack. A thin film of silicone grease between the discs assures a low thermal contact resistance and a cylindrical shield around the stack re duces radial heat flow to a negligible value. The axial flow is given by the discs of known thermal conductivity. The temperature drop across the disc being tested is measured very precisely by the thermistors. From these data the thermal conductivity of the test disc is quickly computed from the equation
(81)
where k is the thermal conductivity, q is the rate of axial heat flow in calories per second, A is the cross- sectional area of the disc in square centimeters, L is the length of the flow path—that is, the thickness of the disc in centimeters—and AT is the temperature dif ference between the top and bottom of the disc in de grees centigrade as measured by the thermistors in the adjacent copper discs, which are assumed to be effec tively isothermal. Or more simply, if kx is the un known thermal conductivity, and ks the known thermal conductivity of the standard disc, AT* the temperature drop across the unknown disc, and ATS that across the known disc,
I. •—. ___* I. f QO\—AT \°*}
A hydraulic ram permits the application of pressure on the stack to insure good thermal contact throughout the stack. The measurements were made under a pressure of 1,400 psi.
All cores were first measured in their air-dried state. Because moisture affects the thermal conductivity, some of the cores were later saturated with water and remeasured in the saturated state. In the U.S. Geo logical Survey they were saturated with tap water. In the measurements at the Dunbar Laboratory, Prof. Birch used a saturated salt solution. Neither condition, of course, represents the effect of the saline ocean waters actually present in the atoll, but they do give some idea of the effect of waters in the core pores.
The resultant thermal-conductivity values are pre sented in table 25. For comparison, thermal conduc tivities determined by D. W. Butler in the National Physical Laboratory, in England, for a series of sea- bottom cores collected by the Mid-Pacific Expedition of the Scripps Institution of Oceanography and fur nished the writer through the kindness of Dr. Roger Revelle and Dr. Arthur E. Maxwell, of the Scripps Institution, are given in table 26.
Heat conductivity data in cgs units may be converted into fph units and vice versa by means of the following relationships:
1 cal per sec cm °C=241.9 Btu per hr ft °F 1 Btu per hr ft °F=0.00413 cal per sec cm °C
TABLE 25.—Thermal conductivities of drill cores from Eniwetok Atoll, Marshall Islands
Core Depth (feet)
Porosity (percent)
Bulk density (g per cm3)
Air- dried
Satu rated
Mean temp erature (°0)
Thermal conductivity (10-3 cai per sec cm °C)
Air- dried
Satu rated
A. BASALT DRILL CORES PROM DRILL HOLE E-l, PARRY ISLAND
[Measured under pressure of 1,400 psi by S. A. H. Qoldstein, U.S. Geological Survey. Cores saturated with tap water in "saturated" measurements]
E-l-4-3 _ . .-.
E-l-5-1— — __
E-l-5-2— -.—
E-l-5-5 .
E-l-5-6... ......
E-l-6-2.. .......
4, 208-4, 211
4,211-4,216
4,211-4,216
4, 211-4, 216
4, 211-4, 216
4, 216-4, 222
0.06.00 .04
2.941.50 2.50
2.962.97 2.99
2.612.68 2.62
2.962.97 2.99
2.642.69 2.65
28.929.0 29.2
28.528.729.0
29.3
29.528.4
29.928.1
29.329.6 29.8
4.995.06 5.30
4.594.184.31
4.57
4.734.54
4.003.87
3.573.63 3.56
5.105.05 5.28
3.833.81 3.87
B. LIMESTONE DRILL CORES
[Measured by Prof. Francis Birch, Dunbar Laboratory, at Harvard University. Cores saturated with a saturated salt solution in "saturated" measurements]
Parry Island
E-1-2-L... ..... .E-l-2-8— ...... E-l-3-1— ... —E-l-3-20--.-.—
E-l-3-24. .......E-1-3-26-......E-l-3-27. .......
2, 802-2, 808 2, 802-2, 808 4, 078-4, 100 4,078-4,1004, 078-4, 100 4,078-4,1004,078-4,100 4,078-4,100
..........2.472.412.472.43 2.482.37
- — —0) 3.5
4.1 5.7 5.3 5.85.4 6.1 5.2
~"~~6~6
6.1
5.8 6.5 5.8
Elugelab island
F-l-11-3— .... . 4, 197-4, 222 2.7
1 Boom temperature.
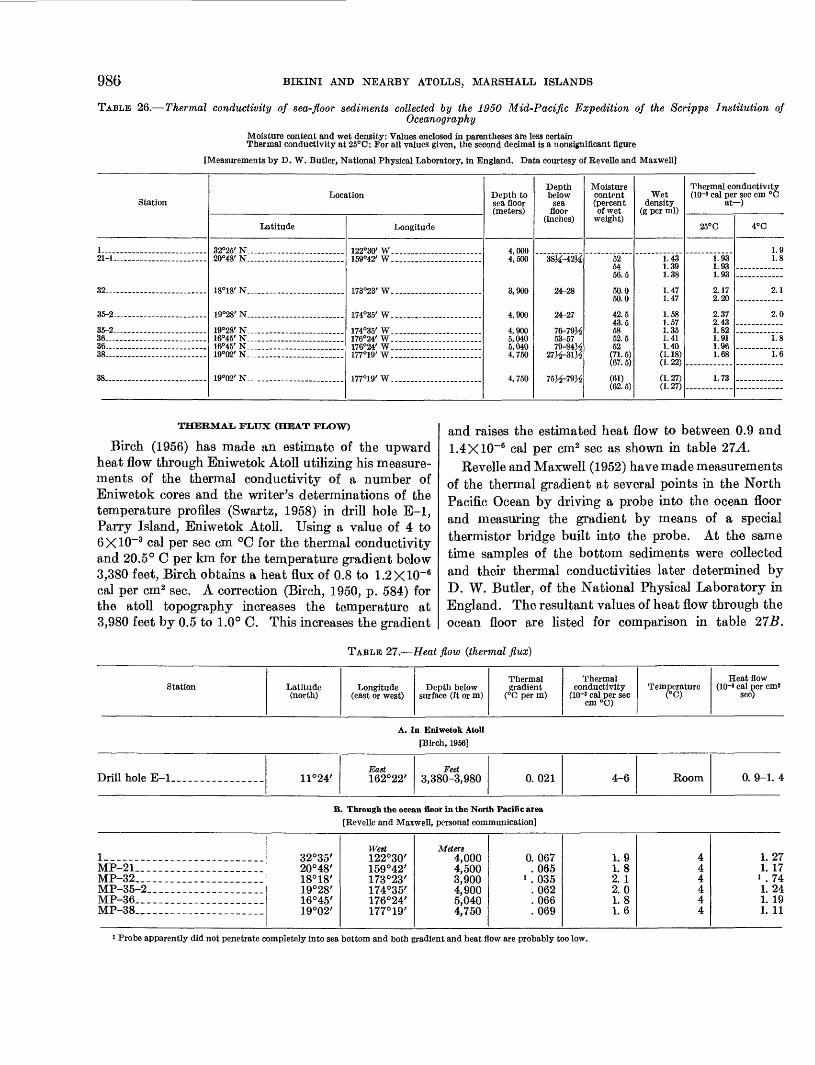
986 BIKINI AND NEARBY ATOLLS, MARSHALL ISLANDS
TABLE 26.—Thermal conductivity of sea-floor sediments collected by the 1950 Mid-Pacific Expedition of the Scripps Institution ofOceanography
Moisture content and wet density: Values enclosed in parentheses are less certainThermal conductivity at 25°0: For all values given, the second decimal is a nonsignificant figure
[Measurements by D. W. Butler, National Physical Laboratory, in England. Data courtesy of Eevelle and Maxwell]
Station
1... _____ . __ ....21-1—.—.................
32.. ........................
35-2—— ————.._—
35-2.......................36-........— .............36———— ..................38—— .-..—.. .............
38....———— ...............
Location
Latitude
32°25' N— ....................20°48' N—— ..... ...............
18°18' N.. _————————.__—_
19°28' N...... ...................
19°28' N. .......... ..............16°45'N__ — ....................16°45' N. .....................19°02' N.__..._————— ——— —
19°02' N_.____.——— ——— ———
Longitude
122°30/ W. ......................159°42' W.......................
170090; TIT
174°35' W... ............. — ....
174°35' W. ......................176°24' W. ......................176°24' W. ......................177°19' W. ........... ........ ...
177°19' W. ......................
Depth to sea floor (meters)
4,0004,500
3,900
4,900
4,900 5,040 5,040 4,750
4,750
Depth below
sea floor
(inches)
38^-42Ji
24-28
24-27
76-79J^ 53-57 79-84J^
27J*_-31^
75J^-79^
Moisture content (percent of wet
weight)
52 54 56.5
50.0 50.0
42.5 43.5 58 52.5 52
(71.5) (67. 5)
(61) (62. 5)
Wet density
(g per ml)
1.43 1.39 1.38
1.47 1.47
1.58 1.57 1.35 1.41 1.40
(1.18) (1.22)
(1.27) (1.27)
Thermal conductivity (10-3 Cal per sec cm °G
at—)
25°G
1.93 1.93 1.93
2.17 2.20
2.37 2.43 1.82 1.91 1.96 1.68
1.73
4°C
1.91.8
2.1
2.0
1.8
1.6
THERMAL FLUX (HEAT FLOW)
Birch (1956) has made an estimate of the upward heat flow through Eniwetok Atoll utilizing his measure ments of the thermal conductivity of a number of Eniwetok cores and the writer's determinations of the temperature profiles (Swartz, 1958) in drill hole E-l, Parry Island, Eniwetok Atoll. Using a value of 4 to 6X10"3 cal per sec cm °C for the thermal conductivity and 20.5° C per km for the temperature gradient below 3,380 feet, Birch obtains a heat flux of 0.8 to 1.2X10~6 cal per cm2 sec. A correction (Birch, 1950, p. 584) for the atoll topography increases the temperature at 3,980 feet by 0.5 to 1.0° C. This increases the gradient
and raises the estimated heat flow to between 0.9 and 1.4X10"6 cal per cm2 sec as shown in table 27-4.
Revelle and Maxwell (1952) have made measurements of the thermal gradient at several points in the North Pacific Ocean by driving a probe into the ocean floor and measuring the gradient by means of a special thermistor bridge built into the probe. At the same time samples of the bottom sediments were collected and their thermal conductivities later determined by D. W. Butler, of the National Physical Laboratory in England. The resultant values of heat flow through the ocean floor are listed for comparison in table 27B.
TABLE 27.—Heat flow (thermal flux)
Station Latitude (north)
Longitude (east or west)
Depth below surface (ft or m)
Thermal gradient
(°G per m)
Thermal conductivity
(10~3 cal per sec cm°G)
Temperature <°C)Heat flow
(10~6 cal per cms sec)
A. In Eniwetok Atoll[Birch, 1956]
Drill hole E-l. _______________ 11°24' East 162°22'
Feet 3,380-3,980 0.021 4-6 Room 0. 9-1. 4
B. Through the ocean floor in the North Pacific area
[Eevelle and Maxwell, personal communication]
1 _ -__-__.___________.__._.MP-21___. ___________ _ _.__MP-32.____. ________________MP-35-2____________________MP-36_____________ __ _____MP-38______________________
32°35'20°48'18°18'19°28'16°45'19°02'
West 122°30'159°42'173°23'174°35'176°24'177°19'
Meters 4,0004,5003,9004,9005,0404,750
0 067065
1 035062066069
1.91.82. 12.01.81.6
444444
1.271. 17i.741.241. 191. 11
Probe apparently did not penetrate completely into sea bottom and both gradient and heat flow are probably too low.

SOME PHYSICAL CONSTANTS FOR THE MARSHALL ISLANDS AREA 987THERMAL GRADIENTS
Thermal gradients in continental drill holes are customarily given in terms of the slope of the best straight line that can be fitted to the data by least squares. The data for the atoll drill holes and for the ocean have several segments of very different slopes. For this reason a single straight line would be meaning less. All four curves show a decrease in temperature from the surface down to depths of some thousands of feet, thus contrasting sharply with continental curves which, below a shallow surface zone, show a steady in crease of temperature with depth. Four gradient zones can be recognized, but not all appear in a single profile. In the ocean profile a near-surface zone whose thickness varies with the time of year has the same temperature throughout and is known as the isothermal zone. Be neath it is a zone of rapid temperature decrease, known as the thermocline. Below this lies a zone of continued but less rapid decrease in temperature, sometimes called the zone of weak gradient, for which the writer (Swartz, 1958, p. 728) has suggested the name astheno- cline. In profiles from the atoll drill holes the iso thermal zone is not recognized. The upper zone repre sents the thermocline. This in turn is underlain by the asthenocline. Below the asthenocline in drill hole E-l, at a depth of approximately 3,380 feet, the downward trend is reversed and the temperature rises with further increase in depth as in the continental drill holes. For this section the writer suggests the name "epeirocline" from the Greek epeiros, mainland, and klinien, to incline. Neither drill hole F-l on Elugelab or 2 B on Bikini reached the depth of gradient reversal.
Table 28 lists the gradients of the best straight lines fitted to each of the segments. Table 2' gradients as actually measured for each interval.
The positive axis is selected vertically downward so that an increase of temperature with depth, as in conti nental drill holes, will give a positive gradient.
TABLK 28.— Thermal gradients in Eniwetok and Bikini Atolls, and for the Pacific Ocean in the Marshall Islands area- linear segments fitted to the data by least squares
[See also Swartz (1958), table 14]
Drill hole
E-l-_-___-_.
F-l
2B..____.__.
Ocean ______
Zone
Thermocline _ ___ _Asthenocline- _________Epeirocline __ _____ __Thermocline _ ______Asthenocline____ _ _ _
Asthenocline (?)____ _Isothermal ___ __ _ __Thermocline___ __ _ _Asthenocline- _______ _
Depth interval (feet)
4-1, 400
1, 500-3, 1803, 580-3, 980
24-1, 0501, 100-3, 100
4-1, 0001, 000-1, 430
0-200300-700800-4, 000
Thermal (°Cperm)
-0. 047-.007+ . 021
-.068-.003
-.030-. 018
.000-. 124-.006
negative gradient will then be one in which the temper ature decreases with increasing depth.
The positive gradient near the bottom of drill hole E-l is only about half that found for drill holes along the California shore. This suggests that the atoll gradient may be too low and probably is still affected, even at the maximum depth reached, by the cooling effect of the adjacent ocean waters.
TABLE 29.—Thermal gradients in Eniwetok and Bikini Atolls and for the Pacific Ocean in the Marshall Islands area—actual gradient for each measured interval
t zones profile, ickness erature e. Be- known itinued aetimes j writer stheno- he iso- 3 repre- by the leE-1, vnward further s. For "ocline" ien, to 2 B on
it lines sts the il. \rard so a conti- ait. A
tolls, and iients for
Thermal (°Cperm)
-0. 047 -.007 + . 021
-.068-.003
-.030 -. 018
.000 -. 124 -.006
Depth interval (ft)
Gradient (°C per
m)
Depth interval (ft)
Gradient (°C per
m)
Depth interval (ft)
Gradient (°C per
m)
A. Drill hole E-l, Parry Island, Eniwetok Atoll
[September 10, 1958. See also Swartz (1958), table 15]
3.8-27.8--———27.8-52.8.-.. __52.8-77.8. ...... .77.8-102.8.......102.8-127.8.-...127.8-152.8 _ ...152.8-177.8. ——177.8-202.8.——. 202.8-227.8. ——— 227.8-252.8-——_252. 8-277.8.——277.8-302.8. .....302.8-327.8 _ ... 327.8-377.8 _ ...377.8-402.8 __ .-
-0.044 -.031 -.058 -.046 -.056-.059 -.052 -.047 -.041 -.046 -.038 -.046 -.031 -.054 -.046
402.8Ht50.3-. 450.3-500.3——— 500.3-600.3———600.3-700.3———700.3-800.3——.800.3-900.3———900.3-1,000.3—. 1,000.3-1,100.3.- 1,100.3-1,200.3-. 1,200.3-1,300.3.. 1,300.3-1,400.3.. 1,400.3-1,500.3.. 1,500.3-1,600.3.. 1,600.3-1,700.3.. 1,700.3-1,800.3..
-0.060 -.077 -.035 -.034 -.043 -.070 -.006 -.032 -.027 -.043 -.051 -.001 -.019 -.036 -.002
1,800.3-1,900.3. 1,900.3-2,000.3. 2,000.3-2,080... 2,080-2,280—— 2,280-2,380- ___ 2,380-2,580. _ . 2,580-2,680—— 2,680-2,780—— 2,780-2,980——. 2,980-3,180—— 3,180-3,380—— 3,380-3,580—— 3,580-3,780—— 3,780-3,980——
-0. 010 -.007 -.008 -.006 -.007 -.006 -.006 -.009 -.008 -.005 +.005 +.012 +.019 +.018
B. Drill hole F-l, Elugelab island, Eniwetok Atoll
[October 29, 1952. See also Swartz (1958), table 15]
24.1-48.1-—— _48.1-73.1 _ ——73.1-99.3 ___ ..99.3-123.1 ___ ..123.1-148.1 ___ .148.1-173.1.——.173.1-199.3 __ ..199.3-223.1 __ ...223.1-248.1 __ ..248.1-273.1 __ ...273.1-299.3.——.
-0.030046
-.045-.039 -.025 -.012-.018 -.023 -.041 -.075 -.031
299.3-323.1———323.1-348.1———348.1-373.1———373.1-399.3———399.3-423.1. __ .423.1-450.3— _450.3-500.5— _500.5-550.3 ______ 550.3-600.5——— 600.5-650.3——— 650.3-700.5———
-0.070 -.047 -.062 -.046 -.120 -.012 -.096 -.113 -.086-.118 -.155
700.5-750.3—— 750.3-800.5——800.5-850.3—— 850.3-900.5—— 900.5-950.3—— 950.3-1,050.3— 1,050.3-1,100.5. 1,100.5-1,150.3. 1,150.3-1,250.3. 1,250.3-1,300.3. 1,300.3-1,400.0.
-0.053 -.056 -.024 -.059 -.024 -.032 -.010 -.013 -.008 -.011 -.006
C. Drill hole 2B, Bikini island, Bikini Atoll
[November 29, 1952. See also Swartz (1958), table 15]
4-28—— _ . _ .28-53... __ ....53-78—————__78-103.—— _____103-128- __ ____128-153—————153-178—.——178-203.—————
-0.090 -.052 -.025 -.032 -.032 -.020 -.050-.000
203-228 _________228-253.. _______253-278—————278-303—————303-328 _____ -328-353. _ .....353-378 __ _ _378Ht03_— ___ ..
-0.026 -.041 -.004 -.021 -.014 -.012-.024 -.014
403-500———500-600———600-700. _ ____700-800. _ ——800-1,000... _1,000-1,200——1,200-1,400—— 1,400-1,430——
-0.023 -.049 -.031-.053 -.041 -.017 -.019 -.019
D. The Pacific Ocean in the Marshall Islands area
[November 1952. See also Swartz (1958), table 15]
0-200——————200-300- __ ——300-400— __ ..400-500- ____
0.000 -.036 -.112 -.164
500-600————600-700—————700-800—————800-1,000————
-0. 089 -.128-.036-.010
1,000-1,500—— 1,500-2,000—— 2,000-3,000 _._._3,000-4,000——
-0.009 -.007 -.006 -.005
REFERENCES
Adams, F. D., and Coker, E. G., 1906, Investigations into the elastic constants of rocks: Carnegie Inst. WashingtonT>nK A ft
988 BIKINI AND NEARBY ATOLLS, MARSHALL ISLANDS
American Society for Testing Materials, 1942a, Standard methods of test for absorption and apparent specific gravity of natural building stone. ASTM Designation: C97-36: ASTM Standards 1942, pt. 2, p. 177-178.
———— 1942b, Standard method of flexure testing of natural building stone, determination of modulus of rupture. ASTM Designation: C99-36: ASTM Standards 1942, pt. 2, p. 179-180.
———— 1942e, Standard methods of test for modulus of elasticity of natural building stone. ASTM Designation: C100-36: ASTM Standards 1942, pt. 2, p. 181-184.
———— 1942d, Standard methods of test for apparent porosity, water absorption, specific gravity, and bulk density of burned refractory products. ASTM Designation: C20-41: ASTM Standards 1942, pt. 2, p. 278-280.
———— 1942e, Standard method of test for true specific gravity of burned refractory materials. ASTM Designation: C135-40: ASTM Standards 1942, pt. 2, p. 281-282.
———— 1942f, Standard method of test for toughness of rock. ASTM Designation: D3-18: ASTM Standards 1942, pt. 2, p. 427-428.
———— 1942g, Standard definitions of terms relating to methods of testing, ASTM Designation: E6-36: ASTM Standards 1942, pt. 2, p. 1005-1009.
———— 1942h, Standard definitions of terms relating to specific gravity. ASTM Designation: E12-27: ASTM Standards 1942, pt. 2, p. 1010-1011.
———— 1942J, Tentative method of test for compressive strength of natural building stone. ASTM Designation: C170-41T: ASTM Standards, 1942, pt. 2, p. 1102-1104.
———— 1949a, Standard methods for test of absorption and bulk specific gravity of natural building stone: ASTM designa tion: 097-47: ASTM Standards, 1949, pt. 3, p. 523-525.
———— 1949b, Standard method of test for compressive strength of natural building stone. ASTM Designation: C170-46: ASTM Standards 1949, pt. 3, p. 526-528.
———— 1949c, Standard method of test for modulus of rupture of natural building stone. ASTM Designation: C99-47: ASTM Standards 1949, pt. 3, p. 529-531.
———— 1952a, Tentative method of test for fundamental trans verse and torsional frequencies of concrete specimens. ASTM Designation: C215-52T: ASTM Standards 1952, pt. 3, p. 1072-1075.
———— 1952b, Standard definitions of terms relating to methods of testing. ASTM Designation: E6-36: ASTM Standards 1952, pt. 3, p. 1588-1592.
———— 1952c, Standard definitions of terms relating to specific gravity. ASTM Designation: E12-27: ASTM Standards 1952, pt. 3, p. 1594-1595.
1952d, Symposium on determination of elastic constants:ASTM Spec. Tech. Pub. 129.
Balmer, G. G., 1946, A revised method of interpretation of tri-axial compression tests for the determination of shearingstrength: U.S. Bur. Reel. Structural Lab. Rept. SP-9.
———— 1952, A general analytic solution for Mohr's envelope:ASTM Proc., v. 52, p. 1260-1271.
1953, Physical properties of some typical foundationrocks: U. S. Bur. Reel. Concrete Lab. Rept. SP-39, 17 p.,38 sheets, 2 tables, 8 figures.
Birch, Francis, 1950, Flow of heat in the Front Range, Colorado:Geol. Soc. America Bull., v. 61, p. 567-630.
———— 1956, Heat flow in Eniwetok Atoll: Geol. Soc. AmericaBull., v. 67, p. 941-942.
Bullard, E. C., 1952, Heat flow through the floor of the eastern North Pacific Ocean: Nature, v. 170, p. 202-203.
Dobrin, M. B., 1950, Submarine geology of Bikini Lagoon as indicated by dispersion of water-borne explosive waves: Geol. Soc. America Bull., v. 61, p. 1091-1118.
Dobrin, M. B., and Perkins, Beauregard, Jr., 1954, Seismic studies of Bikini Atoll: U.S. Geol. Survey Prof. Paper 260-J, p. 487-505.
Dobrin, M. B., Perkins, Beauregard, Jr., and Snavely, B. L., 1949, Subsurface constitution of Bikini Atoll as indicated by a seismic refraction survey: Geol. Soe. America Bull., v. 60, p. 807-828.
Emery, K. O., Tracey, J. I., Jr., and Ladd, H. S., 1954, Geology of Bikini and nearby atolls: U.S. Geol. Surv. Prof. Paper 260-A, p. 1-265.
Ewing, W. M., Jardetzky, W. S., and Press, Frank 1957, Elastic waves in layered media: New York, McGraw-Hill, 380 pp.
Greaves, R. H., 1909-10, The physical interpretation of hardness as measured by the Shore scleroscope: Inst. Civil Engineers [London], Proc. v. 181, p. 478-479.
Koenigsberger, J. G., 1938, Natural residual magnetism of eruptive rocks: Terrestrial Magnetism, v. 43, p. 119-130, 299-320.
Ladd, H. S., Ingerson, Earl, Townsend, R. C., Russell, Martin, and Stephenson, H. K., 1953, Drilling on Eniwetok Atoll, Marshall Islands: Am. Assoc. Petroleum Geologists Bull., v. 37, no. 10, p. 2257-2280.
Ladd, H. S. and Schlanger, S. O., 1960, Drilling operations on Eniwetok Atoll: U.S. Geol. Survey Prof. Paper 260-Y.
Ladd, H. S., Tracey, J. I., Jr., and Lill, G. G., 1948, Drilling on Bikini Atoll, Marshall Islands: Science, v. 107, no. 2768, p. 51-55.
Ladd, H. S., Tracey, J. I., Jr., Lill, G. G., Wells, J. W., and Cole, W. S., 1948, Drilling on Bikini Atoll, Marshall Islands: Internat. Geol. Cong., 18th Session, Great Britain, 1948, Rept. Part 8, p. 38-43.
Love, A. E. H., 1927, Mathematical theory of elasticity, 4th Ed.: Cambridge Univ. Press.
McCoy, Ernest E., and Mather, Bryant, 1954. Dynamic test ing of materials; with discussion: Highway Research Board Proc. 33d Ann. Meeting, v. 33, p. 256.
Macdonald, G. A., Petrography of the basalt beneath the lime stone, in Schlanger, S. O., 1962. (In press.)
Macelwane, J. B., Pt. 1, Geodynamies, in Macelwane, J. B., and and Sohon, F. W., 1932, Introduction to theoretical seis mology: St. Louis Univ., St. Louis, Mo., 366 p.
Michelsen, P. F., 1951, A new high-sensitivity remanent mag netometer: George Washington Univ., Elec. Eng. Pro- seminar 189, Washington, D.C.
———— 1952, A magnetic susceptibility bridge: George Wash ington Univ., Elec. Eng. Proseminar 190, Washington, D.C.
Mohr, O., 1900, Welche umstande bedingen die elastizitatsgrenze an den Bruch eines materials: Zeitschr. Deutsche Inginieure, v. 44, p. 1524.
———— 1914, Abhandlungen aus dem Gebiete der technischen Mechanik, 2d ed., Berlin.
Obert, Leonard, and Duvall, Wilbur, 1941, Discussion of dy namic methods of testing concrete, with suggestions for standardization: ASTM Proc., v. 41, p. 1063.
Obert, Leonard, Windes, S. L., and Duvall, W. I., 1946, Stand ardized tests for determining the physical properties of mine rock: U.S. Bur. Mines Rept. Inv. 3891, 67 p.
Pao, Yoh Han, and Marin, Joseph, 1952, Predictions of creep curves from stress-strain data, with discussion: ASTM Proc., v. 52, p. 951-961.
SOME PHYSICAL CONSTANTS FOR THE MARSHALL ISLANDS AREA 989
Perkins, Beauregard, Jr., 1952, Letter to the editor: Geophysics, v. 17, p. 411-412.
———— Coordination of seismic data, Bikini Atoll, in Raitt, Russell W., 1954, Seismic refraction studies of Bikini and Kwajalein Atolls: U.S. Geol. Survey Prof. Paper 260-K, p. 525-526.
Perkins, Beauregard, Jr., and Lill, G. G., 1948, Velocity studies on Bikini Island: U.S. Navy, Office Naval Research Monthly Research Rept., July 1, 1948, p. 13-17.
Pickett, Gerald, 1945, Equations for computing elastic constants from flexural and torsional resonant frequencies of vibration of prisms and cylinders: ASTM Proc., v. 45, p. 846-863.
Powers, T. C., 1938, Measuring Young's modulus of elasticity by means of sonic vibrations: ASTM Proc., v. 38, pt. 2, p. 460.
Raitt, R. W., 1951, Seismic refraction studies of the Pacific Ocean Basin, (title only): Seismol. Soc. America Bull., v. 41, no. 3, p. 255.
———— 1954, Seismic refraction studies of Bikini and Kwajalein Atolls, with a section on coordination of seismic data, Bikini Atoll, by Beauregard Perkins, Jr.: U.S. Geol. Survey Prof. Paper 260-K, p. 507-525, 527.
———— 1956, Seismic refraction studies of the Pacific Ocean Basin, Pt, 1, Crustal thickness of the central equatorial Pacific: Geol. Soc. America Bull., v. 67, p. 1623-1640.
1957, Seismic refraction studies of Eniwetok Atoll: U.S.Geol. Survey Prof. Paper 260-S, p. 685-698.
Rayleigh, J. W. S., 1926, Theory of sound: New York, Mac- millan.
Revelle, Roger, and Maxwell, Arthur E., 1952, Heat flow through the floor of the eastern North Pacific Ocean: Nature, v. 170, p. 199-202.
Schlanger, S. O., 1962, Subsurface geology of Eniwetok Atoll: U.S. Geol. Survey Prof. Paper 260-BB. (In press.)
Swartz, J. H., 1953, Thermal gradients in Eniwetok Atoll (title only): Am. Geophys. Union Trans., v. 34, p. 325.
———— 1954, A geothermal measuring circuit: Science, v. 120, no. 3119, p. 573-574.
1958, Geothermal measurements on Eniwetok and BikiniAtolls: U.S. Geol. Survey Prof. Paper 260-U, p. 711-741.
Teller, L. W., 1956, Elastic properties, in Significance of tests and properties of concrete and concrete aggregates: ASTM Spec. Tech. Pub. 169, p. 94-103.
Topping, A. D., 1955, The use of experimental constants in the application of theories of strength to rock: Purdue Univ., Purdue Eng. Expt. Sta. Research Bull. 129, p.178-192.
U.S. Bureau of Reclamation, 1949, Concrete manual: 5th ed., 489 p.
[U.S.] National Bureau of Standards, 1951, Recommendations of the International Commission on Radiological Protec tion and of the International Commission on Radiological Units, 1950: Handbook 47.
Wegel, R. L., and Walther, H., 1934, Internal dissipation in solids for small cyclic strains: Physics, v. 6, p. 141.
Whitehurst, E. A., and Parker, W. E., 1956, Dynamic tests, in Significance of tests and properties of concrete and concrete aggregates: ASTM Spec. Tech. Pub. 169, p. 104-114.
Williams, S. R., 1942, Hardness and hardness measurements: Cleveland, Ohio, Am. Soc. for Metals, 558 p.
Windes, S. L., 1949, Physical properties of mine rock: U.S. Bur. Mines Rept. Inv. 4459. 79 p.
———— 1950, Physical properties of mine rock, Pt. 2: U.S. Bur.Mines Rept. Inv. 4727, 37 p.
Zisman, W. A., 1933, Comparison of the statically and seis-mologically determined elastic constants of rocks: [U.S.]Natl. Acad. Sci. Proc., v. 19, p. 680-686.
———— 1933, Young's modulus and Poisson's ratio with reference to geophysical applications: [U.S.] Natl. Acad. Sci. Proc., v. 19, p. 653-665.
O