Some Perspectives of Graphical Methods for Genetic DataTan+Li+Luan.pdf · Some Perspectives of...
28
Some Perspectives of Graphical Methods for Genetic Data Zhao JH, Q Tan, S Li, J Luan, W Qian, RJF Loos, NJ Wareham [email protected] http://www.mrc-epid.cam.ac.uk/~jinghua.zhao 14 August 2008, Dortmund, Germany 2008
Transcript of Some Perspectives of Graphical Methods for Genetic DataTan+Li+Luan.pdf · Some Perspectives of...
Some Perspectives of Graphical Methods for Genetic DataZhao JH, Q Tan, S Li, J Luan, W Qian, RJF Loos, NJ Wareham
[email protected]://www.mrc-epid.cam.ac.uk/~jinghua.zhao
14 August 2008, Dortmund, Germany
2008

Outline
• Background• Case studies• Examples from R• General discussion
Background
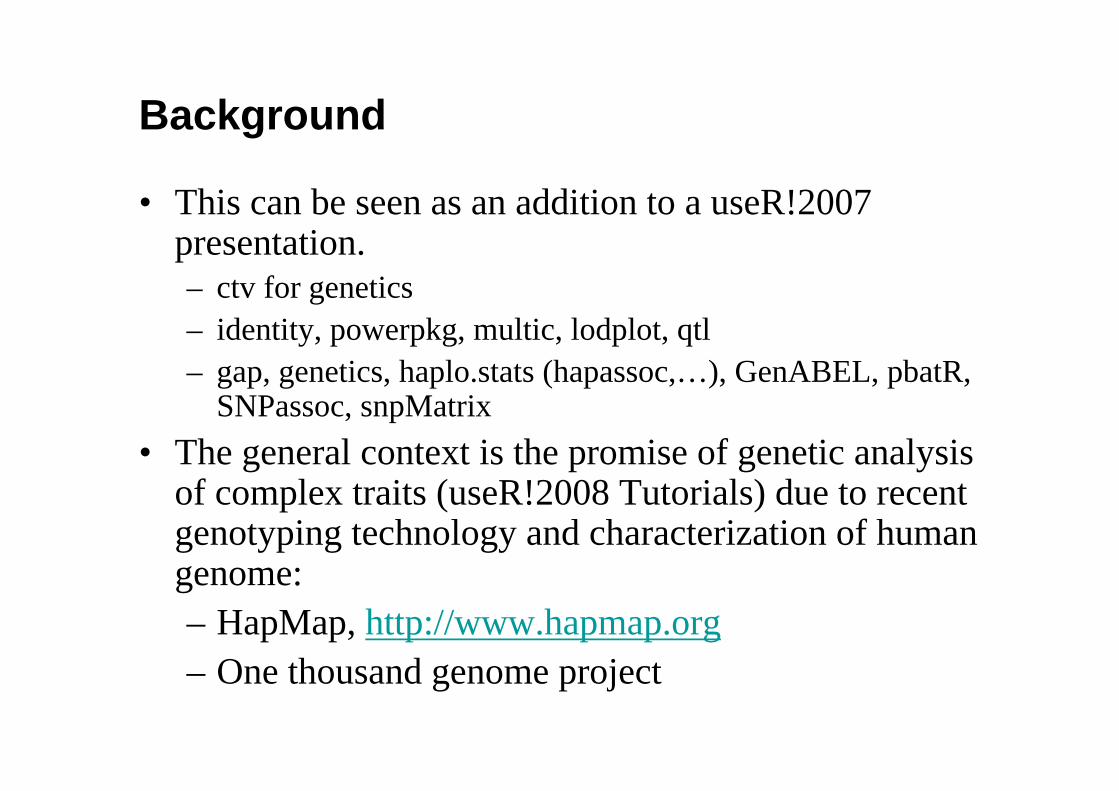
• This can be seen as an addition to a useR!2007 presentation.– ctv for genetics– identity, powerpkg, multic, lodplot, qtl– gap, genetics, haplo.stats (hapassoc,…), GenABEL, pbatR,
SNPassoc, snpMatrix• The general context is the promise of genetic analysis
of complex traits (useR!2008 Tutorials) due to recent genotyping technology and characterization of human genome:– HapMap, http://www.hapmap.org– One thousand genome project
Consortium
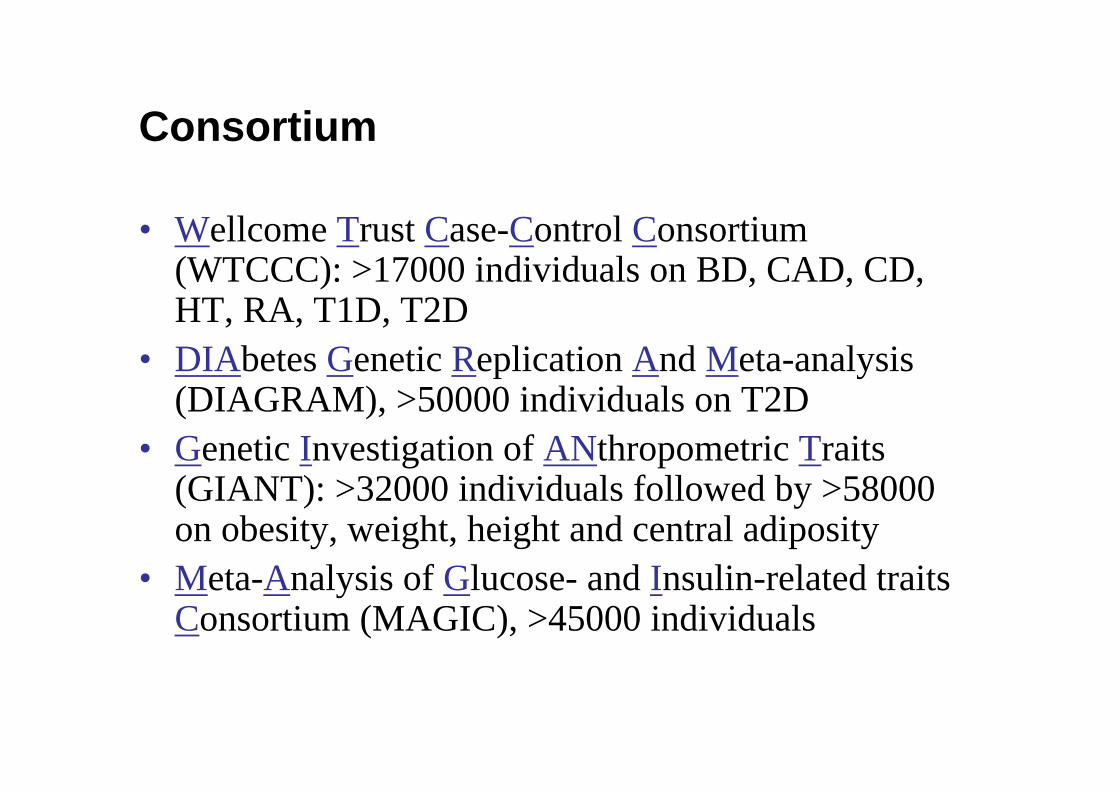
• Wellcome Trust Case-Control Consortium (WTCCC): >17000 individuals on BD, CAD, CD, HT, RA, T1D, T2D
• DIAbetes Genetic Replication And Meta-analysis (DIAGRAM), >50000 individuals on T2D
• Genetic Investigation of ANthropometric Traits (GIANT): >32000 individuals followed by >58000 on obesity, weight, height and central adiposity
• Meta-Analysis of Glucose- and Insulin-related traits Consortium (MAGIC), >45000 individuals
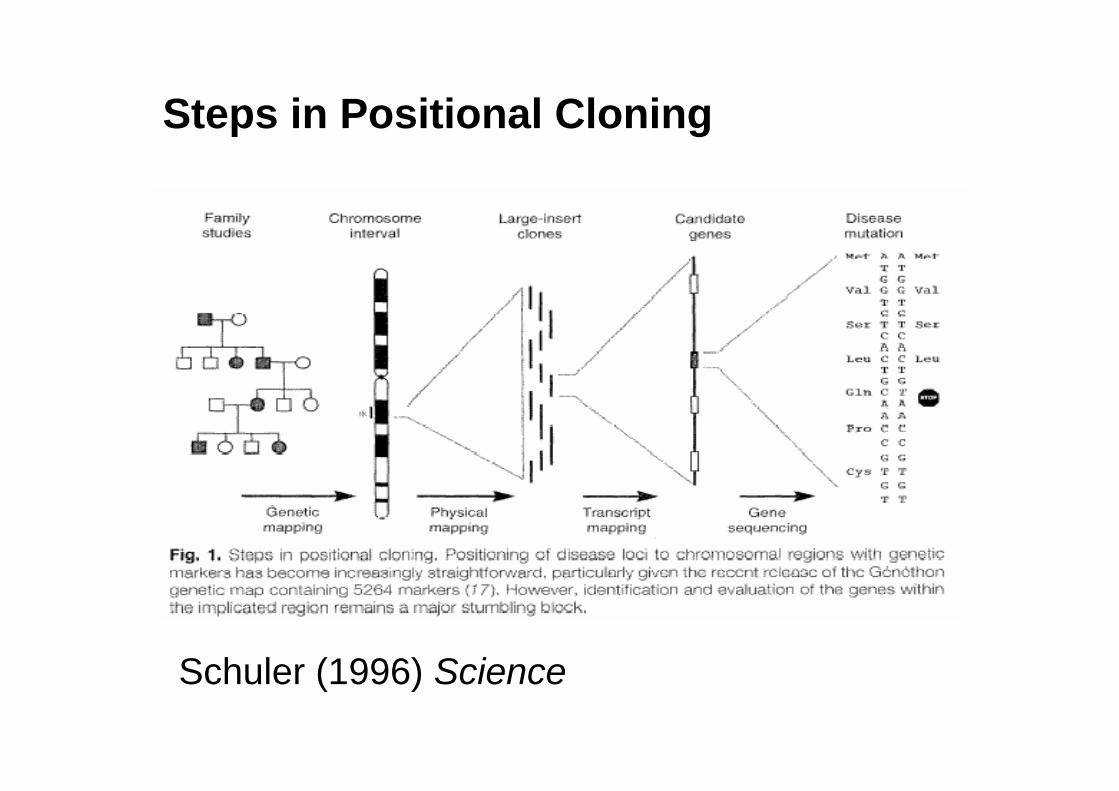
Steps in Positional Cloning
Schuler (1996) Science
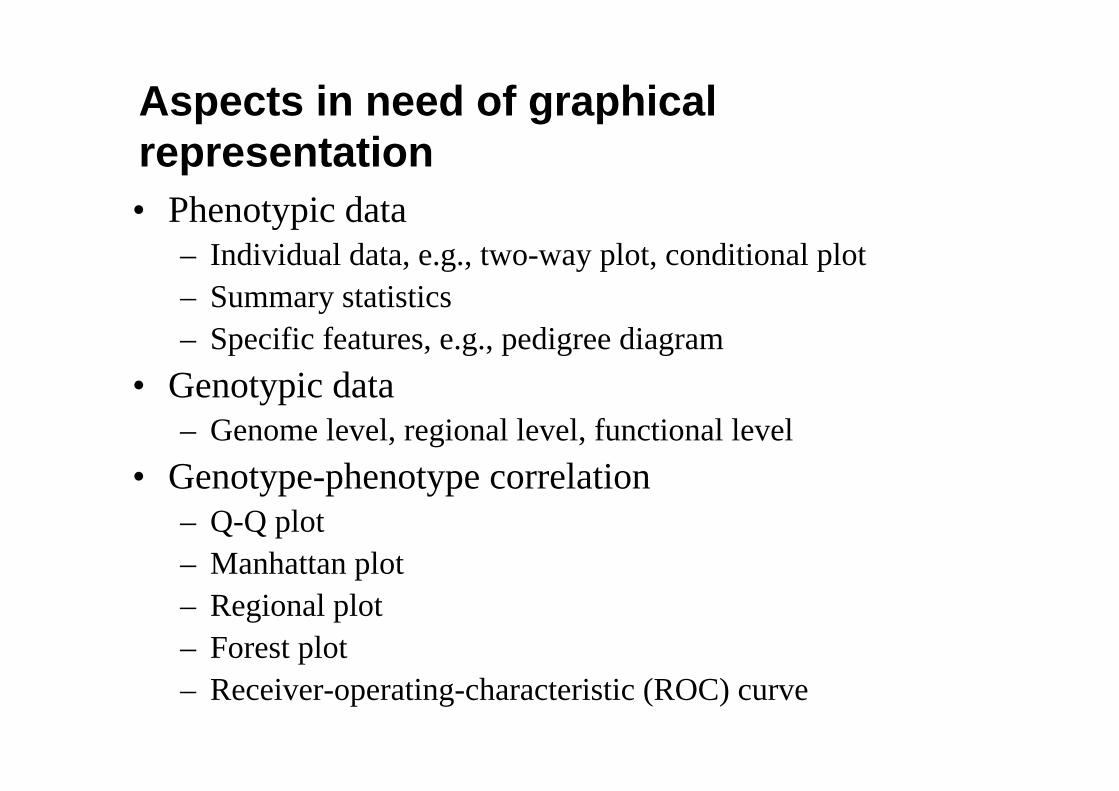
Aspects in need of graphical representation• Phenotypic data
– Individual data, e.g., two-way plot, conditional plot– Summary statistics– Specific features, e.g., pedigree diagram
• Genotypic data– Genome level, regional level, functional level
• Genotype-phenotype correlation– Q-Q plot– Manhattan plot– Regional plot– Forest plot– Receiver-operating-characteristic (ROC) curve
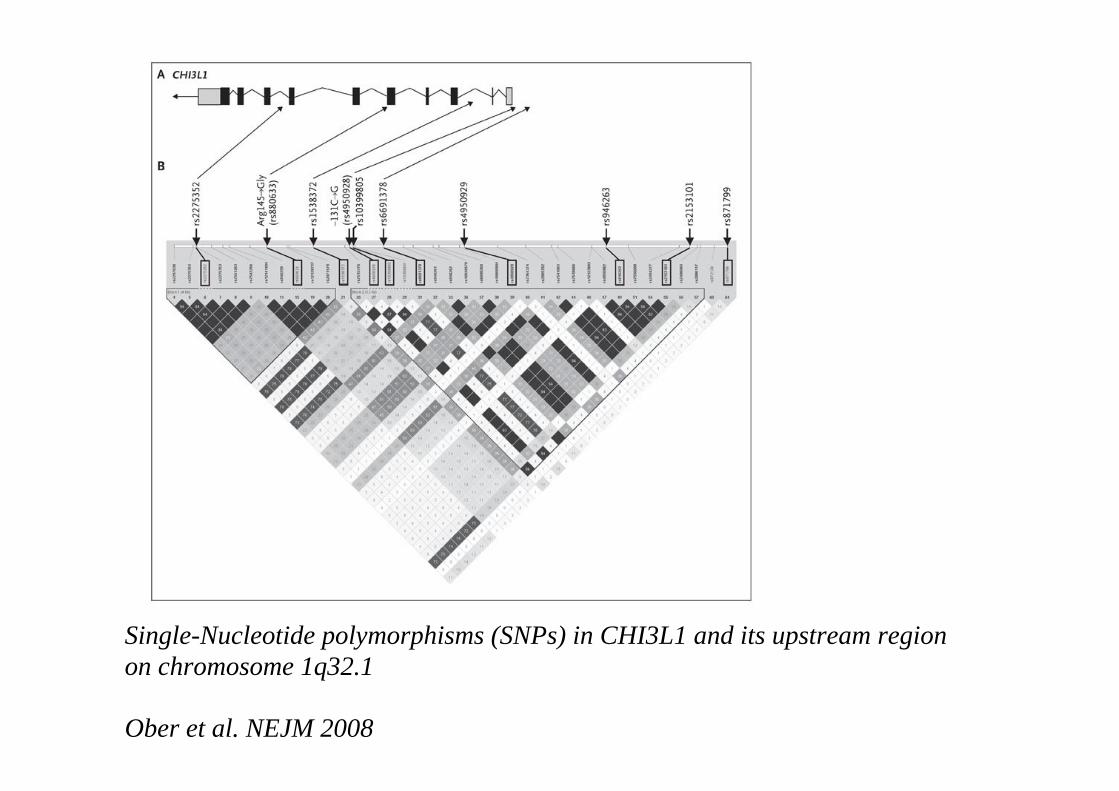
Single-Nucleotide polymorphisms (SNPs) in CHI3L1 and its upstream region on chromosome 1q32.1
Ober et al. NEJM 2008
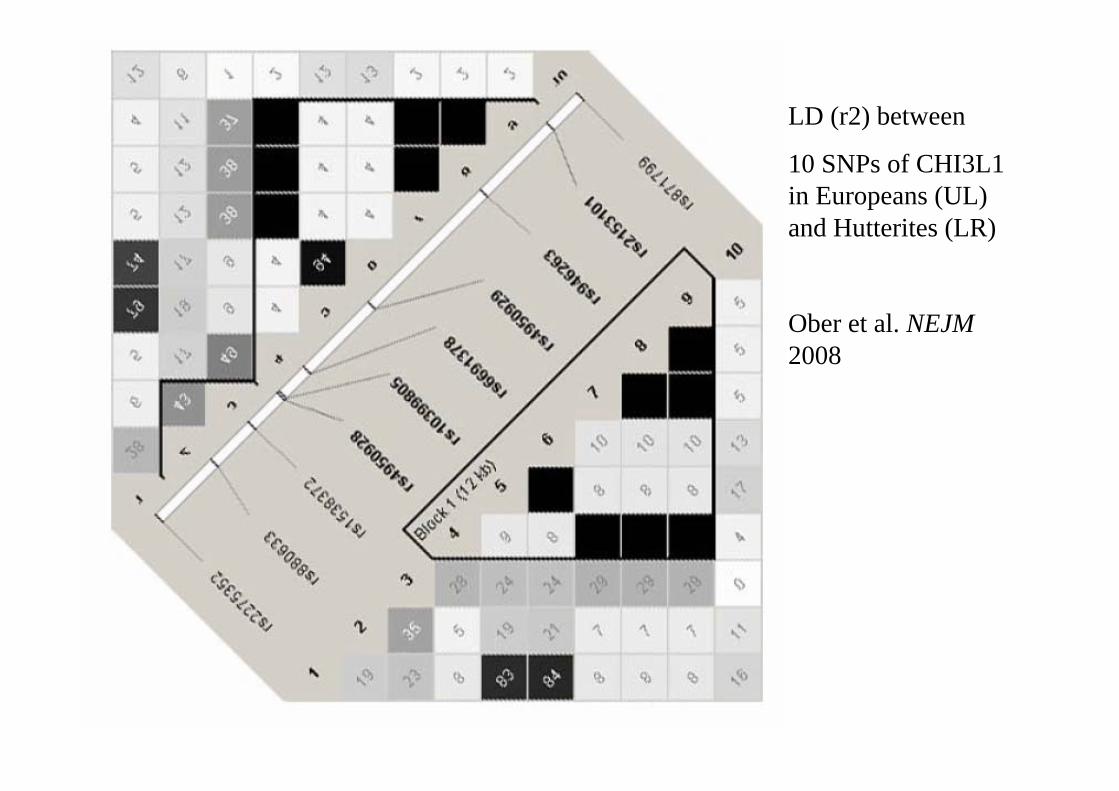
LD (r2) between
10 SNPs of CHI3L1 in Europeans (UL) and Hutterites (LR)
Ober et al. NEJM2008
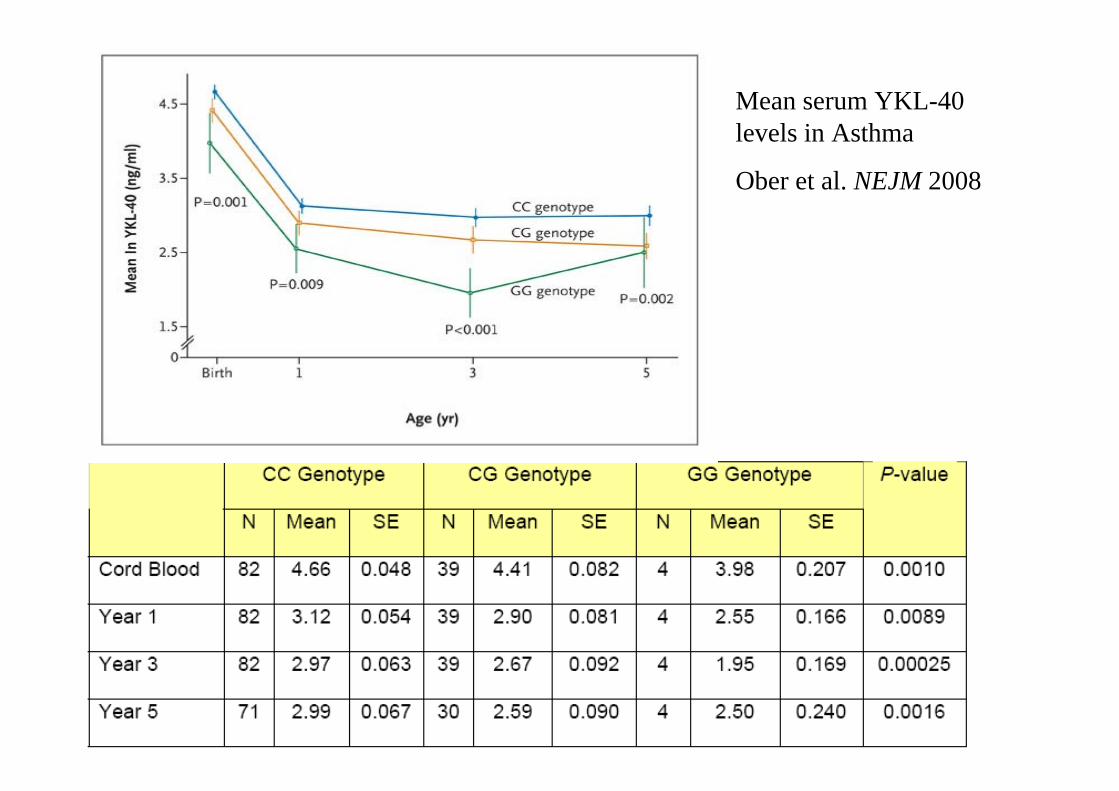
Mean serum YKL-40 levels in Asthma
Ober et al. NEJM 2008
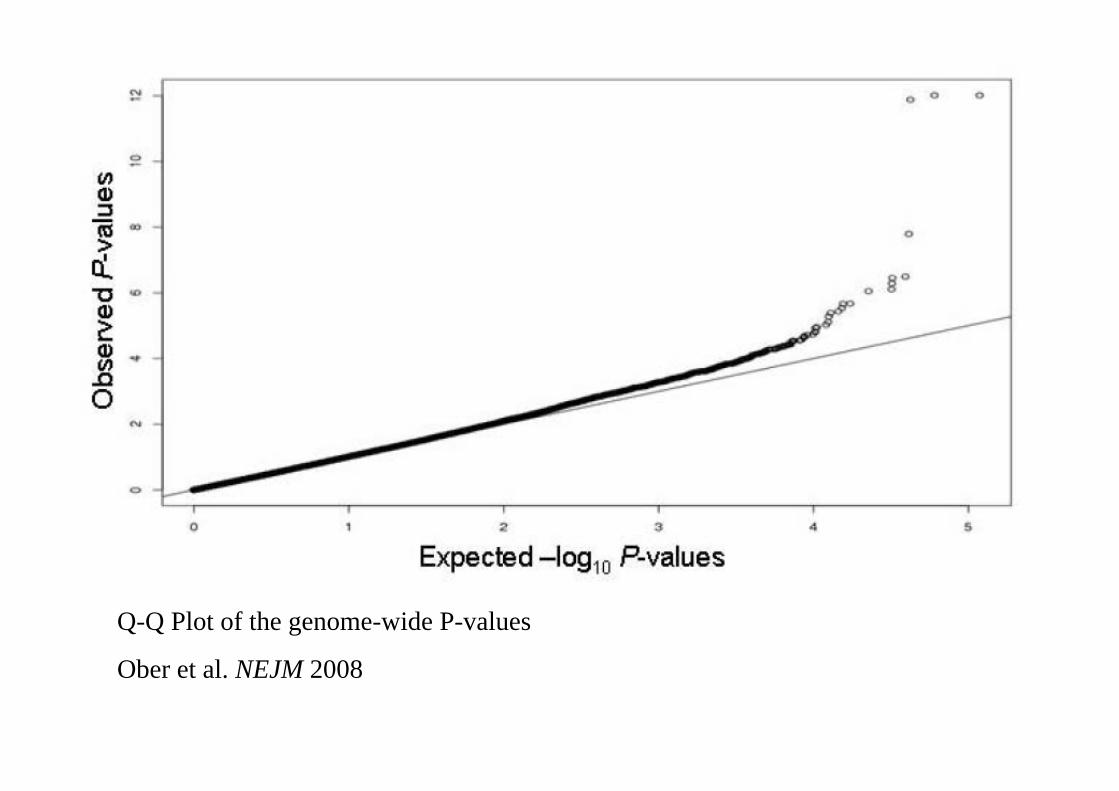
Q-Q Plot of the genome-wide P-values
Ober et al. NEJM 2008
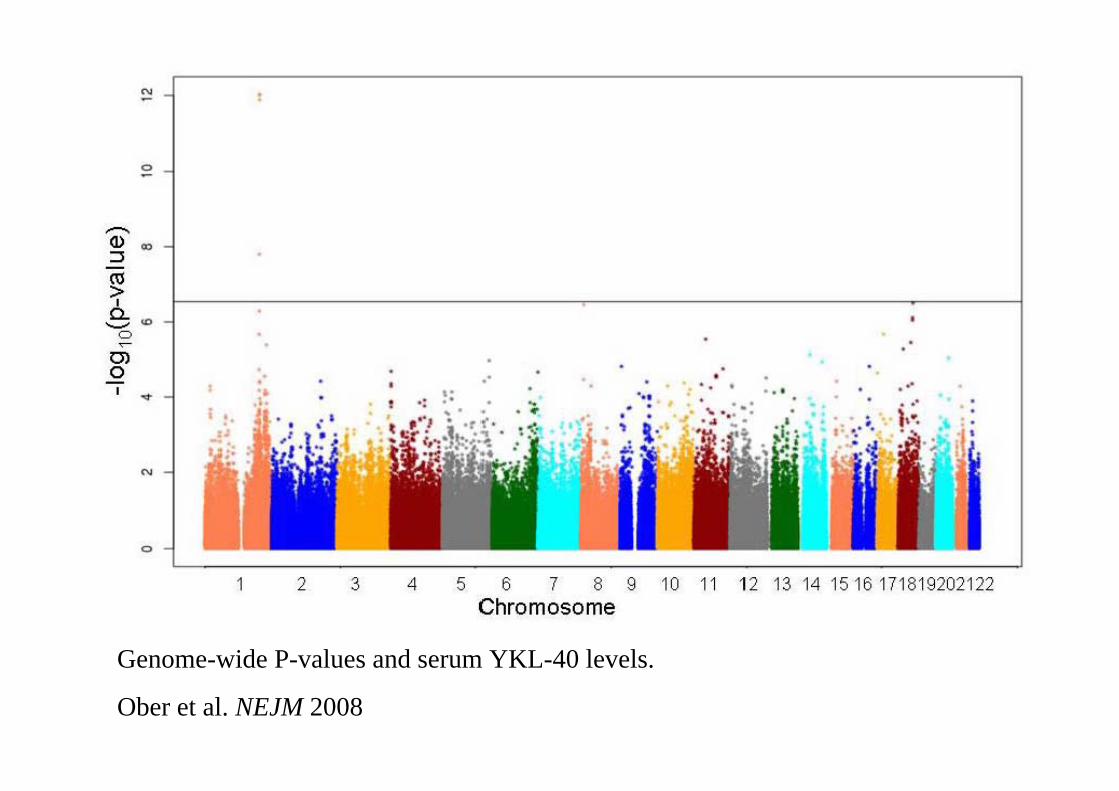
Genome-wide P-values and serum YKL-40 levels.
Ober et al. NEJM 2008
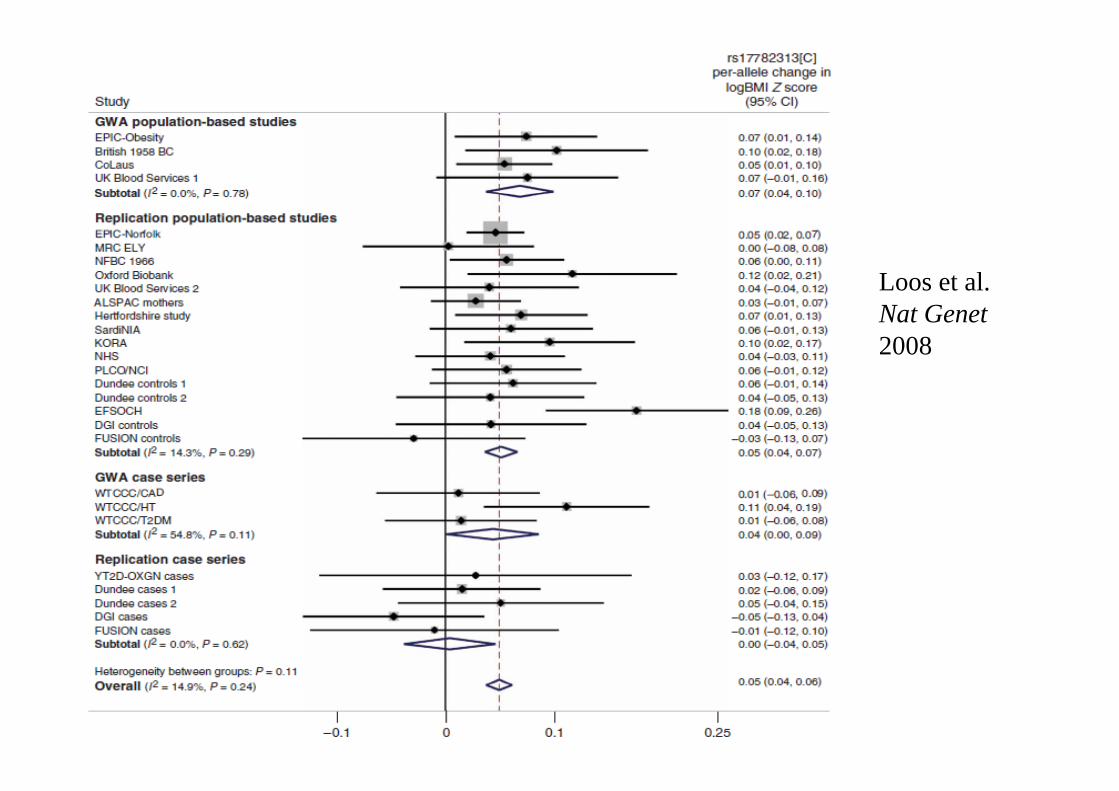
Loos et al. Nat Genet2008
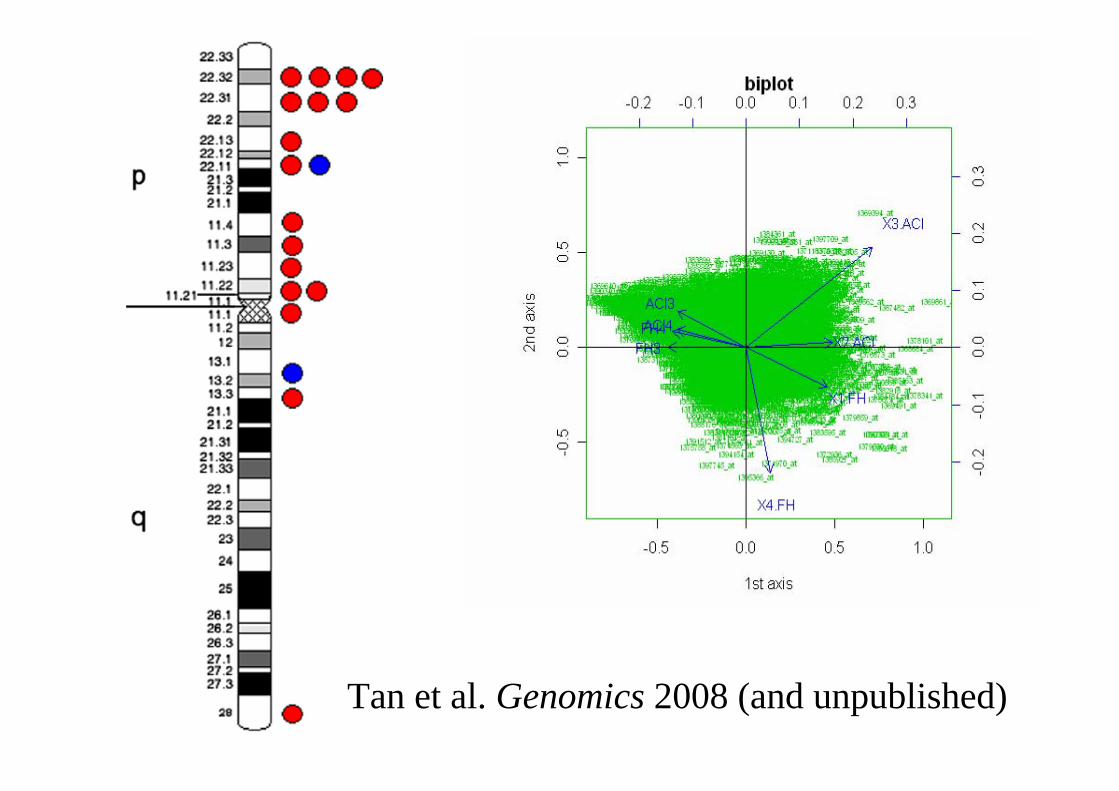
Tan et al. Genomics 2008 (and unpublished)
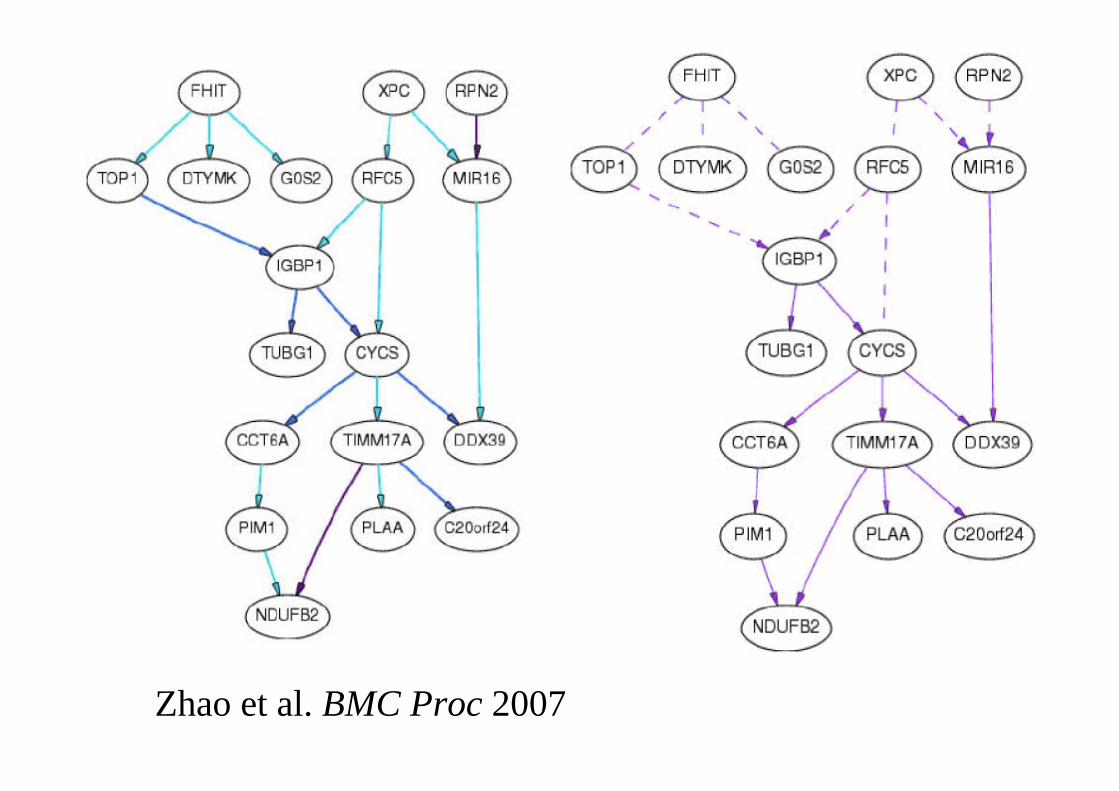
Zhao et al. BMC Proc 2007
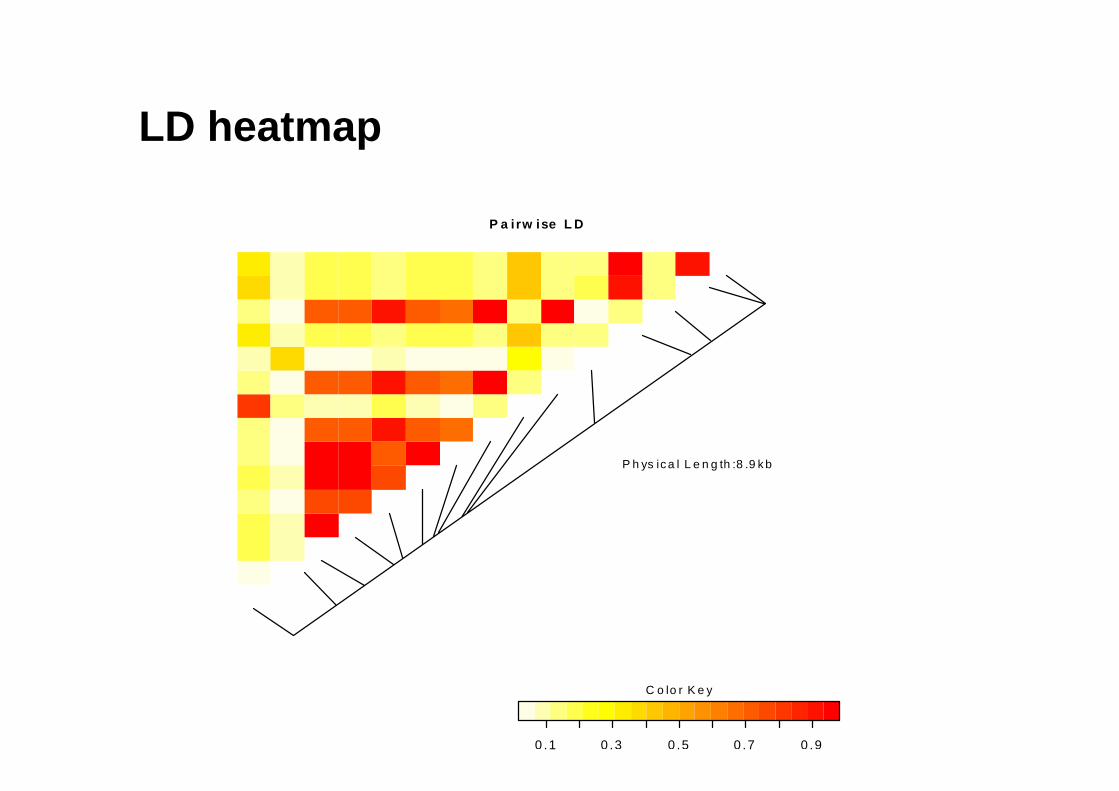
LD heatmap
P a irw ise L D
P h ys ic a l L e n g th :8 .9 k b
0 .1 0 .3 0 .5 0 .7 0 .9
C o lo r K e y
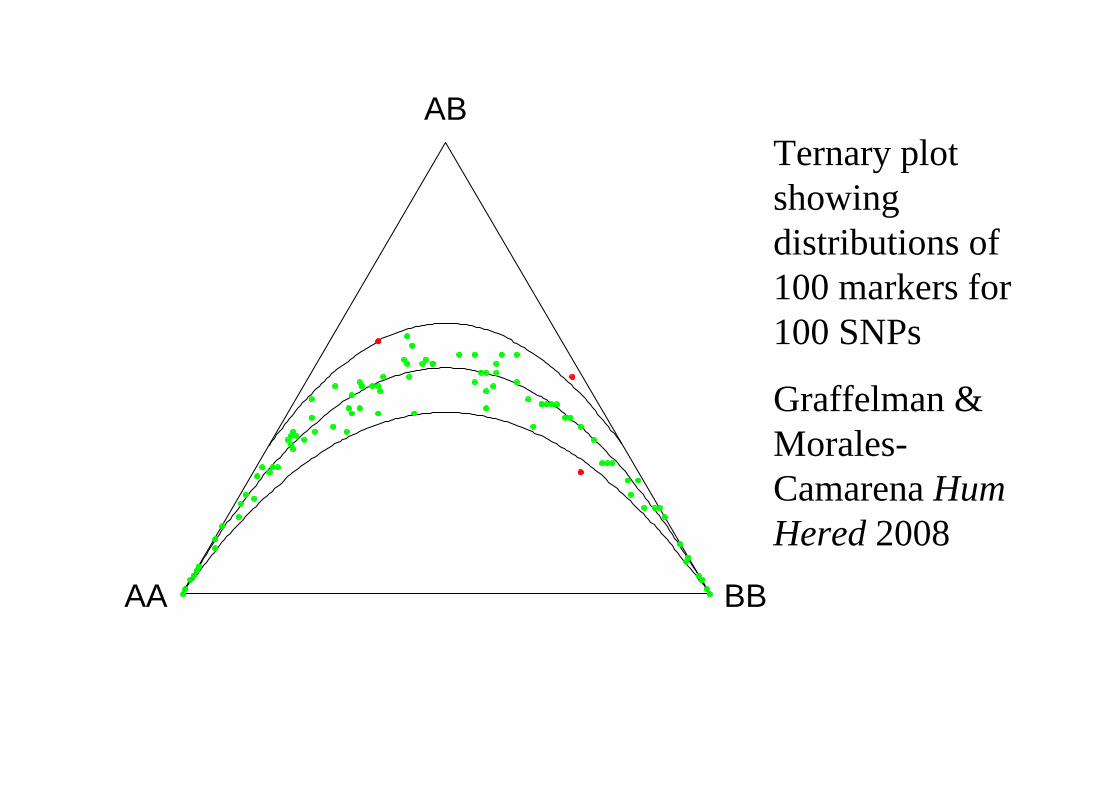
AA
AB
BB
Ternary plot showing distributions of 100 markers for 100 SNPs
Graffelman & Morales-Camarena Hum Hered 2008
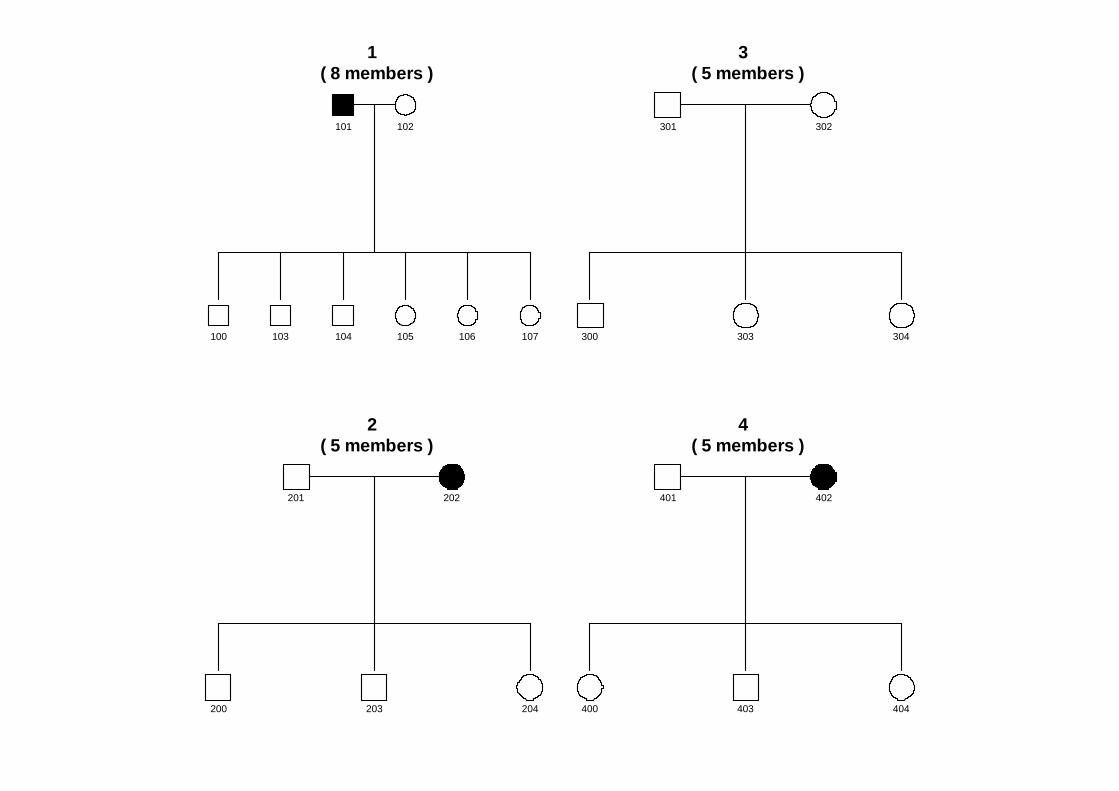
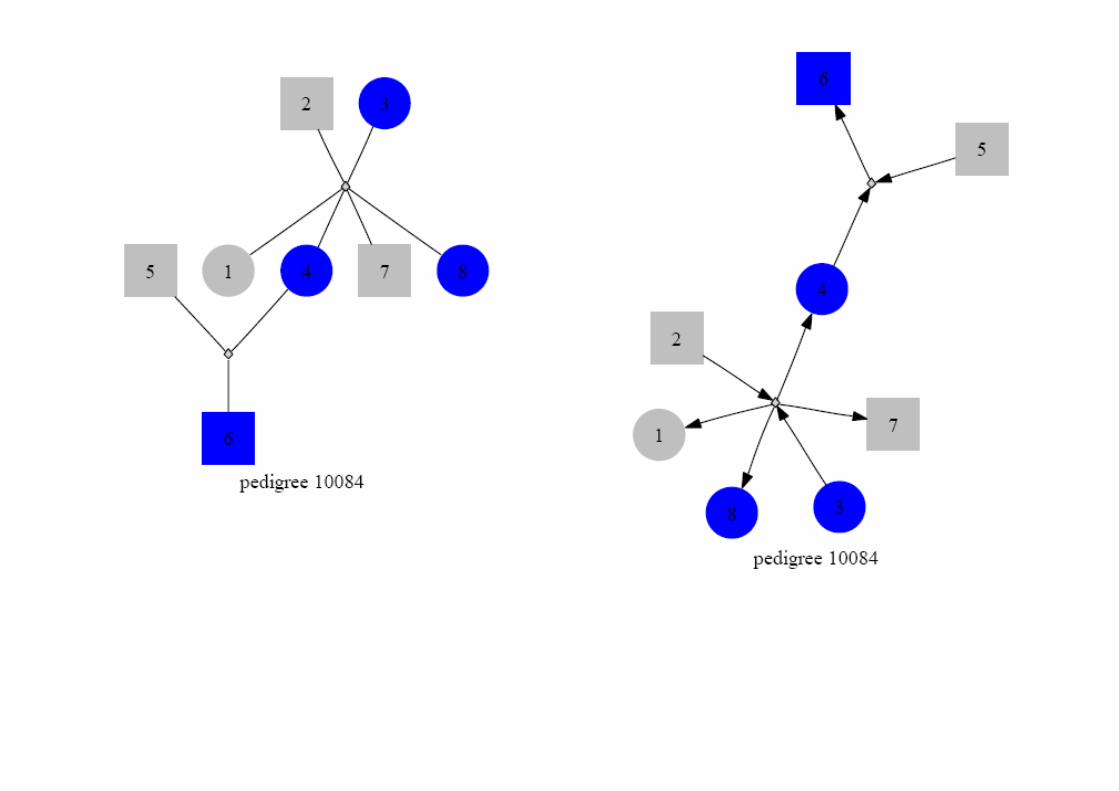
1 ( 8 members )
101
100
102
103 104 105 106 107
2 ( 5 members )
201
200
202
203 204
3 ( 5 members )
301
300
302
303 304
4 ( 5 members )
401
400
402
403 404
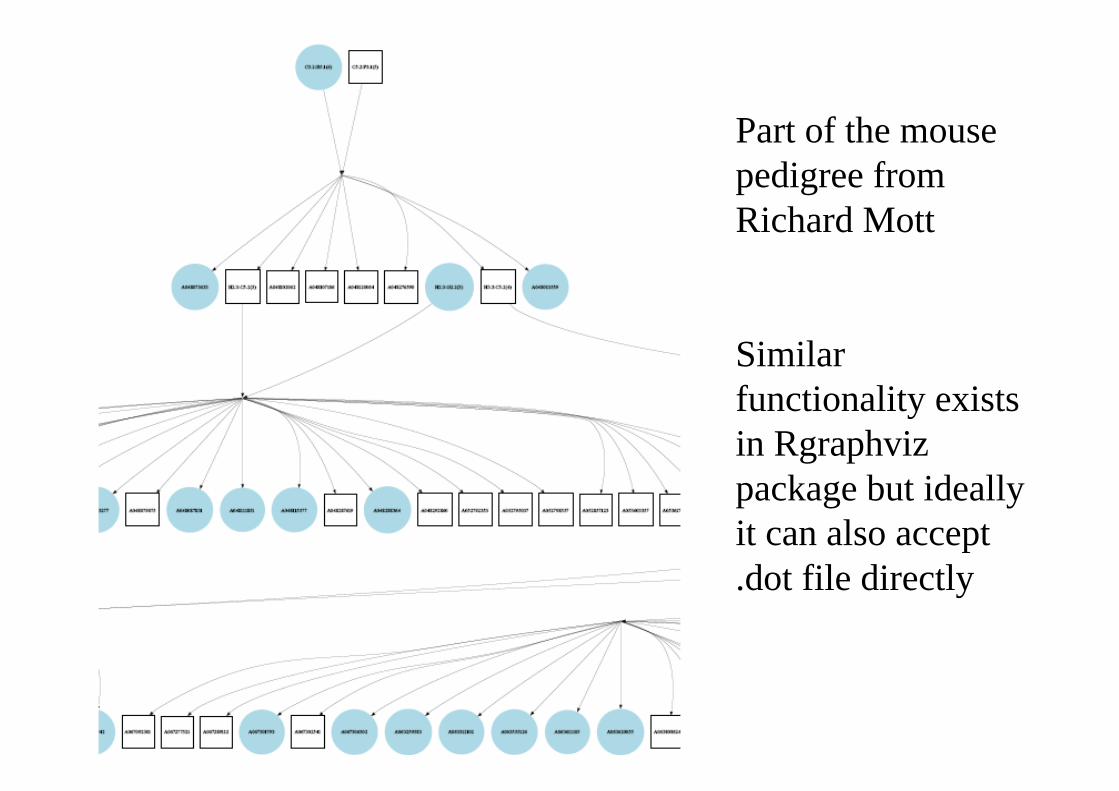
Part of the mouse pedigree from Richard Mott
Similar functionality exists in Rgraphvizpackage but ideally it can also accept .dot file directly
0.0 0.5 1.0 1.5 2.0 2.5 3.0
0.0
0.5
1.0
1.5
2.0
2.5
3.0
-log10(expected value)
-log1
0(ob
serv
ed v
alue
)
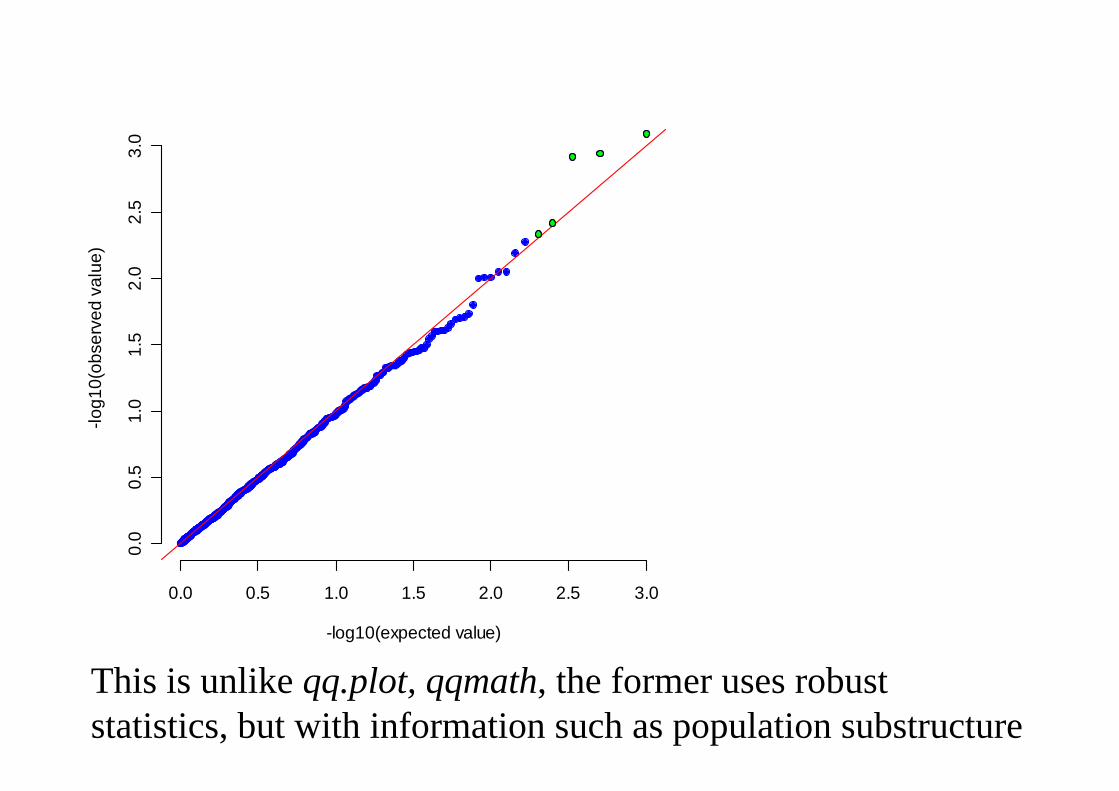
This is unlike qq.plot, qqmath, the former uses robust statistics, but with information such as population substructure
0 2 4 6 8 10 12
0.0
0.5
1.0
1.5
2.0
exp quantiles
-log1
0(p)
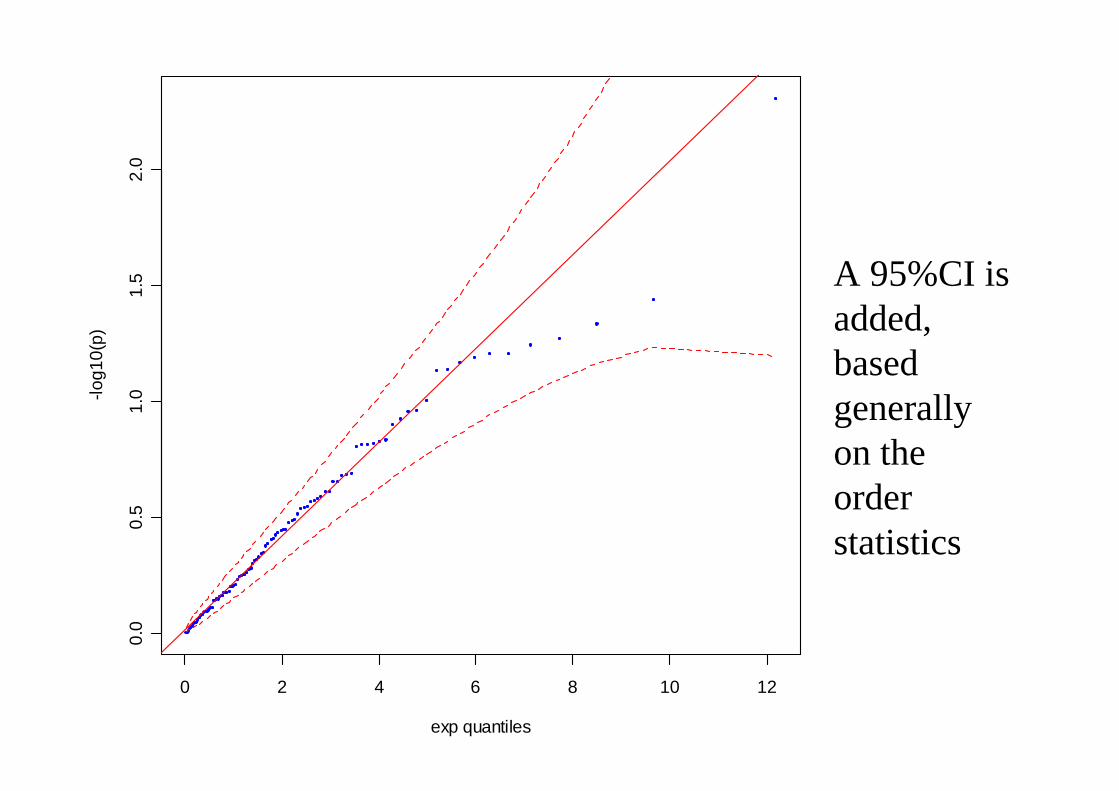
A 95%CI is added, based generally on the order statistics
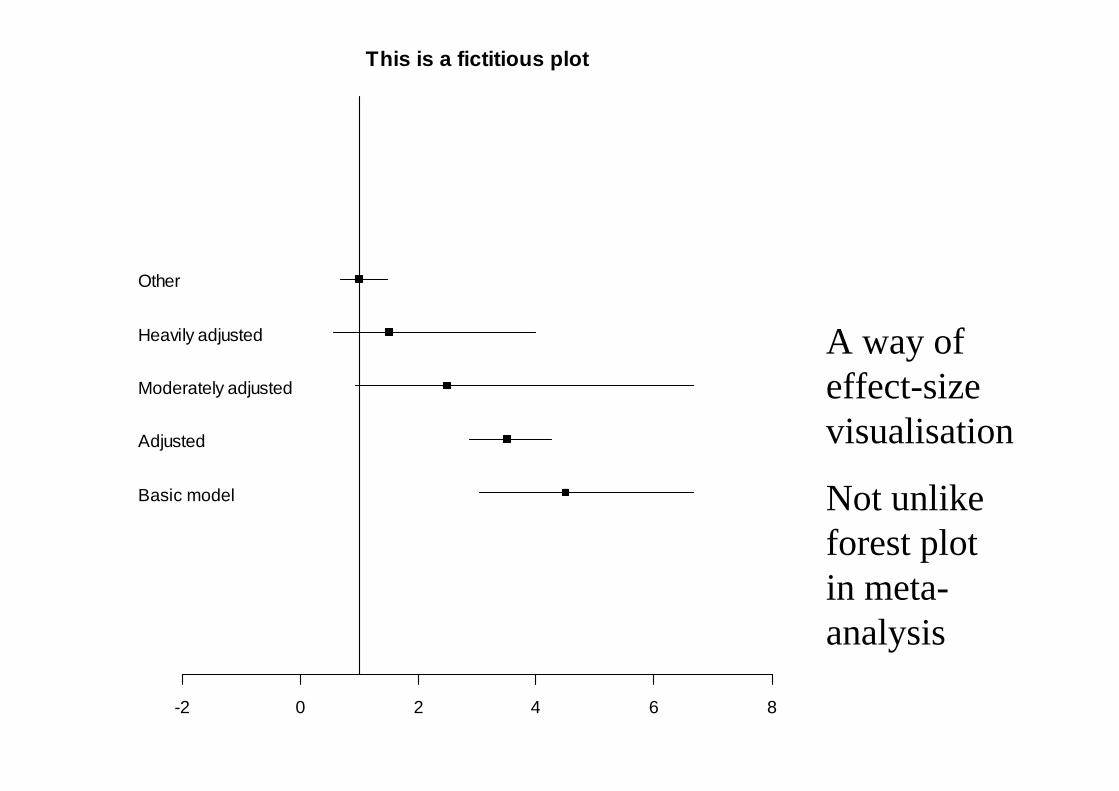
-2 0 2 4 6 8
Basic model
Adjusted
Moderately adjusted
Heavily adjusted
Other
This is a fictitious plot
A way of effect-size visualisation
Not unlike forest plot in meta-analysis
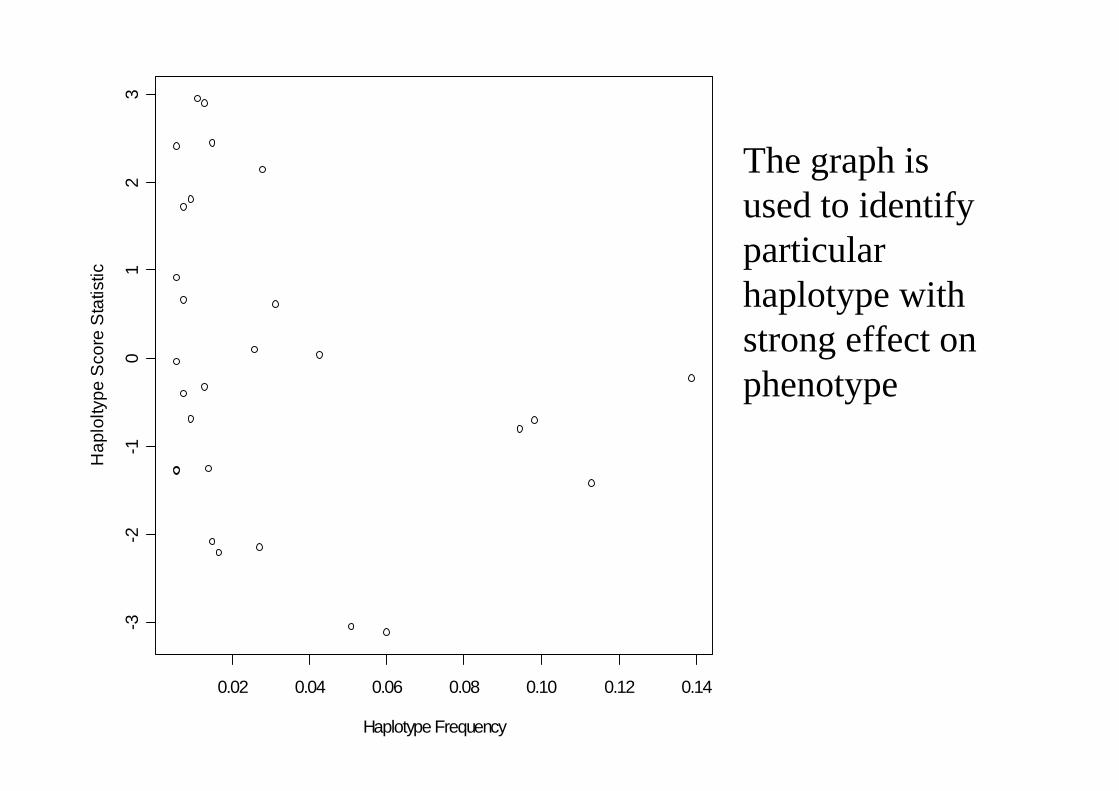
0.02 0.04 0.06 0.08 0.10 0.12 0.14
-3-2
-10
12
3
Haplotype Frequency
Hap
lolty
pe S
core
Sta
tistic
The graph is used to identify particular haplotype with strong effect on phenotype
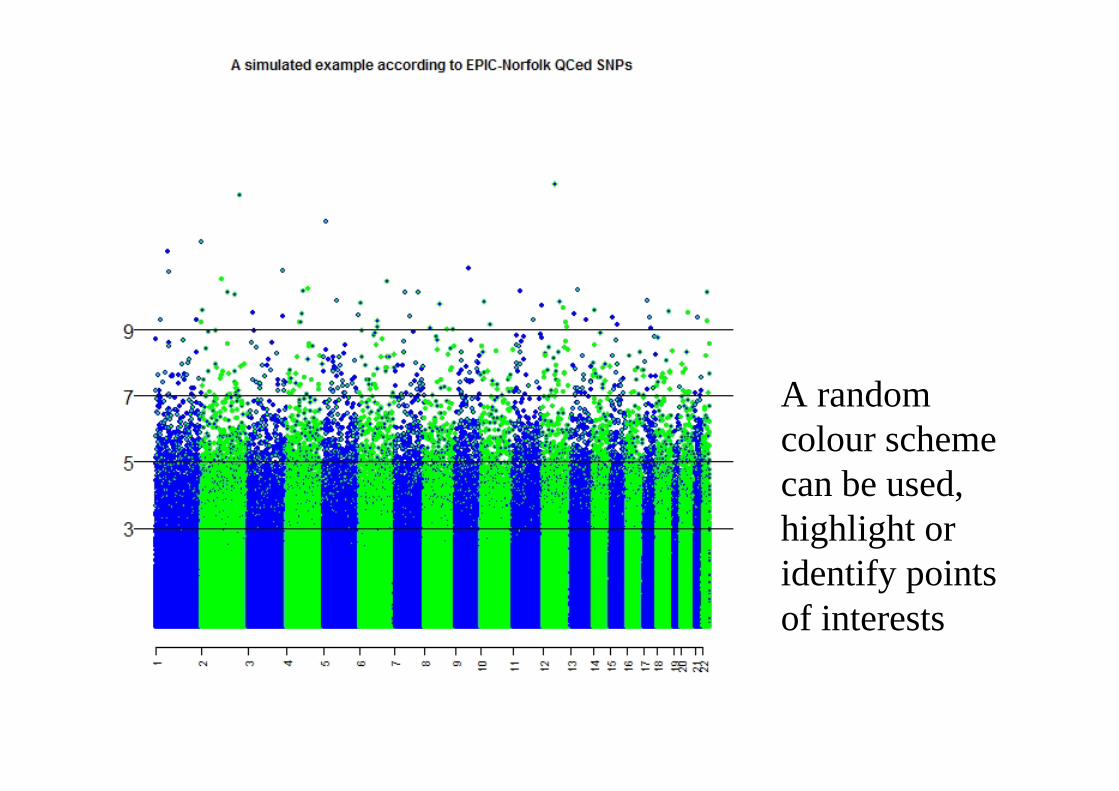
A random colour scheme can be used, highlight or identify points of interests
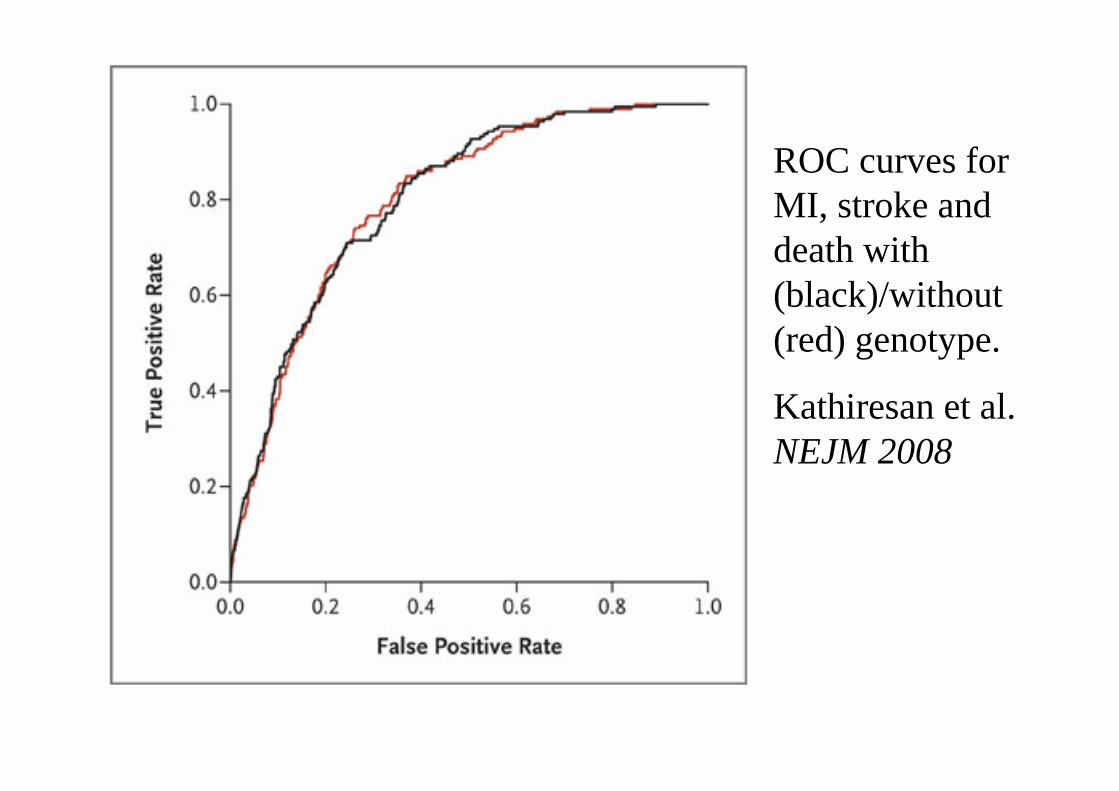
ROC curves for MI, stroke and death with (black)/without (red) genotype.
Kathiresan et al. NEJM 2008
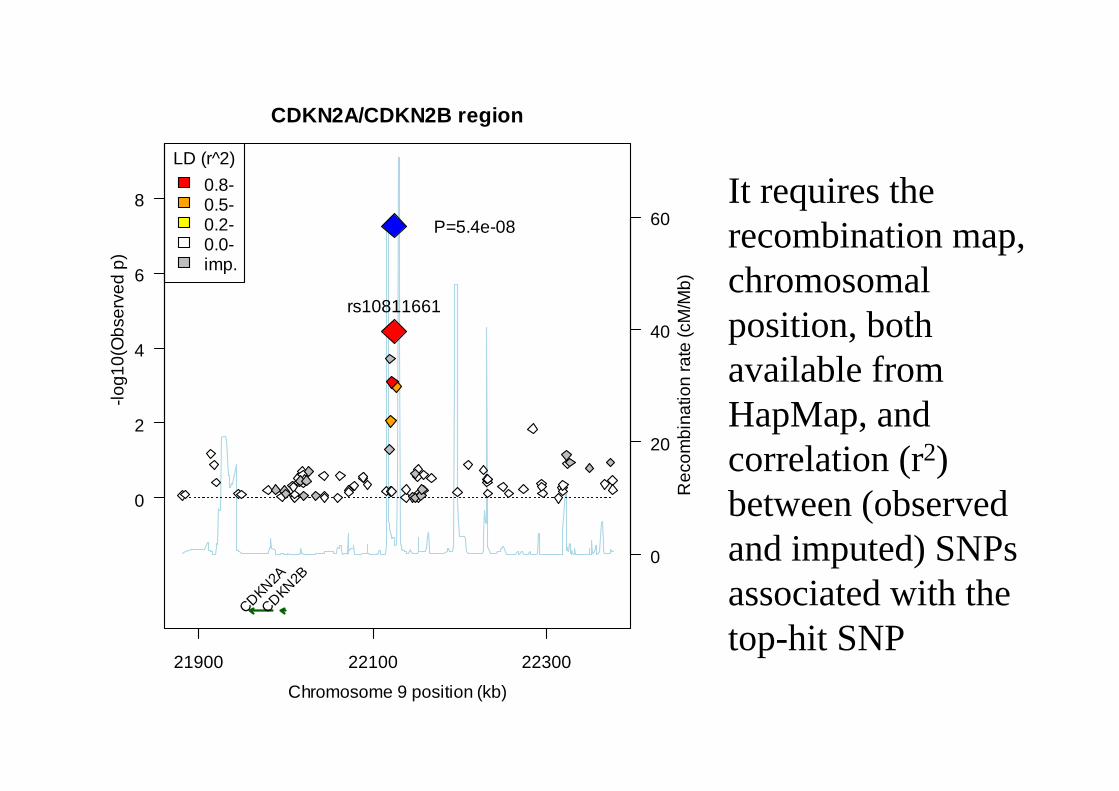
CDKN2A/CDKN2B region
Chromosome 9 position (kb)
21900 22100 22300
0
2
4
6
8
-log1
0(O
bser
ved
p)
0
20
40
60
Rec
ombi
natio
n ra
te (c
M/M
b)
rs10811661
P=5.4e-08
CDKN2ACDKN2B
LD (r^2)0.8-0.5-0.2-0.0-imp.
It requires the recombination map, chromosomal position, both available from HapMap, and correlation (r2) between (observed and imputed) SNPsassociated with the top-hit SNP
R packages used
• HardyWeinberg• LDheatmap• kinship
– plot.pedigree
• gap– pedtodot– qqunif, qqfun, plot.hap.score– esplot, asplot
• ROCR
Summary
• The use of summary statistics and graphics is classic technique for descriptive analysis.
• Graphical representation is one of the major driving forces for using R.
• There is still a gap between specialized program and a need for more rigorous work in R, e.g., HaploView and a number of R packages (genetics, snpMatrix, LDheatmap). It would be great to have some dynamic flavour, e.g., – To implement in rggobi?, optional from spRay?– To modify code under GPL for R (e.g., HaploView)?
• This hopes to be a call for more inputs from the R community, perhaps as motivated from familiarity with both practices.