SOME ORGANISATIONS PARTICIPATING IN CONSOLIDATED APPEALS … · 2016-12-16 · SOME ORGANISATIONS...
53
Transcript of SOME ORGANISATIONS PARTICIPATING IN CONSOLIDATED APPEALS … · 2016-12-16 · SOME ORGANISATIONS...

SOME ORGANISATIONS PARTICIPATING IN CONSOLIDATED APPEALS DURING 2009:
AARREC ACF ACTED ADRA Africare AMI-France ARC ASB ASI AVSI CARE CARITAS CEMIR INTERNATIONAL CESVI CFA CHF CHFI CISV CMA CONCERN Concern Universal COOPI CORDAID
COSV CRS CWS Danchurchaid DDG Diakonie Emergency Aid DRC EM-DH FAO FAR FHI Finnchurchaid FSD GAA GOAL GTZ GVC Handicap International HealthNet TPO HELP HelpAge International HKI Horn Relief
HT Humedica IA ILO IMC INTERMON Internews INTERSOS IOM IPHD IR IRC IRD IRW Islamic RW JOIN JRS LWF Malaria Consortium Malteser Mercy Corps MDM MEDAIR
MENTOR MERLIN NCA NPA NRC OCHA OHCHR OXFAM OXFAM UK PA (formerly ITDG) PACT PAI Plan PMU-I PU RC/Germany RCO Samaritan's Purse SECADEV Solidarités SUDO TEARFUND TGH
UMCOR UNAIDS UNDP UNDSS UNEP UNESCO UNFPA UN-HABITAT UNHCR UNICEF UNIFEM UNJLC UNMAS UNOPS UNRWA VIS WFP WHO World Concern World Relief WV
Humanitarian Appeal 2009 Version 1.2: 20 November 2008

Humanitarian Appeal 2009
iii
Table of Contents
SECRETARY-GENERAL’S FOREWORD TO THE HUMANITARIAN APPEAL 2009..................................... IV
INTRODUCTION ................................................................................................................................. 1
GLOBAL FOOD CRISIS ........................................................................................................................ 3
FLASH APPEAL OVERHAUL.................................................................................................................. 6
MAJOR ADVANCES IN CAP PRIORITISATION AND NGO PARTICIPATION............................................ 9
HUMANITARIAN FINANCE INNOVATIONS: A NATURAL PARTNER FOR THE CAP.............................. 12
HUMANITARIAN FUNDING OVERVIEW 2008 ................................................................................... 15
CONCLUSION .................................................................................................................................. 18
2009 CONSOLIDATED APPEALS........................................................................................................ 19 Central African Republic.............................................................................................................. 20 Chad ......................................................................................................................................... 22 Côte d’Ivoire............................................................................................................................... 24 Democratic Republic of the Congo ............................................................................................... 26 Iraq ........................................................................................................................................... 28 Kenya ........................................................................................................................................ 30 occupied Palestinian territory ....................................................................................................... 32 Somalia ..................................................................................................................................... 34 Sudan ........................................................................................................................................ 36 Uganda ..................................................................................................................................... 38 West Africa................................................................................................................................ 40 Zimbabwe.................................................................................................................................. 42
ANNEX: DETAILED FUNDING TABLES FOR 2008 AND 2009....................................................... 45
In memory of OCHA colleagues
Damien Gugliermina &
Pankaj Sharma

Humanitarian Appeal 2009
iv
FOREWORD TO THE HUMANITARIAN APPEAL 2009
U N I T E D N A T I O N S N A T I O N S U N I E S
THE SECRETARY-GENERAL --
FOREWORD TO THE UNITED NATIONS HUMANITARIAN APPEAL 2009
November 2008
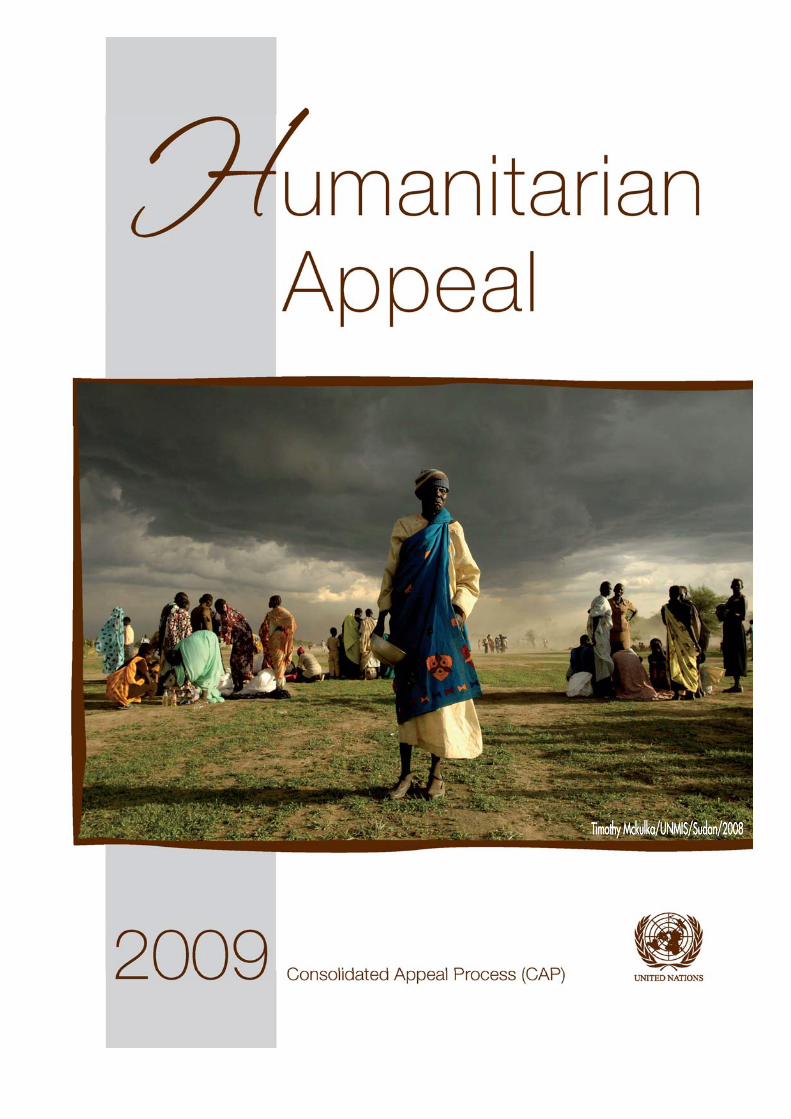
I am honoured to present the 2009 Humanitarian Appeal. This compendium of strategic humanitarian action plans and funding requests focuses on twelve of the world’s most severe crises. It is the culmination of an extensive process involving hundreds of aid organizations, affected governments, donors and other concerned stakeholders across the world.
The global financial crisis has raised inevitable concerns that there could be a decline in humanitarian funding for 2009. I urge Member States and private donors not to let that happen. Next year’s needs will be at least as great as in 2008, and probably even greater, since we continue to cope with the global food crisis, the effects of climate change and the long-running conflicts that cause so much human distress. We must do all we can to preserve humanitarian funding. As stabilization is the watchword in turbulent economic times, so must stability be our goal in helping desperate victims of conflict, natural disasters and extreme hardship.
The international humanitarian system exists to help governments of affected countries help their own people. There is no shame in accepting help when it is needed. Indeed, there are occasions when even the largest and most powerful countries see a useful role for specialized help from friends and neighbours, well coordinated with the national response. It is a mark of responsibility and seriousness to call for such help when needed, or to accept it when offered.
In that spirit, the United Nations and its non-governmental humanitarian partners put forward the plans and appeals for 2009 contained in this document. On behalf of 30 million people in 31 countries, and on behalf of the 360 organizations that have come together to devise these plans, I appeal for $7 billion dollars to be provided without delay and as a top priority. Our aim is to help these most vulnerable people survive the coming year, and enable them to start working their way out of vulnerability and despair towards the dignity, safety and self-sufficiency to which every human being has a right.
BAN Ki-moon
Humanitarian Appeal 2009
1
1
INTRODUCTION
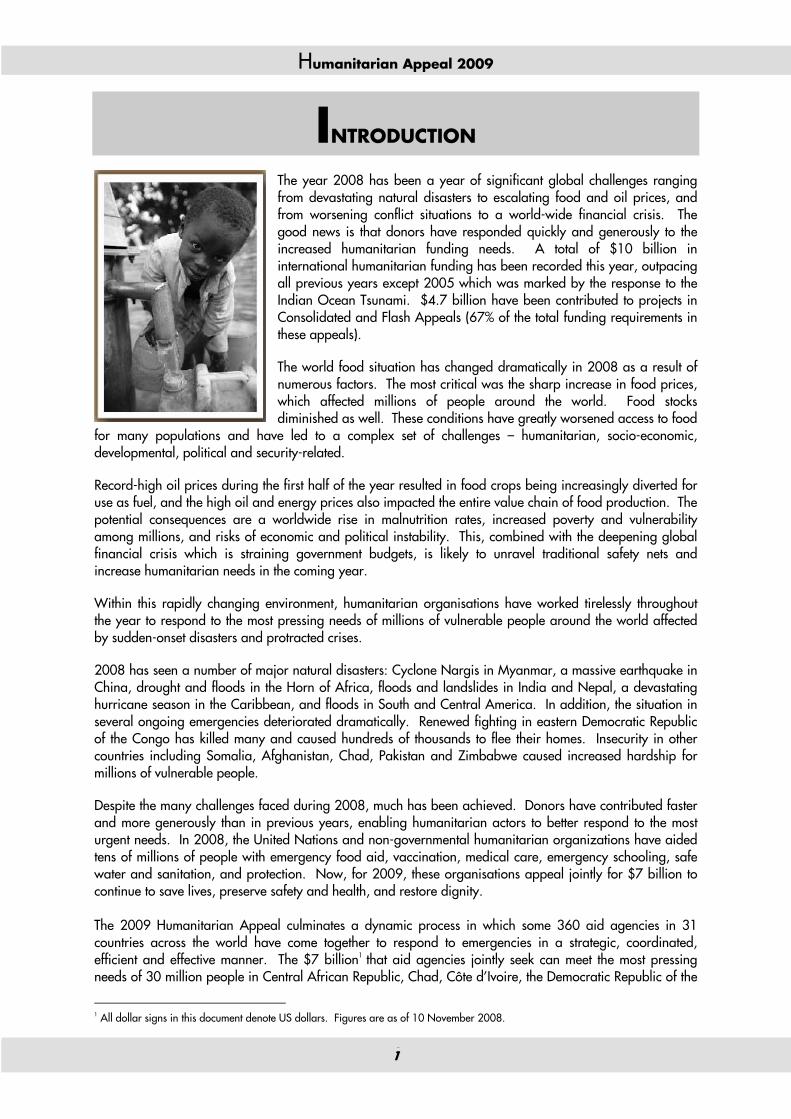
The year 2008 has been a year of significant global challenges ranging from devastating natural disasters to escalating food and oil prices, and from worsening conflict situations to a world-wide financial crisis. The good news is that donors have responded quickly and generously to the increased humanitarian funding needs. A total of $10 billion in international humanitarian funding has been recorded this year, outpacing all previous years except 2005 which was marked by the response to the Indian Ocean Tsunami. $4.7 billion have been contributed to projects in Consolidated and Flash Appeals (67% of the total funding requirements in these appeals). The world food situation has changed dramatically in 2008 as a result of numerous factors. The most critical was the sharp increase in food prices, which affected millions of people around the world. Food stocks diminished as well. These conditions have greatly worsened access to food
for many populations and have led to a complex set of challenges – humanitarian, socio-economic, developmental, political and security-related. Record-high oil prices during the first half of the year resulted in food crops being increasingly diverted for use as fuel, and the high oil and energy prices also impacted the entire value chain of food production. The potential consequences are a worldwide rise in malnutrition rates, increased poverty and vulnerability among millions, and risks of economic and political instability. This, combined with the deepening global financial crisis which is straining government budgets, is likely to unravel traditional safety nets and increase humanitarian needs in the coming year. Within this rapidly changing environment, humanitarian organisations have worked tirelessly throughout the year to respond to the most pressing needs of millions of vulnerable people around the world affected by sudden-onset disasters and protracted crises. 2008 has seen a number of major natural disasters: Cyclone Nargis in Myanmar, a massive earthquake in China, drought and floods in the Horn of Africa, floods and landslides in India and Nepal, a devastating hurricane season in the Caribbean, and floods in South and Central America. In addition, the situation in several ongoing emergencies deteriorated dramatically. Renewed fighting in eastern Democratic Republic of the Congo has killed many and caused hundreds of thousands to flee their homes. Insecurity in other countries including Somalia, Afghanistan, Chad, Pakistan and Zimbabwe caused increased hardship for millions of vulnerable people. Despite the many challenges faced during 2008, much has been achieved. Donors have contributed faster and more generously than in previous years, enabling humanitarian actors to better respond to the most urgent needs. In 2008, the United Nations and non-governmental humanitarian organizations have aided tens of millions of people with emergency food aid, vaccination, medical care, emergency schooling, safe water and sanitation, and protection. Now, for 2009, these organisations appeal jointly for $7 billion to continue to save lives, preserve safety and health, and restore dignity. The 2009 Humanitarian Appeal culminates a dynamic process in which some 360 aid agencies in 31 countries across the world have come together to respond to emergencies in a strategic, coordinated, efficient and effective manner. The $7 billion1 that aid agencies jointly seek can meet the most pressing needs of 30 million people in Central African Republic, Chad, Côte d’Ivoire, the Democratic Republic of the
1 All dollar signs in this document denote US dollars. Figures are as of 10 November 2008.

Humanitarian Appeal 2009
2
2
Congo, Iraq, Kenya, the occupied Palestinian territory, Somalia, Sudan, Uganda, West Africa, and Zimbabwe. This may seem like a huge burden to bear for donor countries, but in fact it translates, for every hundred dollars of the rich countries’ national income, to just a few cents of aid – a few cents that can ensure the survival, protection, and well-being of the poorest and most vulnerable people in this world. We therefore urge the donors to make an extra effort this coming year in the face of likely budget constraints and ensure that humanitarian action in 2009 is fully funded.
As the global financial crisis is putting more and more demands on government budgets, the most serious repercussions will be felt most by those who are least responsible – the poorest people in developing countries. All efforts should therefore be made to ensure that those who are least able to help themselves continue to receive critical assistance. Amidst current uncertainty on global financial markets, concerns about humanitarian funding in the coming year are prominent. Recent studies have shown that after each previous financial crisis in a donor country since 1970, the country's aid has declined.2 However, no United Nations agency has yet reported a slowdown in contributions and several key donors have already pledged to stand by their commitments. In 2009, Norway’s total development aid budget, including humanitarian assistance, is expected to reach 1% of GNI for the first time. Other donors, such as Sweden and Denmark, have also indicated that they do not expect the global economic crisis to influence their humanitarian aid budgets. As for the largest humanitarian donor, the United States, annual foreign assistance is expected to remain the same or possibly even increase in 2009. In the spirit of Good Humanitarian Donorship, all donors must be held accountable for upholding their humanitarian commitments in the coming year. In 2009, humanitarian agencies will continue to be challenged by ongoing crises, by the need to adapt to an increasing caseload of food-insecure people, and by the likelihood that the trend of increased climate-related disasters will continue. Sustained donor support for humanitarian efforts is therefore crucial as we strive to meet life-saving needs in a rapidly changing global environment. 2 Roodman, David, 2008 “History Says Financial Crisis Will Suppress Aid”, http://blogs.cgdev.org/globaldevelopment/2008/10/history_says_financial_crisis.php
Consolidated Appeal funding requirements, 2009
$36 million
$116 million
$225 million
$361 million
$389 million
$390 million
$462 million
$547 million
$550 million
$831 million
$919 million
$2,189 million
Côte d'Ivoire
Central African Republic
Uganda
West Africa
Chad
Kenya
occupied Palestinian territory
Iraq & region
Zimbabwe
DR Congo
Somalia
Sudan

Humanitarian Appeal 2009
3
3
Food sector in consolidated and flash appeals
$0 billion $1 billion $2 billion $3 billion $4 billion
2001
2002
2003
2004
2005
2006
2007
2008
2009
received
unmet requirements
GLOBAL FOOD CRISIS
The dramatic rise over the past year in food prices poses a threat to food and nutrition security in many countries. The global food crisis endangers millions of the world’s most vulnerable, and threatens to reverse critical gains made toward reducing poverty and hunger as outlined in the Millennium Development Goals. Already before the rapid rise in food prices, some 854 million people worldwide were estimated to be undernourished, and the crisis may drive hundreds of millions more into poverty and hunger.3 Despite recent drops in the prices of oil and food, food prices remain relatively high compared to historical averages and assessments show that the dip in the global cereal price has not necessarily led to lower prices at the country level. In Ethiopia, the price of maize in August was found to be three times as much as at the same time in 2007, and in Haiti rice prices have more than doubled over the past year. It will take time before the declines in international prices eventually translate into lower prices on shop shelves and market stalls where the poor buy their food. According to Food and Agriculture Organization of the United Nations (FAO), the current market conditions remain a cause for concern because world food supplies are critically low and the global food balance is tight. A joint FAO/OECD medium-term outlook for major agricultural commodities, published in
May 2008, projected higher prices for the 2008-2017 period compared to the 1990s. The current deterioration of the global economic situation could also worsen the food crisis. Some low-income food-deficit countries and emerging market economies may face increasing challenges to their balance of payments, making it difficult to mobilize external support to finance critical food imports and necessary medium-term expenditures to enhance agricultural productivity. Depreciating currencies and lost export revenues may also cause cut-backs in social spending (like school feeding and social safety nets). Moreover, the credit crunch could
adversely affect international food trade as many sellers no longer trust that international buyers will be able to obtain letters of credit. There are already reports of grain shipments being held back in US and South American ports due to exporters not being able to find foreign lines of credit. Economic slowdowns generally exacerbate poverty and vulnerability at the household level, and multiple signs of distress are already visible in the poorest households due to the higher food prices. Many families are selling assets, eating less and eating less well, while 40 million HIV-affected people depend on food for their medicines to be effective, and maternal-mortality risk rises with lower nutrition levels. Other poor households may choose to spend more money on food to the detriment of non-food expenditure, leading to asset depletion or lower school attendance, for example. Both choices lead to greater vulnerability and increased distress. 3 High-Level Task Force on the Global Food Crisis: “Comprehensive Framework for Action” (July 2008).
Humanitarian Appeal 2009
4
4
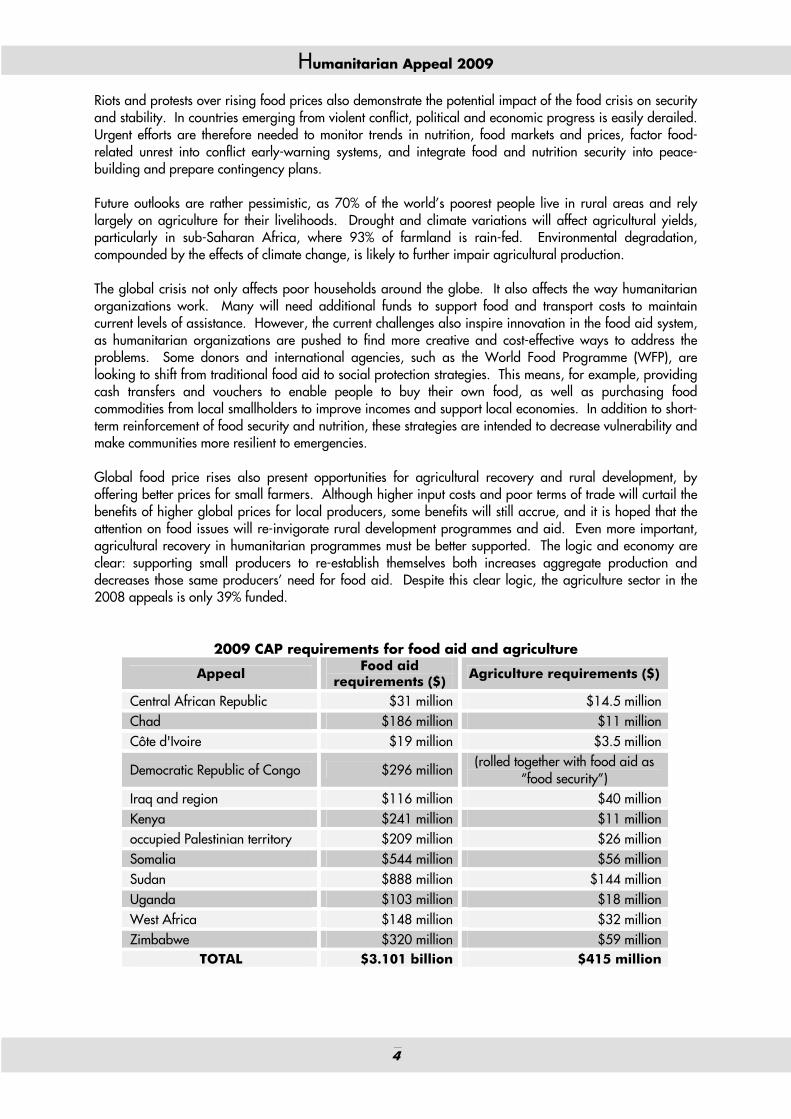
Riots and protests over rising food prices also demonstrate the potential impact of the food crisis on security and stability. In countries emerging from violent conflict, political and economic progress is easily derailed. Urgent efforts are therefore needed to monitor trends in nutrition, food markets and prices, factor food-related unrest into conflict early-warning systems, and integrate food and nutrition security into peace-building and prepare contingency plans. Future outlooks are rather pessimistic, as 70% of the world’s poorest people live in rural areas and rely largely on agriculture for their livelihoods. Drought and climate variations will affect agricultural yields, particularly in sub-Saharan Africa, where 93% of farmland is rain-fed. Environmental degradation, compounded by the effects of climate change, is likely to further impair agricultural production. The global crisis not only affects poor households around the globe. It also affects the way humanitarian organizations work. Many will need additional funds to support food and transport costs to maintain current levels of assistance. However, the current challenges also inspire innovation in the food aid system, as humanitarian organizations are pushed to find more creative and cost-effective ways to address the problems. Some donors and international agencies, such as the World Food Programme (WFP), are looking to shift from traditional food aid to social protection strategies. This means, for example, providing cash transfers and vouchers to enable people to buy their own food, as well as purchasing food commodities from local smallholders to improve incomes and support local economies. In addition to short-term reinforcement of food security and nutrition, these strategies are intended to decrease vulnerability and make communities more resilient to emergencies. Global food price rises also present opportunities for agricultural recovery and rural development, by offering better prices for small farmers. Although higher input costs and poor terms of trade will curtail the benefits of higher global prices for local producers, some benefits will still accrue, and it is hoped that the attention on food issues will re-invigorate rural development programmes and aid. Even more important, agricultural recovery in humanitarian programmes must be better supported. The logic and economy are clear: supporting small producers to re-establish themselves both increases aggregate production and decreases those same producers’ need for food aid. Despite this clear logic, the agriculture sector in the 2008 appeals is only 39% funded.
2009 CAP requirements for food aid and agriculture
Appeal Food aid requirements ($) Agriculture requirements ($)
Central African Republic $31 million $14.5 million Chad $186 million $11 million Côte d'Ivoire $19 million $3.5 million
Democratic Republic of Congo $296 million (rolled together with food aid as
“food security”) Iraq and region $116 million $40 million Kenya $241 million $11 million occupied Palestinian territory $209 million $26 million Somalia $544 million $56 million Sudan $888 million $144 million Uganda $103 million $18 million West Africa $148 million $32 million Zimbabwe $320 million $59 million
TOTAL $3.101 billion $415 million

Humanitarian Appeal 2009
5
5
2008 funding for food sector (CAP and flash appeal)
Appeal Original requirements
Revised requirements Funding % Covered
Bolivia Flash Appeal $7 million $9 million $9 million 101%
Central African Republic CAP $26 million $39 million $55 million 142%
Chad CAP $110 million $126 million $115 million 92%
Côte d'Ivoire CAP $17 million $26 million $9 million 36%
Democratic Republic of Congo CAP
$120 million $241 million $197 million 82%
Georgia Crisis Flash Appeal $16 million $20 million $10 million 50%
Haiti Flash Appeal $34 million $33 million $12 million 35%
Honduras Flash Appeal $5 million $5 million $1 million 9%
Iraq CAP $97 million $99 million $83 million 84%
Kenya Flash Appeal $10 million $100 million $92 million 92%
Madagascar Flash Appeal $16 million $16 million $12 million 75%
Myanmar Flash Appeal $56 million $115 million $79 million 69%
occupied Palestinian territory CAP $156 million $203 million $157 million 78%
Pakistan Flash Appeal $8 million $8 million $5 million 70%
Somalia CAP $144 million $335 million $320 million 95%
Southern Africa Flash Appeal $26 million $26 million $9 million 34%
Sudan Work Plan $625 million $703 million $653 million 93%
Tajikistan Flash Appeal $8 million $18 million $5 million 30%
Uganda CAP $131 million $189 million $134 million 71%
West Africa CAP $128 million $232 million $212 million 91%
Zimbabwe CAP $173 million $330 million $301 million 91%
Total $1,913 million $2,873 million $2,472 million 86%
Worsening food insecurity due to prices and climate shocks presents challenges for the international humanitarian system. Humanitarian needs are appearing in countries with no obvious triggering disaster that would attract humanitarian funds. These situations oblige humanitarian and development organisations to learn to work in parallel, not in succession, and oblige donors to find ways to fund humanitarian stresses in development situations. The appeal system is part of this adaptation. In general, the 2009 Consolidated Appeals deal with acute food deficits, protection of food availability, and agricultural recovery or rehabilitation as justified by the food crisis. Longer-term, developmental actions to avert the consequences of the food crisis are not programmed in the CAPs. Therefore, several special food security appeals and action plans have been issued in 2008 (Afghanistan, Tajikistan, Haiti and Syria) to combine short- and medium term actions. 2009 is likely to see more of this evolving species of appeal. While these strategies are not considered Consolidated Appeals in the purely humanitarian sense, their development took advantage of the CAP’s relevant methods, support systems, and analytical tools.

Humanitarian Appeal 2009
6
6
FLASH APPEAL OVERHAUL The frequent natural disasters in 2007 resulted in an unprecedented cascade of flash appeals – 15 in all, 50% more than the previous greatest annual number. Particularly worrying was the fact that 14 of the 15 flash appeals stemmed from climate-related disasters, suggesting that the trend may continue and even worsen. In 2008 to date, 11 flash appeals have been issued, of which seven stem from climate-related disasters – a slight easing from 2007 levels. The surge of flash appeals in 2007 highlighted the need for the Inter-Agency Standing Committee (IASC) to overhaul the flash appeal system, most importantly by issuing flash appeals much faster – within about a week of the disaster. Adoption of the new standards has been encouragingly swift: starting with the Myanmar Flash Appeal in May 2008, most flash appeals have been issued much faster than in 2007 – a median of 12 days after the disaster, compared to 32 days in 2007. Funding for flash appeals in 2008 has been moderate – 58% overall to date. Speed of funding for flash appeals (within one month of issuance) showed encouraging signs: the median is 52% of requirements, with a range from 24% for Pakistan to 92% for Myanmar. (It is worth remembering that over the years before 2006, median flash appeal funding one month after launch was only 16%.) The Central Emergency Response Fund (CERF) played an important part in this, but donor response was the major factor: of the first-month funding for these appeals, the CERF provided a median of only 22% (from zero in the Georgia crisis to 75% in Pakistan), and donors provided the rest. A second key pillar of the flash appeal overhaul – that all flash appeals need to be revised about a month after their first edition – began to take effect. Although revisions have long been part of IASC flash appeal policy, in practice they have only occasionally been done, thus missing an opportunity to improve the targeting of resources and to maximise the quality and quantity of assistance to people in need. In 2008, four of the 11 flash appeals have been revised (in the cases of Kenya and Myanmar into nine-month and one-year response plans respectively), and four more are due for revision imminently. Revisions are invariably more complete documents, incorporating elements from CAPs such as prioritisation of projects and strengthening aspects of humanitarian reform like improved cluster coordination. It is too soon to state with any confidence, however, that revisions improve funding response. This renewed emphasis on revising flash appeals has also raised the issue of what to do with appeals that are left un-revised. Following discussion within the IASC, the emerging practice is to ‘close’ unrevised appeals after six months at the level of funding received, so as to reduce unmet requirements to zero. This enforcement measure however has to follow an effort to ensure that a country team has the requisite capacity to do the work. Also, in the absence of hard evidence that revising a flash appeal improves donor response to an emergency, country teams might balk at the effort required to do so.

Humanitarian Appeal 2009
7
7
Difficult issues remain in implementing flash appeal overhaul. The amount of latitude that country teams in developmental settings can be allowed in trying to implement the best practices of humanitarian reform while in the heat of a new crisis is still controversial. External capacity to support such teams is improving but less than fully reliable. Standard metrics of scale and severity are under development but not yet in widespread use. Global cluster leads have some way to go in developing generic projects and budgets that could allow a flash appeal to be compiled almost immediately after a rapid appraisal and estimate of likely needs. Yet it is a major advance that in the past year and a half, flash appeals have managed to extend to several countries whose governments had been largely aloof from the international humanitarian system. While it is understandable that a government may not wish to be seen to appeal for aid, perhaps a realisation is growing that flash appeals represent the international organisations’ method of planning and fundraising for their agreed role in supporting governments’ responsibilities – in the same way that they do for developmental programmes, with scarcely any controversy.
2008 Flash Appeal funding as % of requirements within one month
57%
53%
25%
10%
82%
39%
92%
24%
52%
Bolivia
Georgia Crisis
Haiti
Honduras
Kenya
Madagascar
Myanmar
Pakistan
Tajikistan

Hum
anitari
an A
ppea
l 2009
8 Fl
ash
Appea
ls in
2008
Fla
sh
Ap
pea
l
Da
te iss
ued
Nu
mb
er
of
da
ys f
rom
d
isa
ster
to
ap
pea
l is
sua
nce
Ori
gin
al
req
uir
em
en
ts
($)
Revi
sed
re
qu
irem
en
ts
($)
Fun
din
g (
$)
%
Fun
din
g
cove
rag
e
% f
un
din
g
cove
rag
e
on
e m
on
th
aft
er
lau
nch
***
Fun
din
g
wit
hin
on
e
mon
th (
$)
CER
F fu
nd
ing
w
ith
in o
ne
mon
th (
$)
CER
F fu
nd
ing
as
% o
f a
ll
fun
din
g
wit
hin
on
e
mon
th
Boliv
ia
20-F
eb-0
8 55
18
,215
,196
*
14,4
01,7
7379
%
57%
10
,440
,401
2,
271,
874
22%
G
eorg
ia
Cris
is
18-A
ug-0
8 10
59
,653
,319
11
3,23
2,34
940
,302
,097
36%
53
%
31,4
83,5
27
-0%
Hai
ti
09-S
ep-0
8 6
107,
714,
621
105,
658,
433
34,8
10,5
8133
%
25%
26
,613
,404
5,
106,
424
19%
Hon
dura
s
29-O
ct-0
8 15
17
,086
,986
17
,086
,986
1,70
7,44
510
%
n/a
1,70
7,44
5 1,
501,
344
88%
Keny
a
16-J
an-0
8 16
41
,938
,954
20
7,56
8,40
114
4,52
4,72
270
%
82%
34
,440
,071
7,
022,
854
20%
Mad
agas
car
01
-Mar
-08
12
36,4
76,5
86
**18
,464
,895
51%
39
%
14,0
54,7
42
4,62
5,58
333
%
Mya
nmar
09
-May
-08
6 18
7,29
8,15
4 47
3,54
7,47
729
8,08
1,59
163
%
92%
17
3,08
3,21
9 22
,417
,366
13%
Paki
stan
07
-Sep
-08
(slo
w-o
nset
) 55
,102
,503
55
,102
,503
16,6
94,1
1030
%
24%
13
,190
,697
9,
914,
799
75%
Tajik
ista
n
15-F
eb-0
8 15
25
,303
,587
26
,914
,132
15,1
71,8
5256
%
52%
13
,033
,733
5,
237,
558
40%
Yem
en
10-N
ov-0
8 16
11
,483
,150
11
,483
,150
n/a
n/a
n/a
n/a
n/a
n/a
Tota
l or
med
ian
: 1
2
56
0,2
73
,056
1,0
10
,59
3,4
31
58
4,9
87
,339
58
%
52
%
31
8,0
47
,239
58
,92
6,0
75
22
%
* Bo
livia
Fla
sh A
ppea
l was
unr
evise
d as
of O
ct. 2
008;
app
eal t
here
fore
clo
sed
at 7
9% fu
ndin
g an
d un
met
requ
irem
ents
redu
ced
to z
ero.
**
Mad
agas
car F
lash
App
eal w
as u
nrev
ised
as o
f Oct
. 200
8; a
ppea
l the
refo
re c
lose
d at
51%
fund
ing
and
unm
et re
quire
men
ts re
duce
d to
zer
o.
(Sou
ther
n A
frica
Reg
ion
Prep
ared
ness
and
Res
pons
e Pl
an 2
008
was
not
revi
sed
afte
r flo
ods
did
not r
each
the
antic
ipat
ed e
xten
t; th
eref
ore
not s
how
n on
this
list.)
**
* Re
lativ
e to
orig
inal
requ
irem
ents.
Humanitarian Appeal 2009
9
MAJOR ADVANCES IN CAP PRIORITISATION AND NGO
PARTICIPATION This year, the Consolidated Appeal Process has become even more inclusive. 46% of the projects in the 2008 appeals are NGO projects. The 2009 Consolidated Appeals have the participation of a record number of 350 NGOs, whose projects comprise 52% of the total number of projects in these appeals. This recent leap in NGO participation has several meanings. It ensures their strategic and operational input, such as pooling information on needs and strategic perspectives. It allows the collectivity of organisations on the ground to map their aggregate capacity, thus making it more likely that needs will be covered. It allows clusters or sector working groups to develop a cohesive sectoral strategy and orchestrate its implementation consensually, rather than merely resolving points of overlap. It allows the CAP to present to donors an overall price tag for humanitarian action in a crisis, thus making it more possible to hold them accountable for funding according to need, and making the CAP a comprehensive catalogue of priority projects – useful for donors – and a reliable barometer of humanitarian funding. The time is fast approaching when Consolidated Appeals can be said to be a comprehensive inventory of priority NGO projects, as they are for UN humanitarian projects. Although the improvement in NGOs participation is highly encouraging (and is likely to continue as cluster implementation deepens), it does not automatically resolve all issues of competition. Continued frank discussion and transparency, plus more predictable funding, will be needed to mitigate these structural issues. Prioritisation For the first time ever, the majority of Consolidated Appeals are now prioritized – eight out of the twelve CAPs for 2009 – following a clear endorsement in 2008 at the Montreux Retreat on the CAP and Humanitarian Financing of at least a two-step prioritization grading within each CAP. Most country teams have used the method of a series of test questions that resulted in each project being ranked on a two-step or three-step scale of priority. (DR Congo used a more elaborate and data-heavy method of prioritizing districts on the basis of six bundles of humanitarian indicators, appropriate for making choices about how to address that country’s situation of generalized humanitarian need stemming from developmental paralysis as well as conflict.) Some CAPs experimented with thematic prioritization, though there are inherent risks in separating entire themes of humanitarian action that should be holistic. Donors are urged to follow the indications from the country teams about the projects most urgently in need of funding in order to make the humanitarian response most effective.

Humanitarian Appeal 2009
10
Consolidated Appeals 2008: Priority designations and funding response per priority level
CAP Priority Designation Requirements* Funding to
Date % Covered
High 430,257,193 342,623,559 80% Zimbabwe
Medium 47,167,716 6,790,135 14%
A – Short-term 296,887,258 188,258,159 63%
B – Medium-term 43,231,355 18,266,965 42% Uganda C – Long-term** 39,316,850 26,422,360 67%
High 211,132,799 130,079,508 62% Iraq
Medium 12,486,038 6,591,528 53%
A-Immediate 270,736,235 220,518,794 81% Chad
B-High 33,698,170 14,855,502 44%
A-Immediate 40,899,198 16,964,843 41%
B-High 12,194,079 4,282,242 35% Côte d’ Ivoire
C-Medium 2,664,790 1,697,476 64%
A-Immediate 6,191,299 4,122,190 67%
B-High 13,914,175 11,580,958 83% Central African Republic C-Medium 88,966,611 80,115,092 90%
D.R. Congo
(uses a more sliding scale of priority that is not easily shown here)
* i.e. sum of requirements of projects designated with that level ** Full description agreed by country team: “Projects that do not respond to critical needs and/or needs that can be met in the medium-term” Note: in each appeal, a small proportion of projects were not given a priority designation, for reasons such as them being full funded already, or being artificial projects created on FTS to host pooled funds or flexible funds.
Humanitarian reform’s growing impact on the CAP The cluster approach is in use, to the extent applicable, in most of the CAP countries. Particularly in new complex emergencies, roles and responsibilities for leading different aspects of the humanitarian response can be considered more predictable today than one year ago. The cluster approach has helped to foster an atmosphere for critical reflection and debate at both the headquarters and field level on the coordination structure and mind-sets needed to achieve improved partnerships with authorities (where appropriate) and between UN and non-UN organisations. CAP improvements such as prioritisation, greater NGO participation, definitions of boundaries, and strategic monitoring indicate that the cluster approach and Humanitarian Coordinator leadership and engagement with the process are having a direct effect on the quality of the CAP.
Humanitarian Appeal 2009
11
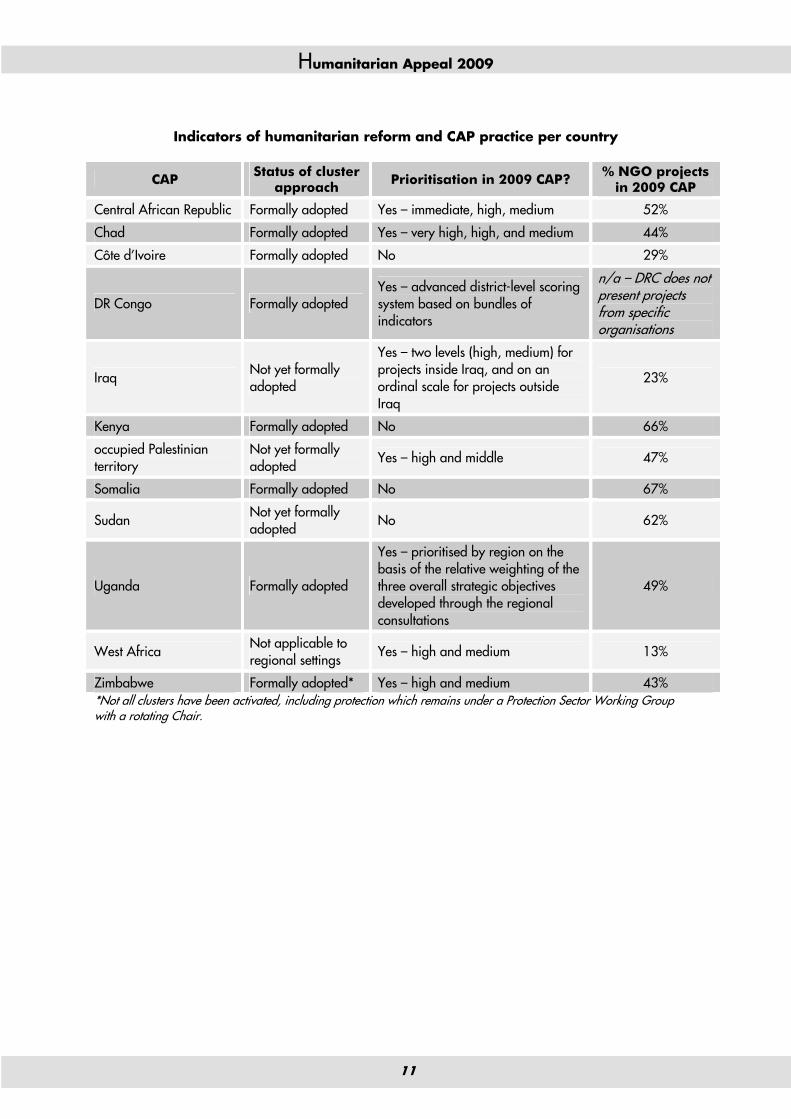
Indicators of humanitarian reform and CAP practice per country
CAP Status of cluster approach Prioritisation in 2009 CAP? % NGO projects
in 2009 CAP
Central African Republic Formally adopted Yes – immediate, high, medium 52%
Chad Formally adopted Yes – very high, high, and medium 44%
Côte d’Ivoire Formally adopted No 29%
DR Congo Formally adopted Yes – advanced district-level scoring system based on bundles of indicators
n/a – DRC does not present projects from specific organisations
Iraq Not yet formally adopted
Yes – two levels (high, medium) for projects inside Iraq, and on an ordinal scale for projects outside Iraq
23%
Kenya Formally adopted No 66%
occupied Palestinian territory
Not yet formally adopted
Yes – high and middle 47%
Somalia Formally adopted No 67%
Sudan Not yet formally adopted
No 62%
Uganda Formally adopted
Yes – prioritised by region on the basis of the relative weighting of the three overall strategic objectives developed through the regional consultations
49%
West Africa Not applicable to regional settings
Yes – high and medium 13%
Zimbabwe Formally adopted* Yes – high and medium 43% *Not all clusters have been activated, including protection which remains under a Protection Sector Working Group with a rotating Chair.
Humanitarian Appeal 2009
12
HUMANITARIAN FINANCE INNOVATIONS: A NATURAL
PARTNER FOR THE CAP The Central Emergency Response Fund (CERF) Over the past three years, the CERF has become a significant funding channel for emergencies. Although CERF constitutes no more than 4% of estimated global annual humanitarian funding4, it makes up a significant proportion of humanitarian funding requested by UN agencies and their partners in consolidated and flash appeals. Since its inception, the CERF has received $1.1 billion in contributions, and has made $1 billion in allocations. The CERF has attracted contributions from an unprecedented coalition of 86 donor governments. 85% of the funds received (as of May 2008) came from seven top donors, whose overall contributions for humanitarian aid have risen steadily over the past seven years. Their contributions to the CERF therefore do not seem to have come at the expense of other contributions, and in that sense they are additional. The ‘rapid response’ window of the CERF is widely recognized as being a valuable and successful addition to the humanitarian financing architecture. It works best when used in combination with UN agencies’ own emergency funds or with other humanitarian pooled funding mechanisms. It enables the Emergency Relief Coordinator to kick-start the international response to an emergency, to meet time-critical requirements and to intervene quickly in deteriorating situations, by funding essential enabling activities and key sectors. The CERF strengthens specific responses through rapid, well-targeted funding, and also strengthens appeals, Humanitarian Coordinators, and clusters by allowing them to direct funding where most needed, according to the strategy they have agreed. The two-year evaluation report provided a number of key recommendations for improvement of the CERF: 1) To improve quality of CERF-funded projects; 2) to ensure timely review of applications and high-quality decisions, and 3) to clarify lines of accountability. For the ‘under-funded window,’ the report recommended that decision-making and data utilized should be communicated in a transparent way, and that the name be changed to “under-funded protracted crisis” window. In 2008, the CERF has disbursed $398,505,472 to emergencies in 53 countries.5 DR Congo, with $41 million, was the largest recipient of CERF funding (10.3%). Among recipient agencies, WFP received the largest amount of CERF funding in 2008: $149 million (37%). The CERF assisted nearly 16.5 million people affected by the food crisis in 2008, committing $88 million specially to support food security in 12 countries most severely affected by the food crisis: Djibouti, Kenya, Burkina Faso, Burundi, Lesotho, Madagascar, Niger, Pakistan, Tajikistan, Yemen and Zimbabwe. 32% of the total CERF allocations in 2008 went to the food sector. $273 million (68.45%) of the total CERF allocations in 2008 went to natural disasters and other rapid-onset emergencies. Every flash appeal in 2008 benefited from CERF funds, sometimes committed even before the launch of the appeal. A total of $126 million went to underfunded crises through a process that allowed the HCs and country teams to target the funds to the most urgent sectors and projects. In total, CERF has funded over 400 humanitarian projects in 2008.6
4 Estimate taken from Global Humanitarian Assistance (2007), Development Initiatives, UK. 5 Data of 07 November 2008. 6 See http://cerf.un.org or www.reliefweb.int/fts for details.

Humanitarian Appeal 2009
13
Emergency Response Funds (ERFs) Emergency Response Funds evolved in order to provide rapid funding to sudden, urgent humanitarian needs, especially unforeseen needs that were not programmed in the CAP. ERFs tend to disburse funds on the order of $5-20 million per year, and so are not meant to be a major channel of funding for large-scale humanitarian programmes. Unlike the CERF, ERFs generally have no statutory restriction on channelling funds directly to NGOs. They therefore increase opportunities for local NGOs to respond to needs in areas where international organizations face challenges to access due to security or political constraints. Over the past two years the number of ERFs has grown steadily and they have become a common feature in emergencies, complementing the CERF and other humanitarian funding mechanisms. Common Humanitarian Funds (CHFs) Alongside the CERF and the establishment of ERFs at the country level, CHFs arose somewhat spontaneously in Sudan and the Democratic Republic of the Congo (DRC) in 2005 and 2006, with the purpose of centralising allocation decisions for a part of the large humanitarian aid flows to those countries, in order to get away from the seemingly random funding outcomes that result from strings of unconnected donor decisions, and allowing the humanitarian strategy to unfold in an orchestrated way, less disrupted by erratic funding patterns, with effective matches between needs and response. Since their inception, donors have contributed over three-quarters of a billion dollars to the CHFs: nearly $500 million to the CHF in Sudan since 2006, and $348 million to the pooled fund in DRC since 2005. (Large though these sums are, they constitute only 13% of total international humanitarian funding to those countries since their CHFs began.) The CHFs have increased the evenness of funding, and lent greater coherence to the implementation of common plans. They have convened a forum for donors to coordinate better among themselves (crucial to securing a balanced outcome for the large majority of funds that are still channelled directly from donor to recipient organisation), because donors have discerned that they cannot make well-informed decisions without closely following what the CHF is doing. An addition benefit, observed in DRC especially, is that the CHF has allowed some smaller donors to increase their contributions, in that they would not have the capacity to manage the number of grants that would result from a larger envelope, but are comfortable entrusting the larger envelope to CHF management. Replication of the CHFs has been on a cautious pilot basis, given the start-up costs, the heavy responsibility of channelling such sums, and the intensity of inter-agency consultation needed to make objective and
East Africa and Horn of Africa40%
South Asia3%
West Africa11%
Southern Africa10%
Southwest and Central Asia11%
Middle East8%
Caribbean7%
Great Lakes and Central Africa10%
CERF funding 2007-2008 by region
Humanitarian Appeal 2009
14
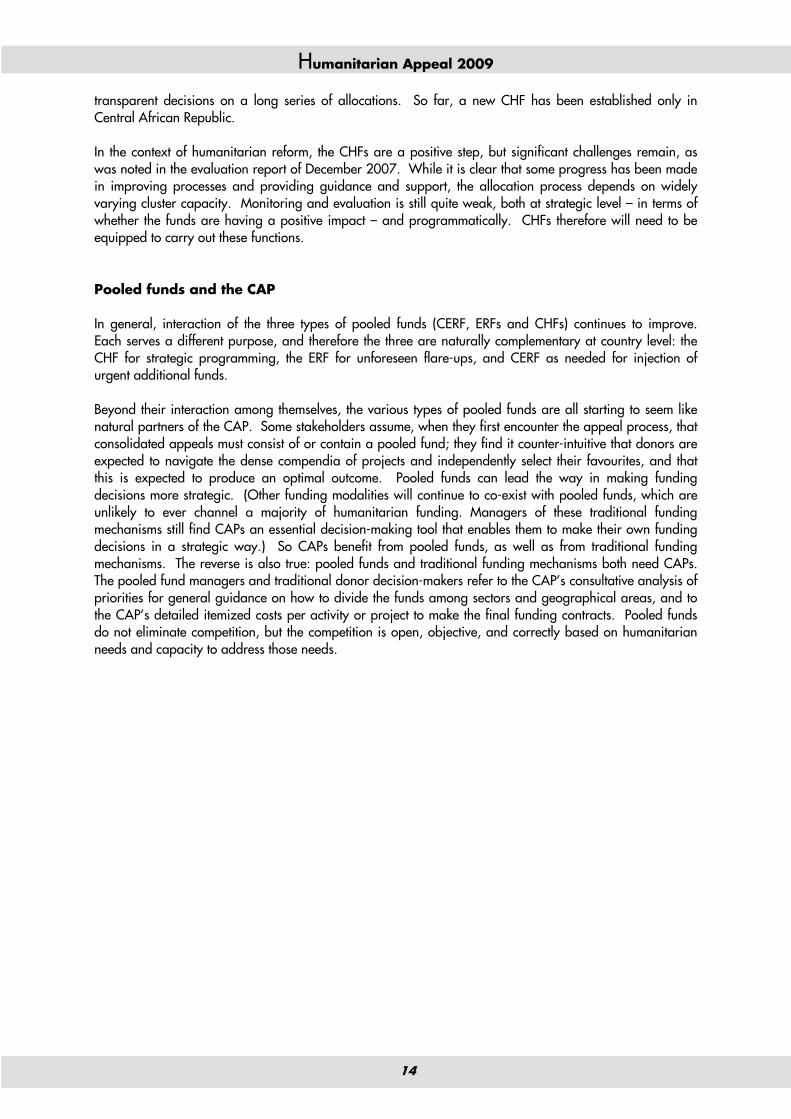
transparent decisions on a long series of allocations. So far, a new CHF has been established only in Central African Republic. In the context of humanitarian reform, the CHFs are a positive step, but significant challenges remain, as was noted in the evaluation report of December 2007. While it is clear that some progress has been made in improving processes and providing guidance and support, the allocation process depends on widely varying cluster capacity. Monitoring and evaluation is still quite weak, both at strategic level – in terms of whether the funds are having a positive impact – and programmatically. CHFs therefore will need to be equipped to carry out these functions. Pooled funds and the CAP In general, interaction of the three types of pooled funds (CERF, ERFs and CHFs) continues to improve. Each serves a different purpose, and therefore the three are naturally complementary at country level: the CHF for strategic programming, the ERF for unforeseen flare-ups, and CERF as needed for injection of urgent additional funds. Beyond their interaction among themselves, the various types of pooled funds are all starting to seem like natural partners of the CAP. Some stakeholders assume, when they first encounter the appeal process, that consolidated appeals must consist of or contain a pooled fund; they find it counter-intuitive that donors are expected to navigate the dense compendia of projects and independently select their favourites, and that this is expected to produce an optimal outcome. Pooled funds can lead the way in making funding decisions more strategic. (Other funding modalities will continue to co-exist with pooled funds, which are unlikely to ever channel a majority of humanitarian funding. Managers of these traditional funding mechanisms still find CAPs an essential decision-making tool that enables them to make their own funding decisions in a strategic way.) So CAPs benefit from pooled funds, as well as from traditional funding mechanisms. The reverse is also true: pooled funds and traditional funding mechanisms both need CAPs. The pooled fund managers and traditional donor decision-makers refer to the CAP’s consultative analysis of priorities for general guidance on how to divide the funds among sectors and geographical areas, and to the CAP’s detailed itemized costs per activity or project to make the final funding contracts. Pooled funds do not eliminate competition, but the competition is open, objective, and correctly based on humanitarian needs and capacity to address those needs.
Humanitarian Appeal 2009
15
2008 Appeals: funding received as % of requirements
0%
10%
28%
30%
33%
36%
41%
51%
56%
62%
63%
63%
68%
68%
68%
69%
70%
70%
70%
75%
77%
91%
Yemen Flash AppealHonduras Flash Appeal
Southern Africa Flash Appeal*Pakistan Flash Appeal
Haiti Flash AppealGeorgia Crisis Flash Appeal
Côte d'Ivoire CAPMadagascar Flash Appeal*
Tajikistan Flash AppealUganda CAP
Myanmar Flash AppealWest Africa CAP
Iraq CAPDemocratic Republic of Congo CAP
Sudan Work Plan occupied Palestinian territory CAP
Kenya Flash AppealSomalia CAP
Bolivia Flash Appeal* Zimbabwe CAP
Chad CAPCentral African Republic CAP
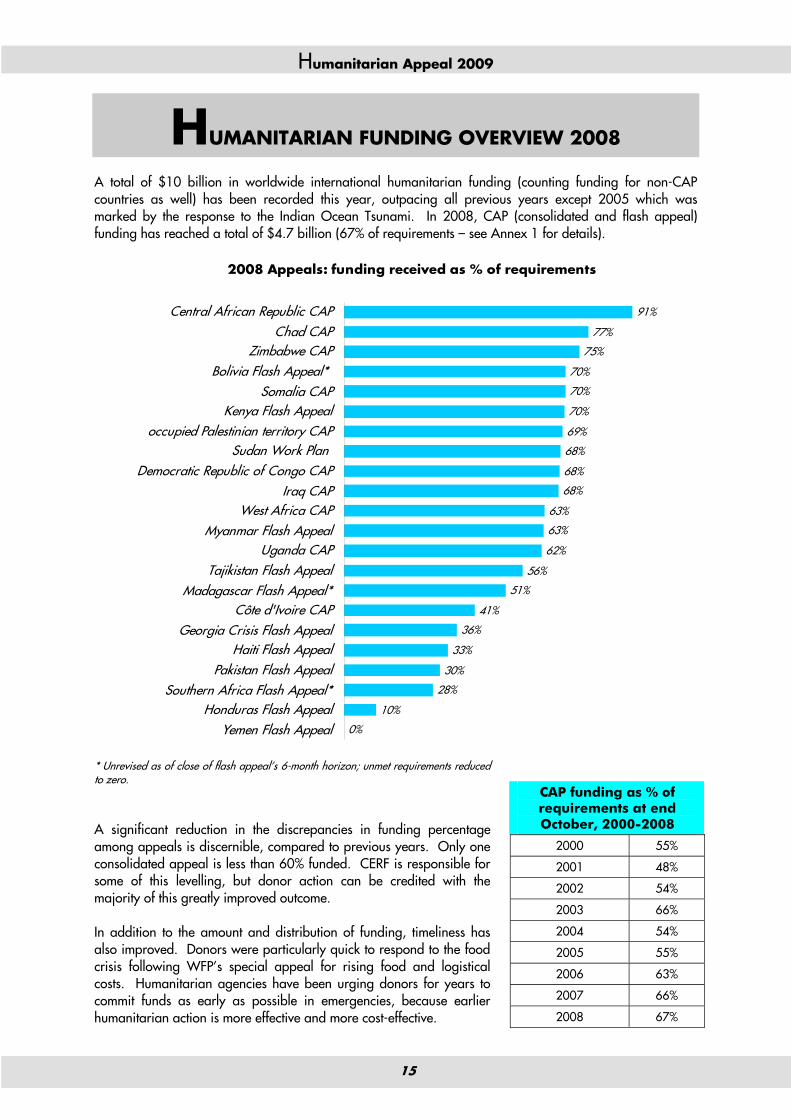
HUMANITARIAN FUNDING OVERVIEW 2008 A total of $10 billion in worldwide international humanitarian funding (counting funding for non-CAP countries as well) has been recorded this year, outpacing all previous years except 2005 which was marked by the response to the Indian Ocean Tsunami. In 2008, CAP (consolidated and flash appeal) funding has reached a total of $4.7 billion (67% of requirements – see Annex 1 for details). * Unrevised as of close of flash appeal’s 6-month horizon; unmet requirements reduced to zero. A significant reduction in the discrepancies in funding percentage among appeals is discernible, compared to previous years. Only one consolidated appeal is less than 60% funded. CERF is responsible for some of this levelling, but donor action can be credited with the majority of this greatly improved outcome. In addition to the amount and distribution of funding, timeliness has also improved. Donors were particularly quick to respond to the food crisis following WFP’s special appeal for rising food and logistical costs. Humanitarian agencies have been urging donors for years to commit funds as early as possible in emergencies, because earlier humanitarian action is more effective and more cost-effective.
CAP funding as % of requirements at end October, 2000-2008
2000 55%
2001 48%
2002 54%
2003 66%
2004 54%
2005 55%
2006 63%
2007 66%
2008 67%

Humanitarian Appeal 2009
16
Funding in relation to requirements per sector in 2008 shows less imbalances among the different sectors compared to previous years – an improvement that can partially be attributed to the impact of CERF and the cluster approach. To complement the levelling effect of the CERF window for under-funded crises, donors are encouraged to continuously coordinate among themselves to collectively allocate more evenly across crises and sectors, as implied by the Good Humanitarian Donorship initiative.
Appeals 2004-2008: % of eventual annual total
funding that was committed in 1st quarter
2004 19% 2005 31% 2006 37% 2007 46% 2008 64%
64%
36%
Funding Jan-Mar 2008 Funding Apr-Oct 2008
Appeals 2008:
2008 Appeal funding per sector as % of requirements
6%
20%
36%
39%
43%
43%
44%
47%
50%
63%
72%
86%
SAFETY AND SECURITY OF STAFF AND OPERATIONS
MINE ACTION
ECONOMIC RECOVERY AND INFRASTRUCTURE
AGRICULTURE
HEALTH
SHELTER AND NON-FOOD ITEMS
WATER AND SANITATION
EDUCATION
PROTECTION/HUMAN RIGHTS/RULE OF LAW
COORDINATION AND SUPPORT SERVICES
MULTI-SECTOR
FOOD
Humanitarian Appeal 2009
17
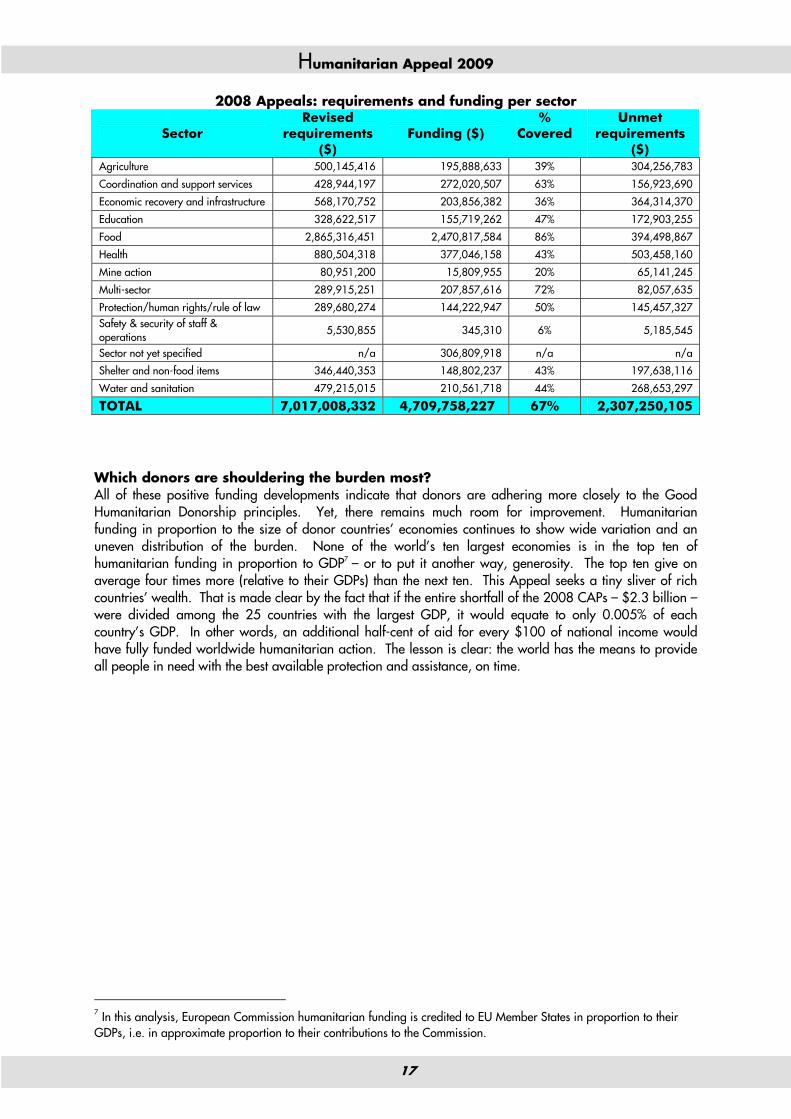
2008 Appeals: requirements and funding per sector
Sector Revised
requirements ($)
Funding ($) %
Covered
Unmet requirements
($) Agriculture 500,145,416 195,888,633 39% 304,256,783
Coordination and support services 428,944,197 272,020,507 63% 156,923,690
Economic recovery and infrastructure 568,170,752 203,856,382 36% 364,314,370
Education 328,622,517 155,719,262 47% 172,903,255
Food 2,865,316,451 2,470,817,584 86% 394,498,867
Health 880,504,318 377,046,158 43% 503,458,160
Mine action 80,951,200 15,809,955 20% 65,141,245
Multi-sector 289,915,251 207,857,616 72% 82,057,635
Protection/human rights/rule of law 289,680,274 144,222,947 50% 145,457,327 Safety & security of staff & operations
5,530,855 345,310 6% 5,185,545
Sector not yet specified n/a 306,809,918 n/a n/a
Shelter and non-food items 346,440,353 148,802,237 43% 197,638,116
Water and sanitation 479,215,015 210,561,718 44% 268,653,297
TOTAL 7,017,008,332 4,709,758,227 67% 2,307,250,105 Which donors are shouldering the burden most? All of these positive funding developments indicate that donors are adhering more closely to the Good Humanitarian Donorship principles. Yet, there remains much room for improvement. Humanitarian funding in proportion to the size of donor countries’ economies continues to show wide variation and an uneven distribution of the burden. None of the world’s ten largest economies is in the top ten of humanitarian funding in proportion to GDP7 – or to put it another way, generosity. The top ten give on average four times more (relative to their GDPs) than the next ten. This Appeal seeks a tiny sliver of rich countries’ wealth. That is made clear by the fact that if the entire shortfall of the 2008 CAPs – $2.3 billion – were divided among the 25 countries with the largest GDP, it would equate to only 0.005% of each country’s GDP. In other words, an additional half-cent of aid for every $100 of national income would have fully funded worldwide humanitarian action. The lesson is clear: the world has the means to provide all people in need with the best available protection and assistance, on time.
7 In this analysis, European Commission humanitarian funding is credited to EU Member States in proportion to their GDPs, i.e. in approximate proportion to their contributions to the Commission.

Humanitarian Appeal 2009
18
CONCLUSION
This 2009 Consolidated Appeal Process brings together 360 key organizations on the ground in unified, strategic and prioritized plans to address the urgent needs of some 30 million vulnerable people affected by emergencies around the world. It offers a unique opportunity to measure whether funding is sufficient to meet all of the critical needs in emergencies, and helps humanitarian organizations to organize themselves better to deliver the best possible protection and assistance to those who need it. The humanitarian agencies represented in the 2009 Consolidated Appeals call upon the donors to maintain, and where possible, increase their support to the CAPs to ensure full and equitable funding for all emergencies. Donors are particularly urged to give early funding to the top-priority projects to assure that live-saving actions begin immediately.
0.0156%
0.0157%
0.0157%
0.0191%
0.0208%
0.0216%
0.0218%
0.0258%
0.0301%
0.0317%
0.0473%
0.0551%
0.0649%
0.0683%
0.0717%
0.0926%
0.1092%
0.1132%
0.1156%
0.1622%
Italy
Germany
Iceland
United States
Samoa
Tonga
Belgium
United Kingdom
Switzerland
Canada
Finland
Netherlands
Denmark
Kuwait
Ireland
Sweden
Luxembourg
Monaco
Norway
Saudi Arabia
Total humanitarian funding in 2008 as % of donor country GDP (top 20)

Humanitarian Appeal 2009
19
2009 Consolidated Appeals

Humanitarian Appeal 2009
20
In Central African Republic, the most remarkable achievement in 2008 was the return of almost half of the country’s internally displaced persons. 85,000 people returned to their villages in the hope of re-establishing their livelihoods and starting new lives. Another important development was the launch of a comprehensive justice and security sector reform with a national seminar in April 2008. The reform encompassing the justice system, police, gendarmerie, FACA (Forces armées centrafricaines / Central African Armed Forces) and presidential guard is part of the struggle against impunity and should help the government to better ensure and respect the safety and rights of their people. The ongoing peace process and efforts by the government to reform the security sector and struggle against impunity and corruption, together with international interest that is higher than at any time in the past, have created crucial momentum. Despite continuing insecurity, relief organisations managed to reach more people in need across the country
in 2008 than ever before. Humanitarian presence in conflict-affected areas increased, and aid organisations have strived to include early recovery aspects in their programmes. Yet in spite of some progress made, the situation remains very fragile. 209,000 Central Africans displaced in different parts of the country and in neighbouring Chad, Cameroon and Sudan are still too scared to go back home. Forced displacement remains worryingly high in the northwest, where banditry, incursions of foreign armed groups, and renewed fighting forced people to flee their villages on numerous occasions in 2008. In the southeast, attacks by the Ugandan rebel group Lord’s Resistance Army on several villages also forced some 5,000 people to flee their homes in an area that until mid-2007 had hosted 14,000 refugees from South Sudan. Political conflict, brutal banditry, the destruction of schools, health centres and houses, and forced displacement are increasingly taking their toll on Central Africans – most of whom are already living in dire circumstances. The Central African Republic is one of the poorest countries in the world and basic health indicators are among the worst on the continent. The humanitarian strategy for 2009 is geographically limited to areas directly affected by conflict and violence: the seven northern prefectures and the far southeast. The Humanitarian and Development Partnership Team (which groups UN agencies, local and international NGOs, and the International Red Cross and Red Crescent Movement8) identified four sectors as priorities: Health, Water,
8 The ICRC participates in the HDPT but its action is not part of, or coordinated by, this Coordinated Aid Programme.
Central African Republic

Humanitarian Appeal 2009
21
Sanitation and Hygiene, Protection and Early Recovery. All projects in this CAP have been ranked on a ten-point priority scale according to objective criteria. As some of the criteria are mutually exclusive in practice, projects that fulfil at least eight of the ten criteria are ranked as ‘immediate’, projects that score on at least six criteria are ranked as ‘high’ and projects that fulfil less than six criteria are ranked ‘medium’. The strategic priorities for 2009 are: 1) Based on assessed needs and using a
human-rights based approach, deliver life-saving assistance, especially emergency healthcare and safe water and sanitation to people struck by violence, particularly displaced people and refugees across the north of and in the southeast.
2) Protect people struck by violence against violations of their basic human rights and help restore the dignity of survivors.
3) Support returning displaced people and refugees, host communities and others in post-conflict settings to restart their lives by integrating early recovery and humanitarian action.
The 24 NGOs and 10 UN organisations participating in this CAP appeal for $116,220,137 for 105 projects.
Some basic facts about Central African Republic9 Population (millions) 4.3* Infant mortality ratio 115 p/1,000 Children under 5 mortality ratio 176 p/1,000* Maternal mortality ratio 1,355 p/100,000* Life expectancy (years) 42.7* % of population under-nourished 44% % of population not using an improved water source 25% # of internally displaced persons 108,000* % of population displaced 2.5% # refugees in-country (2008) 7,767* # refugees abroad (2008) 101,245* % living on $1 a day or less 66.6 ECHO GNA score 3/3 (most severe) GNI per capita (USD) $449* UNDP HDI score and rank (out of 177) 0.384: 171st (low)
Contact Mr. Maimoussa Abari UN Resident Coordinator / Humanitarian Coordinator a.i., Central African Republic Bangui Tel: +236 61 32 70 Email: [email protected]
9 See p. 44 for explanations and sources of statistics.
CLUSTER 2009 funding requirements
($) Coordination and support services 8,117,830 Early recovery 8,461,230 Education 5,829,297 Food security 43,008,095 Health 21,172,555 Multi-sector assistance to refugees 3,730,862 Nutrition 9,686,054 Protection 9,020,773 Shelter and non-food items 1,013,298 Water, sanitation and hygiene 6,180,143 TOTAL 116,220,137

Humanitarian Appeal 2009
22
The humanitarian situation in Chad has shown few signs of improvement in 2008. Rebel activities, ethnic tensions within the country, and a degradation of security in the neighbouring Darfur region of Sudan and persistent insecurity in Central African Republic, all contributed to increased instability. Since 2003, Chad has sheltered 250,000 Sudanese refugees in the east and 55,000 Central African refugees in the south. Given the situation in both Darfur and CAR, an additional influx of refugees is expected in 2009 and sustainable, voluntary return is not yet a viable option. Internal conflicts have caused the displacement of 180,000 Chadians in the east of the country most of whom are largely dependent on humanitarian aid. The arrival of both refugees and IDPs puts additional strain on vulnerable segments of local host communities. In February 2008, rebels attacked N’Djamena in an attempt to overthrow the government. Although the attempt failed, warfare in the country intensified and the recruitment of children as soldiers reportedly increased. There might be up to 10,000 children currently associated
with armed forces and groups, and recruitment is ongoing in several parts of the east. Most humanitarian organizations working in Chad evacuated international staff during the February attack, but humanitarian operations resumed in March, and life-saving activities were never interrupted. Although peace accords have been negotiated with the rebels, there is still no peace and relations with Sudan remain tense. Insecurity has been an important challenge for humanitarian aid organisations. During 2008, there have been 124 security incidents in the east involving humanitarian organizations, and seven assassinations. This has reduced humanitarian access and hampered aid operations in certain areas. Several CAP projects have had to be downsized or cancelled during 2008 due to the limited scope for action. The deployment of a multi-dimensional international presence, mandated and authorised under United Nations Security Council resolution 1778, has been delayed due to insecurity in their area of operation. The deployment of the Détachement Intégré de Sécurité or DIS – Chadian gendarmes trained by UN Police and equipped by the Chadian Government – has also been delayed which stalls the improvement of security around the refugee camps and towns where the DIS is supposed to operate. Yet despite the difficulties and constraints, humanitarian actions have benefited over 500,000 people in 2008. Aid agencies also played a key role in supporting risk reduction and conflict prevention – a cross-cutting priority essential to prevent further loss of life and suffering.
Chad

Humanitarian Appeal 2009
23
Humanitarian actions in 2009 will concentrate on the most urgent needs, with an emphasis on promoting self-sufficiency and local capacity-building. This Consolidated Appeal calls for $389 million for 35 NGO and 44 UN projects.
Some basic facts about Chad Population (millions) 10.3 Infant mortality ratio 124 p/1,000 Children under 5 mortality ratio 209 p/1,000 Maternal mortality ratio 1,500 p/100,000 Life expectancy (years) 50.5 % of population under-nourished 35% % of population not using an improved water source 58% # of internally displaced persons 185,000* % of population displaced 1.8% # refugees in-country (2008) 313,000* # refugees abroad (2008) 36,300 % living on $1 a day or less 55%* ECHO GNA score 3/3 (most severe) GNI per capita (USD) 540 UNDP HDI score and rank (out of 177) 0.388: 170th (low)
Contact Mr. Kingsley Amaning UN Resident Coordinator / Humanitarian Coordinator, Chad N’Djamena Tel: +235 51 71 00 Email: [email protected]
SECTOR/CLUSTER 2009 funding requirements
($) Agriculture and livelihoods 182,608,714 Coordination and support services 28,941,196 Education 15,139,882 Food aid 14,572,402 Health 16,708,722 Mine action 4,983,269 Multi-sector activities for IDPs and refugees 96,010,235 Nutrition 2,792,730 Protection 6,855,000 Safety and security of staff and operations 178,200 Site management 950,000 Water and sanitation 19,200,000 TOTAL 388,940,350

Humanitarian Appeal 2009
24
Over the past year, Côte d’Ivoire has made significant progress in implementing the Ouagadougou Political Agreement that was signed on 4 March 2007. For the first time since the conflict erupted in 2002, the country is now entering a post-conflict phase. Improvements in the security situation contributed to the stabilization of the return areas of displaced persons and more than 69,000 IDPs have voluntarily returned to their places of origin in the regions of Moyen Cavally and 18 Montagnes. The closure of the IDP Transit Camp in Guiglo on 31 July 2008 marked the completion of the return activities timeline agreed upon by the humanitarian community and the government. The camp had hosted up to 7,900 IDPs. However there are still around 45,000 IDPs in “transition situations” awaiting their final return to their communities. Despite the changes in the context and the shift from emergency relief towards early recovery and development in many parts of the country, there are still many
humanitarian needs in the west and in some parts of the north of the country. In 2008, aid agencies and the government have responded to the relief and protection needs of around 120,000 IDPs in the west. A related objective has been the improvement of conditions in areas of return (namely in the west) in order to facilitate the return of displaced persons. Protection is of particular importance as sexual and gender-based violence continues to prevail despite the ongoing peace process. Recent surveys have also revealed high malnutrition rates and a worrisome food security situation in the north due to a combination of factors: the poor maize and rice harvest in 2007, steep falls in market prices for cotton and cashew nuts (principle cash crops in the region), and general loss of purchasing power due to high food prices. To adequately respond to humanitarian needs as well as emerging recovery and development requirements, stakeholders have highlighted the need for humanitarian and recovery activities to be complementary. In this perspective, it has been agreed that the humanitarian community would focus on identifying and responding to existing assistance and protection needs of IDPs, returnees, refugees and other vulnerable groups in host communities. Needs related to early recovery and sustainable development will be addressed by appropriate actors through relevant programming and funding mechanisms such as the Government-led “Programme de Sortie de Crise.” The 2009 ‘Critical Humanitarian Needs and Funding Gaps’ presents the common humanitarian strategy for Côte d’Ivoire and focuses on IDP resettlement and protection in the west as well as nutrition and food security in the north. The total amount requested is $35 million for 5 NGO and 12 UN projects.
Côte d’Ivoire

Humanitarian Appeal 2009
25
CLUSTER 2009 funding requirements
($) Coordination and support services 4,005,859 Food security and nutrition 25,763,377 Health 2,411,853 Protection 2,616,906 Water, sanitation and hygiene 782,000
TOTAL 35,579,995
Some basic facts about Côte d’Ivoire Population (millions) 18.8 Infant mortality ratio 90 p/1,000 Children under 5 mortality ratio 127 p/1,000 Maternal mortality ratio 810 p/100,000 Life expectancy (years) 46.8 % of population under-nourished 13% % of population not using an improved water source 16% # of internally displaced persons 709,380 % of population displaced 3.7% # refugees in-country (2008) 24,155 # refugees abroad (2008) 15,000 % living on $1 a day or less 14.8 ECHO GNA score 3/3 GNI per capita (USD) 910 UNDP HDI score and rank (out of 177) 0.432: 166th (low)
Contact Mr. Georg Charpentier Deputy Special Representative of the Secretary-General / UN Resident Coordinator / Humanitarian Coordinator, Côte d’Ivoire Abidjan Tel: +225 20 31 74 02 Email: [email protected]

Humanitarian Appeal 2009
26
Despite some positive political developments at the beginning of the year – in particular the peace process in the Kivus – 2008 has been marked by increased violence and conflict in the east. At the time of writing, a regional summit is being held to try to end the flaring conflict in the east of DR Congo amidst fears that it might engulf neighbouring countries and threaten peace and security in the entire region. Since August 2008, renewed clashes between armed opposition groups and government forces concentrated in North Kivu Province have resulted in the killing of innocent civilians, displacement of hundreds of thousands of people, widespread looting, and a rapid deterioration of already dire humanitarian conditions. At the time of writing, preliminary reports showed that several camps for IDPs have been looted and burnt, and investigations about widespread violations of human rights and international humanitarian law are under way. UN Secretary-General Ban Ki-moon asked the Security Council to consider the possibility of strengthening the UN Mission in DR Congo
(MONUC) by adding 3,000 additional peacekeepers to its current total of 17,000. In addition to the existing caseload of 1,350,000 IDPs in North and South Kivu and the north of Eastern Province, the humanitarian community – organized into 10 clusters – is preparing to respond to the needs of an additional 300,000 newly displaced people in 2009. However, insecurity, bad infrastructure and unreliable commercial transport often hamper access to displaced populations. Provinces in the west of the country enjoy a relative stability, but even there large parts of the population suffer from a lack of access to basic services, malnutrition, disease outbreaks and human rights violations. Almost 1.7 million children in DR Congo suffer from acute malnutrition. While the humanitarian community works hard to address the most urgent needs, it cannot address all of the needs related to extreme poverty and underdevelopment in this vast country. Humanitarian aid allows vulnerable Congolese to survive emergencies, but it does not address the underlying causes. For 2009, the humanitarian actors in DR Congo have therefore decided to focus on reinforcing traditional coping mechanisms that will allow IDPs to be absorbed by host communities, and on curtailing aid dependence by encouraging durable solutions and self-reliance. The humanitarian community aims to implement early warning systems that will help identify communities susceptible to humanitarian crises and propose preventive measures. In addition, humanitarian agencies will advocate for the introduction of micro-economic development projects in traditional emergency areas. The 2009 Humanitarian Action Plan has two new strategic objectives: 1) restoring livelihoods of populations affected by emergencies through food security interventions aimed at rebuilding self-reliance; and 2) strengthening communities
Humanitarian Appeal 2009
27
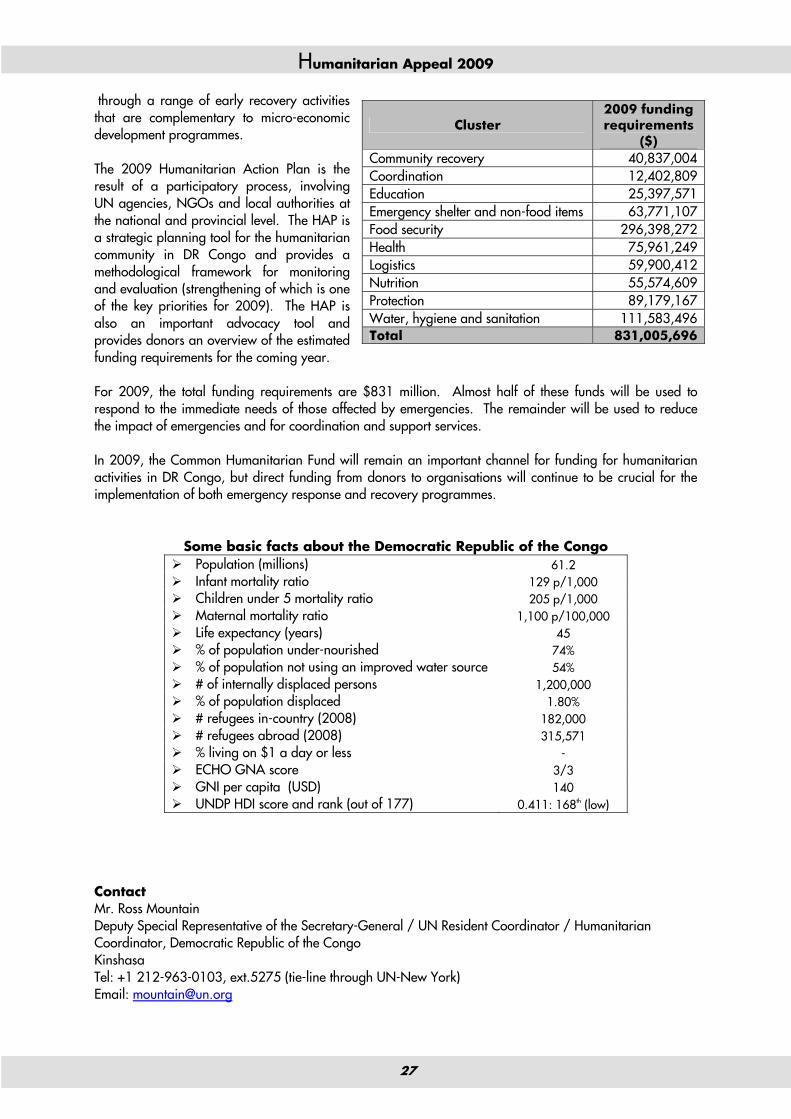
through a range of early recovery activities that are complementary to micro-economic development programmes. The 2009 Humanitarian Action Plan is the result of a participatory process, involving UN agencies, NGOs and local authorities at the national and provincial level. The HAP is a strategic planning tool for the humanitarian community in DR Congo and provides a methodological framework for monitoring and evaluation (strengthening of which is one of the key priorities for 2009). The HAP is also an important advocacy tool and provides donors an overview of the estimated funding requirements for the coming year. For 2009, the total funding requirements are $831 million. Almost half of these funds will be used to respond to the immediate needs of those affected by emergencies. The remainder will be used to reduce the impact of emergencies and for coordination and support services. In 2009, the Common Humanitarian Fund will remain an important channel for funding for humanitarian activities in DR Congo, but direct funding from donors to organisations will continue to be crucial for the implementation of both emergency response and recovery programmes.
Some basic facts about the Democratic Republic of the Congo Population (millions) 61.2 Infant mortality ratio 129 p/1,000 Children under 5 mortality ratio 205 p/1,000 Maternal mortality ratio 1,100 p/100,000 Life expectancy (years) 45 % of population under-nourished 74% % of population not using an improved water source 54% # of internally displaced persons 1,200,000 % of population displaced 1.80% # refugees in-country (2008) 182,000 # refugees abroad (2008) 315,571 % living on $1 a day or less - ECHO GNA score 3/3 GNI per capita (USD) 140 UNDP HDI score and rank (out of 177) 0.411: 168th (low)
Contact Mr. Ross Mountain Deputy Special Representative of the Secretary-General / UN Resident Coordinator / Humanitarian Coordinator, Democratic Republic of the Congo Kinshasa Tel: +1 212-963-0103, ext.5275 (tie-line through UN-New York) Email: [email protected]
Cluster 2009 funding requirements
($) Community recovery 40,837,004 Coordination 12,402,809 Education 25,397,571 Emergency shelter and non-food items 63,771,107 Food security 296,398,272 Health 75,961,249 Logistics 59,900,412 Nutrition 55,574,609 Protection 89,179,167 Water, hygiene and sanitation 111,583,496 Total 831,005,696
Humanitarian Appeal 2009
28
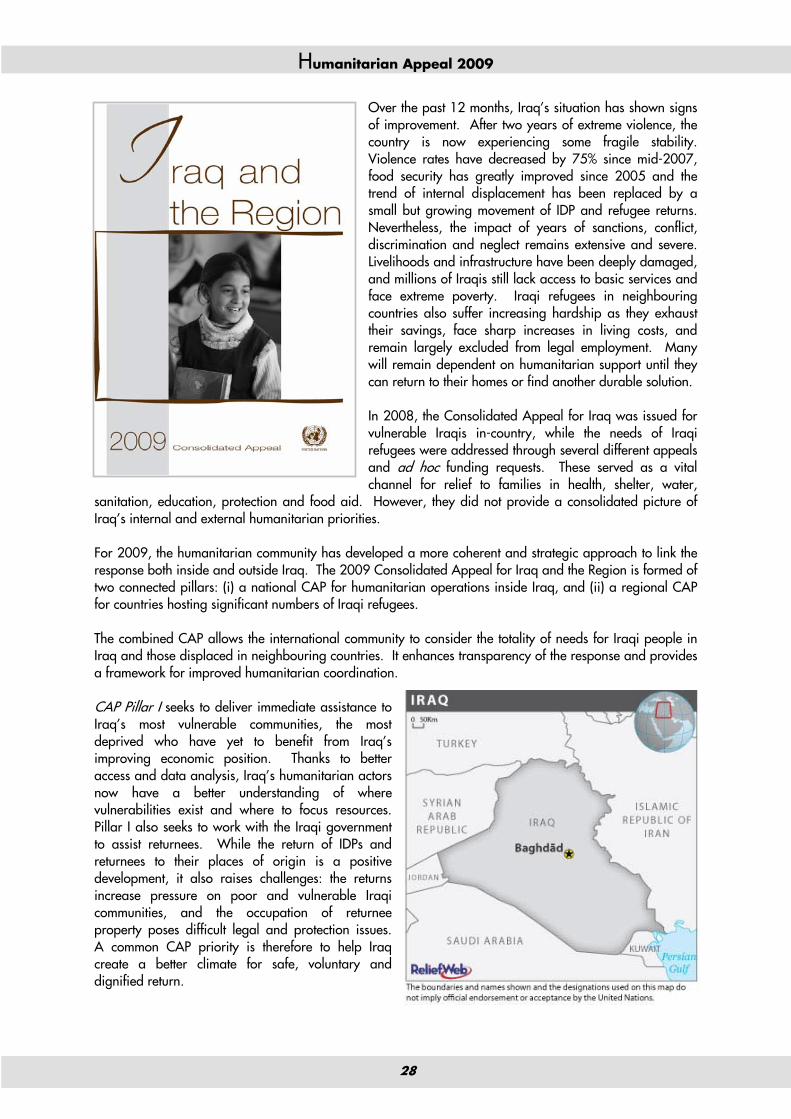
Over the past 12 months, Iraq’s situation has shown signs of improvement. After two years of extreme violence, the country is now experiencing some fragile stability. Violence rates have decreased by 75% since mid-2007, food security has greatly improved since 2005 and the trend of internal displacement has been replaced by a small but growing movement of IDP and refugee returns. Nevertheless, the impact of years of sanctions, conflict, discrimination and neglect remains extensive and severe. Livelihoods and infrastructure have been deeply damaged, and millions of Iraqis still lack access to basic services and face extreme poverty. Iraqi refugees in neighbouring countries also suffer increasing hardship as they exhaust their savings, face sharp increases in living costs, and remain largely excluded from legal employment. Many will remain dependent on humanitarian support until they can return to their homes or find another durable solution. In 2008, the Consolidated Appeal for Iraq was issued for vulnerable Iraqis in-country, while the needs of Iraqi refugees were addressed through several different appeals and ad hoc funding requests. These served as a vital channel for relief to families in health, shelter, water,
sanitation, education, protection and food aid. However, they did not provide a consolidated picture of Iraq’s internal and external humanitarian priorities. For 2009, the humanitarian community has developed a more coherent and strategic approach to link the response both inside and outside Iraq. The 2009 Consolidated Appeal for Iraq and the Region is formed of two connected pillars: (i) a national CAP for humanitarian operations inside Iraq, and (ii) a regional CAP for countries hosting significant numbers of Iraqi refugees. The combined CAP allows the international community to consider the totality of needs for Iraqi people in Iraq and those displaced in neighbouring countries. It enhances transparency of the response and provides a framework for improved humanitarian coordination. CAP Pillar I seeks to deliver immediate assistance to Iraq’s most vulnerable communities, the most deprived who have yet to benefit from Iraq’s improving economic position. Thanks to better access and data analysis, Iraq’s humanitarian actors now have a better understanding of where vulnerabilities exist and where to focus resources. Pillar I also seeks to work with the Iraqi government to assist returnees. While the return of IDPs and returnees to their places of origin is a positive development, it also raises challenges: the returns increase pressure on poor and vulnerable Iraqi communities, and the occupation of returnee property poses difficult legal and protection issues. A common CAP priority is therefore to help Iraq create a better climate for safe, voluntary and dignified return.
Humanitarian Appeal 2009
29
CAP Pillar II will focus on the urgent humanitarian needs of Iraqi refugees in Syria, Jordan, Lebanon, Egypt, Turkey, Iran and the Gulf Cooperation Council States. Collectively, these governments report hosting up to 2 million Iraqis refugees, of whom only a small proportion are registered with UNHCR. The refugee caseload puts considerable strain on the capacity of the host countries. Most host governments grant Iraqi refugees access to basic public services, at considerable cost to the national budget. The objective of Pillar II is to ensure sustained support and protection for these refugees until voluntary return is possible or another durable solution is found. The CAP also seeks to provide assistance to refugees inside Iraq from other countries, including Palestinian, Iranian and Turkish refugees. This consolidated appeal clearly acknowledges the role of governments in leading the humanitarian response, and one of the objectives is to restore services and rule of law. Iraq is already achieving this in some parts of the country against great odds, but much remains to be done. Since the 2008 CAP was issued, Iraq has increased support for humanitarian response and also provided assistance to its neighbours most of whom allow Iraqi refugees access to public services. As the country looks to the future, the Iraqi Government has clearly stated its intent to move from foreign assistance to independence. The 2009 Consolidated Appeal for Iraq and the Region will support this goal, by reaching Iraq’s most vulnerable citizens in-country and abroad, and bringing them a step closer to self-reliance. The appeal seeks a total of $547 million for 45 NGO and 139 UN projects.
Some basic facts about Iraq Population (millions) 30.3 Infant mortality ratio 37 p/1,000 Children under 5 mortality ratio 46 p/1,000 Maternal mortality ratio 300 p/100,000 Life expectancy (years) 60 % of population under-nourished 8% % of population not using an improved water source - # of internally displaced persons 2,800,000 (UNHCR) % of population displaced 8% (UNHCR) # refugees in-country (2008) 44,406 (UNHCR) # refugees abroad (2008) 1,500,000 (UNHCR) % living on $1 a day or less - ECHO GNA score 2/3 GNI per capita (USD) 144 UNDP HDI score and rank (out of 177) -
Contact Mr. David Shearer Deputy Special Representative of the Secretary-General / UN Resident Coordinator / Humanitarian Coordinator, Iraq Baghdad Tel: +962 6 550 4700, ext. 2610 Email: [email protected]
Sector 2009 funding requirements
($) Coordination and support services 40,423,617 Economic recovery and infrastructure 32,890,000 Education 67,975,353 Food 115,765,926 Health 83,702,986 Mine action 330,000 Multi-sector 42,642,856 Protection/human rights/rule of law 66,724,685 Shelter and non-food items 75,060,017 Water and sanitation 21,827,321 Total 547,342,761
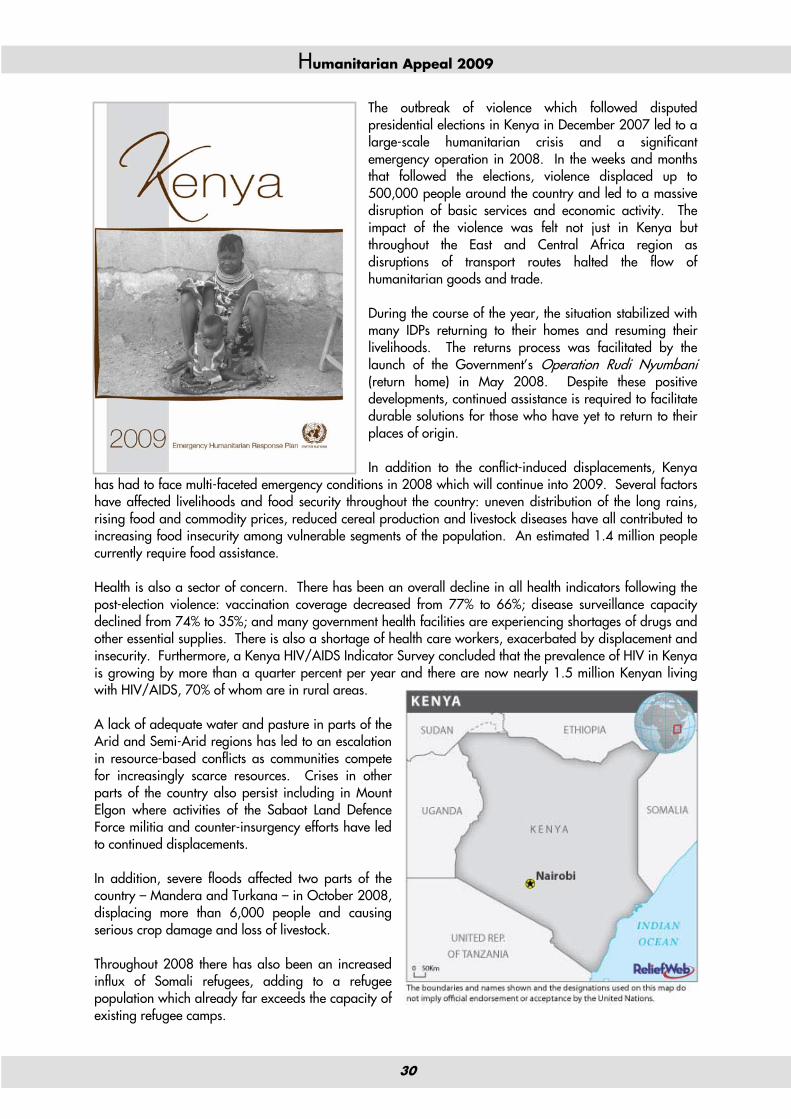
Humanitarian Appeal 2009
30
The outbreak of violence which followed disputed presidential elections in Kenya in December 2007 led to a large-scale humanitarian crisis and a significant emergency operation in 2008. In the weeks and months that followed the elections, violence displaced up to 500,000 people around the country and led to a massive disruption of basic services and economic activity. The impact of the violence was felt not just in Kenya but throughout the East and Central Africa region as disruptions of transport routes halted the flow of humanitarian goods and trade. During the course of the year, the situation stabilized with many IDPs returning to their homes and resuming their livelihoods. The returns process was facilitated by the launch of the Government’s Operation Rudi Nyumbani (return home) in May 2008. Despite these positive developments, continued assistance is required to facilitate durable solutions for those who have yet to return to their places of origin. In addition to the conflict-induced displacements, Kenya
has had to face multi-faceted emergency conditions in 2008 which will continue into 2009. Several factors have affected livelihoods and food security throughout the country: uneven distribution of the long rains, rising food and commodity prices, reduced cereal production and livestock diseases have all contributed to increasing food insecurity among vulnerable segments of the population. An estimated 1.4 million people currently require food assistance. Health is also a sector of concern. There has been an overall decline in all health indicators following the post-election violence: vaccination coverage decreased from 77% to 66%; disease surveillance capacity declined from 74% to 35%; and many government health facilities are experiencing shortages of drugs and other essential supplies. There is also a shortage of health care workers, exacerbated by displacement and insecurity. Furthermore, a Kenya HIV/AIDS Indicator Survey concluded that the prevalence of HIV in Kenya is growing by more than a quarter percent per year and there are now nearly 1.5 million Kenyan living with HIV/AIDS, 70% of whom are in rural areas. A lack of adequate water and pasture in parts of the Arid and Semi-Arid regions has led to an escalation in resource-based conflicts as communities compete for increasingly scarce resources. Crises in other parts of the country also persist including in Mount Elgon where activities of the Sabaot Land Defence Force militia and counter-insurgency efforts have led to continued displacements. In addition, severe floods affected two parts of the country – Mandera and Turkana – in October 2008, displacing more than 6,000 people and causing serious crop damage and loss of livestock. Throughout 2008 there has also been an increased influx of Somali refugees, adding to a refugee population which already far exceeds the capacity of existing refugee camps.

Humanitarian Appeal 2009
31
Faced with all of these challenges, the humanitarian actors have worked together to respond flexibly to new developments, despite the many competing priorities. The plans and projects presented in this 2009 Appeal have been developed with the participation of over 50 organisations, including the Government of Kenya, local and international NGOs, UN agencies and the Kenya Red Cross Society (KRCS). The appeal outlines key response and preparedness requirements and early recovery strategies in eleven sectors, and requests a total of $390 million for 75 NGO and 38 UN projects.
Some basic facts about Kenya Population (millions) 36 Infant mortality ratio 79 p/1,000 Children under 5 mortality ratio 121 p/1,000 Maternal mortality ratio 560 p/100,000 Life expectancy (years) 51 % of population under-nourished 31% % of population not using an improved water source 39% # of internally displaced persons 64,000 % of population displaced 0.1% # refugees in-country (2008) 300,000 % living on $1 a day or less 22.8 ECHO GNA score 3/3 GNI per capita (USD) 680 UNDP HDI score and rank (out of 177) 0.521: 148th
Contact Mr. Aeneas Chuma Resident Coordinator/Humanitarian Coordinator, Kenya Nairobi Tel: +254 20 62 44 62 Email: [email protected]
Cluster 2009 funding requirements
($) Coordination 8,302,804 Early recovery and food security 16,740,061 Education 5,972,750 Food aid 172,752,615 Health 10,516,903 Multi-Sector (refugees) 127,761,118 Nutrition 8,363,627 Protection 13,595,557 Shelter and camp coordination & management
14,193,149
Water, sanitation and hygiene 11,853,000 Total 390,051,584
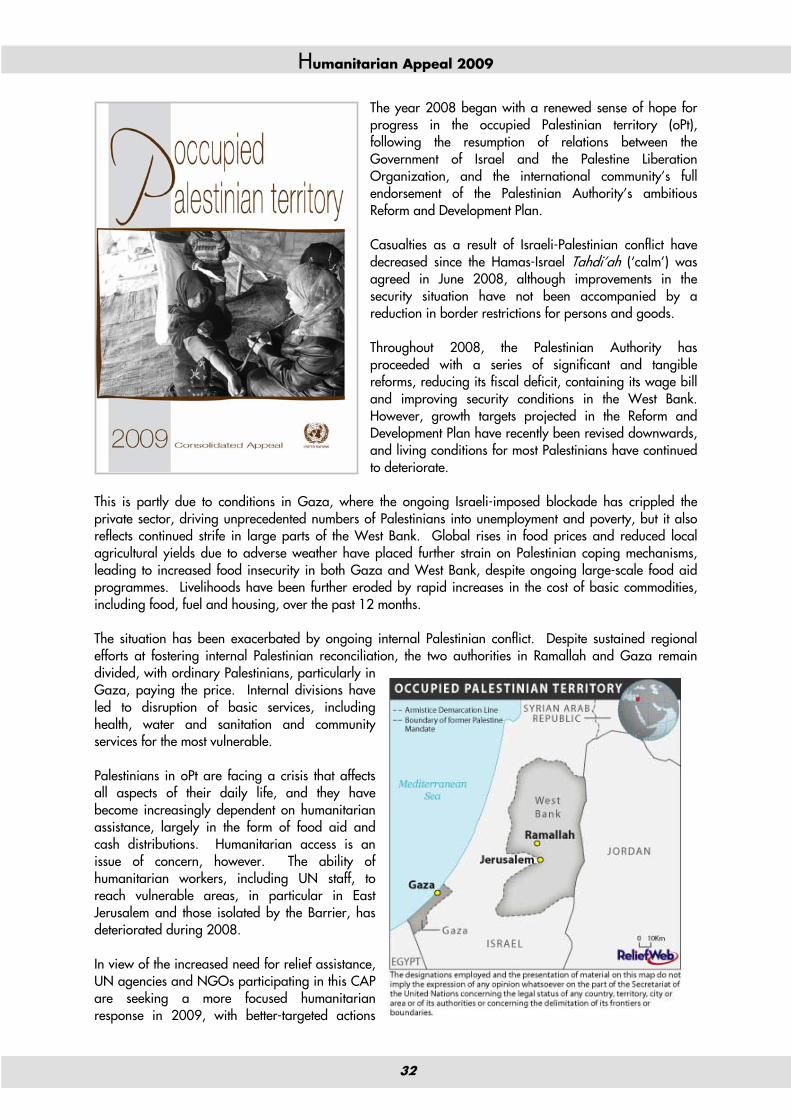
Humanitarian Appeal 2009
32
The year 2008 began with a renewed sense of hope for progress in the occupied Palestinian territory (oPt), following the resumption of relations between the Government of Israel and the Palestine Liberation Organization, and the international community’s full endorsement of the Palestinian Authority’s ambitious Reform and Development Plan. Casualties as a result of Israeli-Palestinian conflict have decreased since the Hamas-Israel Tahdi’ah (‘calm’) was agreed in June 2008, although improvements in the security situation have not been accompanied by a reduction in border restrictions for persons and goods. Throughout 2008, the Palestinian Authority has proceeded with a series of significant and tangible reforms, reducing its fiscal deficit, containing its wage bill and improving security conditions in the West Bank. However, growth targets projected in the Reform and Development Plan have recently been revised downwards, and living conditions for most Palestinians have continued to deteriorate.
This is partly due to conditions in Gaza, where the ongoing Israeli-imposed blockade has crippled the private sector, driving unprecedented numbers of Palestinians into unemployment and poverty, but it also reflects continued strife in large parts of the West Bank. Global rises in food prices and reduced local agricultural yields due to adverse weather have placed further strain on Palestinian coping mechanisms, leading to increased food insecurity in both Gaza and West Bank, despite ongoing large-scale food aid programmes. Livelihoods have been further eroded by rapid increases in the cost of basic commodities, including food, fuel and housing, over the past 12 months. The situation has been exacerbated by ongoing internal Palestinian conflict. Despite sustained regional efforts at fostering internal Palestinian reconciliation, the two authorities in Ramallah and Gaza remain divided, with ordinary Palestinians, particularly in Gaza, paying the price. Internal divisions have led to disruption of basic services, including health, water and sanitation and community services for the most vulnerable. Palestinians in oPt are facing a crisis that affects all aspects of their daily life, and they have become increasingly dependent on humanitarian assistance, largely in the form of food aid and cash distributions. Humanitarian access is an issue of concern, however. The ability of humanitarian workers, including UN staff, to reach vulnerable areas, in particular in East Jerusalem and those isolated by the Barrier, has deteriorated during 2008. In view of the increased need for relief assistance, UN agencies and NGOs participating in this CAP are seeking a more focused humanitarian response in 2009, with better-targeted actions
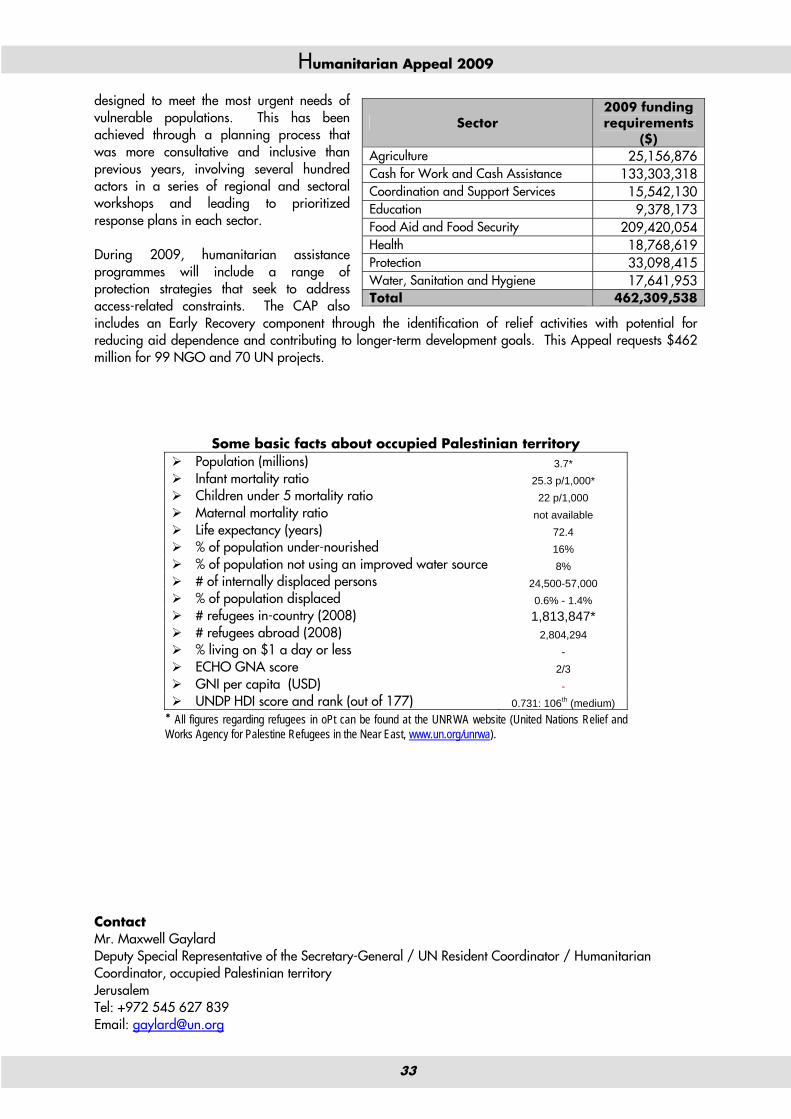
Humanitarian Appeal 2009
33
designed to meet the most urgent needs of vulnerable populations. This has been achieved through a planning process that was more consultative and inclusive than previous years, involving several hundred actors in a series of regional and sectoral workshops and leading to prioritized response plans in each sector. During 2009, humanitarian assistance programmes will include a range of protection strategies that seek to address access-related constraints. The CAP also includes an Early Recovery component through the identification of relief activities with potential for reducing aid dependence and contributing to longer-term development goals. This Appeal requests $462 million for 99 NGO and 70 UN projects.
Some basic facts about occupied Palestinian territory Population (millions) 3.7* Infant mortality ratio 25.3 p/1,000* Children under 5 mortality ratio 22 p/1,000 Maternal mortality ratio not available Life expectancy (years) 72.4 % of population under-nourished 16% % of population not using an improved water source 8% # of internally displaced persons 24,500-57,000 % of population displaced 0.6% - 1.4% # refugees in-country (2008) 1,813,847* # refugees abroad (2008) 2,804,294 % living on $1 a day or less - ECHO GNA score 2/3 GNI per capita (USD) - UNDP HDI score and rank (out of 177) 0.731: 106th (medium)
* All figures regarding refugees in oPt can be found at the UNRWA website (United Nations Relief and Works Agency for Palestine Refugees in the Near East, www.un.org/unrwa).
Contact Mr. Maxwell Gaylard Deputy Special Representative of the Secretary-General / UN Resident Coordinator / Humanitarian Coordinator, occupied Palestinian territory Jerusalem Tel: +972 545 627 839 Email: [email protected]
Sector 2009 funding requirements
($) Agriculture 25,156,876 Cash for Work and Cash Assistance 133,303,318 Coordination and Support Services 15,542,130 Education 9,378,173 Food Aid and Food Security 209,420,054 Health 18,768,619 Protection 33,098,415 Water, Sanitation and Hygiene 17,641,953 Total 462,309,538
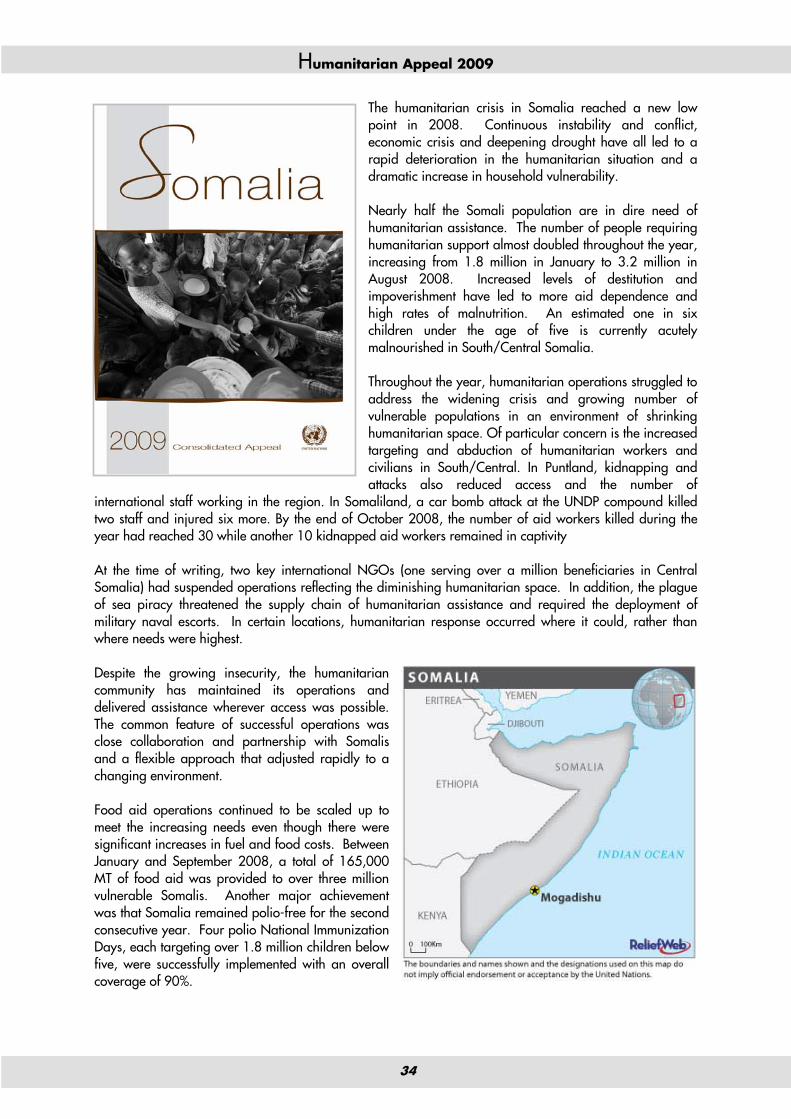
Humanitarian Appeal 2009
34
The humanitarian crisis in Somalia reached a new low point in 2008. Continuous instability and conflict, economic crisis and deepening drought have all led to a rapid deterioration in the humanitarian situation and a dramatic increase in household vulnerability. Nearly half the Somali population are in dire need of humanitarian assistance. The number of people requiring humanitarian support almost doubled throughout the year, increasing from 1.8 million in January to 3.2 million in August 2008. Increased levels of destitution and impoverishment have led to more aid dependence and high rates of malnutrition. An estimated one in six children under the age of five is currently acutely malnourished in South/Central Somalia. Throughout the year, humanitarian operations struggled to address the widening crisis and growing number of vulnerable populations in an environment of shrinking humanitarian space. Of particular concern is the increased targeting and abduction of humanitarian workers and civilians in South/Central. In Puntland, kidnapping and attacks also reduced access and the number of
international staff working in the region. In Somaliland, a car bomb attack at the UNDP compound killed two staff and injured six more. By the end of October 2008, the number of aid workers killed during the year had reached 30 while another 10 kidnapped aid workers remained in captivity At the time of writing, two key international NGOs (one serving over a million beneficiaries in Central Somalia) had suspended operations reflecting the diminishing humanitarian space. In addition, the plague of sea piracy threatened the supply chain of humanitarian assistance and required the deployment of military naval escorts. In certain locations, humanitarian response occurred where it could, rather than where needs were highest. Despite the growing insecurity, the humanitarian community has maintained its operations and delivered assistance wherever access was possible. The common feature of successful operations was close collaboration and partnership with Somalis and a flexible approach that adjusted rapidly to a changing environment. Food aid operations continued to be scaled up to meet the increasing needs even though there were significant increases in fuel and food costs. Between January and September 2008, a total of 165,000 MT of food aid was provided to over three million vulnerable Somalis. Another major achievement was that Somalia remained polio-free for the second consecutive year. Four polio National Immunization Days, each targeting over 1.8 million children below five, were successfully implemented with an overall coverage of 90%.
Somalia

Humanitarian Appeal 2009
35
Under extremely difficult circumstances, the humanitarian community will need to increase the delivery of assistance in 2009. Expanded operations will be centred around four strategic priorities during 2009; saving lives and providing assistance to 3.2 million affected people; delivering an integrated minimum package of basic social services; increasing local capacity to protect sustainable social and economic assets through a disaster risk reduction approach; and strengthening the protective environment of civilians through advocacy, programming, community mobilization and access to services. An innovative approach that will allow aid partners to respond efficiently while working through national partners will form a key part of the humanitarian implementation strategy. The Somalia Inter-Agency Standing Committee (IASC) is therefore discussing a framework of ‘operational flexibility’ in order to increase opportunities to operate in areas that suddenly open up while maintaining interventions in areas where it remains possible to work. Such a strategy will require certain actions such as: improved local contingency planning; a concept of surge capacity; and flexible funding and operating mechanisms. The strategy recognises that ‘operational flexibility’ may have certain implications such as increased costs, including increased security support systems; expanded and strengthened support services such as logistics and air operations; and the possibility of spillage of humanitarian assistance. In order to deliver, strengthened engagement will need to take place in 2009 with stakeholders such as the Diaspora, the private sector and civil society. The aid community will also continue efforts to build the technical capacity of Somali national NGOs who are frequently the main implementers on the ground. The 2009 Consolidated Appeal for Somalia seeks $919 million for 171 NGO and 60 UN projects.
Some basic facts about Somalia Population (millions) 7.9* Infant mortality ratio 90 p/1,000 Children under 5 mortality ratio 145 p/1,000 Maternal mortality ratio 1,400 p/100,000 Life expectancy (years) 47 % of population under-nourished 36%* % of population not using an improved water
source 71% # of internally displaced persons 1.3 million* % of population displaced 16% # refugees in-country (2008) 901* # refugees abroad (2008) 400,000* % living on $1 a day or less - ECHO GNA score 3/3 GNI per capita (USD) - UNDP HDI score and rank (out of 177) -
Contact Mr. Mark Bowden UN Resident Coordinator / Humanitarian Coordinator, Somalia Nairobi Tel: +254 20 425 5201 Email: [email protected]
Cluster 2009 funding requirements
($) Agriculture and livelihoods 65,137,607 Education 29,062,338 Enabling programmes 30,452,841 Food aid 544,263,112 Health 43,830,888 Logistics 25,565,236 NFI and emergency shelter 45,070,082 Nutrition 67,557,955 Protection 32,105,551 Water and sanitation 35,798,939 Total 918,844,549
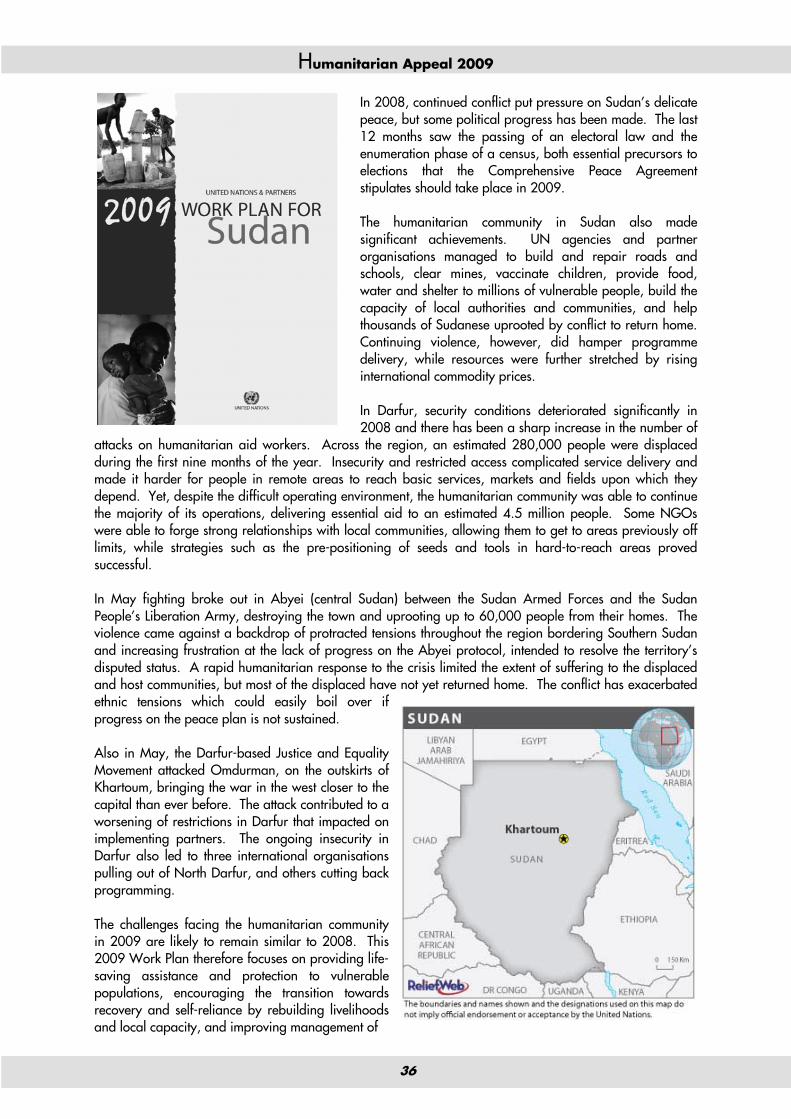
Humanitarian Appeal 2009
36
In 2008, continued conflict put pressure on Sudan’s delicate peace, but some political progress has been made. The last 12 months saw the passing of an electoral law and the enumeration phase of a census, both essential precursors to elections that the Comprehensive Peace Agreement stipulates should take place in 2009. The humanitarian community in Sudan also made significant achievements. UN agencies and partner organisations managed to build and repair roads and schools, clear mines, vaccinate children, provide food, water and shelter to millions of vulnerable people, build the capacity of local authorities and communities, and help thousands of Sudanese uprooted by conflict to return home. Continuing violence, however, did hamper programme delivery, while resources were further stretched by rising international commodity prices. In Darfur, security conditions deteriorated significantly in 2008 and there has been a sharp increase in the number of
attacks on humanitarian aid workers. Across the region, an estimated 280,000 people were displaced during the first nine months of the year. Insecurity and restricted access complicated service delivery and made it harder for people in remote areas to reach basic services, markets and fields upon which they depend. Yet, despite the difficult operating environment, the humanitarian community was able to continue the majority of its operations, delivering essential aid to an estimated 4.5 million people. Some NGOs were able to forge strong relationships with local communities, allowing them to get to areas previously off limits, while strategies such as the pre-positioning of seeds and tools in hard-to-reach areas proved successful. In May fighting broke out in Abyei (central Sudan) between the Sudan Armed Forces and the Sudan People’s Liberation Army, destroying the town and uprooting up to 60,000 people from their homes. The violence came against a backdrop of protracted tensions throughout the region bordering Southern Sudan and increasing frustration at the lack of progress on the Abyei protocol, intended to resolve the territory’s disputed status. A rapid humanitarian response to the crisis limited the extent of suffering to the displaced and host communities, but most of the displaced have not yet returned home. The conflict has exacerbated ethnic tensions which could easily boil over if progress on the peace plan is not sustained. Also in May, the Darfur-based Justice and Equality Movement attacked Omdurman, on the outskirts of Khartoum, bringing the war in the west closer to the capital than ever before. The attack contributed to a worsening of restrictions in Darfur that impacted on implementing partners. The ongoing insecurity in Darfur also led to three international organisations pulling out of North Darfur, and others cutting back programming. The challenges facing the humanitarian community in 2009 are likely to remain similar to 2008. This 2009 Work Plan therefore focuses on providing life-saving assistance and protection to vulnerable populations, encouraging the transition towards recovery and self-reliance by rebuilding livelihoods and local capacity, and improving management of
Sudan

Humanitarian Appeal 2009
37
natural resources. The Work Plan highlights the common goals and planned actions of all implementing partners in 2009 and is the outcome of a five-month planning process. It appeals for $2.2 billion for 611 NGO and 269 UN projects in four cross-cutting areas: Capacity-Building, Environment, Gender and HIV/AIDS. The planned actions of 143 NGOs, 19 UN organisations, and the International Organisation for Migration are included.
Some basic facts about Sudan Population (millions) 37.8 Infant mortality ratio 61 p/1,000 Children under 5 mortality ratio 89 p/1,000 Maternal mortality ratio 450 p/100,000 Life expectancy (years) 56.4 % of population under-nourished 26% % of population not using an improved water source 30% # of internally displaced persons 4,465,000 % of population displaced 11% # refugees in-country (2008) 369,000 # refugees abroad (2008) 683,311 % living on $1 a day or less - ECHO GNA score 3/3 GNI per capita (USD) 960 UNDP HDI score and rank (out of 177) 0.526: 147th (medium)
Contact Ms. Ameerah Haq Deputy Special Representative of the Secretary-General / UN Resident Coordinator / Humanitarian Coordinator, Sudan Khartoum Tel: +249 187 08 6091 Email: [email protected], [email protected]
Sector 2009 funding requirements
($) Basic Infrastructure and Settlement Development
130,074,290
Common Services and Coordination 128,714,905 Cross-sector Support for Return 63,657,160 Education and Culture 208,896,818 Food Security and Livelihoods 978,817,878 Health and Nutrition 267,218,903 Mine Action 92,379,833 NFI and Emergency Shelter 52,296,761 Protection and Human Rights 107,122,127 Water and Sanitation 159,990,367 Total 2,189,169,042
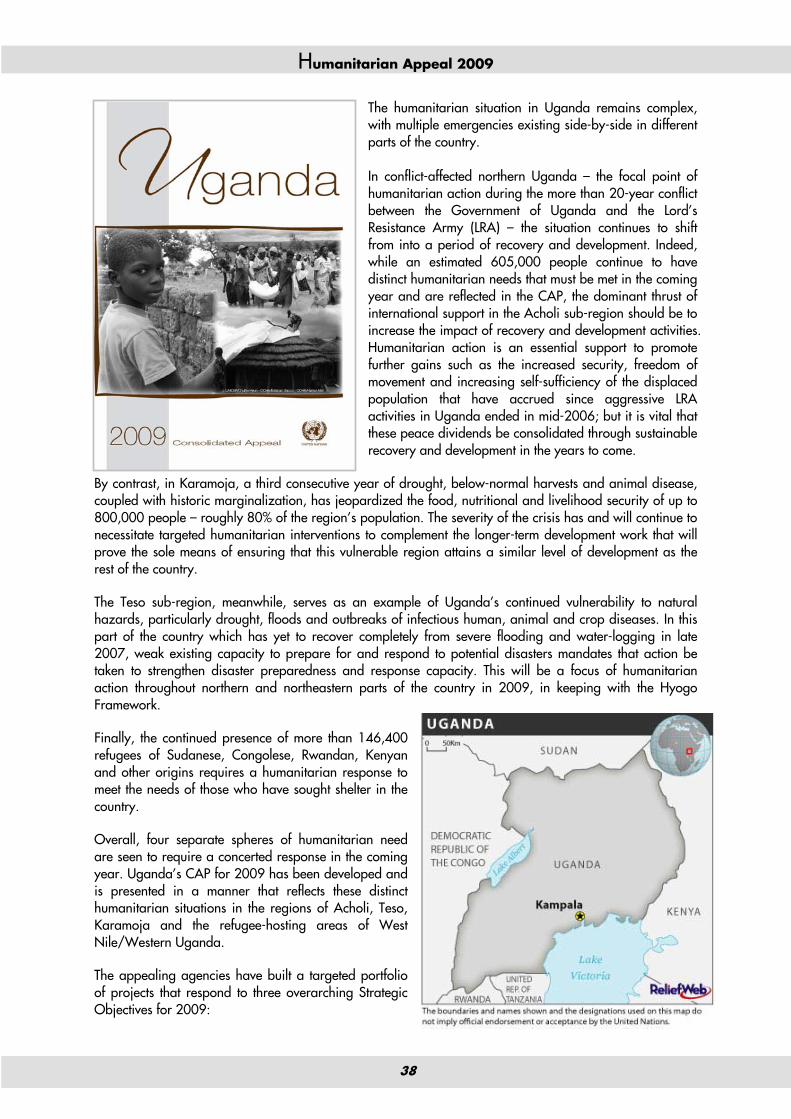
Humanitarian Appeal 2009
38
The humanitarian situation in Uganda remains complex, with multiple emergencies existing side-by-side in different parts of the country. In conflict-affected northern Uganda – the focal point of humanitarian action during the more than 20-year conflict between the Government of Uganda and the Lord’s Resistance Army (LRA) – the situation continues to shift from into a period of recovery and development. Indeed, while an estimated 605,000 people continue to have distinct humanitarian needs that must be met in the coming year and are reflected in the CAP, the dominant thrust of international support in the Acholi sub-region should be to increase the impact of recovery and development activities. Humanitarian action is an essential support to promote further gains such as the increased security, freedom of movement and increasing self-sufficiency of the displaced population that have accrued since aggressive LRA activities in Uganda ended in mid-2006; but it is vital that these peace dividends be consolidated through sustainable recovery and development in the years to come.
By contrast, in Karamoja, a third consecutive year of drought, below-normal harvests and animal disease, coupled with historic marginalization, has jeopardized the food, nutritional and livelihood security of up to 800,000 people – roughly 80% of the region’s population. The severity of the crisis has and will continue to necessitate targeted humanitarian interventions to complement the longer-term development work that will prove the sole means of ensuring that this vulnerable region attains a similar level of development as the rest of the country.
The Teso sub-region, meanwhile, serves as an example of Uganda’s continued vulnerability to natural hazards, particularly drought, floods and outbreaks of infectious human, animal and crop diseases. In this part of the country which has yet to recover completely from severe flooding and water-logging in late 2007, weak existing capacity to prepare for and respond to potential disasters mandates that action be taken to strengthen disaster preparedness and response capacity. This will be a focus of humanitarian action throughout northern and northeastern parts of the country in 2009, in keeping with the Hyogo Framework.
Finally, the continued presence of more than 146,400 refugees of Sudanese, Congolese, Rwandan, Kenyan and other origins requires a humanitarian response to meet the needs of those who have sought shelter in the country.
Overall, four separate spheres of humanitarian need are seen to require a concerted response in the coming year. Uganda’s CAP for 2009 has been developed and is presented in a manner that reflects these distinct humanitarian situations in the regions of Acholi, Teso, Karamoja and the refugee-hosting areas of West Nile/Western Uganda.
The appealing agencies have built a targeted portfolio of projects that respond to three overarching Strategic Objectives for 2009:

Humanitarian Appeal 2009
39
1) To supplement government efforts to provide basic services that save lives and alleviate suffering;
2) To enhance food and nutritional security; and
3) To contribute to the strengthening of district capacity for emergency preparedness and response.
All three of these strategic objectives are operational in each of the regions of humanitarian operation, although the prioritisation of projects that aim to achieve them varies according to the relative weighting of the objectives according to region. In tandem with the forthcoming Peace-Building and Recovery Support Strategy being developed by the UN and partners, the CAP 2009 should be viewed as a pledge of support to the Government’s Peace, Recovery and Development Plan (PRDP) for Northern Uganda.
This Appeal requests a total of $225 million for 53 NGOs and 11 United Nations organisations in order to meet the most urgent humanitarian needs of approximately 1.6 million vulnerable individuals across four regions.
Some basic facts about Uganda Population (millions) 29.6* Infant mortality ratio 78 p/1,000 Children under 5 mortality ratio 137 p/1,000* Maternal mortality ratio 435 p/100,000* Life expectancy (years) 50.4* % of population under-nourished 19% % of population not using an improved water source 33%* # of internally displaced persons 921,000* % of population displaced 3% # refugees in-country (2008) 146,400* # refugees abroad (2008) 21,752 % living on $1 a day or less 31%* ECHO GNA score 3/3 GNI per capita (USD) 340 UNDP HDI score and rank (out of 177) 0.505: 154th (medium)
Contact: Mr. Theophane Nikyema UN Resident Coordinator / Humanitarian Coordinator, Uganda Kampala Tel: +256 41 34 52 90 Email: [email protected]
Cluster 2009 funding requirements
($) Coordination and Support Services 8,061,093 Education 3,887,366 Food Security and Agricultural Livelihoods 121,129,774 Health, Nutrition and HIV/AIDS 23,089,753 Multi-Sector (Refugee Programme) 20,343,260 Protection 28,403,741 Water, Sanitation and Hygiene 20,373,112 Total 225,288,099
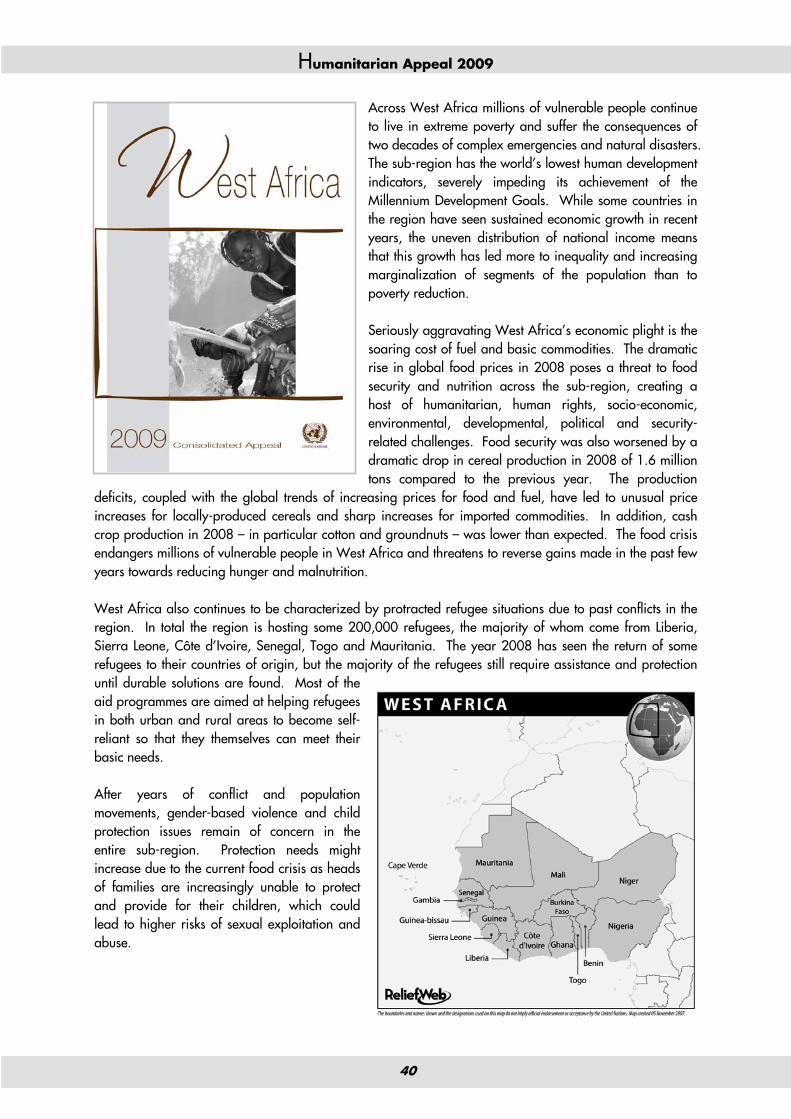
Humanitarian Appeal 2009
40
Across West Africa millions of vulnerable people continue to live in extreme poverty and suffer the consequences of two decades of complex emergencies and natural disasters. The sub-region has the world’s lowest human development indicators, severely impeding its achievement of the Millennium Development Goals. While some countries in the region have seen sustained economic growth in recent years, the uneven distribution of national income means that this growth has led more to inequality and increasing marginalization of segments of the population than to poverty reduction. Seriously aggravating West Africa’s economic plight is the soaring cost of fuel and basic commodities. The dramatic rise in global food prices in 2008 poses a threat to food security and nutrition across the sub-region, creating a host of humanitarian, human rights, socio-economic, environmental, developmental, political and security-related challenges. Food security was also worsened by a dramatic drop in cereal production in 2008 of 1.6 million tons compared to the previous year. The production
deficits, coupled with the global trends of increasing prices for food and fuel, have led to unusual price increases for locally-produced cereals and sharp increases for imported commodities. In addition, cash crop production in 2008 – in particular cotton and groundnuts – was lower than expected. The food crisis endangers millions of vulnerable people in West Africa and threatens to reverse gains made in the past few years towards reducing hunger and malnutrition. West Africa also continues to be characterized by protracted refugee situations due to past conflicts in the region. In total the region is hosting some 200,000 refugees, the majority of whom come from Liberia, Sierra Leone, Côte d’Ivoire, Senegal, Togo and Mauritania. The year 2008 has seen the return of some refugees to their countries of origin, but the majority of the refugees still require assistance and protection until durable solutions are found. Most of the aid programmes are aimed at helping refugees in both urban and rural areas to become self-reliant so that they themselves can meet their basic needs. After years of conflict and population movements, gender-based violence and child protection issues remain of concern in the entire sub-region. Protection needs might increase due to the current food crisis as heads of families are increasingly unable to protect and provide for their children, which could lead to higher risks of sexual exploitation and abuse.

Humanitarian Appeal 2009
41
The 2009 West Africa CAP focuses on the consequences of the food crisis in five priority areas for humanitarian action: Food Security and Nutrition; Health; Protection and Population Movements; Water, Sanitation and Hygiene; and Coordination / Information management / Support services. Communication, information-sharing and cross-sector analysis are considered to be crucial to achieve a coherent and coordinated response. The appeal includes 86 projects and requests a total of $361million.
Sector 2009 funding requirements ($)
Coordination / information management and support services
49,338,969
Food security and nutrition 220,596,203 Health 15,663,789 Protection 62,191,033 Water, sanitation and hygiene 13,250,480 Total 361,040,474
Contact Mr. Hervé Ludovic de Lys Head of OCHA Regional Office for West Africa Dakar, Senegal Tel.: +221 338 698 501 E-mail: [email protected]

Humanitarian Appeal 2009
42
In 2008, the situation in Zimbabwe continued its downward spiral. The year was marked by political turmoil and further economic decline. March presidential elections were generally peaceful, but the June run-off was marred by widespread attacks on opposition supporters by security forces. A power-sharing agreement on 15 September spurred hopes of a quick economic recovery, but at the time of writing negotiations over forming a unity government are still at an impasse. Throughout the year, national agricultural production declined sharply due to a combination of adverse weather, lack of timely supply of inputs such as seeds and fertilizer, deteriorating infrastructure, unprofitable prices offered to farmers by the Grain Management Board for most crops, and severe economic constraints. Chronic malnutrition has become a major concern: 28.9% of children under five are chronically malnourished and more than 21 districts have stunting levels above 30%. The economy has also taken a dramatic turn for the worse with a staggering inflation rate, which exploded from 11.2
million to 231 million percent in the month from June to July 2008, eroding any remaining purchasing power and exposing already vulnerable groups to further economic hardships. Basic social services are on the brink of total collapse. The health service is marked by critical shortages of essential drugs and a lack of skilled and experienced personnel. Education infrastructure has also gradually deteriorated with declining enrolment and pupil retention rates at the early child development level, low transition rates to secondary education, and a shortage of educational and teaching materials and equipment. Currently monthly teacher salaries average less than $4, forcing teachers to seek other sources of income to supplement their wages. Public schools have closed down, while private schools are charging fees to parents who can still pay them. The economic decline, combined with the unpredictable policy environment, has created significant operational challenges for and increased expenditures by humanitarian actors, particularly relating to procurement of supplies, payment of duties for imports, modalities for payment of salaries, access to food for staff, fuel shortages, and management of foreign exchange. In addition, the general climate of mistrust between humanitarian actors and the authorities at all levels has led to a highly polarized environment aggravated by a suspension of most humanitarian activities against a background of politically-motivated violence.

Humanitarian Appeal 2009
43
The 2009 CAP focuses on three strategic priorities: saving lives and preventing loss of life; addressing displacements, restoring livelihoods and preventing depletion of productive assets; and establishing a broader partnership among the humanitarian community and engaging with all stakeholders including the government. Humanitarian agencies will work together to provide life-saving assistance and protection to vulnerable populations, strengthen basic service delivery in health, water and sanitation, provide an integrated response package to assist people living with HIV/AIDS, and advocate for enhanced respect for human rights. The UN and NGOs also aim to scale up vulnerability assessments, and enhance coordination. This 2009 Appeal requests a total of $550 million for 51 NGO and 62 UN projects.
Some basic facts about Zimbabwe Population (millions) 12.2* Infant mortality ratio 68 p/1,000 Children under 5 mortality ratio 85 p/1,000* Maternal mortality ratio 555 p/100,000* Life expectancy (years) 41.7* % of population under-nourished 47% % of population not using an improved water source 40%* # of internally displaced persons unknown % of population displaced 4.30% # refugees in-country (2008) 5,054* # refugees abroad (2008) 12,782 % living on $1 a day or less 56.1 ECHO GNA score 3/3 GNI per capita (USD) - UNDP HDI score and rank (out of 177) 0.513: 151st (low)
Contact Mr. Agostinho Zacarias UN Resident Coordinator / Humanitarian Coordinator, Zimbabwe Harare Tel: +263 4 792 687 Email: [email protected]
Cluster 2009 funding requirements
($) Agriculture 58,633,789 Coordination 9,179,467 Early recovery / livelihoods 11,678,328 Education 29,665,400 Food 319,620,314 Health 45,432,226 Multi-sector 30,935,735 Nutrition 10,277,040 Protection 12,326,038 Water, sanitation and hygiene 21,931,780 Total 549,680,117
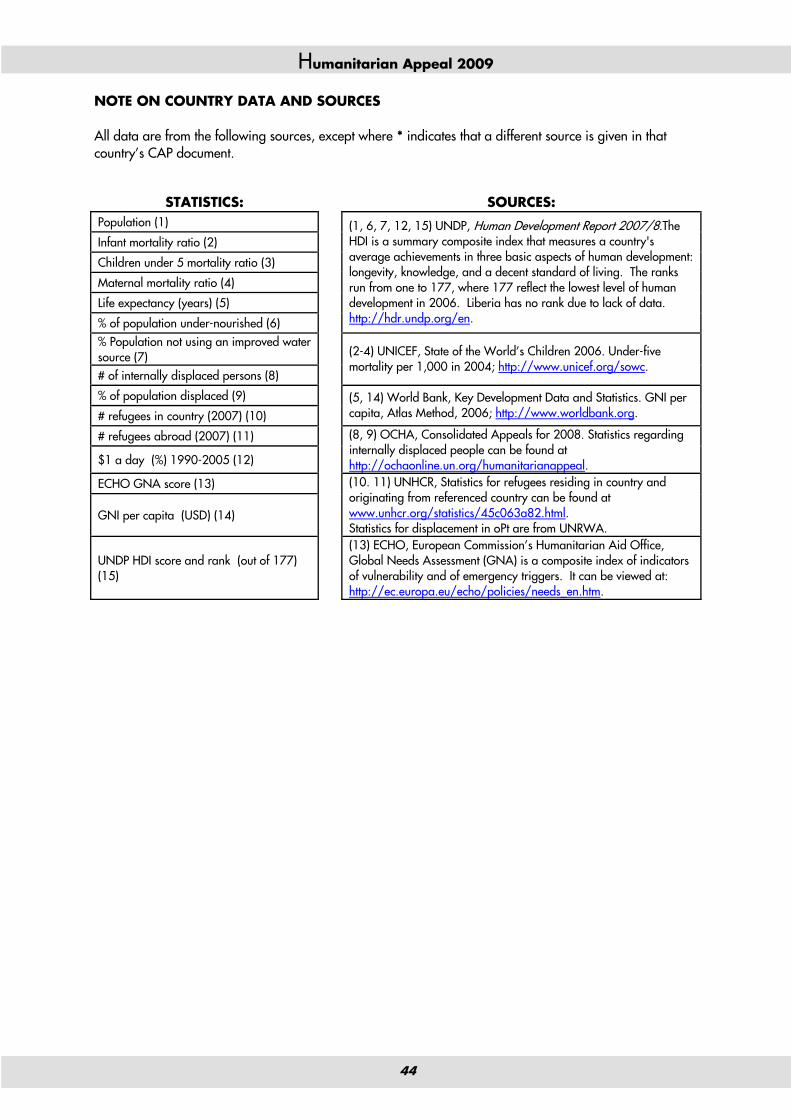
Humanitarian Appeal 2009
44
NOTE ON COUNTRY DATA AND SOURCES All data are from the following sources, except where * indicates that a different source is given in that country’s CAP document.
STATISTICS: SOURCES: Population (1)
Infant mortality ratio (2)
Children under 5 mortality ratio (3)
Maternal mortality ratio (4)
Life expectancy (years) (5)
% of population under-nourished (6)
(1, 6, 7, 12, 15) UNDP, Human Development Report 2007/8.The HDI is a summary composite index that measures a country's average achievements in three basic aspects of human development: longevity, knowledge, and a decent standard of living. The ranks run from one to 177, where 177 reflect the lowest level of human development in 2006. Liberia has no rank due to lack of data. http://hdr.undp.org/en.
% Population not using an improved water source (7)
# of internally displaced persons (8)
(2-4) UNICEF, State of the World’s Children 2006. Under-five mortality per 1,000 in 2004; http://www.unicef.org/sowc.
% of population displaced (9)
# refugees in country (2007) (10) (5, 14) World Bank, Key Development Data and Statistics. GNI per capita, Atlas Method, 2006; http://www.worldbank.org.
# refugees abroad (2007) (11)
$1 a day (%) 1990-2005 (12)
(8, 9) OCHA, Consolidated Appeals for 2008. Statistics regarding internally displaced people can be found at http://ochaonline.un.org/humanitarianappeal.
ECHO GNA score (13)
GNI per capita (USD) (14)
(10. 11) UNHCR, Statistics for refugees residing in country and originating from referenced country can be found at www.unhcr.org/statistics/45c063a82.html. Statistics for displacement in oPt are from UNRWA.
UNDP HDI score and rank (out of 177) (15)
(13) ECHO, European Commission’s Humanitarian Aid Office, Global Needs Assessment (GNA) is a composite index of indicators of vulnerability and of emergency triggers. It can be viewed at: http://ec.europa.eu/echo/policies/needs_en.htm.
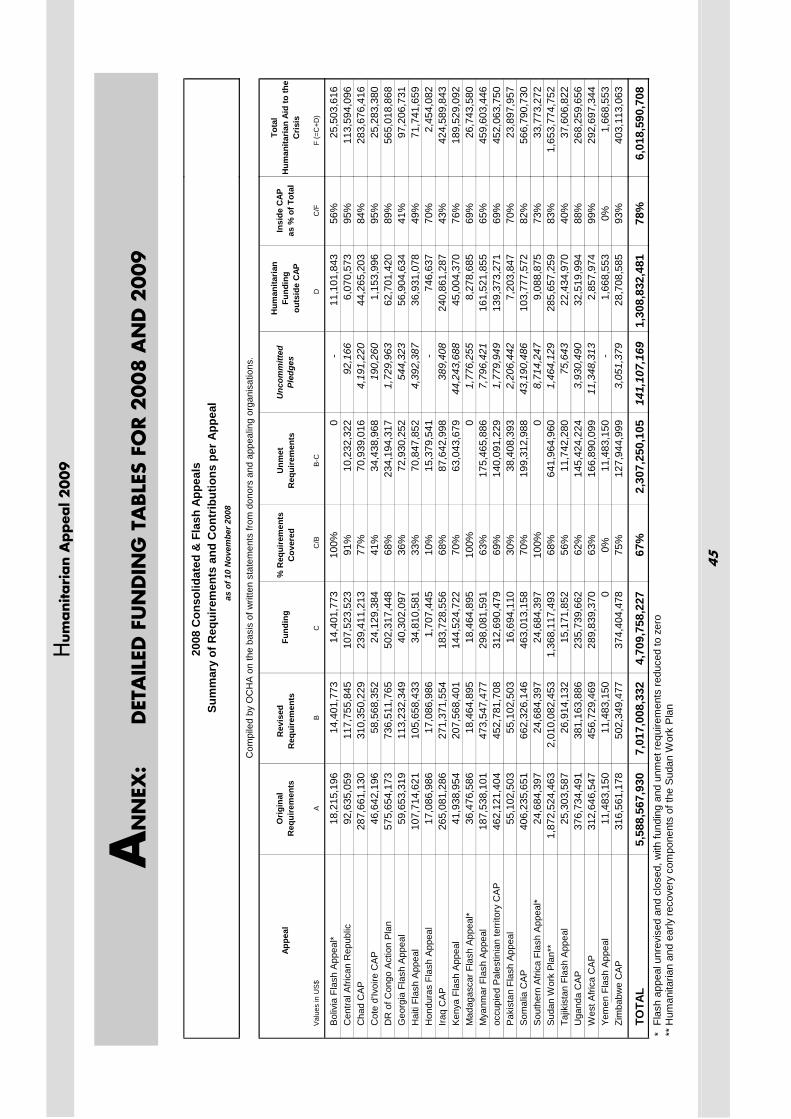
Hum
anitari
an A
ppea
l 2009
45
AN
NEX
: D
ETA
ILED
FU
ND
ING
TA
BLE
S FO
R 2
00
8 A
ND
20
09
20
08 C
onso
lidat
ed &
Fla
sh A
ppea
ls
Sum
mar
y of
Req
uire
men
ts a
nd C
ontr
ibut
ions
per
App
eal
as o
f 10
Nov
embe
r 200
8
Com
pile
d by
OC
HA
on
the
basi
s of
writ
ten
stat
emen
ts fr
om d
onor
s an
d ap
peal
ing
orga
nisa
tions
.
Rev
ised
Req
uire
men
ts%
Req
uire
men
ts
Cov
ered
Unm
et
Req
uire
men
ts
Val
ues
in U
S$
AB
C
C/B
B-C
DC
/F
Bol
ivia
Fla
sh A
ppea
l*18
,215
,196
14,4
01,7
7314
,401
,773
100%
0-
11,1
01,8
4356
%C
entra
l Afri
can
Rep
ublic
92,6
35,0
5911
7,75
5,84
510
7,52
3,52
391
%10
,232
,322
92,1
66
6,
070,
573
95%
Cha
d C
AP
287,
661,
130
310,
350,
229
239,
411,
213
77%
70,9
39,0
164,
191,
220
44,2
65,2
0384
%C
ote
d'Iv
oire
CA
P46
,642
,196
58,5
68,3
5224
,129
,384
41%
34,4
38,9
6819
0,26
0
1,15
3,99
695
%D
R o
f Con
go A
ctio
n P
lan
575,
654,
173
736,
511,
765
502,
317,
448
68%
234,
194,
317
1,72
9,96
3
62
,701
,420
89%
Geo
rgia
Fla
sh A
ppea
l59
,653
,319
113,
232,
349
40,3
02,0
9736
%72
,930
,252
544,
323
56
,904
,634
41%
Hai
ti Fl
ash
App
eal
107,
714,
621
105,
658,
433
34,8
10,5
8133
%70
,847
,852
4,39
2,38
7
36
,931
,078
49%
Hon
dura
s Fl
ash
App
eal
17,0
86,9
8617
,086
,986
1,70
7,44
510
%15
,379
,541
-
74
6,63
770
%Ira
q C
AP
265,
081,
286
271,
371,
554
183,
728,
556
68%
87,6
42,9
9838
9,40
8
240,
861,
287
43%
Ken
ya F
lash
App
eal
41,9
38,9
5420
7,56
8,40
114
4,52
4,72
270
%63
,043
,679
44,2
43,6
88
45
,004
,370
76%
Mad
agas
car F
lash
App
eal*
36,4
76,5
8618
,464
,895
18,4
64,8
9510
0%0
1,77
6,25
5
8,
278,
685
69%
Mya
nmar
Fla
sh A
ppea
l18
7,53
8,10
147
3,54
7,47
729
8,08
1,59
163
%17
5,46
5,88
67,
796,
421
161,
521,
855
65%
occu
pied
Pal
estin
ian
terr
itory
CA
P46
2,12
1,40
445
2,78
1,70
831
2,69
0,47
969
%14
0,09
1,22
91,
779,
949
139,
373,
271
69%
Pak
ista
n Fl
ash
App
eal
55,1
02,5
0355
,102
,503
16,6
94,1
1030
%38
,408
,393
2,20
6,44
2
7,
203,
847
70%
Som
alia
CA
P40
6,23
5,65
166
2,32
6,14
646
3,01
3,15
870
%19
9,31
2,98
843
,190
,486
103,
777,
572
82%
Sou
ther
n A
frica
Fla
sh A
ppea
l*24
,684
,397
24,6
84,3
9724
,684
,397
100%
08,
714,
247
9,08
8,87
573
%S
udan
Wor
k P
lan*
*1,
872,
524,
463
2,01
0,08
2,45
31,
368,
117,
493
68%
641,
964,
960
1,46
4,12
9
28
5,65
7,25
983
%Ta
jikis
tan
Flas
h A
ppea
l25
,303
,587
26,9
14,1
3215
,171
,852
56%
11,7
42,2
8075
,643
22,4
34,9
7040
%U
gand
a C
AP
376,
734,
491
381,
163,
886
235,
739,
662
62%
145,
424,
224
3,93
0,49
0
32
,519
,994
88%
Wes
t Afri
ca C
AP
312,
646,
547
456,
729,
469
289,
839,
370
63%
166,
890,
099
11,3
48,3
13
2,
857,
974
99%
Yem
en F
lash
App
eal
11,4
83,1
5011
,483
,150
00%
11,4
83,1
50-
1,66
8,55
30%
Zim
babw
e C
AP
316,
561,
178
502,
349,
477
374,
404,
478
75%
127,
944,
999
3,05
1,37
9
28
,708
,585
93%
TOTA
L5,
588,
567,
930
7,01
7,00
8,33
24,
709,
758,
227
67%
2,30
7,25
0,10
514
1,10
7,16
91,
308,
832,
481
78%
*Fl
ash
appe
al u
nrev
ised
and
clo
sed,
with
fund
ing
and
unm
et re
quire
men
ts re
duce
d to
zer
o**
Hum
anita
rian
and
early
reco
very
com
pone
nts
of th
e S
udan
Wor
k P
lan
Orig
inal
R
equi
rem
ents
Fund
ing
Appe
alU
ncom
mitt
ed
Pled
ges
Hum
anita
rian
Fund
ing
outs
ide
CAP
Insi
de C
AP
as %
of T
otal
F (=
C+D
)
25,5
03,6
1611
3,59
4,09
628
3,67
6,41
625
,283
,380
565,
018,
868
97,2
06,7
3171
,741
,659
2,45
4,08
242
4,58
9,84
318
9,52
9,09
226
,743
,580
459,
603,
446
452,
063,
750
23,8
97,9
5756
6,79
0,73
033
,773
,272
1,65
3,77
4,75
237
,606
,822
268,
259,
656
292,
697,
344
1,66
8,55
340
3,11
3,06
3
6,01
8,59
0,70
8
Tota
l H
uman
itaria
n Ai
d to
the
Cris
is
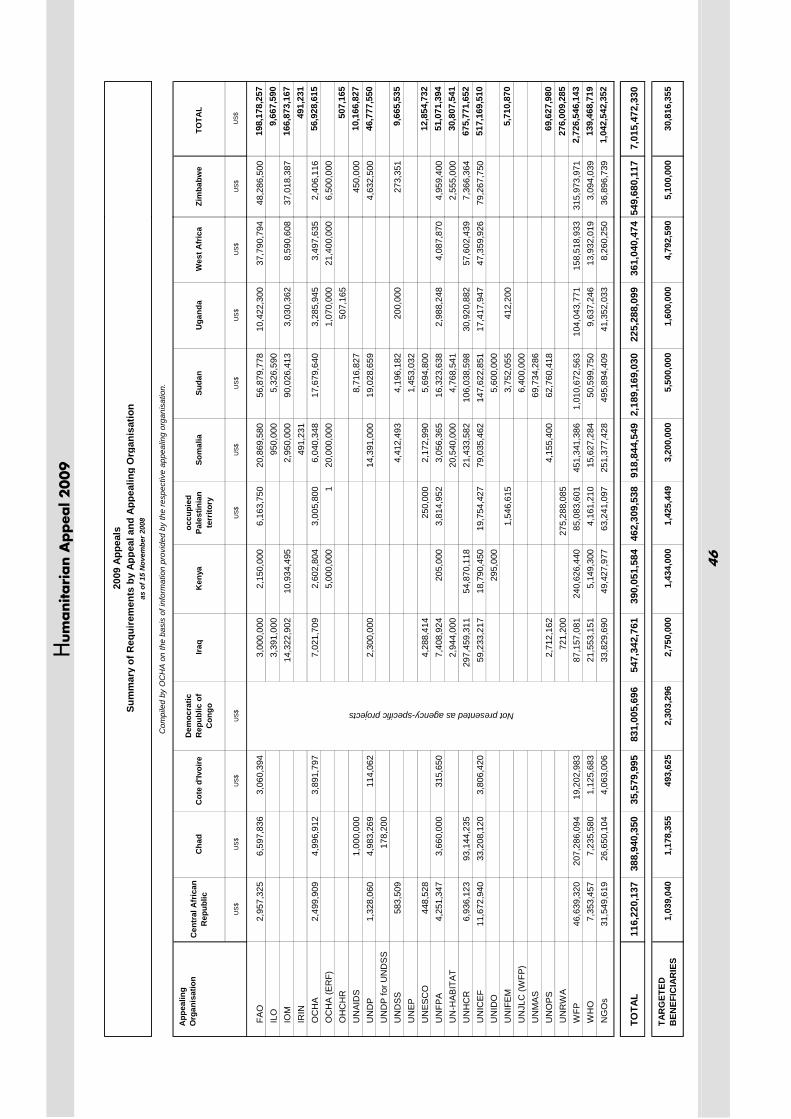
Hum
anitari
an A
ppea
l 2009
46
2009
App
eals
Sum
mar
y of
Req
uire
men
ts b
y Ap
peal
and
App
ealin
g O
rgan
isat
ion
as o
f 15
Nov
embe
r 200
8
Com
pile
d by
OC
HA
on
the
basi
s of
info
rmat
ion
prov
ided
by
the
resp
ectiv
e ap
peal
ing
orga
nisa
tion.
Cen
tral
Afr
ican
R
epub
lic
Cha
d C
ote
d'Iv
oire
D
emoc
ratic
R
epub
lic o
f C
ongo
Iraq
Ken
yaoc
cupi
ed
Pale
stin
ian
terr
itory
So
mal
ia
Suda
nU
gand
a W
est A
fric
a
US
$U
S$
US
$U
S$
US
$U
S$
US
$U
S$
US
$
FAO
2,95
7,32
5
6,59
7,83
6
3,06
0,39
4
3,
000,
000
2,
150,
000
6,
163,
750
20,8
69,5
80
56
,879
,778
10
,422
,300
37,7
90,7
94
IL
O3,
391,
000
95
0,00
0
5,
326,
590
IO
M14
,322
,902
10
,934
,495
2,
950,
000
90
,026
,413
3,
030,
362
8,
590,
608
IR
IN49
1,23
1
O
CH
A2,
499,
909
4,
996,
912
3,
891,
797
7,02
1,70
9
2,60
2,80
4
3,00
5,80
0
6,
040,
348
17
,679
,640
3,
285,
945
3,
497,
635
O
CH
A (E
RF)
5,00
0,00
0
1
20,0
00,0
00
1,
070,
000
21
,400
,000
OH
CH
R50
7,16
5
U
NAI
DS
1,00
0,00
0
8,71
6,82
7
UN
DP
1,32
8,06
0
4,98
3,26
9
114,
062
2,
300,
000
14
,391
,000
19,0
28,6
59
UN
DP
for U
ND
SS
178,
200
UN
DS
S58
3,50
9
4,
412,
493
4,
196,
182
20
0,00
0
U
NEP
1,45
3,03
2
UN
ESC
O44
8,52
8
4,
288,
414
25
0,00
0
2,17
2,99
0
5,69
4,80
0
UN
FPA
4,25
1,34
7
3,66
0,00
0
315,
650
7,
408,
924
20
5,00
0
3,
814,
952
3,05
6,36
5
16,3
23,6
38
2,98
8,24
8
4,08
7,87
0
UN
-HA
BIT
AT
2,94
4,00
0
20,5
40,0
00
4,
768,
541
U
NH
CR
6,93
6,12
3
93,1
44,2
35
29
7,45
9,31
1
54
,870
,118
21
,433
,582
106,
038,
598
30,9
20,8
82
57
,602
,439
UN
ICE
F11
,672
,940
33,2
08,1
20
3,
806,
420
59,2
33,2
17
18,7
90,4
50
19,7
54,4
27
79
,035
,462
147,
622,
851
17,4
17,9
47
47
,359
,926
UN
IDO
295,
000
5,60
0,00
0
UN
IFE
M1,
546,
615
3,75
2,05
5
412,
200
UN
JLC
(WFP
)6,
400,
000
U
NM
AS
69,7
34,2
86
UN
OP
S2,
712,
162
4,
155,
400
62
,760
,418
U
NR
WA
721,
200
275,
288,
085
W
FP46
,639
,320
207,
286,
094
19,2
02,9
83
87
,157
,081
24
0,62
6,44
0
85
,083
,601
451,
341,
386
1,
010,
672,
563
10
4,04
3,77
1
15
8,51
8,93
3
W
HO
7,35
3,45
7
7,23
5,58
0
1,12
5,68
3
21
,553
,151
5,
149,
300
4,
161,
210
15,6
27,2
84
50
,599
,750
9,
637,
246
13
,932
,019
NG
Os
31,5
49,6
19
26
,650
,104
4,06
3,00
6
33
,829
,690
49
,427
,977
63
,241
,097
251,
377,
428
49
5,89
4,40
9
41
,352
,033
8,26
0,25
0
TOTA
L11
6,22
0,13
7 38
8,94
0,35
0 35
,579
,995
83
1,00
5,69
6
547,
342,
761
390,
051,
584
462,
309,
538
918,
844,
549
2,18
9,16
9,03
0 22
5,28
8,09
9 36
1,04
0,47
4
1,03
9,04
0 1,
178,
355
493,
625
2,30
3,29
6 2,
750,
000
1,43
4,00
0 1,
425,
449
3,20
0,00
0 5,
500,
000
1,60
0,00
0 4,
792,
590
App
ealin
g O
rgan
isat
ion
TAR
GET
ED
BEN
EFIC
IAR
IES
Not presented as agency-specific projects
Zim
babw
e TO
TAL
US
$
48,2
86,5
00
19
8,17
8,25
79,
667,
590
37,0
18,3
87
16
6,87
3,16
749
1,23
12,
406,
116
56,9
28,6
156,
500,
000
507,
165
450,
000
10
,166
,827
4,63
2,50
0
46
,777
,550
273,
351
9,
665,
535
12,8
54,7
324,
959,
400
51,0
71,3
942,
555,
000
30,8
07,5
417,
366,
364
675,
771,
652
79,2
67,7
50
51
7,16
9,51
0
5,71
0,87
0
69,6
27,9
8027
6,00
9,28
531
5,97
3,97
1
2,72
6,54
6,14
33,
094,
039
139,
468,
719
36,8
96,7
39
1,
042,
542,
352
549,
680,
117
7,01
5,47
2,33
0
5,10
0,00
0 30
,816
,355
US
$
Hum
anitari
an A
ppea
l 2009
47
Consolidated Appeal Process (CAP)
The CAP is a tool for aid organisations to jointly plan, coordinate, implement and monitor their response to disasters and emergencies, and to appeal for funds together instead of competitively. It is the forum for developing a strategic approach to humanitarian action, focusing on close cooperation between host governments, donors, non-governmental organisations (NGOs), the International Red Cross and Red Crescent Movement, International Organization for Migration (IOM), and United Nations agencies. As such, it presents a snapshot of the situation and response plans, and is an inclusive and coordinated programme cycle of: • Strategic planning leading to a Common Humanitarian Action Plan (CHAP); • Resource mobilisation leading to a Consolidated Appeal or a Flash Appeal; • Coordinated programme implementation; • Joint monitoring and evaluation; • Revision, if necessary; • Reporting on results. The CHAP is the core of the CAP – a strategic plan for humanitarian response in a given country or region, including the following elements: • A common analysis of the context in which humanitarian action takes place; • An assessment of needs; • Best, worst, and most likely scenarios; • A clear statement of longer-term objectives and goals; • Prioritised response plans, including a detailed mapping of projects to cover all needs; • A framework for monitoring the strategy and revising it if necessary. The CHAP is the core of a Consolidated Appeal or, when crises break out or natural disasters strike, a Flash Appeal. Under the leadership of the Humanitarian Coordinator, and in consultation with host Governments and donors, the CHAP is developed at the field level by the Humanitarian Country Team. This team includes IASC members and standing invitees (UN agencies, the International Organization for Migration, the International Red Cross and Red Crescent Movement, and NGOs that belong to ICVA, Interaction, or SCHR), but non-IASC members, such as national NGOs, can also be included. The Humanitarian Coordinator is responsible for the annual preparation of the consolidated appeal document. The document is launched globally near the end of each year to enhance advocacy and resource mobilisation. An update, known as the Mid-Year Review, is presented to donors the following July. Donors generally fund appealing agencies directly in response to project proposals listed in appeals. The Financial Tracking Service (FTS), managed by the United Nations Office for the Coordination of Humanitarian Affairs (OCHA), is a database of appeal funding needs and worldwide donor contributions, and can be found on www.reliefweb.int/fts. In sum, the CAP is how aid agencies join forces to provide people in need the best available protection and assistance, on time.

OFFICE FOR THE COORDINATION OF HUMANITARIAN AFFAIRS (OCHA) PALAIS DES NATIONS TEL: (41 22) 917.1636 8-14 AVENUE DE LA PAIX E-MAIL: [email protected] CH – 1211 Geneva HTTP://WWW.HUMANITARIANAPPEAL.NET