
Some Further Evidence on the Behaviour of Stock Returns · PDF file0 3 5 $ Munich Personal...
21
Munich Personal RePEc Archive Some Further Evidence on the Behaviour of Stock Returns in India Gourishankar S Hiremath and Kamaiah Bandi University of Hyderabad, Hyderabad 2010 Online at https://mpra.ub.uni-muenchen.de/48518/ MPRA Paper No. 48518, posted 24 July 2013 07:51 UTC
Transcript of Some Further Evidence on the Behaviour of Stock Returns · PDF file0 3 5 $ Munich Personal...

MPRAMunich Personal RePEc Archive
Some Further Evidence on the Behaviourof Stock Returns in India
Gourishankar S Hiremath and Kamaiah Bandi
University of Hyderabad, Hyderabad
2010
Online at https://mpra.ub.uni-muenchen.de/48518/MPRA Paper No. 48518, posted 24 July 2013 07:51 UTC

International Journal of Economics and Finance Vol. 2, No. 2; May 2010
International Journal of Economics and Finance Vol. 2, No. 2; May 2010
Some Further Evidence on the Behaviour of Stock Returns in India
Gourishankar S Hiremath
Department of Economics
University of Hyderabad, Hyderabad – 500 046
Andra Pradesh, India
Emial: [email protected]
Bandi Kamaiah
Department of Economics
University of Hyderabad, Hyderabad – 500 046
Andra Pradesh, India

International Journal of Economics and Finance Vol. 2, No. 2; May 2010
Some Further Evidence on the Behaviour of Stock Returns in India
Abstract
This paper examines the stock return behaviour in two premier Indian stock markets using Chow-Denning
multiple variance ratio and Hinich bicorrelation tests. The former test overcomes size distortion of conventional
variance ratio test. The latter test is capable of detecting linear and non-linear dependencies. The study is based on
14 indices relating to the Bombay Stock Exchange (BSE) and the National Stock Exchange (NSE), and relates to the
period 02/06/1997 to 30/01/2009. The Chow-Denning test rejects the null of random walk for six indices. The
Hinich test rejects the null of pure white noise for full sample period. However, the windowed test results of Hinich
show that the serial dependencies are not consistent across the sample period for all indices. This indicates presence
of episodic dependencies in stock returns surrounded by long periods of pure noise.
Keywords: random walk, serial dependence variance ratios, bi-correlation, , episodic dependencies, non-linearity,
mean-reversion, pure noise.

International Journal of Economics and Finance Vol. 2, No. 2; May 2010
1. Introduction
The behaviour of stock returns has been extensively debated over the years. Researchers have examined
the efficient market and random walk characterization of returns and alternatives to random walk. The validation of
random walk implies that market is informationally efficient. In an efficient market, current prices ‘fully reflect’
available information and hence there is no scope for any investor to make abnormal profits (Fama, 1970). In
respect of empirical evidences, the early studies have found evidences in favour of random walk hypothesis (RWH).
In later period, however, studies have supported mean reversion in returns. The Fama’s model is criticized for its
assumption that market participants arrive at a rational expectations forecast. It is argued that trade demands
heterogeneity (bull and bear traders) and therefore returns can be predicted. In other words, psychological and
behavioral elements in stock price determination help to predict the future prices. Further, in contrast to Fama’s
model, Campbell et al (1997) states that asset returns are predictable to some degree. Consensus on this issue thus
continues to be elusive. It has been pointed out that the use of several tests, parametric and non-parametric, each of
which having been based on restrictive assumptions, has been a prime reason for lack of consensus. Further, the use
of data of different frequencies has also been another reason for divergent findings.
The conventional tests such as auto correlation, runs, spectral and variance ratio tests have some
limitations. They are capable of detecting only linear correlation in the series. The Great Market Crash of 1987
triggered interest in non-linear dependencies in the return series. Since then researchers have addressed the issue of
presence of non-linear dependencies. It may be pertinent to note that rejection of presence of linear correlation does
not validate EMH as non- linear dependencies might help to predict the future prices (Granger and Anderson (1978).
The issue of non-linear dependence in the series has been examined by Hinich and Patterson (1995). Following the
framework of Hinich-Patterson, the portmanteau bi-correlation test is employed in this study to examine the issue of
non-linear dependencies. Such a study has not been undertaken in the Indian context. Another important issue
while testing the random walk hypothesis concerns the issue of size distortions in Lo-MacKinlay variance ratio test.
Chow and Denning (1993) points that the sequential procedure of Lo-MacKinlay test leads to size distortion.
Hence, they suggest multiple variance ratios test. Keeping the caveat in mind, the present study employed Chow-
Denning multiple variance ratios test to overcome size distortion problem of individual variance ratio test. With a
view to arrive at a more accurate idea about the behaviour of stock returns, the present study seeks to generate
evidences by employing the Chow-Denning multiple variance ratios and bi-correlation tests.
International Journal of Economics and Finance Vol. 2, No. 2; May 2010
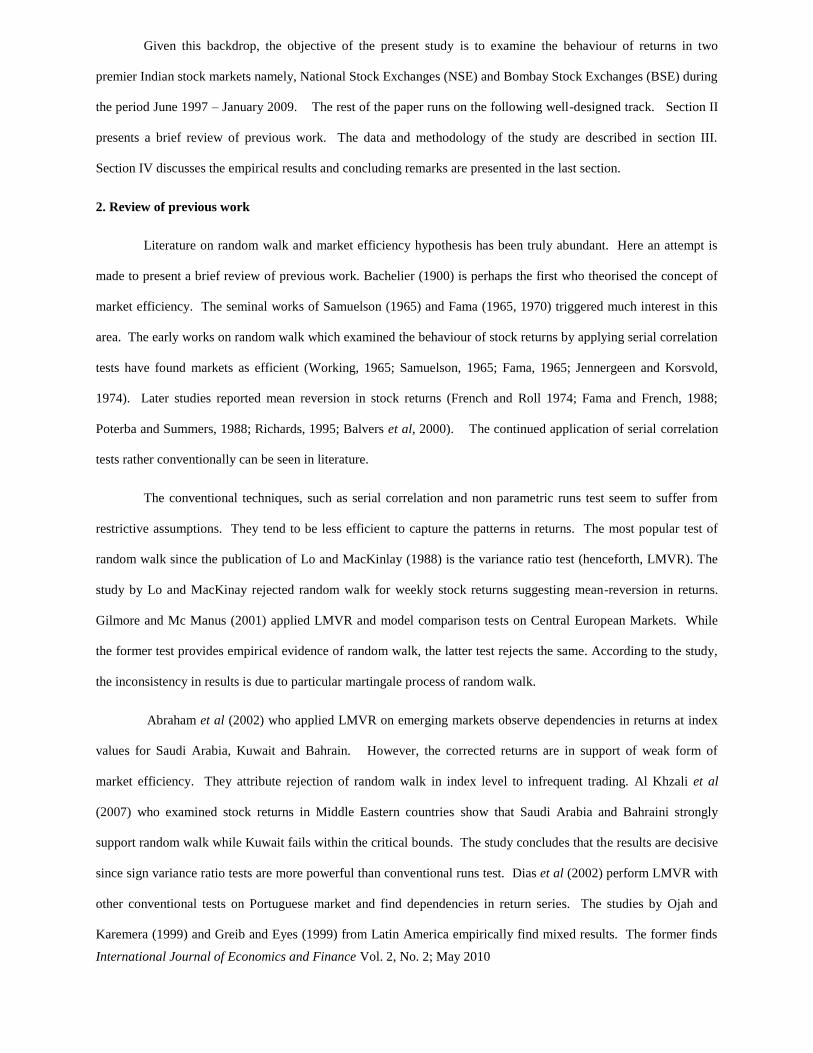
Given this backdrop, the objective of the present study is to examine the behaviour of returns in two
premier Indian stock markets namely, National Stock Exchanges (NSE) and Bombay Stock Exchanges (BSE) during
the period June 1997 – January 2009. The rest of the paper runs on the following well-designed track. Section II
presents a brief review of previous work. The data and methodology of the study are described in section III.
Section IV discusses the empirical results and concluding remarks are presented in the last section.
2. Review of previous work
Literature on random walk and market efficiency hypothesis has been truly abundant. Here an attempt is
made to present a brief review of previous work. Bachelier (1900) is perhaps the first who theorised the concept of
market efficiency. The seminal works of Samuelson (1965) and Fama (1965, 1970) triggered much interest in this
area. The early works on random walk which examined the behaviour of stock returns by applying serial correlation
tests have found markets as efficient (Working, 1965; Samuelson, 1965; Fama, 1965; Jennergeen and Korsvold,
1974). Later studies reported mean reversion in stock returns (French and Roll 1974; Fama and French, 1988;
Poterba and Summers, 1988; Richards, 1995; Balvers et al, 2000). The continued application of serial correlation
tests rather conventionally can be seen in literature.
The conventional techniques, such as serial correlation and non parametric runs test seem to suffer from
restrictive assumptions. They tend to be less efficient to capture the patterns in returns. The most popular test of
random walk since the publication of Lo and MacKinlay (1988) is the variance ratio test (henceforth, LMVR). The
study by Lo and MacKinay rejected random walk for weekly stock returns suggesting mean-reversion in returns.
Gilmore and Mc Manus (2001) applied LMVR and model comparison tests on Central European Markets. While
the former test provides empirical evidence of random walk, the latter test rejects the same. According to the study,
the inconsistency in results is due to particular martingale process of random walk.
Abraham et al (2002) who applied LMVR on emerging markets observe dependencies in returns at index
values for Saudi Arabia, Kuwait and Bahrain. However, the corrected returns are in support of weak form of
market efficiency. They attribute rejection of random walk in index level to infrequent trading. Al Khzali et al
(2007) who examined stock returns in Middle Eastern countries show that Saudi Arabia and Bahraini strongly
support random walk while Kuwait fails within the critical bounds. The study concludes that the results are decisive
since sign variance ratio tests are more powerful than conventional runs test. Dias et al (2002) perform LMVR with
other conventional tests on Portuguese market and find dependencies in return series. The studies by Ojah and
Karemera (1999) and Greib and Eyes (1999) from Latin America empirically find mixed results. The former finds

International Journal of Economics and Finance Vol. 2, No. 2; May 2010
evidence in support of random walk for Latin America. The latter study, however, finds significant auto correlation
in Mexican market and random walk behviour in Brazilian market. Such conflicting results are also observed by
Lima and Tabak (2004). While the Chinese - A shares and Singapore stock market are weak form efficient, the
Chinese - B shares and Hong Kong market reveal auto correlation in returns. The market capitalization and liquidity
can explain such conflicting trends as the authors note.
Darant and Zhong (2000) and Lee et al (2001) report independence of returns series for Chinese market.
The empirical findings of Fifield and Jetty (2008) support the earlier evidences of market efficiency in China.
Eitelman and Vitanz (2008) who employed variance ratio test for 44 emerging and industrialized economies points
out that the markets with poorer risk-adjusted performance are more likely to reject random walk than better
performing markets.
The LMVR tests individual variance ratios for a specific aggregation investment horizon. This may results
in size distortions. In order to overcome the deficiency in LMVR, recent studies employ Chow and Denning (1993)
multiple variance ratios test along with other tests. The studies of Ayadi and Pyun (1994) for Korea and
Worthington and Higgs (2003) for Latin America report dependencies in returns. Huber (1995) examines the
Vienna stock exchange and concludes that random walk is rejected at highly significant level for daily returns in
Vienna. However, individual stocks seem to follow a random walk. Thus, the thinness of market can lead to
rejection of random walk. Ryoo and Smith (2002) show evidence against random walk in Korean market. Smith
(2007) who investigates whether Middle East stock markets follow random walk or not finds that largely Israieli,
Jordanian, Lebansese markets were weak form efficient while Kuwait and Oman markets reject RWH. Smith et al
(2002) report auto correlation in returns of Botswana, Egypt, Kenya, Mauritius, Morocco, Nigeria and Zimbabwe. It
is only in South Africa, the study finds empirical evidence in support of random walk. Segot and Lucey (2005)
confirm random walk in Israel and Turkey.
The empirical evidence for Australia for longer period, 1875-2004 rejects the random walk (Worthington
and Higgs, 2009) revealing strong serial dependence in the stock returns. Hoque et al (2007) also observe
evidences rejecting RWH in the majority of eight emerging markets. Borges’s (2007) findings from multiple
variance ratio test corroborate the earlier findings of Dias et al (2002) and Worthington and Higgs (2004) that
Portuguese stock returns are highly correlated. With multiple variance tests, an attempt is made to unmask sectoral
efficiency of economies namely, Jordan, Qatar, Saudi Arabia and United Arab Emirates. The study finds
inconsistent results among different sectors and different economies (Benjelloun and Squalli, 2008). The EMH in

International Journal of Economics and Finance Vol. 2, No. 2; May 2010
European stock market is investigated by Borges (2008). The study employed tests namely, autocorrelation, runs,
ADF unit root and multiple variance ratio to test RWH. The study finds that while the markets in France, Germany,
U.K and Spain followed a random walk, there exist positive serial correlation in returns of Greece and Portugal.
The conventional tests including variance ratio of Lo and MacKinlay (1988) examine the linear dependence
in stock returns. These tests are not capable of capturing non-linearity in the return series. There may be presence of
non-linear dependencies even though the tests reject presence of linear dependencies in returns. As pointed out by
Granger and Anderson (1978), rejection of linear dependence does not mean independence. In this context, the non-
linearity in stock returns assumes theoretical importance with practical implications. The non-linearity in daily
stock returns for the NYSE is reported by Hinich and Pattern (1985). Besides, there are studies which test non-
linear dependence as an alternative to random walk hypothesis. The studies of Scheinkman and Le Baron (1989),
Hsieh (1991), Sewell et al (1993), Pagan (1996), Yadav et al (1999), among others, examine non-linearity in returns.
The studies of Dahl and Nielson (2001), Blasco et al (1997), and Poshakwale (2002) employed Brock et al (1993) ,
popularly known as BDS test of independence to examine non-linear dependence in returns series. Blasco et al
(1997) rejected random walk behaviour implying strong presence of non-linear dependencies. Similar conclusions
are reported by Dahl and Nielson (2001). Refuting the earlier findings of efficiency, Lim and Brooks (2009) based
on a battery of non-linearity tests reveal strong evidence of nonlinear serial dependence in the underlying returns
generating process for all indices in China.
Methodologically improved, the studies by Lim (2008), Bonilla et al (2006), Lim et al (2008)a Lim et al
(2008)b use bicorrelation test of Hinich (1995, 1996) to examine the behaviour of stock returns. Lim (2008) using
bicorrelation test examines the sectoral efficiency of Malaysian stock market. It is observed that the Tin and Mining
sector are relatively more efficient than the property sectors which exhibited wide deviations from random walk.
The study concludes that the inefficiency was highest during the Asian financial crisis period. Bonilla et al (2006)
report episodic non linear dependence in returns for Latin American countries. While the number of significant
windows for Chile is highest, at least one window is significant for other countries such as Mexico, Brazil,
Argentina, Colombia and Venezuela. This implies presence of non-linear dependencies in stock returns. However,
inefficiency is not persistent.
A battery of non linear tests is performed by Lim et al (2008)a on non-overlapping sample for period 1992-
2005 for ten Asian emerging markets. The non linear tests report non-linear dependencies in returns. The bi-
correlation, in contrast, provides evidence of non-linear dependencies only in a few periods. The other periods seem

International Journal of Economics and Finance Vol. 2, No. 2; May 2010
to follow pure noise process. The study points out that inefficiency may be explained by market size and trading
activity. Further, departures from random walk cannot be attributed to states of the market. For 50 countries, Lim et
al (2008 b) using rolling bi-correlation test, observe that the low per capita economies persistently deviate from
random walk than developed markets. The weak protection of property rights has been a possible explanation for
such a trend.
As far as India is concerned, Sharma and Kennedy (1977), Barua (1981), Gupta (1995) observe that the
stock returns in India conform to random walk hypothesis (Note 1). Mitra (2000) who employed neural network
method rejected the random walk hypothesis. Similarly, Chaudhuri and Wu (2004) on the basis of unit root tests,
conclude that returns in India do not follow a random walk. Poshakwale (2002) provides evidence of non-linear
dependencies in BSE stock returns. A set of tests as such auto correlation, unit root, GARCH model and non
parametric runs and Kolmogorov-Smirnov test find support against random walk (Ahmad et al, 2006). However,
interestingly Chawla et al (2006) reports that Nifty and Sensex are weak form efficient. Thus, as in case of other
markets, the results for India too remain inconclusive. But, largely Indian stock market does not conform to weak
form efficiency, and exhibit dependencies.
To sum up, although, the literature on random walk and market efficiency is vast; there is no consensus
among the researchers regarding efficiency of the market. The different tests yield different results. The empirical
results of various studies appear to be sensitive to the tests employed for the analysis. However, broadly, the
conventional parametric tests provide evidence in support of random walk while non parametric tests, such as Brock
et al (1996) overwhelmingly reject independence of returns. The review of literature provides mixed results
regarding the returns behaviour, as is viewed in terms of random walk and linear and non-linear dependencies.
3. Data and Methodology
3.1 Data
Data used in this paper are daily stock returns of eight indexes from National Stock Exchange (NSE) and six from
Bombay Stock Exchange (BSE). The data ranges are different for different indexes which are given in the
appendix. These indexes are considered because together they represent the total market. The set of indexes serve
the purpose of unmasking variations in the behaviour of different index returns. Besides, most of these indexes have

International Journal of Economics and Finance Vol. 2, No. 2; May 2010
the track record of at least five years. The daily index values of NSE are collected from the official website of NSE
(www.nseindia.com) and index value of BSE are collected from the CMIE-Prowess data base.
3.2 Methodology
As mentioned above, the present study employs Chow and Denning (1993) multiple variance ratio test, and
Hinich (1996) bicorrelation test. A brief description of these two tests is given here
3.2.1 Chow and Denning (1993) Multiple Variance Ratios Test:
The variance ratios test of Lo and MacKinlay (1988) estimates individual variance ratios where one
variance ratio is considered at a time, for a particular holding period (k). Empirical works examine the variance
ratio statistics for several k values. The null of random walk is rejected if it is rejected for some k value. So it is
essentially an individual hypothesis test. The variance ratio of Lo and MacKinlay (1988) tests whether variance ratio
is equal to one for a particular holding period whereas the random walk hypothesis requires that variance ratios for
all holding periods should be equal to one and the test should be conducted jointly over a number of holding periods.
The sequential procedure of this test leads to size distortions. To overcome from this problem, Chow and Denning
(1993) proposes multiple variance ratio test procedure where a set of multiple variance ratios over a number of
holding periods can be tested to determine whether the multiple variance ratios (over a number of holing periods )
are jointly equal to one. The test is based on the idea that the decision regarding the null hypothesis can be made
according to the maximum absolute value of the individual variance ratio statistics. RWH is rejected if any one of
the estimated variance ratios is significantly different from one (Chow and Denning, 1993).
3.2.2 Portmanteau Bicorrelation Test:
Hinich and Patterson (1995), propose a procedure of dividing full sample period into equal-length non-
overlapped windows to capture episodic dependencies in stock returns. The present study divides whole sample into
a set of non-overlapped window of 50 observations in equal length (Note 2). Then, Hinich (1996) bicorrelation test
is applied. The portmanteau bicorrelation test of Hinich (1996) is a third order extension of the standard correlation
tests for white noise. The null hypothesis for each window is that the transformed data are realizations of a
stationary pure white noise process that has zero correlation (C) and bicorrelation (H). Thus, under the null
hypothesis, the correlation (C) and bicorrelation (H) are expected to be equal to zero. The alternative hypothesis is
International Journal of Economics and Finance Vol. 2, No. 2; May 2010
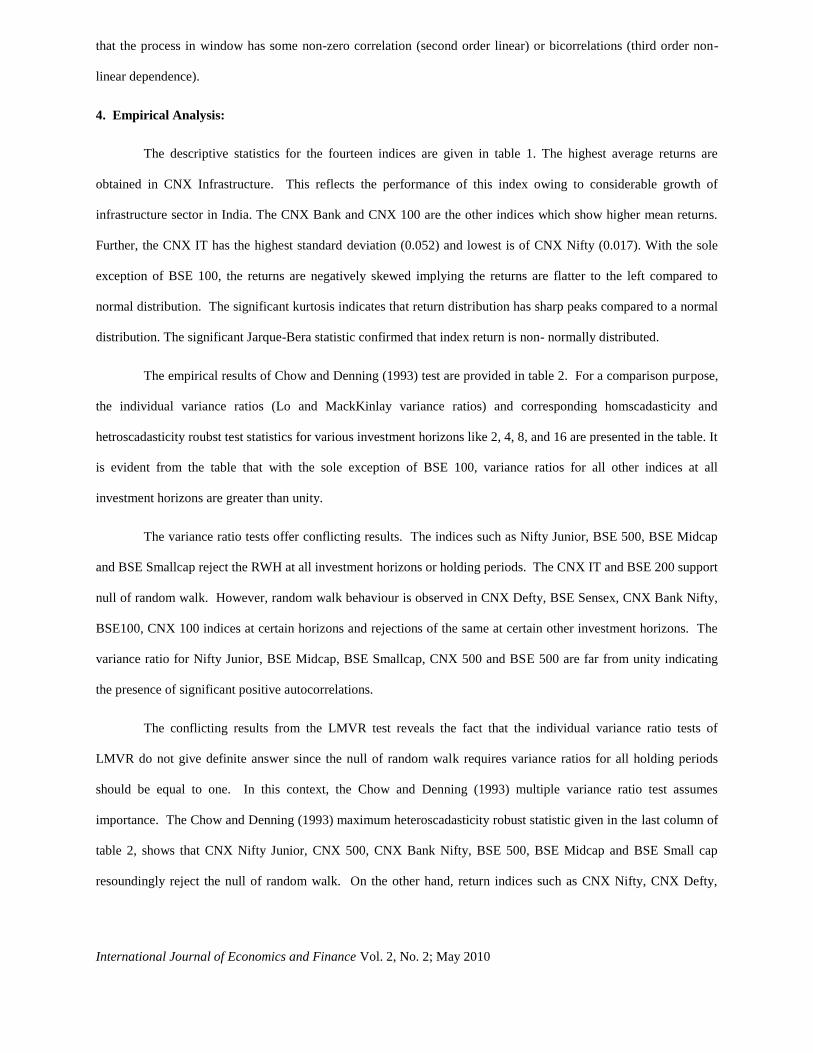
that the process in window has some non-zero correlation (second order linear) or bicorrelations (third order non-
linear dependence).
4. Empirical Analysis:
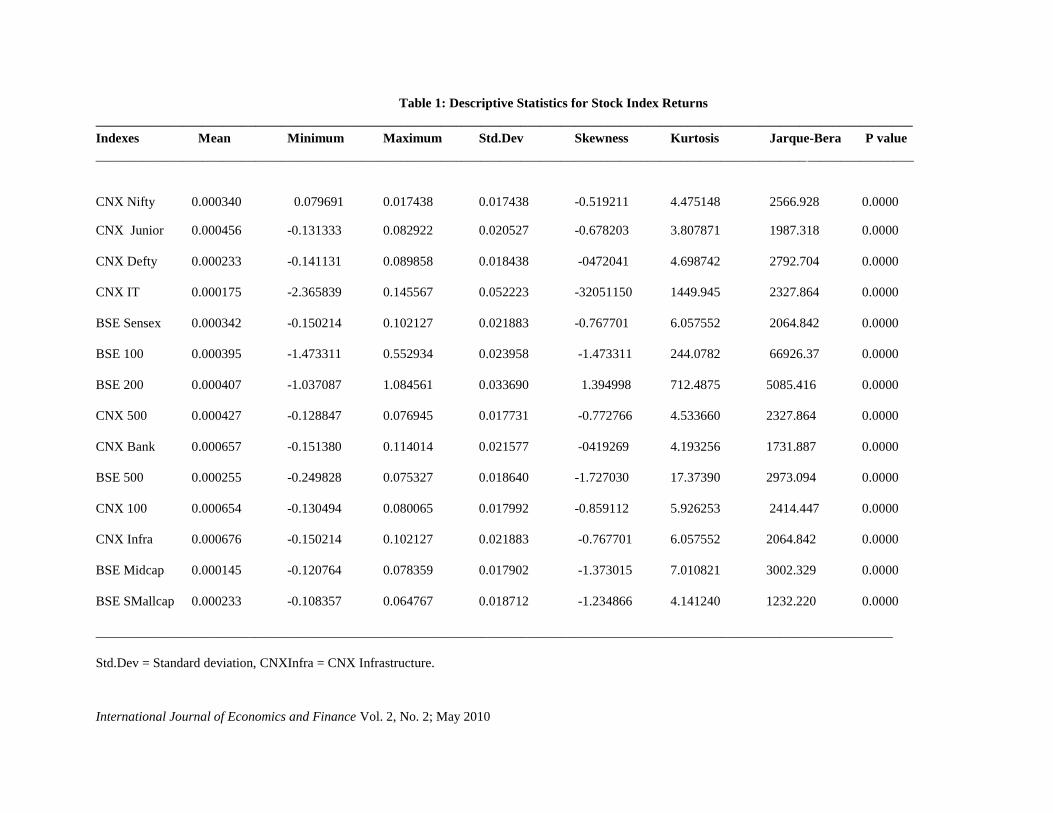
The descriptive statistics for the fourteen indices are given in table 1. The highest average returns are
obtained in CNX Infrastructure. This reflects the performance of this index owing to considerable growth of
infrastructure sector in India. The CNX Bank and CNX 100 are the other indices which show higher mean returns.
Further, the CNX IT has the highest standard deviation (0.052) and lowest is of CNX Nifty (0.017). With the sole
exception of BSE 100, the returns are negatively skewed implying the returns are flatter to the left compared to
normal distribution. The significant kurtosis indicates that return distribution has sharp peaks compared to a normal
distribution. The significant Jarque-Bera statistic confirmed that index return is non- normally distributed.
The empirical results of Chow and Denning (1993) test are provided in table 2. For a comparison purpose,
the individual variance ratios (Lo and MackKinlay variance ratios) and corresponding homscadasticity and
hetroscadasticity roubst test statistics for various investment horizons like 2, 4, 8, and 16 are presented in the table. It
is evident from the table that with the sole exception of BSE 100, variance ratios for all other indices at all
investment horizons are greater than unity.
The variance ratio tests offer conflicting results. The indices such as Nifty Junior, BSE 500, BSE Midcap
and BSE Smallcap reject the RWH at all investment horizons or holding periods. The CNX IT and BSE 200 support
null of random walk. However, random walk behaviour is observed in CNX Defty, BSE Sensex, CNX Bank Nifty,
BSE100, CNX 100 indices at certain horizons and rejections of the same at certain other investment horizons. The
variance ratio for Nifty Junior, BSE Midcap, BSE Smallcap, CNX 500 and BSE 500 are far from unity indicating
the presence of significant positive autocorrelations.
The conflicting results from the LMVR test reveals the fact that the individual variance ratio tests of
LMVR do not give definite answer since the null of random walk requires variance ratios for all holding periods
should be equal to one. In this context, the Chow and Denning (1993) multiple variance ratio test assumes
importance. The Chow and Denning (1993) maximum heteroscadasticity robust statistic given in the last column of
table 2, shows that CNX Nifty Junior, CNX 500, CNX Bank Nifty, BSE 500, BSE Midcap and BSE Small cap
resoundingly reject the null of random walk. On the other hand, return indices such as CNX Nifty, CNX Defty,

International Journal of Economics and Finance Vol. 2, No. 2; May 2010
CNX IT, BSE Sensex, BSE 100, BSE 200, CNX100, CNX Infrastructure, validate RWH as the Chow-Denning
statistic values are less than the critical values.
It may be noted that five indices out of 8 indices traded at National Stock Exchange (NSE) and 3 out of 6
indices traded in Bombay Stock Exchange (BSE) support RWH. This indicates inter market and intra market
variations in the behaviour of stock returns.
The Hinich (1996) correlation (C) and bicorrelation (H) test statistics covering the full sample period are
presented in table 3. The null of pure noise is tested. Rejection of the null of pure white noise for all indices except
CNX IT and BSE 200 is evident from the table as the p values are close to zero. It may be inferred that the return
series for these indexes are not generated by strong stationary pure noise process. However, we cannot reject the
null of pure noise for CNX IT and BSE 200 since the p values are almost close to 1. In other words, the stock
returns may not be correlated and hence follow random walk hypothesis. It is to be noted that Chow-Denning test
also shows that these two indexes follow a random walk. It can be inferred that these two indices are weak form
efficient. The Chow-Denning test results for other indices are in contrast to findings of bicorrelation test which
reject the pure noise process.
The presence of dependence either linear or non-linear or both, throughout the sample period or confined to
certain period within the sample is an interesting issue to explore. To examine the episodic dependence in returns
series, Hinich and Patterson (1995) suggest dividing the sample into different windows and then testing the null of
pure noise. Following Lim et al (2008), the sample is divided into a set of non-overlapped widow of 50
observations in equal length and then C and H statistics of Hinich (1996) are computed to detected serial
dependencies in each window.
Table 4 presents total number of significant H and C windows with percentage in parenthesis. A window is
significant if the H or C statistics reject the null hypothesis at pre determined level of p value. The results show that
the number of significant H and C windows is less. Specifically, the percentage of significant H windows on an
average is 15.6 percent while that of C windows is around 5 per cent. The rejection of null hypothesis in these
significant windows may be due to either significant correlation or bi-correlation or both. In other words, total
number of significant windows indicates presence of serial dependencies in those time periods of windows. The
highest significant H windows is for CNX Infrastructure (46.1) followed by BSE Midcap and BSE Smallcap (53.8
%) and CNX Nifty Junior (33.9 %). It is to be noted that the Chow- Denning test also shows presence of linear

International Journal of Economics and Finance Vol. 2, No. 2; May 2010
dependencies in return series of these indices. The CNX Bank Nifty and CNX Nifty have lowest significant H
windows while the CNX 100 has only one significant C window which is lowest among all indices.
The evidences presented above from the bi-correlation test for full sample and sub-sample may throw lights
on the behaviour of stock return series. The resounding rejection of null hypothesis of pure noise for all most all
indices in full sample period may be because of linear or non linear dependence or both in return series driven by
the activity during the small number of significant window periods.
5. Conclusion:
The present study examines the stock return behaviour in two premier Indian stock markets using Chow-
Denning (1993) multiple variance ratio and Hinich (1996) bicorrelation tests. The multiple variance ratio tests show
that CNX Nifty Junior, CNX 500, CNX Bank Nifty, BSE 500, BSE Midcap and BSE Small cap reject the random
walk hypothesis and return series are characterized by the presence of linear dependencies. On the other hand, the
bicorrelation test rejects the hypothesis of pure white noise process for the full sample period. However, the results
for sub-periods show that those serial dependencies are not consistent across the sample period for all indices. This
indicates presence of episodic dependencies in stock returns surrounded by long periods of pure noise. In other
words, the Indian s tock markets are weak form efficient but not all the time. This conclusion is consistent with
Bonilla et al (2006) for Latin America. The events occurred during the periods of serial dependencies and
peculiarity of particular indices can be investigated in future research
Notes:
Note 1. For a comprehensive survey of literature on market efficiency hypothesis for India, see Amanulla and
Kamaiah (1996).
Note 2. Hinich and Patterson (1995) suggest that the window length should be sufficiently large to validly apply
bicorrelation test and yet short enough for the data generating process to have remained roughly constant.
References:
Abraham, A., Seyyed, F. J., & Aisakran, S.A. (2002). Testing the random walk behavior and efficiency of the Gulf
stock markets. The Financial Review, 37, 469-480.
Ahmed, K. M., Ashraf, A., & Ahmed, A. (2006). Testing weak form of efficiency for Indian stock markets.
Economic and Political Weekly, January 7, 46-56.
Al-Khazali, O M., Ding, D. K., & Pyun, C.S. (2007). A new variance ratio test of random walk in emerging markets:
A revisit. The Financial Review, 42, 303-317.
Amanulla, S., & Kamaiah, B. (1996). Stock market efficiency: A review of Indian evidence. Prajnan, 24(3), 257-
280.

International Journal of Economics and Finance Vol. 2, No. 2; May 2010
Ayadi, O. F., & Pyun, C.S. (1994). An application of variance ratio test to the Korean securities market. Journal of
Banking and Finance, 18, 643-658.
Bachelier, L. (1900). Theory of Speculation, A Thesis submitted to the Faculty of the Academy of Paris on March
29, 1900 and also In Cootner, P H (1967), (Eds), The random walk character of stock market prices, Cambridge:
Mass, MIT Press.
Balvers, R., Wu, Y., & Gilliland, E. (2000). Mean-reversion across National stock markets and parametric
contrarian investment strategies. Journal of Finance, 55, 745-772.
Barua, S. K. (1981). The short run price behaviour of securities: Some evidence on efficiency of Indian capital
market. Vikalpa, 16(2), 93-100.
Benjelloun, H., & Squalli, J. (2008). Do general indexes mask sectoral efficiency? A multiple variance ratio
assessment of Middle Eastern equity markets. International Journal of Managerial Finance, 4(2), 136-151.
Blasco N., Rio, C. D., & Santamari, R. (1997). The random walk hypothesis in the Spanish stock market: 1980-
1992. Journal of Business Finance & Accounting, 24(5), 667-683.
Bonilla C. A., Hinich, M.J., & Meza, R.R. (2006). Episodic nonlinearity in Latin American stock market indices.
Applied Economic Letters, 13, 195-199.
Borges, M. R. (2007). Random walk tests for the Lisbon stock market, Working Paper, WP 014/2007/DE, 1-18.
Borges, M..R. (2008). Efficient market hypothesis in European stock markets, Working Paper, WP
20/2008/DE/CIEF, 1-20.
Brock, W., Dechert, W., Sheinkman, J., & LeBaron, B. (1996). A test for independence based on the correlation
dimension. Econometric Reviews, 15, 197–235.
Campbell, Y.J., Lo, W.A & MacKinlay A. C (1997). The econometrics of financial markets. New Jersey: Princeton
University Press, (Chapter2).
Chaudhuri, K., & Wu, Y. (2004). Mean-reversion in stock prices: Evidence from emerging markets. Managerial
Finance, 30, 22-37.
Chawla, D., Mohanty, P.K., & Bhardwa, S. (2006). Random walk hypothesis and integration among the Indian stock
market vis-à-vis some developed markets. Prajnan, 34(2), 113-127.
Chow, K..V., & Denning, K.C. (1993), A simple multiple variance ratio test. Journal of Econometrics, 58, 385-401.
Dahl, C. M., & Nielson, S. (2001). The random walk of stock prices: Implications of recent non parametric tests.
Working Paper, Frederiksberg: Department of Economics,
Darrat, A. F., and Zhong, M. (2000). On estimating the random walk hypothesis: A model comparison approach.
The Financial Review, 35, 105-124.
Dias J. L., Lopes, P., & Benzinho, M. J. (2002), Efficiency tests in the Iberian stock markets. [Online] Available:
SSRN: http://ssrn.com/abstract=599926
Eitelman, P. S., & Vitanz, J. T. (2008). A non-random walk revisited: Short and long term memory in asset prices.
International Finance Discussion Paper, No. 956.
Fama, E. F. (1965). The behaviour of stock market prices. Journal of Business, 38, 34-105.

International Journal of Economics and Finance Vol. 2, No. 2; May 2010
Fama, E. F. (1970). Efficient capital markets: A review of theory and empirical work. Journal of Finance. 25, 383-
417.
Fama, E. F., &. French, K. R. (1988). Permanent and temporary components of stock prices. Journal of Political
Economy, 98, 247-273.
Fifield S.G.M., and Jetty, J. (2008), Further evidence on the efficiency of the Chinese stock markets: A note.
Research in International Business and Finance, 22, 351–361.
French, K. R., & Roll, R. (1986). Stock return variances: The arrival of information and reaction of traders. Journal
of Financial Economics, 17, 5-26.
Gilmore C.G., & MacManus, G.M. (2001). Random walk and efficiency tests of central European equity markets.
Prepared for presentation at the European Financial Management Association Conference, Lugano, Switzerland.
Granger, C., & Andersen, A.P. (1978), An introduction to bilinear time series models: Gottingen: Vandenhoeck &
Ruprecht.
Greib, T., & Reyes, M.G. (1999), Random walk tests for Latin American equity indices and individual firms.
Journal of Financial Research, 4, 371-383.
Gupta, O. P. (1985). Behaviour of share prices in India: A test of market efficiency. New Delhi: National
Publishing House.
Hinich, M. J, & Patterson, D.M. (1985). Evidence of nonlinearity in daily stock returns. Journal of Business and
Economic Statistics, 3, 69-77.
Hinich, M. J., & Patterson, D.M. (1995). Detecting epochs of transient dependence in white noise. Mimeo:
Univeristy of Texas.
Hinich, M. J., (1996) Testing for dependence in the input to a linear time series model. Journal of Nonparametric
Statistics, 6, 205–21.
Hoque, H. A. A. B., Kim, J.H., & Pyun, C.S. (2007). A comparison of variance ratio tests of random walk: A case of
Asian emerging stock markets. International Review of Economics and Finance, 16, 488-502.
Hsieh, D.A. (1991), Chaos and nonlinear dynamics: Application to financial markets. Journal of Finance, 46, 839-
877.
Huber, P. (1995), Random walks in stock exchanges prices and the Vienna stock exchange, Working Paper.
Economic Series, No. 2, 1-25.
Jennergren, L. P., & Korsvold, P. E. (1974). Price formation of the Norwegian and Swedish stock markets: Some
random walk tests. The Swedish Journal of Economics, 76, 171-185.
Lee, C. F., Chen, G.M., & Rui, O.M. (2001). Stock returns and volatility on China’s stock markets. Journal of
Financial Research, 24, 523-543.
Lim Kian Ping., Brooks, R.D., & Hinich, M. J. (2008)a. Nonlinear serial dependence and the weak form efficiency
of Asian emerging stock markets. International Financial Markets, Institutions and Money, 18, 527-544.
Lim Kian Ping., Brooks, R.D., & Hinich, M.J. (2008)b. Why do emerging stock markets experience more persistent
price deviations from a random walk over Time? A country-level analysis. [Online] Available:
http://papers.ssrn.com/sol3/papers.cfm?abstract_id=1194562 (August 1, 2008).
International Journal of Economics and Finance Vol. 2, No. 2; May 2010
Lim Kian Ping., & Brooks, R.D. (2009). Are Chinese stock markets efficient? Further evidence from a battery of
nonlinearity tests. Applied Financial Economics, 19, 147-155.
Lim Kian-Ping. (2008). Sectoral efficiency of the Malaysian stock market and the impact of the Asian financial
crisis. Studies in Economics and Finance, 25(3), 196-208.
Lima E.J.A., & Tabak, B. M.(2004). Tests of random walk hypothesis for equity markets: Evidences from China,
Hong Kong and Singapore. Applied Economic Letters, 11, 255-258.
Lo, A., & MacKinlay, A.C. (1988). Stock market prices do not follow random walks: Evidence from a simple
specification test. Review of Financial Studies, 1, 41-66.
Mitra, S. K. (2000). Forecasting stock index using neural networks. The ICFAI Journal of Applied Finance, 6, 16-
25.
Ojah, K., & Karemera, D. (1999). Random walks and market efficiency tests of Latin American emerging equity
markets: A revisit. The Financial Review, 34, 57-72.
Pagan, A. (1996). The econometrics of financial markets. Journal of Empirical Finance 3, 15-102.
Poshakwale, S. (2002). The random walk hypothesis in the emerging Indian stock market. Journal of Business
Finance & Accounting, 29, 1275-1299.
Poterba J. M., & Summers, L.H. (1989), Mean-reversion in stock prices: Evidence and implications. NBER
Working Paper, 2343.
Richards, A. J. (1995). Co movements in National stock market returns: Evidence of predictability, but not co
integration. Journal of Monetary Economics, 36, 631-654.
Ryoo, H. J., & Smith, G. (2002). Korean stock prices under price limits: Variance ratio tests of random walks.
Applied Financial Economics, 12, 475-484.
Samuelson, P. (1965). Proof that properly anticipated prices fluctuate randomly, Industrial Management Review, 1,
41-49.
Scheinkman, J.A., & Le Baron. B. (1989). Nonlinear dynamics and stock returns, Journal of Business, 62, 311-337.
Segot, T.L., & Lucey, B.M. (2005), Stock market predictability in the MENA: Evidence from new variance ratio
tests and technical trade analysis, IIIS Discussion Paper, No. 92, November.
Sewell, S. R., Lee, S I., & Pan, M.S. (1993), Nonlinearities in emerging foreign capital markets, Journal of Business
Finance & Accounting, 20, 237-248.
Sharma J. L., & Kennedy, R.E. (1977). Comparative analysis of stock price behavior on the Bomabay, London and
New York stock exchanges. Journal of Financial and Quantitative Analysis, 31, 391-413.
Smith, G. (2007). Random walks in Middle Eastern stock markets. Applied Financial Economics. 17, 587-596.
Smith, G., Jefferis, K., & Ryoo, H. J. (2002). African stock markets: Multiple variance ratio tests of random walks.
Applied Financial Economics, 12, 475-484.
Working, H. (1960). Note on the correlation of first differences of averages in a random chain, Econometrica, 28,
916-918.
Worthington, A., & Higgs, H. (2003). Tests of random walks and market efficiency in Latin American stock
markets, School of Economics and Finance Discussion Papers and Working Papers Series, No. 157.

International Journal of Economics and Finance Vol. 2, No. 2; May 2010
Worthington. A., & Higgs, H. (2004). Random walks and market efficiency in European equity markets. Global
Journal of Finance and Economics, 1, 59-78.
Worthington, A. C., & Higgs, H. (2009). Efficiency in the Australian stock market, 1875-2006: A note on extreme
long-run random walk behaviour, Applied Economic Letters, 16, 301-306.
Yadav, P., Paudyal, K., & Pope, P. (1999), Non-linear dependence in stock returns: Does trading frequency matter?
Journal of Business Finance & Accounting, 26(5 & 6), 651-679.
International Journal of Economics and Finance Vol. 2, No. 2; May 2010
Table 1: Descriptive Statistics for Stock Index Returns
___________________________________________________________________________________________________________________________
Indexes Mean Minimum Maximum Std.Dev Skewness Kurtosis Jarque-Bera P value
___________________________________________________________________________________________________________________________
CNX Nifty 0.000340 0.079691 0.017438 0.017438 -0.519211 4.475148 2566.928 0.0000
CNX Junior 0.000456 -0.131333 0.082922 0.020527 -0.678203 3.807871 1987.318 0.0000
CNX Defty 0.000233 -0.141131 0.089858 0.018438 -0472041 4.698742 2792.704 0.0000
CNX IT 0.000175 -2.365839 0.145567 0.052223 -32051150 1449.945 2327.864 0.0000
BSE Sensex 0.000342 -0.150214 0.102127 0.021883 -0.767701 6.057552 2064.842 0.0000
BSE 100 0.000395 -1.473311 0.552934 0.023958 -1.473311 244.0782 66926.37 0.0000
BSE 200 0.000407 -1.037087 1.084561 0.033690 1.394998 712.4875 5085.416 0.0000
CNX 500 0.000427 -0.128847 0.076945 0.017731 -0.772766 4.533660 2327.864 0.0000
CNX Bank 0.000657 -0.151380 0.114014 0.021577 -0419269 4.193256 1731.887 0.0000
BSE 500 0.000255 -0.249828 0.075327 0.018640 -1.727030 17.37390 2973.094 0.0000
CNX 100 0.000654 -0.130494 0.080065 0.017992 -0.859112 5.926253 2414.447 0.0000
CNX Infra 0.000676 -0.150214 0.102127 0.021883 -0.767701 6.057552 2064.842 0.0000
BSE Midcap 0.000145 -0.120764 0.078359 0.017902 -1.373015 7.010821 3002.329 0.0000
BSE SMallcap 0.000233 -0.108357 0.064767 0.018712 -1.234866 4.141240 1232.220 0.0000
________________________________________________________________________________________________________________________
Std.Dev = Standard deviation, CNXInfra = CNX Infrastructure.

International Journal of Economics and Finance Vol. 2, No. 2; May 2010
Table 2: Variance-Ratio and Chow Denning Statistics for Index Returns
_____________________________________________________________________________________________
Indexes Variance Ratios For Different Investment Horizons ChowDenning
_____________________________________________________________________________________________
2 4 8 16
CNX Nifty 1.062 1.053 1.036 1.087
(3.35)* (1.53) (0.65) (1.07) 1.93554
(1.93) (0.92) (0.41) (0.72)
CNX Nifty Junior 1.143 1.209 1.231 1.072
(7.75)* (6.04)* (4.22)* (4.96)* 4.26921*
(4.26)* (3.46)* (2.59)* (3.29)*
CNX Defty 1.072 1.094 1.091 1.163
(3.89)* (2.72)* (1.66) (2.00)* 2.22679
(2.22)* (1.62) (1.04) (1.32)
CNX IT 1.008 1.016 1.026 1.113
(0.43) (0.47) (0.48) (1.39) 0.53818
(0.33) (0.43) (0.44) (1.20)
BSE Sensex 1.070 1.069 1.037 1.093
(3.66)* (1.94) (0.61) (1.10) 2.34265
BSE 100 0.840 0.769 0.719 0.770
(-8.37)* (-6.46)* (-4.98)* (-2.74)* 0.76055
(-075) (-0.72) (-0.75) (-0.56)
BSE 200 1.011 1.014 1.023 1.058
(0.61) (0.40) (0.42) (0.69) 0.82037
(0.81) (0.54) (0.57) (0.95)
CNX 500 1.138 1.189 1.221 1.380
(6.81)* (4.98)* (3.68)* (4.25)* 3.62379*
(3.63)* (2.16)* (0.50) (0.34)
CNX Bank Nifty 1.123 1.146 1.049 1.047
(5.90)* (3.73)* (0.80) (0.51) 3.23927*
(3.21)* (2.16)* (0.50) (0.34)
BSE 500 1.123 1.173 1.217 1.396
(5.91)* (4.42)* (3.50)* (4.29)* 3.37238*
(3.39)* (2.66)* (2.24)* (2.96)*
CNX 100 1.093 1.096 1.054 1.126
(3.65)* (2.01)* (0.71) (1.12) 1.85454
(1.85) (1.06) (0.40) (0.68)
CNX 100 1.093 1.096 1.054 1.126
(3.26)* (1.49) (0.38) (0.49) 1.60863
(1.85) (1.06) (0.40) (0.68)
CNX Infrastructure 1.091 1.078 1.0316 1.061
(3.26)* (1.49) (0.38) (0.49) 1.60863
(1.63) (0.78) (0.21) (0.30)
CNX Midcap 1.220 1.350 1.464 1.688
(7.85)* (7.85)* (5.59)* (5.57)* 3.42666*
(3.43)* (3.10)* (2.90)* (3.29)*
BSE Smallcap 1.279 1.504 1.733 2.069
(9.96)* (9.60)* (8.84)* (8.65)* 5.27285*
(5.28)* (5.42)* (5.45)* (5.86)*
_____________________________________________________________________________________________
The variance ratios VR (q) are reported in the main rows and variance test statistic Z(q) for homoskedastic
increments and, for heteroscedasticity- robust test statistics z*(q) are given in the second and third row parentheses .
The Chow and Denning (1993) statistics, Z*(q) is given in the last column. Asterisked values reject random walk
hypothesis at 5% level significance.

International Journal of Economics and Finance Vol. 2, No. 2; May 2010
Table 3: Hinich Correlation (C) and Bicorrelation (H) Statistics for Full Sample Data
________________________________________________________________________________________
CNX Nifty* 24 276 0.00000000 0.00031967
CNX Nifty Junior* 24 276 0.00000000 0.00000000
CNX Defty* 24 276 0.00000000 0.00086180
CNX IT 24 276 1.00000000 0.74625165
BSE Sensex* 23 253 0.00000000 0.00000514
BSE 100 * 23 253 0.00000000 0.00000514
BSE 200 23 253 1.00000000 0.99648407
CNX 500* 22 231 0.00000000 0.00000000
CNX Bank Nifty* 22 231 0.00000000 0.00000000
BSE 500 * 22 231 0.00000000 0.00000046
CNX 100* 18 153 0.00000000 0.00094372
CNX Infrastructure* 17 136 0.00000000 0.00020523
BSE Midcap* 17 136 0.00000000 0.00000000
BSE Smallcap* 17 136 0.00000000 0.00000000
__________________________________________________________________________________________
Asterisked indices reject null of pure noise at all conventional significance level.

International Journal of Economics and Finance Vol. 2, No. 2; May 2010
Table 4: Widowed Test Results of Hinich H and C Statistics
__________________________________________________________________________________________
Index Total Number of Total Number of Total Number of
Windows Significant H Windows Significant C Windows __________________________________________________________________________________________
CNX Nifty 59 9 (15.25) 3 (02.08)
CNX Nifty Junior 59 20 (33.89) 7 (11.86)
CNX Defty 59 15 (25.42) 4 (06.77)
CNX IT 59 15 (25.42) 8 (13.55)
BSE Sensex 56 11 (18.64) 8 (13.55)
BSE 100 56 16 (28.57) 6 (10.71)
BSE 200 56 18 (32.14) 5 (08.92)
CNX 500 49 15 (30.16) 5 (10.20)
CNX Bank Nifty 46 7 (15.21) 4 (08.69)
BSE 500 46 9 (19.56) 5 (10.86)
CNX 100 31 8 (25.80) 1 (03.22)
CNX Infrastructure 26 14 (46.15) 5 (19.23)
BSE Midcap 26 10 (38.46) 5 (19.23)
BSE Smallcap 26 10 (38.46) 5 (19.23)
________________________________________________________________________________________
The number of significant windows is reported in main rows with percentage in parenthesis.
A window is defined as significant if C or H statistics reject null of pure noise at 5 % significance level.

International Journal of Economics and Finance Vol. 2, No. 2; May 2010
Appendix: Sample Indexes – Time Period Covered
___________________________________________________________________________________________
S.No Index Time Period % of Market Capitalization
___________________________________________________________________________________________
01 CNX Nifty 02/06/1997 – 30/01/2009 61.70
02 CNX Junior 02/06/1997 – 30/01/2009 9.89
03 CNX Defty 02/06/1997 – 30/01/2009 -
04 CNX IT 02/06/1997 – 30/01/2009 14
05 BSE Sensex 01/01/1998 – 30/01/2009 46.53
06 BSE 100 01/01/1998 – 30/01/2009 75.67
07 BSE 200 01/01/1998 – 30/01/2009 85.24
08 CNX 500 07/06/1999 – 30/01/2009 84.24
09 CNX Bank Nifty 01/01/2000 – 30/01/2009 7
10 BSE 500 03/01/2000 – 30/01/2009 93.51
11 CNX 100 01/01/2003 – 30/01/2009 68
12 CNX Infrastructure 01/01/2004 – 30/01/2009 18.84
13 BSE Midcap 01/01/2004 – 30/01/2009 12.80
14 BSE Smallcap 01/01/2004 – 30/01/2009 3.7
___________________________________________________________________________________________