Some ecological and socio-economic impacts of an angling competition … · 2012-03-12 · Some...
30
NINA•NIKU Project Report no. 014 Tor F. Næsje, Clinton J. Hay, Servatius Kapirika, Odd T. Sandlund and Eva B. Thorstad Directorate Resource Management Ministry of Fisheries and Marine Resources Private Bag 13 355 Windhoek Namibia Norwegian Institute for Nature Research Tungasletta 2 N-7485 Trondheim Norway Some ecological and socio-economic impacts of an angling competition in the Zambezi River, Namibia Some ecological and socio-economic impacts of an angling competition in the Zambezi River, Namibia
Transcript of Some ecological and socio-economic impacts of an angling competition … · 2012-03-12 · Some...

NINA•NIKU Project Report no. 014
Tor F. Næsje, Clinton J. Hay, Servatius Kapirika, Odd T. Sandlund and Eva B. Thorstad
Directorate Resource ManagementMinistry of Fisheries and Marine Resources Private Bag 13 355 Windhoek Namibia
Norwegian Institute for Nature ResearchTungasletta 2N-7485 TrondheimNorway
Some ecological and socio-economic impacts of an angling competition inthe Zambezi River, Namibia
Some ecological and socio-economic impacts of an angling competition inthe Zambezi River, Namibia
Some ecological and socio-economic impacts of an angling competition inthe Zambezi River, Namibia
Tor F. Næsje, Clinton J. Hay, Servatius Kapirika, Odd T. Sandlund and Eva B. Thorstad
Ministry of Fisheries and Marine Resources, NamibiaFoundation for Nature Research and Cultural Heritage Research, Norway
nina•niku Project Report 014
2
Norwegian Institute for Nature Research (NINA) andNorwegian Institute for Cultural Heritage Research(NIKU) issue the following publications in English:
NINA-NIKU Project ReportThis series presents the results of both institutes' projects whenthe results are to be made available in English. The series mayinclude reports on original research, literature reviews, analysisof particular problems or subjects, etc. The number of copiesprinted will depend on demand.
In addition to this report series published in English, NINA-NIKUpublish the following series in Norwegian:
NINA Fagrapport (Scientific Report)NIKU Fagrapport (Scientific Report)
NINA Oppdragsmelding (Assignment Report)NIKU Oppdragsmelding (Assignment Report)
NINA Temahefte (Topic Report)NIKU Temahefte (Topic Report)
NINA Faktaark (Fact Sheet)NIKU Faktaark (Fact Sheet)
In addition, NINA's and NIKU's staff publish their researchresults in international scientific journals, symposia procee-dings, popular science journals, books, newspapers, and otherrelevant publications. NINA-NIKU also has a WWW homepage: http://www.nina.no
Næsje, T.F., Hay, C.J., Kapirika, S., Sandlund, O.T. & Thorstad,E.B. 2001. Some ecological and socio-economic impacts of anangling competition in the Zambezi River, Namibia. – NINA•NIKUProject Report 14: 1 – 31.
Trondheim, March 2001
ISSN: 0807-3082ISBN: 82-426-1210-2
Management areas:Fish, sustainable utilisation
Copyright ©:NINA•NIKU Foundation for Nature Research and Cultural Heritage Research
The report can be quoted with references to the source.
Editor(s):Tor F. NæsjeNorwegian Institute for Nature Research
Design and layout:Kari SivertsenNINA•NIKUs Graphic Office
Cover photo: Eva B. Thorstad
Prints: Norservice A/S
Stock: 400
Printed on environment paper
Address to contact:NINA•NIKUTungasletta 2NO-7485 TrondheimNORWAY
Tel: +47 73 80 14 00Fax +47 73 80 14 01.http://www.nina.no
Accessibility: Open
Project no.: 13530
Signature of responsible person:
Contracting sponsor:Ministry of Fisheries and Marine Resources (MFMR)Norwegian Agency for Development Cooperation (NORAD)Norwegian Institute for Nature Research (NINA)

AbstractNæsje, T.F., Hay, C.J., Kapirika, S., Sandlund, O.T. &Thorstad, E.B. 2001. Some ecological and socio-economicimpacts of an angling competition in the Zambezi River,Namibia. – NINA•NIKU Project Report 14: 1 – 31.
This report describes and discusses some ecological andsocio-economic aspects of the Nwanyi Millennium OpenFishing Competition. The competition was organised by theNwanyi Angling Club, Katima Mulilo, 14 – 16 September2000.
The competition was held at the Kalimbeza Fishing Campon a side channel to the Zambezi River approximately 30 kmdownstream from Katima Mulilo, Namibia. In this section ofthe Zambezi, the river forms the border between Namibiaand Zambia. September is in the low water period of theriver, with a mean water discharge of 236 m3/s inSeptember 2000. Only the main channel, the deeper sidechannels and backwaters were filled with water.
A total of 40 anglers were registered as participants. Threeof these anglers were women, and four were juniors (< 16years old). This is approximately 50% of the numberexpected after the wide distribution of the invitation. Theinterest this year was probably restricted by recent hostilitiesin Western Caprivi, causing travellers from parts of Namibiato depend on military convoys to reach Eastern Caprivi.
Thirtyfour of the 40 participants were from Namibia.Fourteen were locals from Katima Mulilo, 12 were fromWindhoek, and four from Rundu. Six participants camefrom Zambia and Zimbabwe (Victoria Falls).
The participants were organised in ten four-person teams.Nine of the teams used two boats with two anglers perboat, while the last team used one boat with four anglers.The boats used were relatively small speed boats withengines between 25 and 2 x 60 hp. The fishing periodlasted from 0600 to 1800 hrs on 14 and 15 September, andfrom 0600 to 1600 hrs on 16 September. The river sectionavailable to anglers (148 km) was restricted to Namibian ter-ritory, which goes out to the deepest part of the main river.The positions of the participants on the river were recordedby means of GPS. The first two days the anglers used a riverstretch of 84 km, including both upstream and downstreamareas from Kalimbeza. The third day, fishing was located toa 24 km stretch approximately 30 km downstream fromKalimbeza.
The competition rules were based on a system with bag lim-its for each species or species group. In addition weightpoints were given for individual fish above a certain mini-mum size. A total of 538 fish were brought ashore, and 293
nina•niku Project Report 014
additional fish were reported as caught and released duringthe competition. These 831 fish weighed a total of 1190 kg,and represented 13 species or species groups. The dominantspecies in terms of number of fish were nembwe(Serranochromis robustus), sharptooth catfish (Clariasgariepinus) and spotted squeaker (Synodontis nigromacula-tus). In terms of weight, the dominant species were sharp-tooth catfish and nembwe. The largest catfish weighed 9.7kg, whereas the largest tigerfish (Hydrocynus vittatus)weighed 7.5 kg. The largest cichlid was a nembwe weighing3.0 kg. The average catch per hour of allowed fishing timewas 0.88 kg, but the success of the anglers varied greatly.Maximum attainable number of points per day was 66. Onlyone angler attained an average score between 50 and 60points, whereas 28 % of the anglers reached an average of0 - 10 points.
The anglers’ catches are clearly size selective, catching largerfish than the scientific survey catches from the same areaand season. Moreover four cichlid species caught by theanglers were not recorded in the survey catches. An index ofrelative importance of the different fish species (% IRI) dif-fered greatly between anglers’ catches and survey catches.Based on this index the only two species represented bothamong the 13 most important species in the anglers’ andsurvey catches were the squeakers (Synodontis spp., rankedas 2. in the survey and 9. in anglers catches) and tigerfish(ranked as 3. in both catches).
The total expense laid down by the participants to take partin the competition is calculated at approximately N$ 73,000(US$ 9,417), or N$ 1,825 (US$ 235) per angler. Out of this,approximately 60% (N$ 43,000; US$ 5,547, or N$ 1,075;US$ 139, per angler) were spent locally. The organisers’budget for the event was approximately N$ 55,000 (US$7,097).
Key-words: Fish catch, sport fishery, CPUE, exploitation,selectivity, socio-economic returns, gear use, area use
Tor F. Næsje, Odd T. Sandlund & Eva B. Thorstad,Norwegian Institute for Nature Research, Tungasletta 2, NO-7485 Trondheim, Norway
Clinton J. Hay & Servatius Kapirika, Ministry of Fisheries andMarine Resources, Private Bag 2116, Mariental, Namibia
3

Contents
Abstract ...........................................................................................................3
Contents ..........................................................................................................4
Preface .............................................................................................................5
1 Introduction.................................................................................................5
2 Study area....................................................................................................6
3 Material and methods ................................................................................8
3.1 The arrangement and participation ..........................................................8
3.2 Pre-competition communication with fishermen ......................................8
3.3 Sampling programme ..............................................................................9
3.4 MFMR fish survey and importance of species ...........................................9
4 Results........................................................................................................10
4.1 Anglers ..................................................................................................10
4.2 Equipment and river section used ..........................................................10
4.3 Weight and number of fish caught ........................................................10
4.4 Relative importance of species ...............................................................13
4.5 Sexual maturation of fish species ...........................................................15
4.7 Economic aspects of the competition.....................................................20
5 Discussion...................................................................................................23
6 References..................................................................................................25
Annex ............................................................................................................27
nina•niku Project Report 014
4

Preface The White Paper «Responsible Management of the InlandFisheries of Namibia» was finalised in December 1995, andforms the basis for a new law and regulations concerningfish resources management in the different freshwater sys-tems in Namibia. These have the objectives of ensuring asustainable and optimal utilisation of the freshwaterresources, and to favour utilisation of fish resources by sub-sistence households over commercialisation. The ZambeziRiver is one of the most important of the perennial rivers inNamibia, and freshwater fish are a very important foodsource for local inhabitants. The exploitation of fishresources in the river may be classified into three categories:subsistence, commercial and recreational fisheries. Fishingcompetitions are an important part of the recreational fish-eries. The objectives of this report are to document the eco-logical and socio-economical impact of a fishing competi-tion in the Namibian sector of the Zambezi River held duringlow water. The results from this study will be incorporatedin a later report where we will give applicable guidelines forregulations of the inland fisheries in the Zambezi River. Thestudies of the fish resources and the utilisation of the fishpopulations will further enable the Ministry of Fisheries andMarine Resources to implement the proposed law and regu-lations necessary for sustainable management of the fishresources in the river.
This project has been a collaboration between FreshwaterFish Institute of the Ministry of Fisheries and MarineResources (MFMR), Namibia, and the Norwegian Institutefor Nature Research (NINA). The work has received eco-nomic support from the Norwegian Agency for Develop-ment Cooperation (NORAD), MFMR and NINA. We wouldlike to express our sincere thanks to all the participants inthe competition, and the organisers Doug Wegner, StrijsCoertzen, Dirk Roets, Lue Scheepers and Tommy Rocher fortheir collaboration. We would also like to thank Rolly andNicoline Thomson for extensive help during our stay inCaprivi. We are also thankful to Finn Økland, RandiSaksgård, Knut Kringstad, Kari Sivertsen, and the Depart-ment of Water Affairs, Namibia, for giving valuable helpwith the report. Øystein Aas provided valuable commentson an earlier draft of the report.
Windhoek and Trondheim, March 2001
Clinton J. Hay Tor F. NæsjeProject leader, MFMR Project leader, NINA
nina•niku Project Report 014
1 IntroductionTourism and recreational activities are important elementsbringing new income opportunities and economic activitiesto rural areas in Africa and elsewhere. Along the greatAfrican rivers, angling opportunities are excellent andamong the most important attractants for tourists. Togetherwith wildlife viewing, angling forms one of the foundationsfor numerous tourist lodges and other businesses cateringfor the needs of tourists. This is also the case in Namibia,particularly in the eastern Caprivi. Both the Zambezi and theChobe Rivers have a large number of excellent fish speciesfor the recreational fishermen, such as tigerfish (Hydrocynusvittatus) and nembwe (Serranochromis robustus). Thetourist establishments usually provide jobs and incomeopportunities to the local community. Thus, angling differsfrom the subsistence fisheries, particularly because it bringsmoney instead of food to the local communities.
Angling may to a certain extent compete with subsistenceand commercial fisheries for the same fish resources.Although subsistence fisheries do not only target the largeindividuals of the attractive angling species of fish, heavysubsistence fisheries and commercial fisheries may depletethe fish stocks so that there are very few large fish left (Hayet al. 2000). Tourist and sport fishing activities may alsoexert a considerable fishing pressure on the local fishingstocks and attractive fishing species for local fisherfolk. Inaddition, the exercise of subsistence and commercial fish-eries, for example when gill nets and seines are used, mayalso create hindrance for angling activities, and vice versa, asfor example the use of speedboats and angling gear maycreate problems for the traditional fishing activities.
Angling may be an important element in the utilisation ofthe fish stocks in the Namibian rivers. In particular, anglingcompetitions attract many people and may mean a substan-tial harvest of fish over a few days. Still, very little is knownabout the economic and ecological impacts of fishing com-petitions in this area. Hence, as background data for a man-agement plan for utilisation of the fish resources in Zambezi,it is imperative to study the possible impact of the recre-ational fisheries.
This report describes a fishing competition in the Namibianpart of the Zambezi River from 14 to 16 September 2000.Information was collected regarding socio-economic aspectsof the participants, their catch, fishing methods and effort,the geographical areas fished, and the biological character-istics of their catches.
5

2 Study areaWithin Africa, Namibia’s climate is second in aridity only toSahara. The country’s average annual rainfall is less than250 mm, and the mean annual evaporation may be as highas 3,700 mm in some areas. Steep gradients characterisethe rainfall in Namibia, from tropical semi-humid in ourstudy area in the northeast (Caprivi) to hyper arid in thewest (Blackie et al. 1998). Sixty nine percent of the countryis regarded as semi-arid.
The Kwando - Linyanti and Zambezi – Chobe river systemsin north-eastern Namibia have gentle gradients and exten-sive seasonal flood plains, backwaters and seasonal and per-manent swamps. In years with high flooding, which hap-pened regularly in the period 1947 – 1981, the systems areinter-linked and large parts of the eastern Caprivi become alarge flood plain filling the presently desiccated LakeLiambezi.
The annual flood cycle of the Zambezi River reflects the sea-sonal rainfall in the catchment area. The water level usuallyreaches its peak during March, April and May with lowwater levels during September - November. Mean annualflows may vary from less than 500 m3/s to more than 2000m3/s. The low water period has a concentration effect onthe fish resource when the water is mainly restricted to themain stream, channels and some back water habitats. Floodplain habitats only become inundated during the summermonths when the water level starts to rise. The length of theperiod these flood plains are submerged depends on theduration and magnitude of the flood. Certain fish speciesmigrate onto these flood plains to feed or spawn during dif-ferent times of the flood cycle (Welcomme 1979), and mostNamibian fish species (78 %) are floodplain dependent forlarval and juvenile stages and migrate between flood plainsand the main river (Barnard 1998).
The angling competition described in this report was basedat the Kalimbeza Fishing Camp, situated on the KalimbezaChannel, which is a side channel of the Zambezi Riverapproximately 30 km downstream from Katima Mulilo (fig-ure 1). In this area the border between Namibia and Zambiafollows the Zambezi River, with the deepest part of the riverforming the borderline. The anglers in the competition wereinstructed to restrict their fishing activities to the Namibianside of the river.
The competition was held during the low water period(September) which restricted the fish to the main stream,channels and backwater habitats. In this area, the ZambeziRiver had a mean annual water discharge of 921 m3/s inyear 2000, and the mean discharge was 236 m3/s inSeptember 2000 (Department of Water Affairs, Namibia).
nina•niku Project Report 014
6

nina•niku Project Report 014
7
17°
18° 1
5'26
°26°
10 k
m
17°24
°
24°
18°1
5'
Kal
imbe
zaIs
land
Kat
ima
Mul
ilo
Vic
tori
a Fa
lls
Kaz
ungu
la
Kas
ane
ZIM
BABW
E
BOTS
WA
NA
ZAM
BIA
NA
MIB
IAIm
palil
a Is
land
N
KENY
A
ETHI
OPI
A
SUDA
N
EGYP
T
NIGE
RM
AURI
TANI
AM
ALI
NIGE
RIA
SOM
ALIA
NAM
IBIA
LIBY
A
CHAD SO
UTH
AFRI
CA
TANZ
ANIA
ZAIR
E ZAM
BIA
BOTS
WAN
AZIM
BABW
E
ANGO
LA
ALGE
RIA
MAD
AGAS
CAR
MO
ZAM
BIQ
UE
So
uth
Atl
anti
c
Ind
ian
Oce
an
Figure 1. The Zambezi River in the north-eastern Namibia where the fishing competition was held 14 - 16September 2000. The competition was based at Kalimbeza Channel.

3 Material and methods
3.1 The arrangement and participation
The Nwanyi Millennium Open Fishing Competition wasorganised by the Nwanyi Angling Club, Katima Mulilo. TheClub has been organising fishing competitions for theirmembers as often as once a month since 1986, but this wastheir first arrangement of an open, international competi-tion. However, various lodges in the area have previouslyarranged similar events.
The invitation (see annex 1) was distributed widely toangling clubs, sports shops, etc. The response to the invita-tion was lower than expected (approximately 50 %), mostlikely due to hostile activities along the Angolan border.Many potential participants might have declined the invita-tion because they did not want to travel in military convoythrough Western Caprivi.
In total, 40 participants registered as 4 person teams, i.e.,10 teams. Most teams consisted of two boats, with two per-sons in each boat. The rules permitted two rods in use perperson at the same time, and two hooks per rod. Nineteenspeedboats were used in the competition. The competitionfishing period lasted from 0600 to 1800 hrs the first andsecond day, and from 0600 to 1600 hrs the third day.Weighing and recording of the catches were done at theKalimbeza Fishing Camp. Dr. Clinton Hay, Ministry ofFisheries and Marine Resources, was the weigh master andresponsible for identifying species. The organisers of thecompetition did not restrict the allowed fishing area insideNamibia. Thus, the Namibian side of a 148 km long sectionof the river was available to the participants.
nina•niku Project Report 014
The rules for fishing competitions in this area have changedover the years. Presently, there is a bag limit per species orgroup of species (table 1, annex 2). Within each speciesthere is a minimum size of fish that may be entered in thecompetition, and the anglers are encouraged to release allfish below the weight limits. The rules and regulations ofthe competition were communicated to the team captainsat the ”Captains’ Meeting” on the evening before the startof the event.
The competition rules encourage catching few and largefish, with points given according to the size of individualfish. However, the fishing activity may wound and kill morefish than recorded in the competition, and, hence, the num-ber of fish caught exceed the bag limit. During this year’sevent, we recorded and sampled this additional catch. Inaddition, boat captains recorded the species and approxi-mate weights of all fish caught, including those releasedback into the river. This facilitates a fairly reliable estimate ofthe total outtake of fish during the competition.
3.2 Pre-competition communicationwith fishermen
Through close contact with the organisers prior to theevent, we were able to provide information to the partici-pants at the Captains’ Meeting. In addition to some generalinformation on the fisheries investigations of MFMR in theZambezi River, we informed more specifically about theobjectives of the investigation on the fishing competition.All captains were handed a notebook to record their totalcatch. On each fish they were asked to record species,
8
Table 1. Minimum weight of fish allowed to be recorded in the competition and maximum number of fish to be recorded per dayof the relevant species or species groups in the Nwanyi Millennium Open Fishing Competition in 2000.
Species Min. weight No. of fish allowed
Threespot tilapia Oreochromis andersonii 1.0 kgNembwe Serranochromis robustus 1.5 kgHumpback largemouth Serranochromis altus 1.0 kgThinface largemouth Serranochromis angusticeps 0.5 kg A total of 10 bream, Green happy Sargochromis codringtonii 0.5 kg irrespective of fish speciesPink happy Sargochromis giardi 0.5 kgGreenhead tilapia Oreochromis macrochir 0.5 kgRedbreast tilapia Tilapia rendalli 0.5 kg
Catfish (“Barbel”)* Clarias gariepinus or ngamensis 3.0 kg 3 fish
Squeaker * Synodontis spp. 0.15 kg 3 fish
Tigerfish Hydrocynus vittatus 2.5 kg 4 fish
* The competition rules did not distinguish between the two large catfish species nor the seven species of squeakers.

approximate weight, whether the fish was caught whiletrolling or lying stationary, and if the fish was kept (i.e.killed) or released.
The captains were also requested to provide information onthe home addresses of their team members, the number ofparticipants on their teams, the number of accompanyingpersons, their type of accommodation during the competi-tion, and their length of stay in the area. This informationfacilitated an estimate of the economic investment by com-petitors to participate in the event in terms of travelling,accommodation costs, and the amount of money spent inthe local area.
3.3 Sampling programme
The river was patrolled during all three days of the competi-tion in order to record the section of the river utilised by thecompeting anglers. The position of each boat was recordedwith GPS. The number of fishermen aboard, the number ofrods in use, and their method of fishing (trolling or station-ary) were noted. The fish caught in the competition wereweight and length measured, sexed and the maturity stagedetermined every evening after the competitors hadreturned to the base. The catches were recorded through 1)the captains’ reports, 2) the recording of fish for the compe-tition, and 3) by measuring, weighing and sampling all sur-plus fish that were brought to land, but not entered in thecompetition.
3.4 MFMR fish survey and importanceof species
Ministry of Fisheries and Marine Resources has been survey-ing the fish populations in the Namibian part of the ZambeziRiver at high and low water annually since 1997. One of thegoals of these studies has been to describe the fish popula-tions and fish resources in the river. Survey gillnets of differ-ent mesh sizes and numerous other gears such as seines, dipnets, traps and rotenone, have been used to sample the fishpopulations. In this survey, all together 75 fish species havebeen found in the area of the fishing competition.
To evaluate the effects of different forms of exploitation, forexample subsistence or recreation fisheries, it is important toknow which part of the fish population that is exploited,and the proportions of mature individuals caught. An“index of relative importance”, IRI, (equation 1) (Pinkas etal. 1971, Caddy & Sharp 1986, Kolding 1989, 1999) may beused to find the most important species in the catches fromdifferent sampling localities. This index is a measure of rela-tive abundance or commonness of the different species inthe catch, and is calculated as:
nina•niku Project Report 014
% IRI = ((% Ni + % Wi) * % Fi / (% Nj + % Wj) * % Fj) * 100 (1)
where j = 1 – S, % Ni and % Wi is percentage number andweight, respectively, of each species in the total catch, % Fiis percentage frequency of occurrence of each species in thetotal number of settings, and S is the total number ofspecies.
9

4 Results4.1 Anglers
With a few exceptions, all the 40 participants fished all daysand most of the allowed fishing time (annex 3). Most of theparticipants (85%) lived in Namibia, mainly in Katima Mulilo,Windhoek, and Rundu, while some participants were fromZambia and Zimbabwe (Victoria Falls) (table 2). All theanglers in three four-person teams were residents of KatimaMulilo, whereas two teams were from Windhoek and onefrom Rundu. Two teams had mixed crews, originating inKatima Mulilo and Windhoek, and Katima Mulilo andVictoria Falls, respectively. . The remaining two teams weremixed crews from Zambia/Zimbabwe, and from Windhoekand the Namibian coast (Swakopmund and Henties Bay). Ofthe non-resident participants, 67% stayed at camping sites,and 17% at local lodges, and 17% with friends and relativesin the area. Persons not participating in the competitionaccompanied some of the non-resident anglers. Accordingto our information, there were five accompanying persons(i.e., approximately 0.2 accompanying persons per non-resi-dent angler). This number, however, might have been larger.The accompanying persons were mainly spouse and childrenof the anglers and helping hands. The length of stay for non-resident anglers varied from 4 to 14 days, with a mean of 6.8days.
4.2 Equipment and river section used
The 19 boats used were small (15 - 20 feet) open boats withoutboard engines. The engine size varied between 25 and85 hp, while one boat had 2 x 60 hp engines. The majorityof engines (12 of 19 boats) were 60 - 85 hp. The reason forthe relatively large engines on the small boats is the largedistances often travelled by fishermen on the rivers.However, larger boats would also be ill suited to the shallowstretches in many sections of the river during low water.
nina•niku Project Report 014
The number of persons per boat during the competitionwas usually 2, although one boat had 4 persons fishing.Normally, each person fished with one rod. Mainly threemethods of fishing were seen: 1) trolling with slow-movingboat and two (occasionally three) lures trailing the boat; 2)spinning with lures from a stationary boat or from land; and3) baiting with worms from a stationary boat or from land.
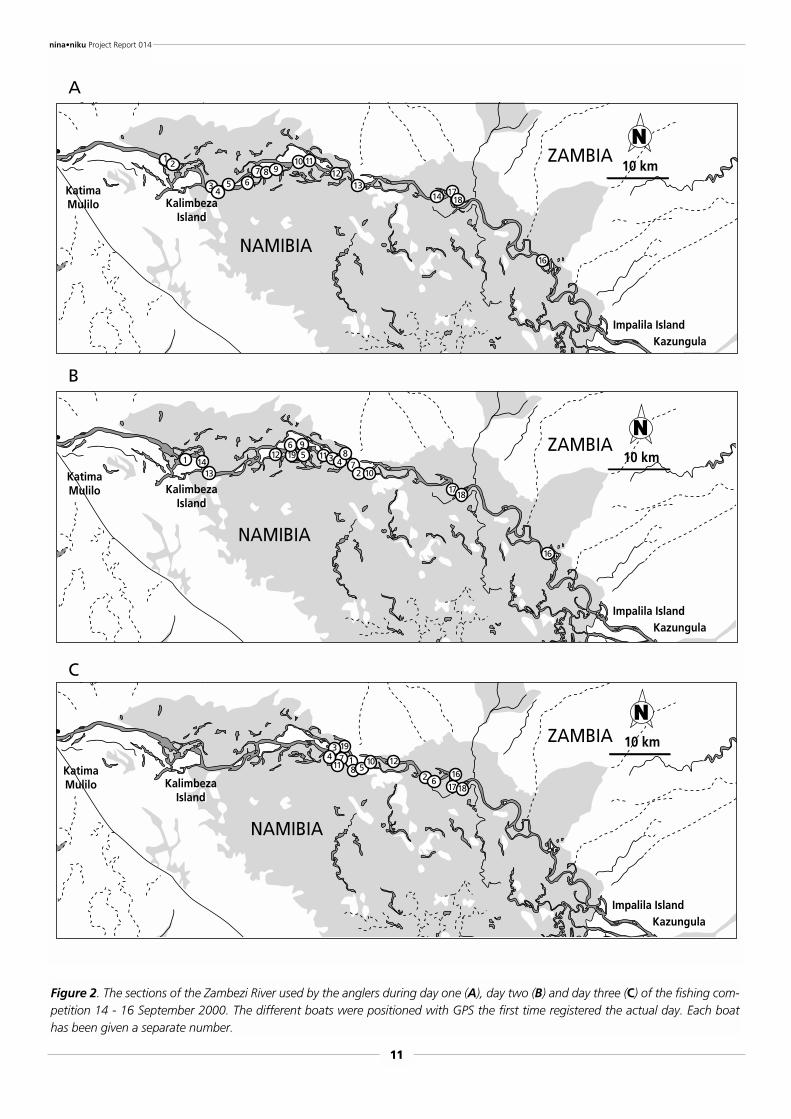
According to the GPS recorded positions of boats during thecompetition, the participants used the same 84 km longriver stretch the first two days (figure 2). The river stretchused the third day was much smaller, only 24 km. The thirdday, however, the participants travelled 30 km downstreamto reach this fishing area.
Based on the fishing reports filled in by the boat captains(totally 40 day-reports) 70% of the teams caught fish bothduring trolling and stationary fishing, while 20% only caughtfish while trolling and 10% only during stationary fishing.
4.3 Weight and number of fish caught
All together, 13 species or species groups were caught dur-ing the competition (table 3). Nine of these were cichlids(breams). Sharptooth catfish and tigerfish were also impor-tant species. A number of species of squeakers werecaught, but only the spotted squeaker (Synodontis nigro-maculatus) was identified to species level. The other speciesin this genus were pooled.
A total of 538 fish were brought ashore during the three-day competition (table 3). The species, numbers andapproximate weight of released fish were reported by 9 ofthe 10 teams in the competition. According to thesereports, a minimum of 293 fish were caught and released bythe participants (table 3).
Catches in numbers were similar the first two days (202 and201 fish), whereas the shorter third day yielded a lower catch(135 fish). This was also true if the catches are adjusted forthe actual number of fishing hours, as the total catch per uniteffort (CPUE) were 16.8, 16.7 and 13.5 fish per hour duringthe three days, respectively. The dominant species in terms ofnumber of fish were nembwe (179 fish, 33 % of total catch),sharptooth catfish (barbel) (99 fish, 18 %) and spottedsqueaker (71 fish, 13 %) (table 3). The cichlids green happy,thinface and brownspot largemouth were only caught in lownumbers (1-5 fish). The relative proportions of fish species inthe catches were the same if we include released fish.
The fishermen use different methods and tackles to catchdifferent fish species. Nembwe and tigerfish were mainlycaught trolling with spoons and solid tackle, while the restof the cichlids were caught both trolling with spinners andlying still using light tackle with spinners or worms. Catfish
10
Table 2. Place of origin of participants in the angling com-petition 14 - 16 September 2000 in the Zambezi River.
Place of origin No. of participants Percent
Katima Mulilo 16 40Windhoek 12 30Rundu 4 10The Namibian coast 2 5Zimbabwe 4 10Zambia 2 5
Total 40 100
nina•niku Project Report 014
11
Figure 2. The sections of the Zambezi River used by the anglers during day one (A), day two (B) and day three (C) of the fishing com-petition 14 - 16 September 2000. The different boats were positioned with GPS the first time registered the actual day. Each boathas been given a separate number.
10 km
KalimbezaIsland
KatimaMulilo
Kazungula
ZAMBIA
NAMIBIA
Impalila Island
N1 2
34
5 67 8 9
1012
1314 17
18
16
11
A
10 km
KalimbezaIsland
KatimaMulilo
Kazungula
NAMIBIA
Impalila Island
N
1711 8 5
10 12
2 616
1718
1934
ZAMBIA
C
10 km
KalimbezaIsland
KatimaMulilo
Kazungula
ZAMBIA
NAMIBIA
Impalila Island
N1 14
13
12 196 9
5 113 48
72 10
1718
16
B

nina•niku Project Report 014
12
Table 3. Total number of fish caught and weighted in the competition (Tot. comp.), 14 - 16 September 2000, and the minimumnumber of fish caught and released during the competition (Released).
Date 14. 15. 16. Tot. comp. ReleasedSpecies Number of fish
Sharptooth catfish* Clarias gariepinus 40 40 19 99 13Tigerfish Hydrocynus vittatus 14 8 7 29 33Nembwe Serranochromis robustus 67 64 48 179 77Threespot tilapia Oreochromis andersonii 16 10 8 34 6Redbreast tilapia Tilapia rendalli 15 9 7 31 1Humpback largemouth Serranochromis altus 5 4 11 20 1Pink happy Sargochromis giardi 2 11 6 19 2Greenhead tilapia Oreochromis macrochir 7 4 2 13 2Green happy Sargochromis codringtonii 2 2 1 5Thinface largemouth Serranochromis angusticeps 2 1 0 3 3Brownspot largemouth Serranochromis thumbergi 1 0 0 1Spotted squeaker Synodontis nigromaculatus 19 32 20 71 155Squeakers Synodontis spp 12 16 6 34
Total 202 201 135 538 293
* All catfish caught were identified as sharptooth.
Table 4. Recorded weight of catches (kg) during the competition (Tot. comp.), 14 - 16 September 2000, and the estimated weightof released fish (Released).
Date 14. 15. 16. Tot. comp. ReleasedSpecies Weight (kg)
Sharptooth catfish Clarias gariepinus 175.9 173.1 114.2 463.2 32.6Tigerfish Hydrocynus vittatus 61.1 20.6 16.8 98.5 25.6Nembwe Serranochromis robustus 114.3 113.5 84.4 312.2 85.0Threespot tilapia Oreochromis andersonii 16.1 14.6 8.6 39.2 4.6Humpback largemouth Serranochromis altus 6.3 6.3 15.8 28.3 0.8Redbreast tilapia Tilapia rendalli 14.3 6.3 3.8 24.4 0.4Pink happy Sargochromis giardi 2.0 11.7 6.7 20.3 1.1Greenhead tilapia Oreochromis macrochir 3.6 2.8 1.0 7.4 0.8Green happy Sargochromis codringtonii 1.3 1.3 0.1 3.7Thinface largemouth Serranochromis angusticeps 2.2 1.2 0.0 3.4 2.9Brownspot largemouth Serranochromis thumbergi 1.0 0.0 0.0 1.0Spotted squeaker Synodontis nigromaculatus 3.0 5.2 3.5 11.8 17.7Squeakers Synodontis spp 1.7 1.9 0.9 4.6
Total 402.8 358.5 255.8 1018.0 171.5
were caught both lying stationary and trolling with solidtackle, while squeakers were caught lying stationary fishingwith worms or other forms of bait.
In terms of weight, 1018 kg of fish was recorded in thecompetition (table 4). Catch per day decreased from 403kg the first day, to 359 kg the second day and 256 kg thelast day. Dominating species by weight were sharptoothcatfish (463 kg), and nembwe (312 kg), constituting more
than 46 % and 31 % of the total catch, respectively.Tigerfish constituted 10 %, while none of the other speciesrepresented more than 5 %.
The weight of the total catch, including both killed andreleased fish, was estimated to minimum 1190 kg of fish, ora mean of 30 kg per participant. Each participant caught anaverage of 0.88 kg fish per hour of allowed fishing time.

nina•niku Project Report 014
13
The size of fish brought ashore reflects that the participantswould only bring ashore point-giving fish. The highest meanweight was recorded for sharptooth catfish at 4.7 kg,whereas tigerfish entered in the competition had a meansize of 3.4 kg (table 5). The cichlids with the largest meanweight were nembwe (1.7 kg) and humpback largemouth(1.4 kg).
The individual catches and results from the fishing competi-tion varied largely between the participants (annex 3). Noparticipants managed to fill their daily competition quota for
any species or species group, with the exception of 13 day-catches of catfish and 5 day-catches of squeaker.
Only one person did not catch any fish during the three daysof fishing. The maximum average score was 54 points dur-ing the three days. Maximum attained day score was 66points. Most people (28 %) got an average score of 0 – 10points, and more than 50 % of the participants gotbetween 0 and 20 points (figure 3). The mean score perperson declined from the 0 – 10 point group (13 persons) tothe 50 – 60 points group (1 person).
4.4 Relative importance of species
As an expression of the selectivity of the sport fishery orwhich part of the fishing populations they exploited, we cancompare the species composition (IRI) in the catches fromthe competition (September) with the fish populations inthe river at low water (September – November) (figure 4and table 6).
The relative importance (IRI) of fish species caught in thecompetition was very different from the distribution of fishspecies found in the fish survey. Most strikingly, four out ofthe 13 species or species groups caught during the competi-tion were not at all registered in the fishing survey in thesame area. These were redbreast tilapia, pink happy, greenhappy and brownspot largemouth (table 6). Most impor-tant of the fish species caught in the competition, accordingto the index of relative importance (IRI %), were nembwe(42 %), catfish (20 %), and tigerfish (17 %), representing79 out of 100 %. While important species/species groups inboth fisheries, were Synodontis spp. (IRI: ranked 2 and 9)and tigerfish (IRI: ranked 3 and 3). In the fish survey, thesmall striped robber (Brycinus lateralis) was most important
Table 5. Mean weight (kg) of the various species in recorded catches during each day of the competition, 14 - 16 September2000, and in the total catch. Released fish are not included. Only species represented by more than ten individuals have beenincluded (see table 3).
Date 14. 15. 16. TotalSpecies Mean weight (kg)
Sharptooth catfish Clarias gariepinus 4.40 4.33 6.01 4.68Tigerfish Hydrocynus vittatus 4.36 2.58 2.40 3.40Threespot tilapia Oreochromis andersonii 1.01 1.46 1.08 1.15Greenhead tilapia Oreochromis macrochir 0.51 0.70 0.50 0.57Pink happy Sargochromis giardi 1.00 1.06 1.12 1.07Humpback largemouth Serranochromis altus 1.26 1.58 1.44 1.42Nembwe Serranochromis robustus 1.71 1.77 1.76 1.74Redbreast tilapia Tilapia rendalli 0.95 0.70 0.54 0.79Spotted squeaker Synodontis nigromaculatus 0.16 0.16 0.18 0.17Squeakers Synodontis spp. 0.14 0.12 0.15 0.14
0
2
4
6
8
10
12
0-10 11-20 21-30 31-40 41-50 51-60
Mean points per person
Num
ber
of p
erso
ns
Figure 3. Mean number of points scored per day by the partici-pants in the fishing competition 14 - 16 September 2000 in theZambezi River.

nina•niku Project Report 014
14
24 25 12 18 18 11 7 13 1244 64.436.33
135
35
25
25
15
15
30
30
20
20
10
10
5
50
35
4540
35
25
25
15
15
30
30
20
20
10
10
5
50
2 3 4 5 6 7 8 9
Gillnets and other gears123456789
1011
Brycinaus lateralisSynodontis spp.Hydrocynus vittatusBarbus poechiiPharyngochromis acuticepsMarcusenius macrolepidotyusTilapia sparrmaniiBarbus radiatusSchlbe intermediusHepsetus odoeMicralestes acutidens
1 23
4 56 7
8 9
Frequency (%)
(No. species = 64)
Wei
ght
(%)
Num
ber
(%)
Fishing competition123456789
10
Serranochromis robustusClarias gariepinusHydrocynus vittatusSynodontis nigromaculatusTilapia rendalliOreochromis andersoniiSerranochromis altusSargochromis giardiSynodontis spp.Oreochromis macrochir
(No. species = 13)
15
1
1
2
2
3
3
4
4
5
5
6
6
7
7
8
8
9
9
10
10
. . .
7 22 7 10 10 107 7 7 7 7.
Frequency (%)
Wei
ght
(%)
Num
ber
(%)
A
B
Figure 4. Index of relative importance (IRI, see equation 1) as a measure of the most important species in A) MFMR surveys atKatima Mulilo and Kalambeza Island, Zambezi, at low water in the years 1997 – 2000, and B) in the fishing competition 14 –19 September, 2000. Frequency (%) = frequency of occurrence, Weight (%) = weight percent of total catch, Number (%) =numeric percent of total catch.

nina•niku Project Report 014
15
species (IRI: 39 %). Both the tigerfish and the squeakersaccounted for a higher percentage weight in the fish surveythan in the fishing competition.
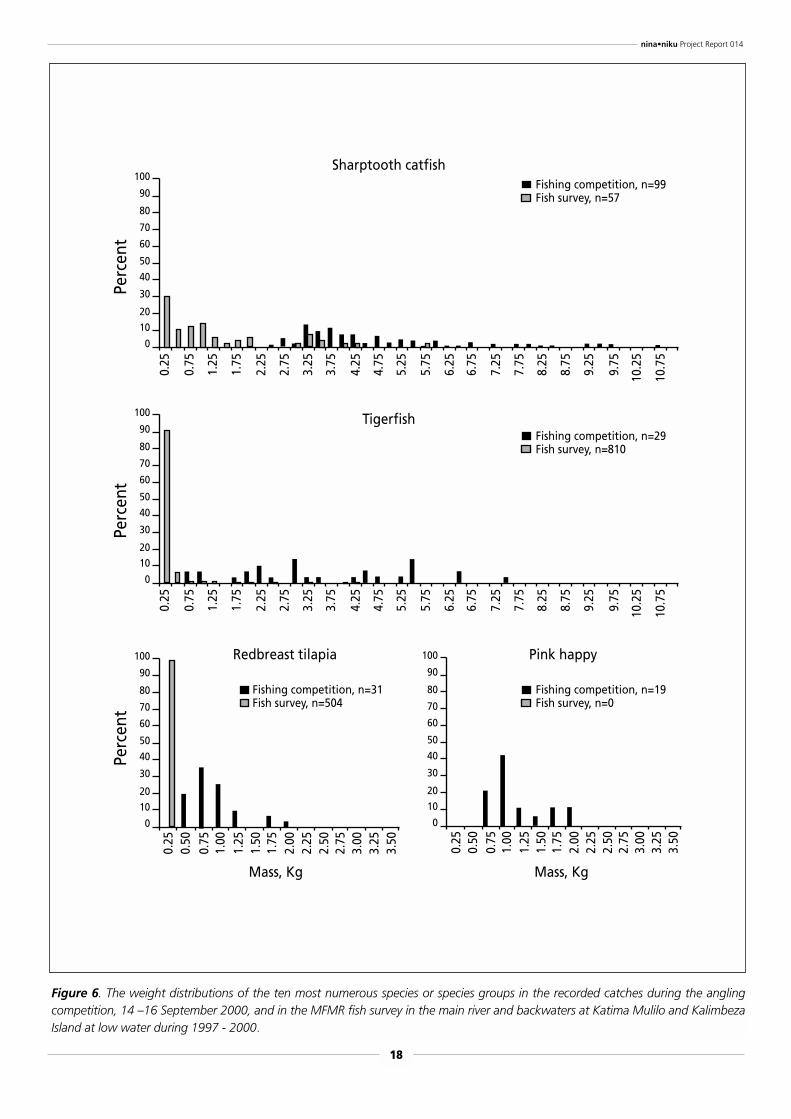
The weight and length distributions of the ten most numer-ous species or species groups in the recorded catches duringthe angling competition and in the MFMR fish survey in theZambezi River are shown in figure 5 and figure 6, respec-tively. In general, the fish caught in the fishing competitionwere larger than the fish caught in the fish survey. For allspecies, some or several specimens caught during the com-petition were larger than the largest specimens caught dur-ing the MFMR survey, with the exception of the Synodontisspecies.
The size of fish within the different species caught in thecompetition varied largely. Sharptooth catfish and tigerfishweighted from 2.3 to 9.7 kg and from 1.0 to 7.5 kg, respec-
tively (figure 6). The cichlids also varied in size, and speci-mens of more than 2.0 kg were caught for nembwe, hump-back thinface and threespot tilapia. Maximum sizesrecorded for these three species during the competitionwere 3.0 kg, 2.6 kg and 2.5 kg, respectively. The largestredbreast tilapia was 1.8 kg, whereas the largest pink happyand greenhead tilapia were 1.9 kg and 0.9 kg, respectively.Among the less common green happy a specimen of 0.6 kgwas the largest. The largest recorded spotted squeaker was0.36 kg, whereas the largest specimen among the otherSynodontis-species was 0.32 kg.
4.5 Sexual maturation of fish species
Most of the fish caught during the competition were sexu-ally mature (table 7). A possible exception was catfish. Wewere not able to classify the maturity stage of this species,
Table 6. The IRI rank, number (No.), weight (W), frequency (F) and IRI (see equation 1) of fish species or species groups caught inthe competition (No. species = 13), 14 - 16 September 2000, and in the MFMR fish survey in the main river and backwaters atKatima Mulilo and Kalimbeza Island at low water (No. species = 64) from 1997 to 2000. N = Not caught in the fish survey.
Species Fishing competition Fish surveyRank No. % W % F % IRI % Rank No. % W % F % IRI %
Nembwe 1 33.3 31.3 14.6 42.3 27 0.1 1.0 1.1 0.0Barbel 2 17.6 44.5 7.3 20.4 22 0.0 3.5 0.9 0.1Tigerfish 3 7.1 9.8 22.0 16.6 3 1.1 18.2 12.4 8.2Spotted squeaker 4 12.6 1.1 7.3 4.5 23 0.1 0.7 2.1 0.1Redbreast tilapia 5 5.7 2.4 9.8 3.5 N N N N NThreespot tilapia 6 6.0 3.8 7.3 3.2 47 0.0 0.2 0.5 0.0Humpback largemouth 7 3.7 2.9 9.8 2.9 50 0.0 0.1 0.5 0.0Pink happy 8 3.7 2.1 9.8 2.6 N N N N NSqueakers 9 6.0 0.4 7.3 2.1 2 19.4 15.8 24.9 29.7Greenhead tilapia 10 2.3 0.7 7.3 1.0 24 0.2 1.2 1.2 0.1Thinface largemouth 11 0.7 0.5 7.3 0.4 40 0.0 0.4 0.7 0.0Green happy 12 0.9 0.3 7.3 0.4 N N N N NBrownspot largemouth 13 0.2 0.1 2.4 0.0 N N N N N
Table 7. Number of males and females sexed, percent sexually mature fish (%), and minimum lengths of sexually mature individu-als in the catch from the fishing competition 14 – 16 September 2000. This analysis only contain fish we were able to sex. In addi-tion, several unclassified fish were taken away for trophies. We were not able to classify the maturity stage of catfish.
SPECIES Males Females Min. length males Min. length females
Catfish 31 (?) 26 (?)Tigerfish 6 (83 %) 12 (100 %) 37 cm 49 cmThreespot tilapia 7 (100 %) 3 (100 %) 33 cm 31 cmGreenhead tilapia 8 (88 %) 4 (100 %) 26 cm 27 cmNembwe 19 (100 %) 33 (100 %) 41 cm 33 cmRedbreast tilapia 18 (94 %) 1 (100 %) 26 cm 28 cmPink happy 4 (75 %) 5 (100 %) 33 cm 31 cmGreen happy 1 (100 %) 3 (100 %) 30 cm 28 cmSpotted squeaker 14 (100 %) 56 (100 %) 16 cm 17 cm

nina•niku Project Report 014
16
50
40
30
20
10
05 10 20 30 40 50 60 70 80 90 100 105 115110 12015 25 35 45 55 65 75 85 95
Perc
ent
Sharptooth catfish
Tigerfish
Redbreast tilapia Pink happy
Fishing competition, n=99Fish survey, n=59
Fishing competition, n=29Test-fishing, n=838
Fishing competition, n=19Fish survey, n=0
Fishing competition, n=31Fish survey, n=521
5 10 20 30 40 50 60 70 80 90 100 105 115110 12015 25 35 45 55 65 75 85 95
Perc
ent
80
70
60
50
40
30
20
10
0
60
50
40
30
20
10
0
5 10 20 30 40 50 6015 25 35 45 55
Perc
ent
80
70
60
50
40
30
20
10
05 10 20 30 40 50 6015 25 35 45 55
Length, cm Length, cm
Figure 5. The length distributions of the ten most numerous species or species groups in the recorded catches during the anglingcompetition, 14 –16 September 2000, and in the MFMR fish survey in the main river and backwaters at Katima Mulilo and KalimbezaIsland at low water during 1997 - 2000.

nina•niku Project Report 014
17
Perc
ent
Perc
ent
Perc
ent
Length, cm Length, cm
Treespot tilapia Humpback largemouth
Greenhead tilapia Nembwe
Spotted squeaker Squeakers
Fishing competition, n=34Test-fishing, n=7
Fishing competition, n=34Test-fishing, n=47
Fishing competition, n=71Test-fishing, n=23
Fishing competition, n=13Test-fishing, n=185
Fishing competition, n=179Test-fishing, n=24
Fishing competition, n=34Test-fishing, n=1662
05
10
20
30
40
50
60
70
80
10 15 25 35 45 5520 30 40 50 60
0
10
20
30
40
50
60
70
80
0
10
20
30
40
50
60
70
80
0
10
20
30
40
50
60
70
80
10
20
30
40
50
60
70
80
10
20
30
40
50
60
70
80
5 10 15 25 35 45 5520 30 40 50 60
5 10 15 25 35 45 5520 30 40 50 60
05 10 15 25 35 45 5520 30 40 50 60
5 10 15 25 35 45 5520 30 40 50 60
05 10 15 25 35 45 5520 30 40 50 60
Figure 5. Continued
nina•niku Project Report 014
18
Figure 6. The weight distributions of the ten most numerous species or species groups in the recorded catches during the anglingcompetition, 14 –16 September 2000, and in the MFMR fish survey in the main river and backwaters at Katima Mulilo and KalimbezaIsland at low water during 1997 - 2000.
100
90
80
70
60
50
40
30
2010
0
0.25
0.75
1.75
2.75
3.75
4.75
5.75
6.75
7.75
8.75
9.75
10.7
5
1.25
2.25
3.25
4.25
5.25
6.25
7.25
8.25
9.25
10.2
5
100
90
80
70
60
50
40
30
2010
0
100
90
80
70
60
50
40
30
2010
0
Perc
ent
Perc
ent
Perc
ent
0.25
0.25
1.25
0.75
1.75
1.00
2.00
0.50
1.50
2.25
2.75
2.50
3.00
3.25
3.50
100
90
80
70
60
50
40
30
2010
0
0.25
1.25
0.75
1.75
1.00
2.00
0.50
1.50
2.25
2.75
2.50
3.00
3.25
3.50
0.75
1.75
2.75
3.75
4.75
5.75
6.75
7.75
8.75
9.75
10.7
5
1.25
2.25
3.25
4.25
5.25
6.25
7.25
8.25
9.25
10.2
5
Sharptooth catfish
Tigerfish
Redbreast tilapia Pink happy
Fishing competition, n=99Fish survey, n=57
Fishing competition, n=29Fish survey, n=810
Fishing competition, n=19Fish survey, n=0
Fishing competition, n=31Fish survey, n=504
Mass, Kg Mass, Kg

nina•niku Project Report 014
19
Perc
ent
Treespot tilapia Humpback largemouth
Greenhead tilapia Nembwe
Perc
ent
Perc
ent
Mass, Kg
Spotted squeaker
Mass, Kg
Squeakers
0.05 0.10 0.20 0.30 0.40 0.500.15 0.25 0.35 0.45
0
10
20
30
40
50
60
70
80
90
100
0
10
20
30
40
50
60
70
80
90
100
0.25
0.75
0.50
1.00
2.00
3.00
1.50
2.50
3.50
1.25
2.25
3.25
1.75
2.75
0.25
0.75
0.50
1.00
2.00
3.00
1.50
2.50
3.50
1.25
2.25
3.25
1.75
2.75
010
2030
40
50
60
70
80
90
100
0.25
0.75
0.50
1.00
2.00
3.00
1.50
2.50
3.50
1.25
2.25
3.25
1.75
2.75
00.05 0.10 0.20 0.30 0.40 0.500.15 0.25 0.35 0.45
10
2030
40
50
60
70
80
90
100
010
2030
40
50
60
70
80
90
100
0.25
0.75
0.50
1.00
2.00
3.00
1.50
2.50
3.50
1.25
2.25
3.25
1.75
2.75
010
2030
40
50
60
708090
100
Fishing competition, n=34Test-fishing, n=47
Fishing competition, n=20Test-fishing, n=7
Fishing competition, n=13Test-fishing, n=157
Fishing competition, n=179Test-fishing, n=24
Fishing competition, n=71Test-fishing, n=23
Fishing competition, n=34Test-fishing, n=1662
Figure 6. Continue.

nina•niku Project Report 014
20
which was sexed according to external sexual characteris-tics. With the exception of tigerfish and nembwe, the mini-mum size of mature fish was similar for male and females.Among tigerfish the minimum size of mature males weresmallest, while among nembwe the minimum size ofmature females were smallest. For several species therewere a difference in the proportion of the two sexes caughtin the competition. Among tigerfish, nembwe, and spottedsqueaker more females were caught, while more maleswere caught of redbreast tilapia.
4.7 Economic aspects of the competition
The expenses for the participants to be able to take part inthe competition are of at least four types. These are thecompetition entry fee, the travel expenses (fuel, food, andaccommodation), the running costs of boat and equipment,and the cost of food and accommodation while in the area.The investment costs in cars, boats, and other equipmentwere disregarded.
The entry fee for participants in this competition was N$300 (US$ 39) per individual or N$ 1,000 (US$ 129) perteam. Thus, total entry fees were approximately N$ 11,000(US$ 1,419). The fish which were not kept by the anglerswere sold at the fish market in Katima Mulilo, and themoney donated to a local private school bringing an esti-mated value of N$ 4,000 (US$ 516). The prizes weredonated by various private businesses. The top prize was N$5,000 (US$ 645), the second prize was a hi-fi stereo set, andthe third prize was a deep freezer. A large number ofsmaller prizes consisted mainly of fishing and campingequipment. The total value of the prizes was estimated toN$ 50,000 (US$ 6,452).
Long distances were travelled by some of the participants totake part in the competition. The distance from Windhoekto Katima Mulilo by car is approximately 1,200 km. The fuelprice in Namibia in September 2000 was approximately N$3.70 (US$ 0.5) per litre. Most cars used were four wheelsdrives, and they pulled trailers with boats. Thus we mayassume that the driven distance per litre of fuel was 7 km.The estimated fuel cost per kilometre would then be N$0.53 (US$ 0.07), and fuel cost for the round trip Windhoek
Table 8. Estimated cost for participants at the fishing competition 14 – 16 September 2000 in the Zambezi River. The travel expen-ses are calculated as explained in the text. Travel expenses for local anglers travelling between Katima Mulilo and Kalimbeza havebeen excluded. Figures in Namibian dollars (N$) or US dollars (US$).
Angler group No. Entry Travel Food and Boat fuel Total per Totalfee accommodation etc. participantN$ N$ N$ N$ N$ US$ N$ US$
Local 16 300 - - 375 675 87 10800 1394Rundu 4 300 177 2050 375 2902 374 11608 1498Windhoek 12 300 424 1148 375 2247 290 26964 3479Coast 2 300 600 738 375 2013 260 4026 519Zim./Zambia 6 300 124 738 375 1537 198 9222 1190
Total 62620 8080
Table 9. Amount of money spent by the anglers in local shops and tourist facilities. Figuresare in Namibian dollars (N$) and US dollars (US$).
Angler No. Food and Boat fuel Totalgroup accommodation etc.
N$ N$ N$ US$
Local 16 - 375 6000 774Rundu 4 2050 375 9700 1252Windhoek 12 1148 375 18276 2358Coast 2 738 375 2226 287Zim./Zambia 6 738 375 6678 862
Total 42880 5533

nina•niku Project Report 014
21
– Katima Mulilo (approximately 2,400 km) is N$ 1,272 (US$164). Assuming three participants per vehicle, the minimumtravel cost per participant from Windhoek would be N$ 424(US$ 55). The round trip distance from Rundu to KatimaMulilo is approximately 1,000 km. A similar estimate oftransport cost for participants from Rundu yields N$ 177(US$ 23) per participant. For participants living in Zambia(Livingstone) and Zimbabwe (Victoria Falls), a similar calcula-tion of travel costs based on a round trip distance of approx-imately 700 km is N$ 124 (US$ 16) per participant. Thereturn airfare between Windhoek and Katima Mulilo is N$2,046 (US$ 264).
On average, each non-resident participant was accompa-nied by 0.2 non-participants. All visitors stayed in the areaon average 6.8 days. Each non-resident participant andhis/her company therefore stays 8.2 guest days (1.2 x 6.8days = 8.2 days) in the area (see paragraph 4.1 above).Staying at a camping site costs approximately N$ 20 (US$2.60) per person per day. We assume that the cost of foodwhen camping is similar to the per diem rate paid by theNamibian government for field work based on camping,which is N$ 70 per person per day. The cost of staying at alodge is approximately N$ 250 (US$ 32) per day, includingfood. The cost of petrol for the boats was estimated to N$250 (US$ 32) per boat per day, or N$ 125 (US$ 16) per par-ticipant per day. Based on these figures, the total amountspent by the participants on this event was N$ 62,620 (US$8,080), or an average of N$ 1,566 (US$ 202) per partici-pant. These are minimum figures. For instance, some partic-ipants hired a boat costing approximately N$ 600 - 800(US$ 77 - 103) per day, which is significantly more than thecost of boat fuel.
Out of these expenses, the cost of food and accommoda-tion and boat fuel may be spent in local businesses (table9). The total amount spent by the anglers on these serviceswas estimated to N$ 1,072 (US$ 138) per participant, and intotal N$ 42,880 (US$ 5,533).
nina•niku Project Report 014
22
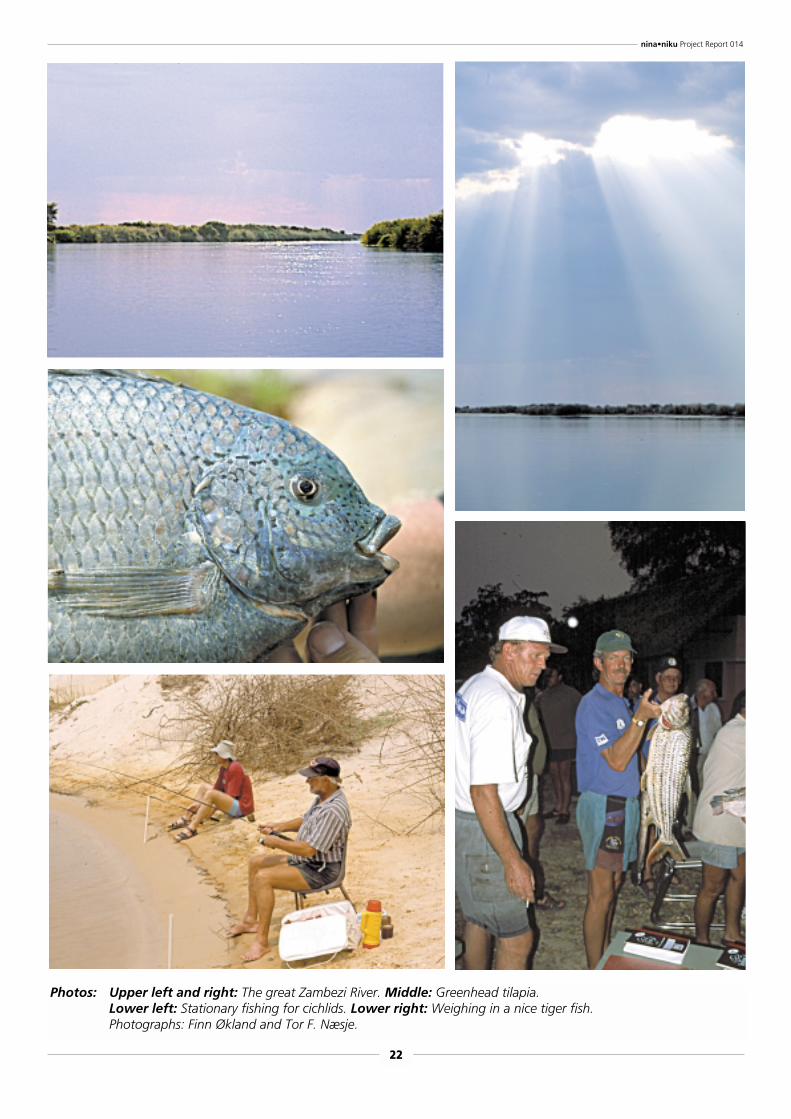
Photos: Upper left and right: The great Zambezi River. Middle: Greenhead tilapia.Lower left: Stationary fishing for cichlids. Lower right: Weighing in a nice tiger fish.Photographs: Finn Økland and Tor F. Næsje.

5 DiscussionBackgroundThe 1995 White Paper “Responsible Management of theInland Fisheries of Namibia” and the draft bill on inland fish-eries have the objectives of ensuring a sustainable and opti-mal utilisation of the freshwater resources. The stated policytakes into consideration the large differences among watersystems in Namibia and proposes adoption of separate man-agement regimes for the various river systems.
The Zambezi River is one of the most important of theperennial rivers in Namibia, and freshwater fish are a veryimportant food source for local inhabitants. The exploitationof fish resources in the river is of three types: subsistencefisheries, commercial fisheries and recreational fisheries.Fishing competitions are an important part of the recre-ational fisheries. This report shows that although the catchof fish can be considerable during a fishing competition, thesocio-economic returns to the local society may also be sig-nificant, and far beyond the value of the fish caught. This ismostly related to the participants’ use of local shops andtourism businesses during the competition.
Fishing competitionForty participants (10 teams) took part in the competition.The total number of participants was approximately half ofwhat was expected from previous years, mainly due to therecent hostile activities in the area. The competition ruleshave been changed through the years and were this yearfocused on catching more species as one additional pointwas given for each species caught. However, the rules hadminimum weights for all species and the points givenincreased with the size of the fish. The daily bag limit of thedifferent species or species groups was not filled by anycompetitors, with the exception of catfish and a few catchesof squeakers. This means that the competitors could targettheir favourite fish species using their favourite methods,and were only to a minor extent restricted by the bag limit.This is also in accordance with the fishermen’s reports show-ing that 70 % of the anglers caught fish both during trollingand stationary fishing, while 20 % and 10 % caught fishonly during trolling or stationary fishing, respectively.
Socio-economicsThe socio-economic aspects of the competition are impor-tant both for the local communities and for the organisers.Local communities benefit from the money spent by partici-pants and their companions in shops, markets, and in localtourist businesses. The organisers evaluate their expensesand their income from participants’ fees and from sponsors.The participants, however, do not evaluate the event in astrict economic sense, but rather consider the competition aspecial experience and as a social event combined with a
nina•niku Project Report 014
holiday, spending money locally on for example food, hous-ing, petrol, and firewood.
The fishing competition reported here was probably relativelysmall in terms of number of participants, as the organisershad expected about twice as many anglers. This demon-strates the vulnerability of such events to political or socialunrest. Without the restrictions imposed by the events inWestern Caprivi, more participants would probably havecome from Windhoek, and possibly also from South Africa.There were only three women among the participants,reflecting that angling is generally a male dominated activity.
In spite of the relatively low number of participants, it illus-trates some of the potentials and distribution of the econ-omy related to this type of nature-based tourism. The totaleconomy for the event amounted to N$ 138,000 (US$17,806), or N$ 3,450 (US$ 445) per angler. The sponsorshave supported the competition with prizes valued atapproximately N$ 50,000 (US$ 6,452), or N$ 1,250 (US$161) per angler. In the past, the prizes have been even moreexpensive, such as a boat with an outboard engine and atrailer. This indicates that companies sponsoring theseevents consider the anglers as an interesting customergroup.
The economic consumption of the participants demon-strates that the willingness to spend money to take part inthis type of event is quite high. On average, the competitioncost each angler N$ 1,825 (US$ 235), which probablyhigher or within the same order of magnitude as a day’sgross salary for the social group represented by the partici-pants. This may be compared with the total averageexpenses paid by anglers fishing for salmon in one of thebest Norwegian salmon rivers, which may be considered arelative exclusive fishery. In 1989, this figure was calculatedat NOK 789 (N$ 658; US$ 85) per day, which was less thanhalf of the estimated daily income for the relatively wealthygroup of anglers fishing in this river (Aas 1991). The Nwanyifishing competition totalled N$ 108,000 (US$ 13,935), anda total of 831 fish were caught. Thus, according to thesefigures, each fish caught in the angling competition gener-ates approximately N$ 130 (US$ 17). Although the figuresare approximate, this indicates that recreational fishing inthe Zambezi River is an attractive activity with a significanteconomic potential.
The segment of the total economy of the event that wasspent in the local community was approximately N$ 43,000(US$ 5,533), or N$ 1,075 (US$ 139) per angler. A significantpart of this was for gasoline and other products that areimported to the region, but it still means support to the localshops and tourist businesses. Calculated as value generatedfor local business per fish caught, it becomes approximatelyN$ 52 (US$ 6.70), excluding the market value of the fish. Atthe fish marked in Katima Mulilo small fish were usually sold
23

for approximately N$ 10 (US$ 1.30), while larger fish weresold for approximately N$ 20 (US$ 2.60). However, breamwere more popular than catfish and tigerfish. Squeakers areseldomly sold at the market. The local market value of thetotal catch from the competition, 831 fish including 260squeakers (total 1,190 kg) would be less than N$ 15,000(US$ 1,935). Thus, in strict monetary terms, the anglingcompetition seems to create significantly more economicactivity than the market price of the fish.
Despite a significant amount of revenues to the local econ-omy from the fishing competition, there are strong indica-tions, both from the economic data in this study and fromgeneral tourism literature, that there is a large potential foran increase in the value for the local community along theZambezi River. Actions that can increase their length of stayin the area and increased use of local businesses comparedto businesses outside the area is two important elements insuch a strategy. Future studies should be conducted togather more information on what types of services andgoods that competitors prefer.
CatchesMinistry of Fisheries and marine Resources has been study-ing the fish resources in the actual part of the Zambezi Riverwhere the fishing competition was held. In this survey atotal of 46.030 individual fish representing 75 fish specieswere sampled. Based on the previous fish surveys in theZambezi River the total weight of the catches in the fishingcompetition was high as 1018 kg (538 fish) were caughtduring the three days competition. The dominating speciesin weight were sharptooth catfish (463 kg) and cichlid nem-bwe (312 kg). In addition, the fishermen released minimum293 fish, being in numbers more than half of the catchbrought ashore.
Only 13 species were caught in the fishing competition, andfour of these species (redbreast tilapia, pink happy, greenhappy, and brownspot largemouth) were species notcaught in the survey in the same area at low water. The rea-son for this is probably that these species live in habitats noteasily sampled with the survey gears. To a large extent theanglers fish in the main current of the river and/or very closeto the vegetation. In these habitats gill nets and other surveygears cannot easily be used. The lack of juveniles of thesefour species in the survey catches may be because the juve-niles live inside the dense vegetation a habitat difficult toaccess with the survey gears. In addition, the sampling gearswere different. In the fishing competition one uses ”attrac-tive” gear (rod and line), with a bait or lure to attract thefish to the gear. The goal of the anglers was to catch thelargest specimens of the target species. The fisheries surveyon the other hand, used both “passive” gears (e.g. gill nets)and “active” gears (e.g. dip nets and seines) to obtain acatch which best possible reflects the species and size com-
nina•niku Project Report 014
position of the fish population present. These differencesmay also explain some of the large differences in size andspecies caught during the competition and in the fish sur-vey. The tigerfish differs from the other fish species in that itwas prominent in both the anglers catches and in the surveycatches. In relative importance (according to % IRI) thetigerfish was number three in both catches. This may bebecause tigerfish utilises all open water habitats, both shal-low and deep water, and consequently is vulnerable to avariety of fishing gears.
The difference between survey catches and the anglers’catches shows that the anglers’ catches are selective, includ-ing only the largest individuals of the various species. Theanglers also catch mainly sexually mature fish, and it may beassumed that the recruitment to the various species stocks isnot much influenced by the anglers’ catches. Unfortunately,we have no data on the species and size composition of thesubsistence and commercial catches. We may expect, how-ever, that the anglers’ catches on average contain larger fishthan both these types of fishing if the subsistence and com-mercial fisheries is based on gillnetting.
The results and the amount of fish caught during the com-petition may give a good indication of the potentialexploitation of the fish resources by recreational fisheries inthe Zambezi River. Although all competitors fished to obtainmaximum points, their ability as anglers varied greatly. Withthe exception of catfish, few participants scored the maxi-mum number of points within the different groups orspecies of fish. Hence, there were a relatively large numberof anglers with a low or moderate catch. Approximately 50% of the anglers scored 0 – 20 points as a daily average, lessthan 1/3 of the best angler. This may indicate that the aver-age angler only catches a few fish during a day fishing onthe river. A few persons, however, are expert fishermen andmay land a considerable catch.
In conclusion, the following points may be highlighted:1. The anglers caught only a few species compared to what
was present in the fish community of the river. Even so,the anglers caught a few cichlid species that were notfound in the survey catches.
2. The anglers caught the largest individuals of the targetspecies.
3. Angling was excellent in this part of the Zambezi River, asthe average catch per hour of fishing was at least 0.88kg.
4. There were large differences in effectiveness among theanglers. Most anglers caught only a few fish, whereas afew anglers were experts and caught many and largefish.
5. Many of the participants in the competition travelled longdistances to participate.
24
6. The mean investment by anglers to be able to participatewas approximately N$ 1,566, of which approximately N$1,072 was spent in the local area.
7. Based on the total economy of this competition (approxi-mately N$ 108,000), each fish caught generates approxi-mately N$ 130. The amount spent in local businesses wasapproximately N$ 43,000, which means that each fishcaught generates N$ 52 for the local economy.
nina•niku Project Report 014
6 ReferencesAas, Ø. 1991. Social science in freshwater fisheries manage-
ment. A literature review. - NINA Utredning 27: 1-44.Barnard, P. (Ed.) 1998. Biological diversity in Namibia: a
country study. - Namibian National Biodiversity TaskForce, Windhoek, 332 pp.
Caddy, J.F. and Sharp, G.D. 1986. An ecological frameworkfor marine fishery investigations. - FAO Fish. Tech. Pap.no. 283, 151 pp.
Hay, C.J., Næsje, T.F., Breistein, J., Hårsaker, K., Kolding, J.,Sandlund, O.T. and van Zyl, B. 2000. Fish populations,gill net selectivity, and artisanal fisheries in the OkavangoRiver, Namibia. Recommendations for a sustainable fish-ery. – NINA–NIKU Project Report 010: 1- 105.
Kolding, J. 1989. The fish resources of Lake Turkana andtheir environment. – Cand. cient. thesis, University ofBergen, Norway, 262 pp.
Kolding, J. 1999. PASGEAR. A data base package for exper-imental or artisanal fishery data from passive gears. Anintroductory manual. - University of Bergen, Dept. ofFisheries and Marine Biology.
Pinkas, L., Oliphant, M.S. and Iverson, I.L.K. 1971. Foodhabits of albacore, bluefin tuna and bonito in Californianwaters. - Fish. Bull. Calif. Dep. Fish and Game 152: 1-105.
Welcomme, R.L. 1979. Fisheries ecology of floodplain rivers.– Longman, London.
25

nina•niku Project Report 014
26
nina•niku Project Report 014
29
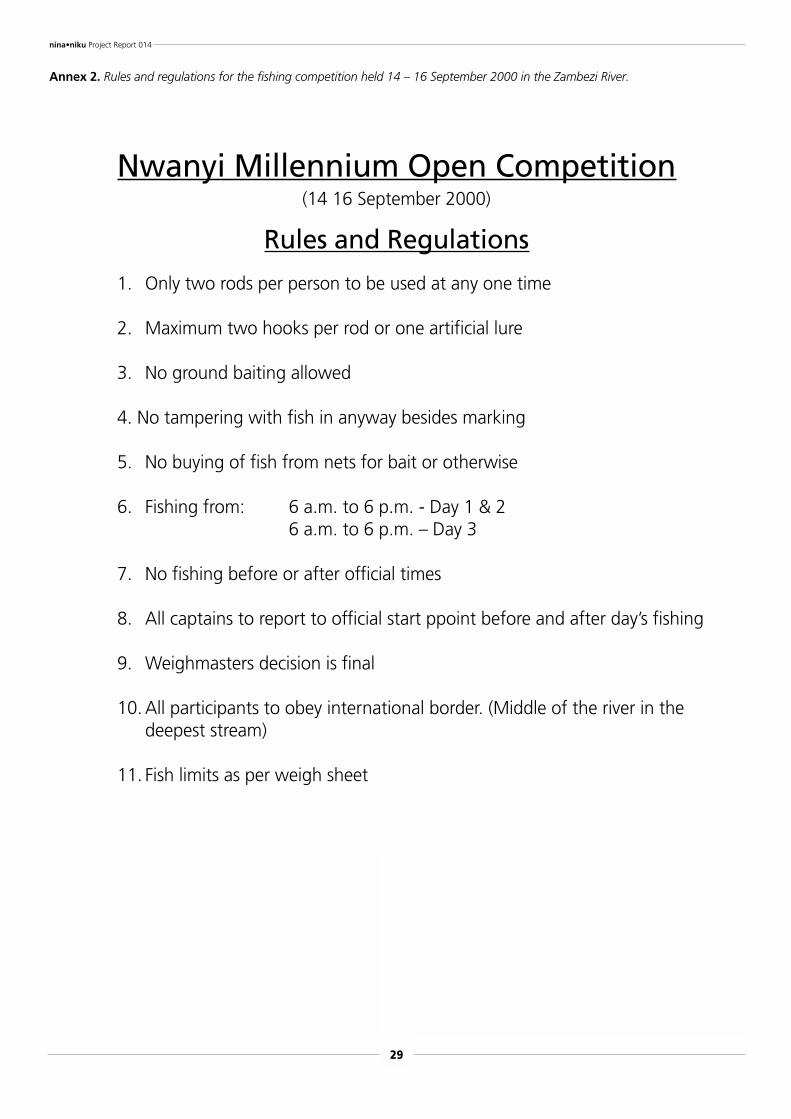
Annex 2. Rules and regulations for the fishing competition held 14 – 16 September 2000 in the Zambezi River.
Nwanyi Millennium Open Competition(14 16 September 2000)
Rules and Regulations
1. Only two rods per person to be used at any one time
2. Maximum two hooks per rod or one artificial lure
3. No ground baiting allowed
4. No tampering with fish in anyway besides marking
5. No buying of fish from nets for bait or otherwise
6. Fishing from: 6 a.m. to 6 p.m. - Day 1 & 26 a.m. to 6 p.m. – Day 3
7. No fishing before or after official times
8. All captains to report to official start ppoint before and after day’s fishing
9. Weighmasters decision is final
10. All participants to obey international border. (Middle of the river in the deepest stream)
11. Fish limits as per weigh sheet

nina•niku Project Report 014
30

nina•niku Project Report 014
31
Annex 3. Results of the fishing competition held 14 – 16 September 2000 in the Zambezi River. The teams and persons are num-bered. S = senior, J = junior (<16 years). Open space for the results means that the person did not participate that day.
Team Particiant Sex Class Day 1 Day 2 Day 3 Mean Points Team sum
Team 1 P1 Male S 12.98 0.00 0.00 4.33 92.04P2 Male S 6.82 0.00 0.00 2.27P3 Male S 22.33 0.00 0.00 7.44P4 Male S 14.48 28.60 6.88 16.65
Team 2 P5 Male S 33.56 Stranded 33.56 76.50P6 Male S 43.24 Stranded 43.24P7 Male S 0.00 Stranded 0.00P8 Male S 0.00 Stranded 0.00
Team 3 P9 Male S 40.54 43.74 47.66 43.98 432.28P10 Male S 18.64 39.22 41.08 32.98P11 Male S 53.02 41.48 29.40 41.30P12 Male S 32.50 30.56 15.00 26.02
Team 4 P13 Male S 6.50 14.84 13.76 11.70 125.03P14 Male S 9.26 0.00 7.28 5.51P15 Male S 10.50 12.38 32.91 18.60P16 Female S 13.60 4.00 8.80
Team 5 P17 Male S 14.30 0.00 17.52 10.61 201.54P18 Male S 22.80 4.30 35.54 20.88P19 Male S 9.64 28.38 11.42 16.48P20 Male S 0.00 28.82 28.82 19.21
Team 6 P21 Male S 30.44 65.85 20.40 38.90 459.69P22 Male S 16.86 47.52 34.08 32.82P23 Male S 50.50 57.50 54.88 54.29P24 Male S 29.20 46.00 6.46 27.22
Team 7 P25 Male S 6.68 23.80 18.36 16.28 227.82P26 Male S 7.00 27.38 12.28 15.55P27 Male S 8.54 45.22 7.98 20.58P28 Male S 31.94 24.48 14.16 23.53
Team 8 P29 Male S 21.08 22.50 21.79 139.26P30 Male S 20.44 0.00 10.22P31 Male S 20.70 27.10 7.18 18.33P32 Male J 20.26 20.26
Team 9 P33 Male S 0.00 0.00 13.22 4.41 122.02P34 Male S 41.96 17.58 35.68 31.74P35 Male S 0.00 0.00 0.00 0.00P36 Female S 4.72 0.00 8.86 4.53
Team 10 P37 Male J 35.32 26.06 20.44 27.27 285.80P38 Male J 21.68 63.14 23.34 36.05P39 Female S 24.82 23.56 18.04 22.14P40 Male J 12.50 16.90 0.00 9.80