Retinal Artery Occlusion Treatment with Hyperbaric Oxygen Retinal ...

JOURNAL OF THE OPTICAL SOCIETY OF AMERICA
Some Comparisons among Spectral Sensitivity Data Obtained in Different RetinalLocations and with Two Sizes of Foveal Stimulus*
HARY G. SPERLrNmt AND YuN HSIALaboratory of Psychology, Columbia University, New York, New York
(Received March 6, 1957)
Relative cone sensitivity measurements were made from 420 my to 700 mu in the spectrum using 42minute and 3 minute diameter test-light fields in the fovea and a 42 minute diameter field at 100 in theperiphery. The data were analyzed with reference to (a) the suggestion that the humps found in the blueregion of the spectrum result from the absorption of macular pigment, (b) changes in the over-all shape of thesensitivity function, and (c) the number of humps in the sensitivity function. Two humps were found below500 mu in the fovea, one in the orange, and possibly two or three between 500 mp and 580 mp. Considerationof the possible origin of the humps favored the conclusion that the humps in the blue region of the spectrumwere contributed to by cone activity, since measurements at 100 in the periphery, where there is no pigment,produced an exaggerated hump in the blue below 470 mp which could only be ascribed to cone activity.Systematic changes in the shape of the functions indicated little change in the long wavelength portion ofthe curves over the three stimulus conditions, but sizable changes in the relative sensitivity to the short wave-lengths. The 100 periphery is increasingly more sensitive than the fovea as wavelengths become shorter than520 mpz, while the 42' foveal area is appreciably more sensitive than the 3' area to blue wavelengths.
ONE basic objective of studies of color vision,within the framework of existing theory, is to add
to the eivdence from which the spectral sensitivity ofthe primary receptors may be derived. Recent examplesof work in this direction have raised for analysis theproblem of hitherto overlooked discontinuities in thephotopic sensitivity (or luminosity) curves.
The international standard luminous efficiency (lumi-nosity) function adopted by the International Commis-sion on Illumination (1931 CIE) is a smooth curve witha single peak at 555 mg. The data of Gibson andTyndall' and of Coblentz and Emerson,2 two sets ofdata on which the CIE standard was based, revealupon close examination the presence of a hump below460 my. More recently Stiles' and Wald4 independentlyobtained data with similar humps near 460 mA. Sloan'and Walters and Wright6 have reported a hump near600 mg in the orange. More recently, Stiles7 and Hsiaand Graham8 have reported curves for five observerswith both the 460-mu and the 600-mM humps.
Stiles7 suggests that these humps, together with themain peak, be related to the individual sensitivitycurves of three primary receptors in view of the tri-chromatic theory. This notion meets with certaindifficulties. First, data by Thomson9 measured at
* This work was supported by a contract between ColumbiaUniversity and the Office of Naval Research.
t Present address: U. S. Naval Medical Research Laboratory,New London, Connecticut.
' K. S. Gibson and K. P. T. Tyndall, Sci. Papers Bur. Standards19, 131, S476 (1923).
2 W. W. Coblentz and W. B. Emerson, Bull. Natl. Bur. Stand-ards 14, 167, S303 (1918-1919).
3 W. S. Stiles, Proc. Phys. Soc. (London) 58, 329 (l944).4 G. Wald, Science 101, 653 (1945).5 L. Sloan, Psychol. Monographs 38, 1 (1928).' H. W. Walters and W. D. Wright, Proc. Roy. Soc. (London)
B131, 340 (1943).7 W. S. Stiles, Ned. Tijdschr. Natuurk. 15, 125 (1949).8 Y. Hsia and C. H. Graham, Proc. Nati. Acad. Sci. 38, 80
(1952).9 L. C. Thomson, J. Physiol. 108, 78 (1949).
absolute threshold in the fovea probably show four orfive humps in addition to the main peak. Thomsonfound the previously observed blue hump that fallsbelow 460 mp and a smaller one between 460 mp and490 m. In addition, he found a previously observedorange hump in the region of 600 mA as well as a smalldiscontinuity in the region of 550 mpA, close to the mainpeak. Wright' and Ishak" have confirmed the existenceof two humps in the blue, one below 460 mg and onebetween 460 mg and 490 m. Hurvich and Jameson'2
and Crozier" also show data with more than 3 humpsfor the fovea. The second difficulty which Stiles'interpretation faces is Wald's proposal,4 also stated byWright,10 that the hump near 460 mpA results from anabsorption peak of the yellow macular pigment. Sucha peak might be expected to reduce transmission suffi-ciently at 460 my to result in the appearance of a humpbelow there. Wald supports his contention with meas-urements of the spectral absorption of an exact ofhuman macular pigment. The data show that a largeabsorption peak occurs at about 460 mgA, and that twolesser peaks may occur below 430 my and at about490 mA. Wright's statement of the pigment explanationderives from his measurements of the spectral sensitivityof tritanopes. Tritanopes, who are generally acceptedto have no blue receptor, nevertheless exhibit the violetand blue humps found with normals. The major differ-e6ce between tritanopic and normal vision appears tobe a reduced relative sensitivity over the entire blueside of the curve below 550 mA for the tritanope. (SeeFig. 7.) When adaptation of the normal eye to bluelight has been employed to temporarily fatigue theresponse of blue receptors,le4l1 both Stiles'4 and Jameson
10 WI D. Wright, J. Opt. Soc. Am. 42, 509 (1952).1' I. G. H. Ishak, J. Opt. Soc. Am. 42, 529 (1952).2L. M. Hurvich and D. Jameson, J. Opt. Soc. Am. 43, 485
(1953).13 W. J. Crozier, J. Gen. Physiol. 34, 87 (1950).4 W. S. Stiles, Union Internationale de Physique Pure et
707
VOLUME 47, NUMBER 8 AUGUST. 1957
H. G. SPERLING AND Y. HSIA
and Hurvich16 show an over-all reduction of sensitivitysimilar to Wright's tritanopes with the humps somewhatreduced but remaining. These data together withWright's comprise good evidence that the humps in theblue are, at least in part, the result of pigmentabsorption.
Another, perhaps more direct, test of the hypothesisthat the blue submaxima result from macular pigmentabsorption involves measurement of cone sensitivitybeyond the limits of the pigmented region. Twoattempts in this direction, by Stiles and Crawford7 andby Wald,4 show conflicting results. Stiles and Crawfordmeasured cone sensitivity at 50 in the parafovea with a1° stimulus against an illuminated white background.The background illumination was sufficiently intense tolight adapt the rods, in an attempt to obtain pure conethresholds. They found that this procedure led to anexaggeration of their blue hump. Wald made measure-ments at 8° from central fixation, first light adapting theregion to a high intensity and thereafter taking valuesfrom the cone plateau of the subsequent dark adapta-tion curve to represent cone thresholds. He found thatthe blue hump disappeared under these conditions andsince little pigment exists at 80, he therefore ascribed thehump found with foveal cones to pigment absorption.It is necessary to note that Wald's data were measuredat widely separated wavelengths. Wald and Auerbach's"7
more recent work shows the presence in peripheral andfoveal vision of a violet hump which they ascribed toreceptor activity.
Weale8 presents data taken at 100 and 15° in theperiphery. The data at 150, show the hump below460 m/u, while the data at 10° do not. These were, how-ever, the results of but one observer. They were takenby a heterochromatic match technique at 2.4 ft-L.Weale's data do show a very pronounced hump between460 and 520 or 530 mu with a decided peak near 480 mu,for both 100 and 150 periphery.
In examining the contribution of macular pigmenta-tion it is important to consider the topographicallocation of the pigment. Only thus may we ascertainwhether in the above studies a pigment free region wasstimulated. Three methods have been used for determin-ing the extent of the pigment: (a) direct histologicalexamination of the retina, (b) determination of thecolorimetric white-point at intervals from fovea toperiphery, and (c) reproduction of the entoptic Maxwellspot. From his review of the histological literature aswell as his own measurements, Polyak'9 concludes thatthe outer boundary of the pigment may reach 80 from
Appliquee, Coloquio sobre Problemas Opticos de la Visi6n,Madrid, 1953, pp. 66-103.
15 D. Jameson and L. M. Hurvich, J. Opt. Soc. Am. 43, 552(1953).
1a R. M. Boynton, J. Opt. Soc. Am. 46, 172 (1956).17 E. Auerbach and G. Wald, Am. J. Ophthalmol. 39, 24 (1955).18 R. A. Weale, J. Physiol. 114, 435 (1951).1s S. L. Polyak, The Retina (University of Chicago Press,
Chicago, 1941).
central fixation although at this distance it becomesvery thin at its outer limit. Previous histologists hadreported the pigmented area to be smaller and hadstated that its extent was smaller in the vertical thanthe horizontal meridian. Polyak also reported a lowdensity of pigment over the very central fovea to anextent of just under 10 of arc in diameter (see reference19, pp. 198, 447). Wright,2 0 having computed the tri-chromatic coefficients for the match to a white stimuluswithout pigment, compared the increased amounts ofyellow required at 00, 2, 40, and 6° of arc from centralfixation. His data show a decline of pigmentation fromthe center of vision to 6, at which point the mixtureindicates an absence of pigment. Miles2 l had subjectsmake a reproduction of the Maxwell spot under care-fully controlled conditions. He found that in the mostextreme cases of twenty subjects, the outer limits of theentoptic image fell at 2.80 from central fixation. Incomparing his results with the histological data ofPolyak, he concluded that the Maxwell spot corre-sponds to the heavily pigmented regions of the slopesof the foveal depression and does not detect the thinextrafoveal pigment. On the basis of existing evidence,then, it appears that stimuli falling beyond 8 fromcentral fixation lie beyond the limits of pigmentationwhile small, centrally fixated, stimuli also encounterlittle pigment.
The present experiment was designed first to test theeffect of size and retinal location of stimuli within thecontext of the suggestion that the humps in the blue areresults of macular pigment absorption and, second, togather additional information on the shape and thenumber of humps in the cone sensitivity functions inorder to evaluate further the results in their possiblerelation to theoretical primary receptors.
Cone spectral sensitivity curves were obtained underthree conditions of stimulation: (1) central stimulationwith a circular stimulus, 42 minutes in diameter, (2)peripheral stimulation by the same size of objectcentered at 10 degrees from central fixation, and (3)central stimulation with a circular stimulus, 3 minutesin diameter. It seemed that the intercomparison of datataken under these three conditions might throw newlight on questions relating to pigmentation. The datado seem also to provide further information on thenumber and position of discontinuities in the conesensitivity curve, as well as information on changes inthe over-all shape of the curves that occur when retinallocation and stimulus size are changed.
APPARATUS
The apparatus consisted basically of two constantdeviation monochromators arranged in series as adouble monochromator for zero dispersion. It hadoriginally been constructed by Hecht, Shlaer, and
0 W. D. Wright, Researches on Nornal and Defective Color Viion(C. V. Mosby Company, St. Louis, 1947), p. 157.
21 W. R. Miles, J. Neurophysiol. (to be published).
708 Vol. 47
SPECTRAL SENSITIVITY DATA
Pirenne2 2 for their quantum study and is fully describedby them. It was adapted by Hsia and Graham8 fordetermining cone sensitivity with centrally fixatedstimuli of 42 minutes diameter. (a) The apparatusremained unchanged from the latter condition (42'stimulus) in this study. (b) For the 3 minute diameterstimulus another shutter was used to provide exposure.(c) To provide stimulation at 10° in the periphery forthe third condition, a new fixation arrangement wassubstituted and preadapting field added; the latterprovided a luminance of 5440 ft-L and subtended avisual angle of 240 centered on the 10° region to betested.
Slit widths were varied with wavelength to maintaina constant band width of 5 my. The relative energyarriving at the eye for each setting in the spectrum wasmeasured by a Weston Photronic cell (model 595 RR)and a moving coil galvanometer. The cell had beentwice calibrated for relative spectral sensitivity by theNational Bureau of Standards.
The threshold method of luminosity determinationwas used. Intensity was varied with a Jena glass neutralwedge and Jena glass neutral filters. These were locatedat a narrow portion of the entrance beam just in frontof the entrance slit. They were calibrated for spectraltransmission by means of a Beckman Model DUspectrophotometer.
Exposure time was controlled by one of two elec-trically operated disk shutters depending on the condi-tions of stimulation. For the central and peripheralconditions employing the 42 minute stimulus, a fastshutter, located between the two monochromators pro-vided single exposures of 0.004-second duration. Forthe 3 minute diameter stimulus the first shutter wasleft open and a second shutter, located very close to theexit slit, provided single exposures of 0.1-second dura-tion. These durations were chosen as the longest whichwere expected to show a constant relationship of theproduct of intensity and time at threshold, for the twoareas. Graham and Margaria23 and Karn24 found thatwith small areas, up to 5 minutes of visual angle indiameter, there was an abrupt change from I.t=K toI=K between 0.1- and 0.5-second duration. As thesize of the stimulus was increased there was a moregradual change from one function to the other andstrict reciprocity was found over shorter ranges ofduration. Areas subtending 45 minutes of arc showeddeparture from 1.1=K above 0.005 second's duration.Therefore, durations slightly shorter than these werechosen in order to most efficiently utilize the availablelight intensity (to permit measurement at the extremesof the spectrum) and still remain in the predictableregions of the intensity-time function.
Fixation was aided for the central fixation condition
2 Hecht, Shlaer, and Pirenne, J. Gen. Physiol. 25, 819 (1942).23 C. H. Graham and R. Margaria, Am. J. Physiol. 113, 302
(1935).21 H. W. Kamn, J. Gen. Psychol. 59, 360 (1936).
by the image of an illuminated ring of 2.5° diameterreflected from the front surface of a thin glass set at450 to the line of sight. Central fixation for stimulationat 100 in the periphery was provided in the form of theluminous image of a dot reflected from a thin glass setat 400 to the center line of the viewing tube; the lineof reflection was adjusted to intersect the center line atthe exit pupil. The luminance of both fixation imageswas adjustable and their virtual distance equalled thatof the stimulus so as to maintain constant accommoda-tion of the eye. The peripheral fixation dot appearedexactly 100 of visual angle above the center of thestimulus field.
For determinations in the fovea, the subject was firstdark adapted for 10 minutes, sufficient to reach high conesensitivity, after which he was instructed to fixate thecenter of the fixation ring and adjust its luminance tothe lowest value at which it could clearly be seen. Thesubject was given a signal and, when he was sure offixation, he closed a switch which activated the shutter,producing a single flash of the spectral light. He wasinstructed to signal with a bell whether or not he saw thelight. Right eye monocular observation was usedthroughout the study. A chin-and-head rest was usedto minimize head movements. Six thresholds weredetermined per wavelength setting, by the serialmethod of limits making use of small log intensity steps.Usually six to eight randomly chosen wavelengths weremeasured per session. With few exceptions, measure-ments were made at each 10 my from 420 to 700 mu.Each point reported represents an average of at leasttwo and usually three or more sittings, constituting anaverage of 12 or more single threshold determinations.
For determinations at 10° in the periphery, where themore sensitive rods are present in addition to cones, itwas necessary to circumvent the activity of the rods. Itis well known that after adaptation to an intense whitelight the eye adapts to darkness in two stages. Thethreshold first falls rapidly, then more slowly, approach-ing an asymptote from the fourth to eighth minute,depending upon the wavelength of the test stimulus andthe intensity of the adapting light. During this periodthe stimulus continues to look colored at all wave-lengths. This is cone adaptation. Values on the plateauare uncontaminated with rod response and thought toapproach absolute cone sensitivity. Later the thresholdbegins to fall again and the stimulus assumes acharac-teristic "rod grey" color independent of wavelength.This is the rod portion of the curve. For determinationsat 100, the subject was first light adapted for 5 minutesto 5440 ft-L of white light and then threshold measure-ments were immediately begun employing only ascend-ing series by the method of limits. Thresholds weretaken, one or two per minute, through 12 to 15 minutesof dark adaptation. This procedure was repeated foreach wavelength determined and produced dark adapta-tion curves with extended cone plateaus and conspicu-ous rod-cone breaks, except in the extreme red, where
709August 1957

H. G. SPERLING AND Y. HSIA
TABLE I. Average logarithms of relative cone sensitivitymeasured centrally and 10° from central fixation. All values in thetable are negative. The negative sign has been omitted for ease ofpresentation.
Each datum=log(1/ERTd)+logK'.Where ETa = relative energy required for the cones to respond to
the spectral lights at absolute threshold, and dranges from 420 muA to 700 mju,
and K=an arbitrary constant chosen so that all numberswould have the same algebraic sign.
100 fromWave- Central fixation central fixationlength 3' diam 42' diam 42' diam
my YH DB PS HS YH DB PS HS YH DB
420 ... .. ... 1 .87 *.. 2.17 2.10 .. ... 2.5430 2.59 2.53 2.70 1.33 2.27 1.98 1.90 2.23 2.62 2.1440 2.37 2.22 2.39 1.28 2.15 1.81 1.72 1.96 2.23 2.1050 2.38 2.13 2.23 1.08 2.00 1.78 1.72 1.55 1.93 1.8460 2.08 1.76 2.12 1.06 1.92 1.52 1.53 1.66 1.64 1.9770 1.80 1.53 1.92 0.83 1.55 1.50 ... 1.99 2.01 2.0680 1.51 1.38 1.62 0.63 1.39 1.40 1.23 1.28 1.60 1.7290 1.30 1.33 1.57 0.58 1.23 1.20 ... 1.21 1.46 ...
500 1.06 1.00 1.18 0.56 0.98 0.79 0.79 1.12 1.40 1.3910 0.82 0.68 0.90 0.44 0.72 0.69 0.57 1.11 1.39 1.3320 0.68 0.52 0.73 0.39 0.62 0.53 0.38 1.05 1.28 1.3830 0.60 0.80 0.65 0.48 0.50 0.59 0.43 1.25 1.36 1.5240 0.64 0.49 0.64 0.30 0.40 0.39 0.28 1.02 1.24 ...50 0.70 0.54 0.48 0.44 0.48 0.30 0.36 0.99 1.02 1.4060 0.64 * 0.60 0.35 0.42 0.75 0.38 1.02 1.11 1.5270 0.64 ... 0.63 0.41 0.50 0.41 0.48 1.24 1.25 1.5980 0.73 0.58 0.79 0.44 0.64 0.62 0.51 1.54 1.22 1.7190 0.77 0.73 0.78 0.50 0.69 0.76 0.54 1.16 1.35 1.74
600 0.88 0.72 0.90 0.74 0.56 0.50 0.59 1.22 1.27 1.6110 1.01 0.74 0.93 0.60 0.65 0.53 0.61 1.28 1.42 2.1020 0.98 0.84 1.00 0.68 0.70 0.66 0.77 1.56 1.56 2.2030 1.15 1.02 1.31 0.78 0.88 0.81 0.99 1.57 1.87 2.3840 1.41 1.28 1.37 1.35 1.03 1.06 1.18 1.84 2.02 ...50 1.61 .. ... 1.27 1.22 ... 1.34 ... 2.32 2.8460 1.83 1.64 1.88 1.86 1.43 ... ... ... ...70 2.27 .. ... 1.83 1.84 *-- 1.97 2.84 2.75 3.7080 2.49 ... ... 2.16 2.10 ... ... ... ... ...90 ... ... ... ... ... ... ... ... ... ...
700 3.16 3.31 3.22 2.90 2.80 ... 2.97 3.71 3.80 4.15
the break is absent. The lowest value of the smoothedcurve just prior to the rod break was taken as a measureof pure cone threshold. In the red region of the spec-trum, where no break is observable, the final value ofthe smoothed curve was used. The average of at leasttwo and usually three values per wavelength is reported.Each value is from a separate dark adaptation curve.Each of the four subjects had normal color vision asmeasured on the Ishihara test, 6th edition, and theShlaer anomaloscope.
RESULTS
In Table I are recorded the average log sensitivityvalues through the spectrum for each subject, for thethree conditions of stimulation. Figures 1, 2, and 3present these values for the 42 minute diameter stimulusfixated centrally, the 42 minute stimulus at 100 fromcentral fixation, and the 3 minute diameter stimulusfixated centrally, respectively. The basic data of thesecurves are relative energies required for the cones torespond to the spectral lights at absolute threshold. Thelogarithms of the reciprocal of these values, plus aconstant, are here plotted. The constant was arbitrarilychosen to make all log threshold values of the same sign.The highest sensitivity for any conditions falls at -0.28log relative sensitivity units. All values in Table I arein the same units, which permits comparisons of sen-sitivity from condition to condition and from subject tosubject. For purposes of clarity of presentation eachsuccessive curve (in Fig. 1, 2, and 3) is moved downwardthrough one logarithmic unit. Figure 4 and Table IIpresent the averaged data of the three or four subjectsfor all three conditions with no displacement.
A comparison of the data taken with the 42 minutediameter stimulus in the fovea and at 100 (Fig. 4)
3
~~~~~~ -2~~~~~~~~~~~~HS
5
400 500 600 700Wavelength mp
FIG. 2. Relative cone sensitivity curves for three observers takenat 100 from central fixation with a 42' diameter stimulus. Eachsuccessive curve has been lowered through one logarithmic unit.
Wavelength mu1
FIG. 1. Relative cone sensitivity curves for four observers takenwith central fixation with a 42' diameter stimulus. Each successivecurve has been lowered through one logarithmic unit.
Wavelength mu
Fig. 3. Relative cone sensitivity curves for three observers takenwith central fixation with a 3' diameter stimulus. Each successivecurve has been lowered through one logarithmic unit.
Vol. 47

SPECTRAL SENSITIVITY DATA
TABLE II. Logarithms of mean relative conesensitivity data of all observers.
Wavelength Central fixation 100 fixationm 3' diam 42' diam 42' diam
420 ... 2.13 ...30 2.61 1.87 2.3340 2.33 1.74 2.1050 2.24 1.64 1.7760 1.99 1.51 1.7670 1.75 1.30, 2.0280 1.50 1.16 1.5390 1.40 1.00a 1.41^
500 1.08 0.78 1.3010 0.80% 0.60 1.2820 0.64 0.48 1.2330 0.68 0.50 1.3840 0.59 0.34 1.23a50 0.57 0.40 1.1460 0.58& 0.48 1.2270 0.60a 0.45 1.3680 0.70 0.55 1.4990 0.76 0.62 1.42
600 0.83 0.60 1.3710 0.89 0.60 1.6020 0.94 0.71 1.7730 1.12 0.86 1.9440 1.35 1.16 2.14150 ...60 1.7870 ... ... 3.1080 ... ... ...90 ... ... ...
700 3.23 *-- 3.89
One observer's mean threshold value entering this mean was inter-polated on his individual curve.
clearly shows that at 10° humps in the violet and blueregions have become much more pronounced. Datataken with the 3' diameter also show the presence ofhumps in the blue, but reduced. The average curves ofFig. 4 show that despite sizable shifts from person toperson in the position of the humps in the 42 minutefoveal data, more than three humps survive averagingfor all three conditions. In the average picture thehumps for the two foveal conditions agree well as totheir positions in the spectrum. The data for the 100peripheral stimulation indicate some shifts in the posi-tions of peaks and dips for the much exaggerated humpsof the periphery.
Of interest are the changes in the over-all shape of thecurves. The foveal curve for the 3 minute diametershows increasingly reduced sensitivity towards the blueend of the spectrum (below 520 my). The peripheraldata, however, show greatly increased sensitivity overthe blue side of the spectrum. There is comparativelylittle variation in the shape of the longer wavelengthregions among the three curves.
DISCUSSION
The finding of an exaggerated hump in the blueregion of the spectrum, below 470 my, in the 10'datafails to support the argument that humps in the blue aredue to the absorption of macular pigment. Since ouranalysis of the distribution of the macular pigment
indicates that no pigment exists beyond 80, the humpsfound at 100 must be ascribed to some other source. Theother possible sources of humps in the peripheralsensitivity curve, within the limits of our presentknowledge, are: (a) selective absorption of preretinalelements such as the lens of the eye, the humors, andthe hemoglobin of the blood; (b) rod activity, and (c)cone activity. The possibility that selective absorptionby preretinal structures produces the blue humpsseems eliminated by the fact that the rods which receivelight through those media have always shown smoothabsolute sensitivity curves.
The possibility that the blue humps are contributedto by rod activity requires close examination. Theincreased sensitivity found through the blue region plusthe appearance of a large hump with its peak at 500-510my makes it look as though sizable rod components hadintruded. Further analysis of the data, however, beliesthis. The dark adaptation curves from which theperipheral sensitivity curves were obtained were sub-jected to more detailed analysis. They were read at two,ten, and thirteen minutes after light adaptation andspectral sensitivity curves were plotted in the same'wayas described under procedure. The results are shown inFigs. 5 and 6 for two observers. The curves taken just 2minutes after the intense 5440 ft-L light adaptationwould not be expected to show rod intrusion. A com-parison of the 2-minute curves with the presentlyreported curves which were read at the rod-cone break(dotted curves marked B in Figs. 5 and 6) show that thetwo have almost identical over-all shape for both ob-servers. It may further be noted from these curves thatby 10 minutes after light adaptation the Purkinje shiftof the peak from 550 my to 510 my has occurred andthat by 13 minutes the curves have almost completelyassumed the characteristic shape of rod sensitivity. Asensitivity curve after full dark adaptation is shown asthe top curve for observer H.S. in Fig. 6. Despite theshift to predominately rod sensitivity by 13 minutes, itmaybe seen that (a) theahumps show no importantchange in size or number, and (b) they evidently con-tinue to appear undiminished well after the rod-cone
.a
V)
EDr
Ct
Wavelength mp
FIG. 4. Mean relative cone sensitivity curves for all observers.(a) Values for the 42' diameter stimulus in the fovea connected byby dashed line, (b) values for the 3' diameter stimulus in the foveaconnected by the dotted line, (c) values for the 42' diameterstimulus at 100 from the fovea connected by the solid line.
-0
1 I -_ A 1 4A, _
711fAugust 957
400 500 600 700
H. G. SPERLING AND Y. HSIA
I-
-I
W -
(D(0
X MILLIMI CRONS
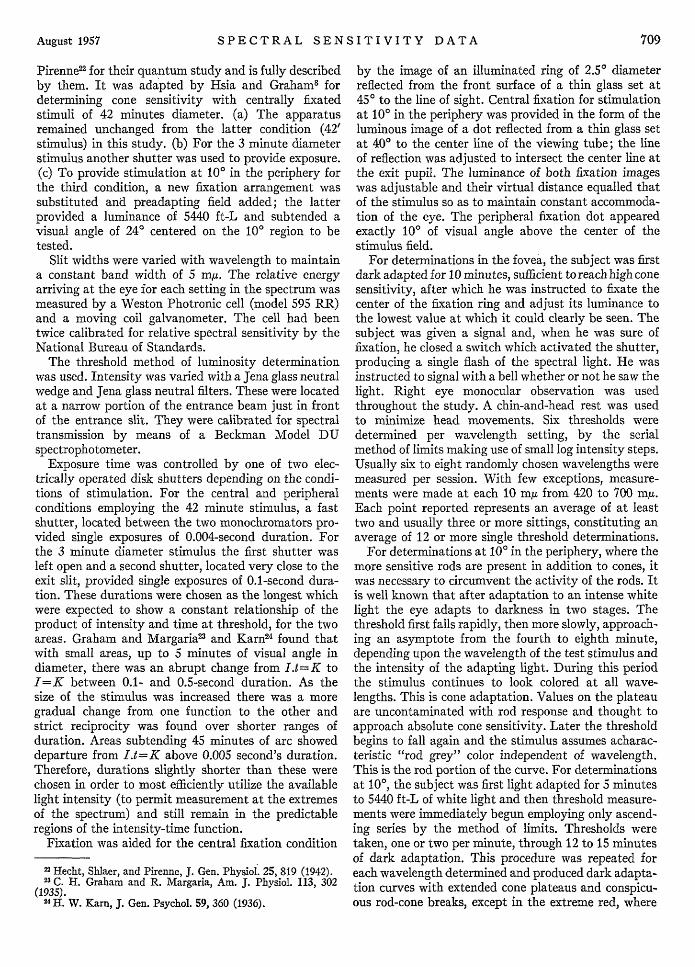
FIG. 5. Relative sensitivity at 10° from central fixation to thespectrum 2, 10, and 13 min after adaptation to 5440 ft-L of 28480 Klight. The dotted curve shows relative cone sensitivity taken justbefore the rod-cone break, for observer YH.
break occurs. The implication of this evident summationof rod and cone activity over a wide transition zone fromdaylight to night vision has been the subject of a sepa-rate discussion by Sperling2 5 and will be the subject ofa forthcoming article, but it is clear from these curvesthat no one of the humps in the peripheral curve underdiscussion is itself contributed by the rods. The rodcurve is evidently an extremely broad one whichunderlies the entire blue through orange region and, oncethe Purkinje shift has begun, determines the over-allshape of the curve without affecting its more detailedstructure. The statement that the break point peripheralcurves of Figs. 2 and 4 are free of rod intrusion is thussupported and the further statement that, in view of theabsence of macular pigment, the humps in the peripheralcurves are contributed by cones alone is fully justified.
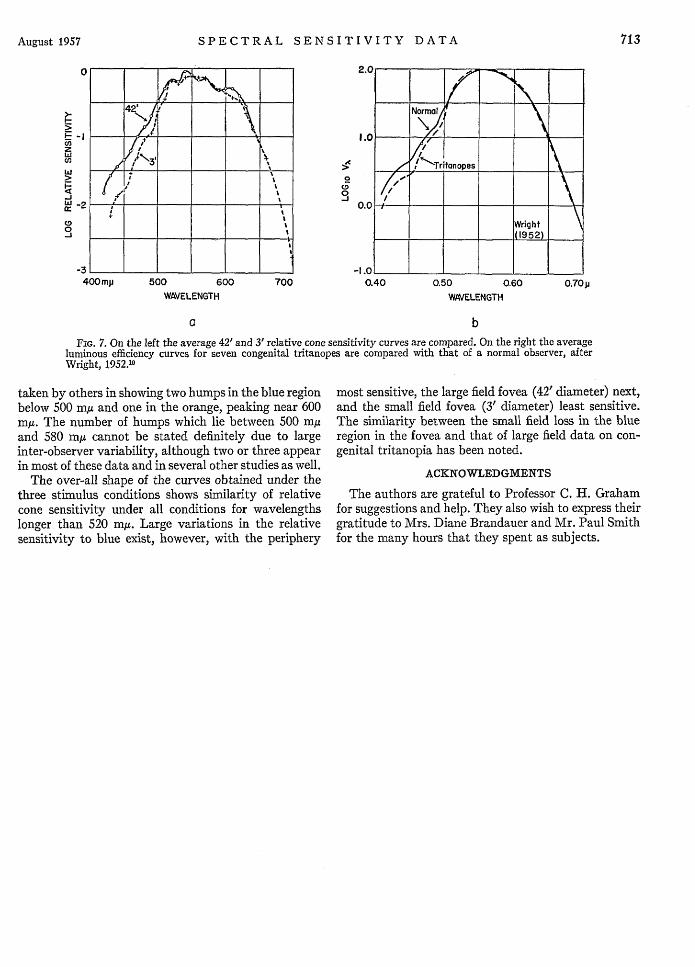
This finding, it must be pointed out, does not elimi-nate the pigment from a role in the foveal humps. Itseems most likely, in view of Wright's data for tri-tanopes (see reference 10) our finding for the 3' field andthe similar results obtained by adapting the eye to bluelight,'4 -'8 that macular pigment and receptor activity"superimpose" in producing the foveal humps, as statedby Auerbach and Wald.'7 These studies all show thatthe humps survive, perhaps reduced, under conditionswhere violet or blue receptors must be assumed greatlyreduced in sensitivity or entirely absent. The 3' and 42'foveal curves, equated at 560 mp are compared withWright's tritanopic data in Fig. 7, where the strikingsimilarity between congenital tritanopia and small fieldsensitivity may be seen.
Aside from our primary question of the effect ofmacular pigment this study has revealed evidencebearing on the number of humps and the over-all shapeof the curves. As to the number of humps in the data,
25fH. G. Sperling, J. Opt. Soc. Am. 44, 822(A) (1954).
any statement should be qualified by the large vari-ability from subject to subject in the position of thehumps. It can be pointed out, however, that consider-able agreement exists between our data and that ofother experiments. The foveal data for both stimulusdiameters show two humps below 500 m in agreementwith Ishak, Wright, Thomson, Hurvich and Jameson,and Boynton. They show the humps above 580 mufound by Sloan, Walters and Wright, Stiles, Hsia andGraham, Hurvich and Jameson, and Boynton. The dipwhich appears near 560 mg in the 42', 00 curve is alsopresent in Thomson's mean foveal data and the 10foveal data of Hurvich and Jameson." The dip foundat 530 ma, in all 3 of our curves has been shown byHurvich and Jameson in foveal data, and is present inWeale's curves taken in the periphery. It is clear thatany analysis of the cone sensitivity curve into funda-mental sensation curves will be greatly complicated bythe number of humps which, although not present insome observers and shifted slightly from one observerto the next, nevertheless persist in average data over theseveral studies mentioned. It would appear that thedistinct humps which are ascribable to cone activityalone in the periphery present a more promising startingplace for such an analysis than the fovea. In this con-nection, data on the color mixture and discriminationof the periphery are needed as a basis for such ananalysis.
CONCLUSIONS
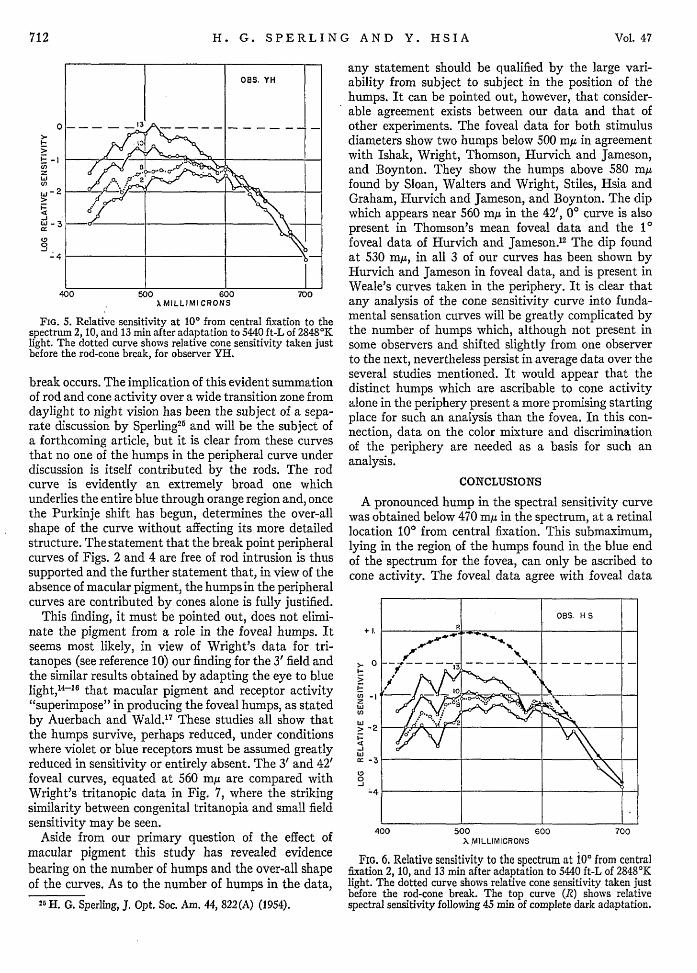
A pronounced hump in the spectral sensitivity curvewas obtained below 470 mg in the spectrum, at a retinallocation 100 from central fixation. This submaximum,lying in the region of the humps found in the blue endof the spectrum for the fovea, can only be ascribed tocone activity. The foveal data agree with foveal data
+ 1.
>.U
-
U)
> -2
-JUJ'a -3
CD0
`4
40070700500 600
X MILLIMICRONS
FIG. 6. Relative sensitivity to the spectrum at io from centralfixation 2, 10, and 13 min after adaptation to 5440 ft-L of 2848°Klight. The dotted curve shows relative cone sensitivity taken justbefore the rod-cone break. The top curve (R) shows relativespectral sensitivity following 45 min of complete dark adaptation.
712 Vol. 47
SPECTRAL SENSITIVITY DATA
.4
0
CD
500 600 700WAVELENGTH
0.40 0.50 0.60 0.70pWtWELENGTH
a b
FIG. 7. On the left the average 42' and 3' relative cone sensitivity curves are compared. On the right the averageluminous efficiency curves for seven congenital tritanopes are compared with that of a normal observer, afterWright, 1952.10
taken by others in showing two humps in the blue regionbelow 500 mu and one in the orange, peaking near 600my. The number of humps which lie between 500 muand 580 mrt cannot be stated definitely due to largeinter-observer variability, although two or three appearin most of these data and in several other studies as well.
The over-all shape of the curves obtained under thethree stimulus conditions shows similarity of relativecone sensitivity under all conditions for wavelengthslonger than 520 mit. Large variations in the relativesensitivity to blue exist, however, with the periphery
most sensitive, the large field fovea (42' diameter) next,and the small field fovea (3' diameter) least sensitive.The similarity between the small field loss in the blueregion in the fovea and that of large field data on con-genital tritanopia has been noted.
ACKNOWLEDGMENTS
The authors are grateful to Professor C. H. Grahamfor suggestions and help. They also wish to express theirgratitude to Mrs. Diane Brandauer and Mr. Paul Smithfor the many hours that they spent as subjects.
August 1957 713
0
I1=-I- -CDF_lzen
Co
3
-J
0
-3
400mp