SOME BRAHMS ONLINE FUNCTIONALITY
11
SOME BRAHMS ONLINE FUNCTIONALITY This text was extracted from a report to FAPESP entitled ‘Adaption of BRAHMS and BRAHMS online for the production of online floras in Brazil’. FAPESP, the Research Foundation for the state of São Paulo, provided support with the development of BRAHMS WebConnect and BRAHSM online for e-floras applications. INTRODUCTION ................................................................................................................................................................... 1 SOME EXAMPLE WEBSITES ON THE CENAPAD SERVER ............................................................................................................... 2 SOME GRID VIEW FUNCTIONS................................................................................................................................................. 3 IMAGES ............................................................................................................................................................................. 7 MAPPING .......................................................................................................................................................................... 9 REPORT VIEW FUNCTIONS ................................................................................................................................................... 10 Grid vs. report .......................................................................................................................................................... 10 e-floras and related outputs .................................................................................................................................... 10 Report options menu ................................................................................................................................................ 10 Sample text pages (reports) ..................................................................................................................................... 11 Introduction BRAHMS online (BOL) is a unique website service created for the BRAHMS project. It is used to publish BRAHMS databases online and/or to describe and promote your project. BOL websites can be richly developed with text, images, hyperlinks, tables, file downloads and indeed any standard website feature. Websites can be linked to one or more BRAHMS databases and the online data query tools search these data and present the results in flexible text pages and data grids. A comprehensive overview of the BRAHMS online as used by the Millennium Seed Bank at Kew Gardens is available on: http://herbaria.plants.ox.ac.uk/bol/Content/Groups/msbp/Resources/MSBP_Data_Warehouse_help_docu ment.pdf BRAHMS online was installed on a Dell PowerEdge R410 server at UNICAMP at CENAPAD-SP (National Centre for High Performance Computing in São Paulo). CENAPAD has a mission to render high performance computing and consulting services to the academic community, educational institutions and the private sector. http://www.cenapad.unicamp.br/.
Transcript of SOME BRAHMS ONLINE FUNCTIONALITY

SOME BRAHMS ONLINE FUNCTIONALITY
This text was extracted from a report to FAPESP entitled ‘Adaption of BRAHMS and BRAHMS online for the
production of online floras in Brazil’. FAPESP, the Research Foundation for the state of São Paulo, provided
support with the development of BRAHMS WebConnect and BRAHSM online for e-floras applications.
INTRODUCTION ................................................................................................................................................................... 1
SOME EXAMPLE WEBSITES ON THE CENAPAD SERVER ............................................................................................................... 2
SOME GRID VIEW FUNCTIONS ................................................................................................................................................. 3
IMAGES ............................................................................................................................................................................. 7
MAPPING .......................................................................................................................................................................... 9
REPORT VIEW FUNCTIONS ................................................................................................................................................... 10
Grid vs. report .......................................................................................................................................................... 10
e-floras and related outputs .................................................................................................................................... 10
Report options menu ................................................................................................................................................ 10
Sample text pages (reports) ..................................................................................................................................... 11
Introduction
BRAHMS online (BOL) is a unique website service created for the BRAHMS project. It is used to publish
BRAHMS databases online and/or to describe and promote your project. BOL websites can be richly
developed with text, images, hyperlinks, tables, file downloads and indeed any standard website feature.
Websites can be linked to one or more BRAHMS databases and the online data query tools search these
data and present the results in flexible text pages and data grids. A comprehensive overview of the
BRAHMS online as used by the Millennium Seed Bank at Kew Gardens is available on:
http://herbaria.plants.ox.ac.uk/bol/Content/Groups/msbp/Resources/MSBP_Data_Warehouse_help_docu
ment.pdf
BRAHMS online was installed on a Dell PowerEdge R410 server at UNICAMP at CENAPAD-SP (National
Centre for High Performance Computing in São Paulo). CENAPAD has a mission to render high performance
computing and consulting services to the academic community, educational institutions and the private
sector. http://www.cenapad.unicamp.br/.

Some example websites on the CENAPAD server

Some grid view functions
The grid view or ‘spread sheet’ mode of viewing data offers flexibility for analysing the search results online
using a variety of useful functions. These data are presented in dynamic, flexible grids online. Records can
be tagged, sorted, filtered or exported. Data display columns can be adjusted and reordered. There are
functions to calculate and analyse data. Data grids in BRAHMS online are flexible viewing screens with
additional menus and toolbars to select, sort, tag, filter and analysis data in multiple ways.
An example grid function is tagging records. Here, botanical collections from São Paulo state have been ‘tagged’ using
“Tag all like selection” and for ease of viewing, the tagged records have been highlighted using “Highlight tagged
records”. These tagged records could, for example, be used to develop a report or be exported to Excel.
The default list of available fields is determined and set by the database owner via the BRAHMS
WebConnect service. Any user however can add and/or remove any data field that is available in the
database to or from the default view.

The columns viewed in any grid can be adjusted using the toolbar feature provided.
The Sigma summarise function is used throughout the BRAHMS software and is an extremely useful
analysis function. The tool lists each different entry in the selected columns and counts records per entry.
The results are easily charted in MS Excel.

Here the summary has been exported to Excel and charted to produce a pie-chart of the relative abundance of
collections in the different genera of the family Anacardiaceae based on specimens held at the UEC herbarium.
The filter function is accessed via two routes. Carry out a simple filter on the contents of any selected cell
by clicking the filter button on the function tool bar. Only one field can be used at a time in this function. In
this example a query on the genus Acacia has been carried out. Alternatively, filters can be performed on all
fields by selecting the drop down menu on the field header and entering the required filter value manually.
Links are provided to external websites, mostly for checking species names.
Dynamic links are provided to lookup the current species on the selected website, here the Plant List.
The external websites currently available are: The Plant List: http://theplantlist.org Centro de Referência em Informação Ambiental (CRIA): http://names.cria.org.br/index? The International Plant Names Index (IPNI): http://www.ipni.org/ipni/advPlantNameSearch.do? The Royal Botanic Garden Edinburgh Herbarium Catalogue: http://elmer.rbge.org.uk/bgbase/vherb/bgbasevherb.php: Global Biodiversity Informatics Facility (GBIF): http://data.gbif.org/ Harvard University Herbarium specimen search: http://kiki.huh.harvard.edu/databases/specimen_index.html Harvard University Herbarium collector names search: http://kiki.huh.harvard.edu/databases/botanist_index.html RBG Kew Electronic Plant Information Centre (ePIC): http://epic.kew.org/searchepic/editsearch.do? RBG Kew Seed Information Database (SID): http://data.kew.org/sid/SidServlet? Missouri Botanic Gardens, Tropicos Database: http://www.tropicos.org The New York Botanical Garden C.V. Starr Virtual Herbarium: http://sciweb.nybg.org/science2/hcol/allvasc/index.asp The African Plants Database: http://www.ville-ge.ch/musinfo/bd/cjb/africa/recherche.php?langue=an


Images
Images can be linked to any category of data of data in BRAHMS (botanical records, specimens, species,
etc.) and these images may be of any category (specimen scans, illustrations, habit shots, etc.). Images can
be key worded and text descriptions can be added including image copyright. Images can be displayed
online in the raw format or using the Zoomify image viewer (see http://www.zoomify.com/). An enterprise
Zoomify licence was purchased for the FAPESP server. All images on the server have been processed into
tiled PFF files.
Viewing images using Zoomify on the website http://floras.cna.unicamp.br/floralitoralsergipe. Images for the current
query are organized by species within family/genus in a browse screen on the right side.
Images are pre-processed into PFF files using Zoomify on the server.

Zoomify in use on the FAPESP server from the website http://floras.cna.unicamp.br/uec
Mapping
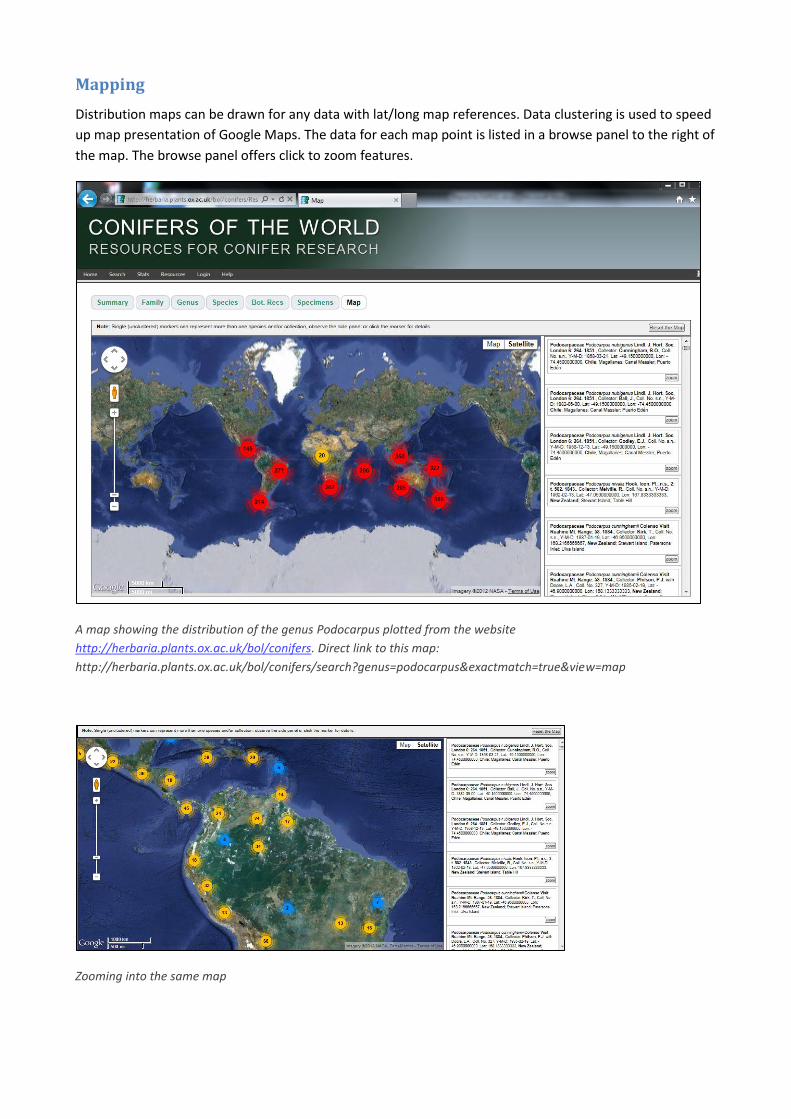
Distribution maps can be drawn for any data with lat/long map references. Data clustering is used to speed
up map presentation of Google Maps. The data for each map point is listed in a browse panel to the right of
the map. The browse panel offers click to zoom features.
A map showing the distribution of the genus Podocarpus plotted from the website
http://herbaria.plants.ox.ac.uk/bol/conifers. Direct link to this map:
http://herbaria.plants.ox.ac.uk/bol/conifers/search?genus=podocarpus&exactmatch=true&view=map
Zooming into the same map

Report view functions
Grid vs. report
As well as viewing data in flexible data grids, data can be viewed in report mode. While the data grids offer
flexible options to sort, filter, calculate, export, etc., reports provide options to format data into printable
pages.
The default view mode on a given website can be set to grid or report for each of the result menu options.
e-floras and related outputs
In addition to viewing BOL query results in data grids as described above, query results can be formatted
into text pages (‘reports’). Using report formatting, users can design different categories of report ranging
from simple checklists through e-floras to something approaching a taxonomic revision.
Reports can be created for all categories of queried data, e.g. families, genera, species, botanical records,
specimens and seed. A report template could be used to create ‘labels’ for specimens or and e-flora type of
output for taxa.
The report design options depend on the data that are available on the website concerned. Thus, if species
descriptions, diagnostic features and distribution summaries have been uploaded, these data will be
available for formatting into reports. The use of reporting templates is an innovative component of
BRAHMS online and is being further actively developed.
Report options menu
Report options available depend on the data uploaded to the website. Report items on the report options menu can be expanded to add spacing. They can also be dragged higher or lower to alter their position in the report.

Sample text pages (reports)
Simple species list
Species list with synonyms, description, distribution and specimen list. Note that the other potential data items have
not been uploaded to this website and are thus disabled in the report options menu.