Some Basic Statistical Concepts Dr. Tai-Yue Wang Department of Industrial and Information Management...
72
Some Basic Statistical Concepts Dr. Tai-Yue Wang Department of Industrial and Information Management National Cheng Kung University Tainan, TAIWAN, ROC 1/33
-
date post
19-Dec-2015 -
Category
Documents
-
view
225 -
download
3
Transcript of Some Basic Statistical Concepts Dr. Tai-Yue Wang Department of Industrial and Information Management...

Some Basic Statistical Concepts
Dr. Tai-Yue Wang Department of Industrial and Information Management
National Cheng Kung UniversityTainan, TAIWAN, ROC
1/33
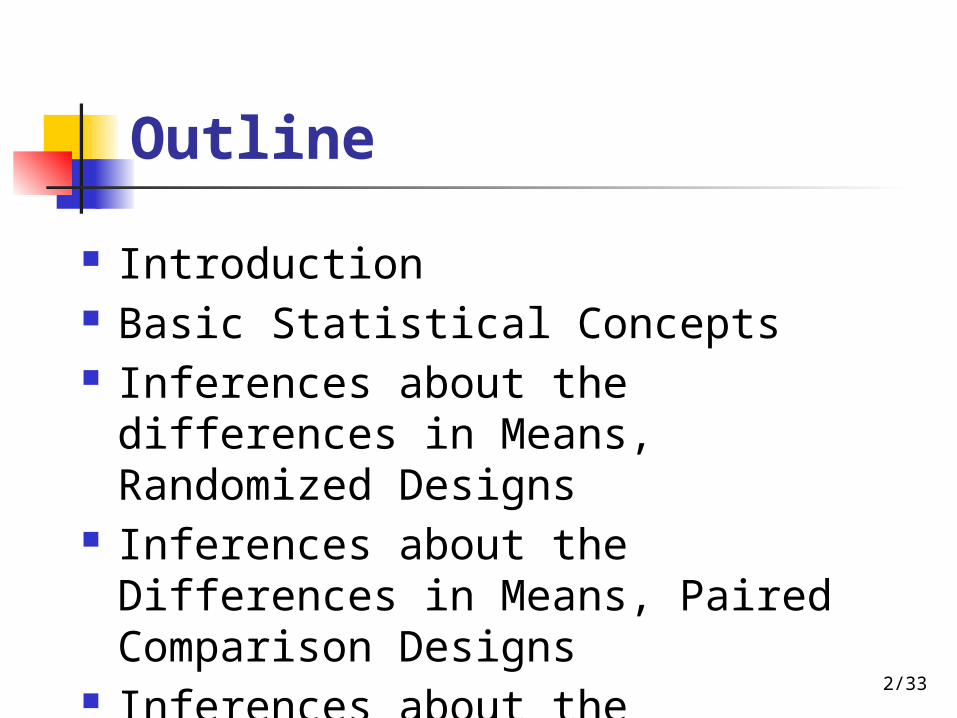
Outline
Introduction Basic Statistical Concepts Inferences about the differences in Means,
Randomized Designs Inferences about the Differences in Means,
Paired Comparison Designs Inferences about the Variances of Normal
Distribution 2/33

3/72
Introduction Formulation of a cement mortar Original formulation and modified formulation 10 samples for each formulation One factor formulation Two formulations: two treatments two levels of the factor formulation

4/72
Introduction
Results:

5/72
Introduction
Dot diagram

6/72
Basic Statistical Concepts
Experiences from above example Run – each of above observations Noise, experimental error, error – the individual runs
difference Statistical error– arises from variation that is
uncontrolled and generally unavoidable The presence of error means that the response variable
is a random variable Random variable could be discrete or continuous

7/72
Basic Statistical Concepts
Describing sample data Graphical descriptions
Dot diagram—central tendency, spread Box plot – Histogram

8/72
Basic Statistical Concepts

9/72
Basc Statistical Concepts

10/72
Basic Statistical Concepts
•Discrete vs continuous

11/72
Basic Statistical Concepts
Probability distribution Discrete
Continuous
jy
j
jjj
jj
yp
yypyyP
yyp
of valuesall
1)(
of valuesall )()(
of valuesall 1)(0
1)(
)()(
)(0
dyyf
dyyfbyap
yfb
a

12/72
Basic Statistical Concepts
Probability distribution Mean—measure of its central tendency
Expected value –long-run average value
yall
yyyp
ydyyyf
discrete )(
continuous )(
yall
yyyp
ydyyyfyE
discrete )(
continuous )()(

13/72
Basic Statistical Concepts
Probability distribution Variance —variability or dispersion of a
distribution
2
22
(
2
2
)(
])[(
discrete )()(
continuous )()(
yV
or
yE
or
yypy
ydyyfy
yall

14/72
Basic Statistical Concepts
Probability distribution Properties: c is a constant
E(c) = c E(y)= μ E(cy)=cE(y)=cμ V(c)=0 V(y)= σ2
V(cy)=c2 σ2
E(y1+y2)= μ1+ μ2

15/72
Basic Statistical Concepts
Probability distribution Properties: c is a constant
V(y1+y2)= V(y1)+V(y2)+2Cov(y1, y2) V(y1-y2)= V(y1)+V(y2)-2Cov(y1, y2) If y1 and y2 are independent, Cov(y1, y2) =0 E(y1*y2)= E(y1)*V(y2)= μ1* μ2
E(y1/y2) is not necessary equal to E(y1)/V(y2)

16/72
Basic Statistical Concepts
Sampling and sampling distribution Random samples --
if the population contains N elements and a sample of n of them is to be selected, and if each of N!/[(N-n)!n!] possible samples has equal probability being chosen
Random sampling – above procedure Statistic – any function of the observations in a
sample that does not contain unknown parameters

17/72
Basic Statistical Concepts
Sampling and sampling distribution Sample mean
Sample variancen
yy
n
ii
1
1
)(1
2
2
n
yys
n
ii

18/72
Basic Statistical Concepts
Sampling and sampling distribution Estimator – a statistic that correspond to an
unknown parameter Estimate – a particular numerical value of an
estimator Point estimator: to μ and s2 to σ2
Properties on sample mean and variance: The point estimator should be unbiased An unbiased estimator should have minimum
variance
y

19/72
Basic Statistical Concepts
Sampling and sampling distribution Sum of squares, SS
in
1
)()( 1
2
2
n
yyESE
n
ii
Sum of squares, SS, can be defined as
n
ii yySS
1
2)(

20/72
Basic Statistical Concepts
Sampling and sampling distribution Degree of freedom, v, number of independent
elements in a sum of squarein
1
)()( 1
2
2
n
yyESE
n
ii
Degree of freedom, v , can be defined as
1nv

21/72
Basic Statistical Concepts
Sampling and sampling distribution Normal distribution, N
y- 2
1)(
2]/))[(2/1(
yeyf

22/72
Basic Statistical Concepts
Sampling and sampling distribution Standard Normal distribution, z, a normal
distribution with μ=0 and σ2=1
),z~N(
ei
yz
10
.,.

23/72
Basic Statistical Concepts
Sampling and sampling distribution Central Limit Theorem–
If y1, y2, …, yn is a sequence of n independent and identically distributed random variables with E(yi)=μ and V(yi)=σ2 and x=y1+y2+…+yn, then the limiting form of the distribution of
as n∞, is the standard normal distribution
2
n
nxzn

24/72
Basic Statistical Concepts
Sampling and sampling distribution Chi-square, χ2 , distribution–
If z1, z2, …, zk are normally and independently distributed random variables with mean 0 and variance 1, NID(0,1), the random variable
follows the chi-square distribution with k degree of freedom.
222
21 ... kzzzx
2/1)2/(2/ )2/(2
1)( xk
kex
kxf

25/72
Basic Statistical Concepts
Sampling and sampling distribution Chi-square distribution– example
If y1, y2, …, yn are random samples from N(μ, σ2), distribution,
Sample variance from NID(μ, σ2),
212
1
2
2~
)(
n
n
ii yy
SS
21
222 )]1/([~ .,. 1
nnSei
n
SSS

26/72
Basic Statistical Concepts
Sampling and sampling distribution t distribution–
If z and are independent standard normal and chi-square random variables, respectively, the random variable
follows t distribution with k degrees of freedom
2k
/2 k
zt
k
k

27/72
Basic Statistical Concepts
Sampling and sampling distribution pdf of t distribution–
μ =0, σ2=k/(k-2) for k>2
t
ktkk
ktf
k
]1)/[(
1
)2/(
]2/)1[()(
2/)1(2

28/72
Basic Statistical Concepts

29/72
Basic Statistical Concepts
Sampling and sampling distribution If y1, y2, …, yn are random samples from N(μ, σ2),
the quantity
is distributed as t with n-1 degrees of freedom
nS
yt
/

30/72
Basic Statistical Concepts
Sampling and sampling distribution F distribution—If and are two independent chi-square
random variables with u and v degrees of freedom, respectively
follows F distribution with u numerator degrees of freedom and v denominator degrees of freedom
2u 2
v
v
uF
v
uvu /
/2
2
,

31/72
Basic Statistical Concepts
Sampling and sampling distribution pdf of F distribution–
xxvuvxu
xvuvuxh
vu
uu
0 ]1)/)[(2/()/(
)/](2/)[()(
2/)(
1)2/(2/

32/72
Basic Statistical Concepts
Sampling and sampling distribution F distribution– exampleSuppose we have two independent normal
distributions with common variance σ2 , if y11, y12, …, y1n1
is a random sample of n1 observations
from the first population and y21, y22, …, y2n2 is a
random sample of n2 observations from the second population
1 ,122
21
21~ nnF
S
S

33/72
The Hypothesis Testing Framework
Statistical hypothesis testing is a useful framework for many experimental situations
Origins of the methodology date from the early 1900s
We will use a procedure known as the two-sample t-test

34/72
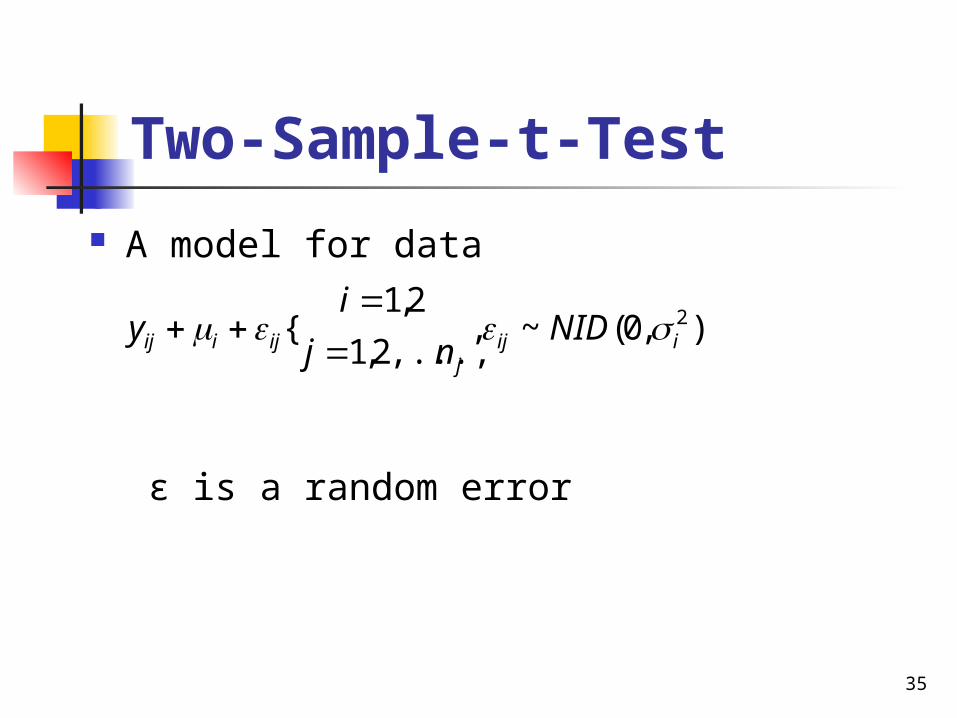
Two-Sample-t-Test
Suppose we have two independent normal, if y11, y12, …, y1n1
is a random sample of n1 observations
from the first population and y21, y22, …, y2n2 is a
random sample of n2 observations from the second population
35/72
Two-Sample-t-Test
A model for data
ε is a random error
),0(~,,...,2,1
2,1{ 2
iijj
ijiij NIDnj
iy

36
Two-Sample-t-Test
Sampling from a normal distribution Statistical hypotheses:
0 1 2
1 1 2
:
:
H
H

37
Two-Sample-t-Test
H0 is called the null hypothesis and H1 is call alternative hypothesis.
One-sided vs two-sided hypothesis Type I error, α: the null hypothesis is rejected
when it is true Type II error, β: the null hypothesis is not rejected
when it is false
false) is |reject tofail()error II type(
) trueis |reject ()error I type(
00
00
HHPP
HHPP

38
Two-Sample-t-Test
Power of the test:
Type I error significance level 1- α = confidence level
false) is |reject (1 00 HHPPower

39
Two-Sample-t-Test
Two-sample-t-test Hypothesis:
Test statistic:
where
11
210
11nn
S
yyt
p
0 1 2
1 1 2
:
:
H
H
)2(
)1()1(
21
222
2112
nn
SnSnS p

40/72
Two-Sample-t-Test
1
2 2 2
1
1 estimates the population mean
1( ) estimates the variance
1
n
ii
n
ii
y yn
S y yn

41
Two-Sample-t-Test

42
Example --Summary Statistics
1
21
1
1
16.76
0.100
0.316
10
y
S
S
n
2
22
2
2
17.04
0.061
0.248
10
y
S
S
n
Formulation 1
“New recipe”
Formulation 2
“Original recipe”

43/72
Two-Sample-t-Test--How the Two-Sample t-Test Works:
1 2
22y
Use the sample means to draw inferences about the population means
16.76 17.04 0.28
Difference in sample means
Standard deviation of the difference in sample means
This suggests a statistic:
y y
n
1 20 2 2
1 2
1 2
Zy y
n n

44/72
Two-Sample-t-Test--How the Two-Sample t-Test Works:
2 2 2 21 2 1 2
1 2
2 21 2
1 2
2 2 21 2
2 22 1 1 2 2
1 2
Use and to estimate and
The previous ratio becomes
However, we have the case where
Pool the individual sample variances:
( 1) ( 1)
2p
S S
y y
S Sn n
n S n SS
n n

45
Two-Sample-t-Test--How the Two-Sample t-Test Works:
Values of t0 that are near zero are consistent with the null hypothesis
Values of t0 that are very different from zero are consistent with the alternative hypothesis
t0 is a “distance” measure-how far apart the averages are expressed in standard deviation units
Notice the interpretation of t0 as a signal-to-noise ratio
1 20
1 2
The test statistic is
1 1
p
y yt
Sn n
46/72
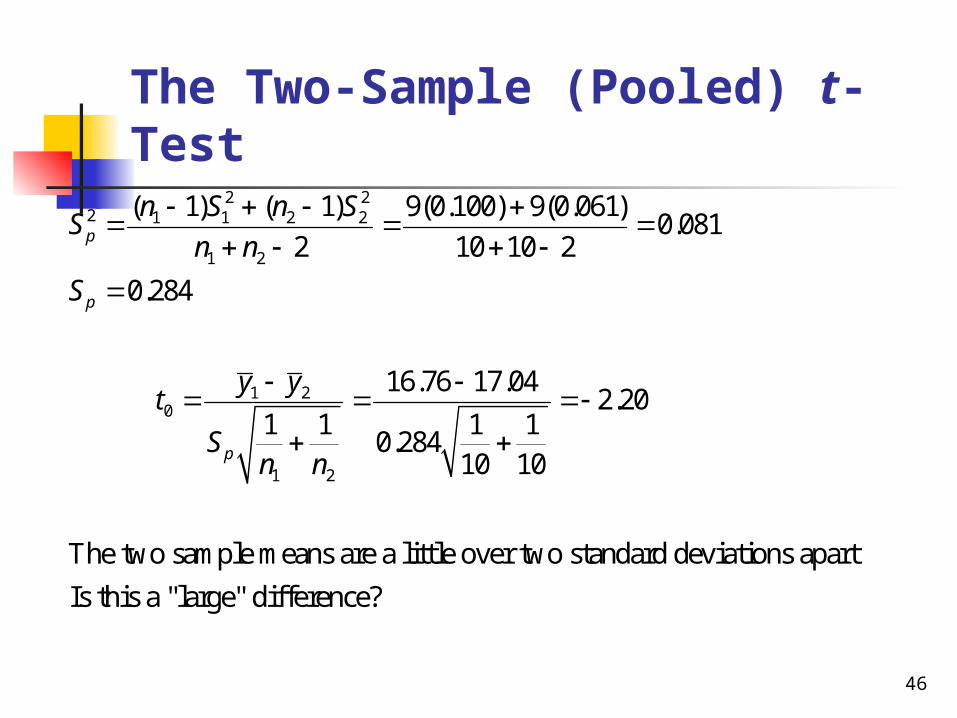
The Two-Sample (Pooled) t-Test2 2
2 1 1 2 2
1 2
1 20
1 2
( 1) ( 1) 9(0.100) 9(0.061)0.081
2 10 10 2
0.284
16.76 17.04 2.20
1 1 1 10.284
10 10
The two sample means are a little over two standard deviations apart
Is t
p
p
p
n S n SS
n n
S
y yt
Sn n
his a "large" difference?
47
Two-Sample-t-Test
P-value– The smallest level of significance that would lead to rejection of the null hypothesis.
Computer application
Two-Sample T-Test and CI
Sample N Mean StDev SE Mean
1 10 16.760 0.316 0.10
2 10 17.040 0.248 0.078
Difference = mu (1) - mu (2)
Estimate for difference: -0.280
95% CI for difference: (-0.547, -0.013)
T-Test of difference = 0 (vs not =): T-Value = -2.20 P-Value = 0.041 DF = 18
Both use Pooled StDev = 0.2840

48/72
William Sealy Gosset (1876, 1937)
Gosset's interest in barley cultivation led him to speculate that design of experiments should aim, not only at improving the average yield, but also at breeding varieties whose yield was insensitive (robust) to variation in soil and climate.
Developed the t-test (1908)
Gosset was a friend of both Karl Pearson and R.A. Fisher, an achievement, for each had a monumental ego and a loathing for the other.
Gosset was a modest man who cut short an admirer with the comment that “Fisher would have discovered it all anyway.”
49
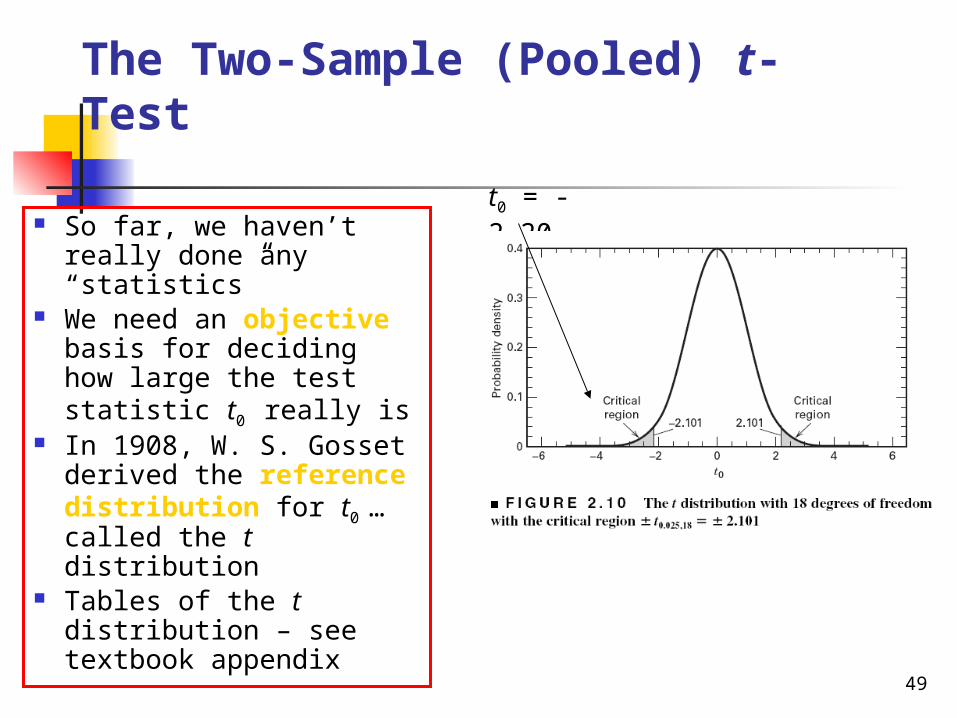
The Two-Sample (Pooled) t-Test
So far, we haven’t really done any “statistics”
We need an objective basis for deciding how large the test statistic t0 really is
In 1908, W. S. Gosset derived the reference distribution for t0 … called the t distribution
Tables of the t distribution – see textbook appendix
t0 = -2.20

50
The Two-Sample (Pooled) t-Test
A value of t0 between –2.101 and 2.101 is consistent with equality of means
It is possible for the means to be equal and t0 to exceed either 2.101 or –2.101, but it would be a “rare event” … leads to the conclusion that the means are different
Could also use the P-value approach
t0 = -2.20

51
The Two-Sample (Pooled) t-Test
The P-value is the area (probability) in the tails of the t-distribution beyond -2.20 + the probability beyond +2.20 (it’s a two-sided test)
The P-value is a measure of how unusual the value of the test statistic is given that the null hypothesis is true
The P-value the risk of wrongly rejecting the null hypothesis of equal means (it measures rareness of the event)
The P-value in our problem is P = 0.042
t0 = -2.20
52/72
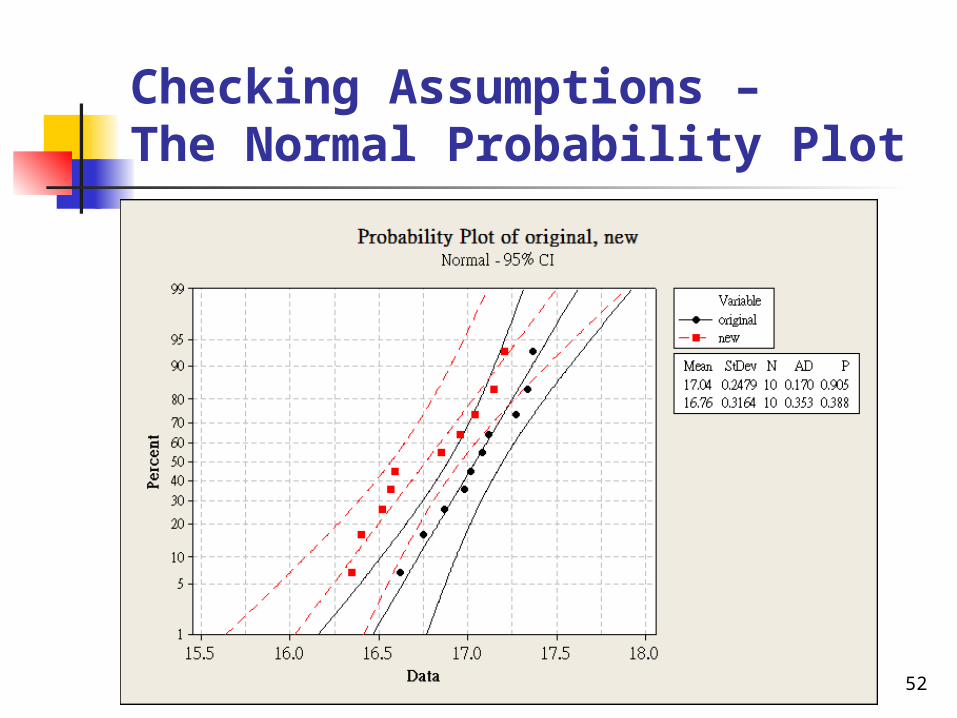
Checking Assumptions – The Normal Probability Plot

Two-sample-t-test--Choice of sample size
The choice of sample size and the probability of type II error β are closely related connected
Suppose that we are testing the hypothesis
And The mean are not equal so that δ=μ1-μ2
Because H0 is not true we care about the probability of wrongly failing to reject H0
type II error53/72
0 1 2
1 1 2
:
:
H
H

54/72
Two-sample-t-test--Choice of sample size
Define
One can find the sample size by varying power (1-β) and δ
2221
d

55/72
Two-sample-t-test--Choice of sample size
Testing mean 1 = mean 2 (versus not =)
Calculating power for mean 1 = mean 2 + difference
Alpha = 0.05 Assumed standard deviation = 0.25
Sample Target
Difference Size Power Actual Power
0.25 27 0.95 0.950077
0.25 23 0.90 0.912498
0.25 10 0.55 0.562007
0.50 8 0.95 0.960221
0.50 7 0.90 0.929070
0.50 4 0.55 0.656876
The sample size is for each group.

56/72
Two-sample-t-test--Choice of sample size

57/54
An Introduction to Experimental Design -How to sample?
A completely randomized design is an experimental design in which the treatments are randomly assigned to the experimental units.
If the experimental units are heterogeneous, blocking can be used to form homogeneous groups, resulting in a randomized block design.

58/54
Completely Randomized Design -How to sample?
Recall Simple Random Sampling Finite populations are often defined by lists
such as: Organization membership roster Credit card account numbers Inventory product numbers

59/54
Completely Randomized Design -How to sample?
A simple random sample of size n from a finite population of size N is a sample selected such that each possible sample of size n has the same probability of being selected.
Replacing each sampled element before selecting subsequent elements is called sampling with replacement.
Sampling without replacement is the procedure used most often.

60/54
Completely Randomized Design -How to sample?
In large sampling projects, computer-generated random numbers are often used to automate the sample selection process.
Excel provides a function for generating random numbers in its worksheets.
Infinite populations are often defined by an ongoing process whereby the elements of the population consist of items generated as though the process would operate indefinitely.

61/54
Completely Randomized Design -How to sample?
A simple random sample from an infinite population is a sample selected such that the following conditions are satisfied. Each element selected comes from the same
population. Each element is selected independently.

62/54
Completely Randomized Design -How to sample?
Random Numbers: the numbers in the table are random, these four-digit numbers are equally likely.

63/54
Completely Randomized Design -How to sample?
Most experiments have critical error on random sampling.
Ex: sampling 8 samples from a production line in one day Wrong method:
Get one sample every 3 hours not random!

64/54
Completely Randomized Design -How to sample?
Ex: sampling 8 samples from a production line Correct method:
You can get one sample at each 3 hours interval but not every 3 hours correct but not a simple random sampling
Get 8 samples in 24 hours Maximum population is 24, getting 8 samples two digits 63, 27, 15, 99, 86, 71, 74, 45, 10, 21, 51, … Larger than 24 is discarded So eight samples are collected at:
15, 10, 21, … hour

65/54
Completely Randomized Design -How to sample?
In Completely Randomized Design, samples are randomly collected by simple random sampling method.
Only one factor is concerned in Completely Randomized Design, and k levels in this factor.
66/72
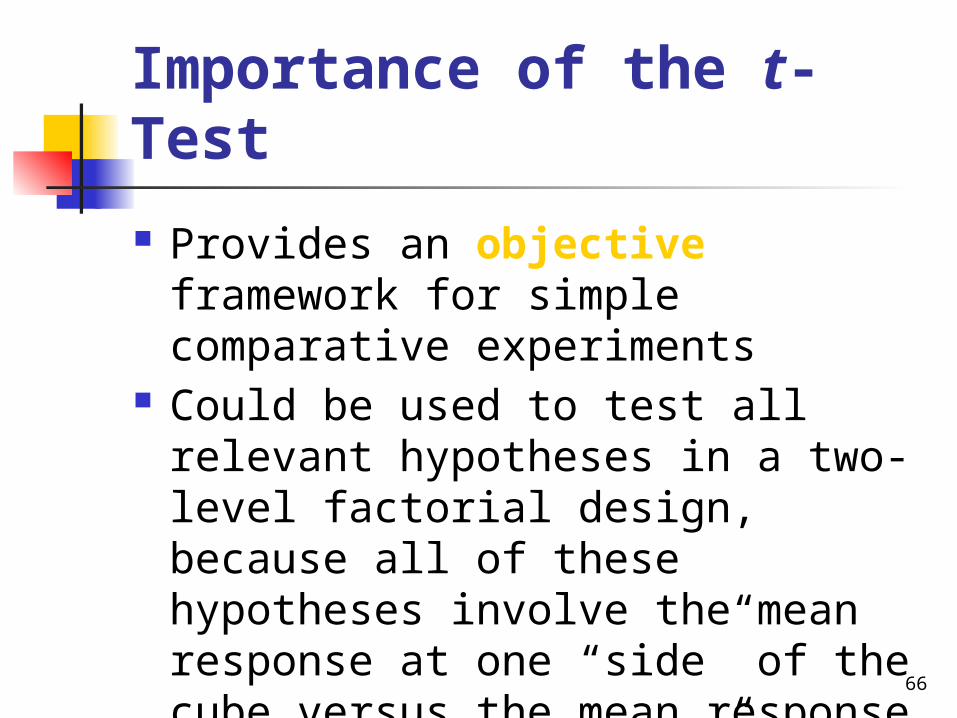
Importance of the t-Test
Provides an objective framework for simple comparative experiments
Could be used to test all relevant hypotheses in a two-level factorial design, because all of these hypotheses involve the mean response at one “side” of the cube versus the mean response at the opposite “side” of the cube

67/72
Two-sample-t-test—Confidence Intervals
Hypothesis testing gives an objective statement concerning the difference in means, but it doesn’t specify “how different” they are
General form of a confidence interval
The 100(1- α)% confidence interval on the difference in two means:
where ( ) 1 L U P L U
1 2
1 2
1 2 / 2, 2 1 2 1 2
1 2 / 2, 2 1 2
(1/ ) (1/ )
(1/ ) (1/ )
n n p
n n p
y y t S n n
y y t S n n

68/72
Two-sample-t-test—Confidence Intervals--example

69/72
Other Topics
Hypothesis testing when the variances are known—two-sample-z-test
One sample inference—one-sample-z or one-sample-t tests
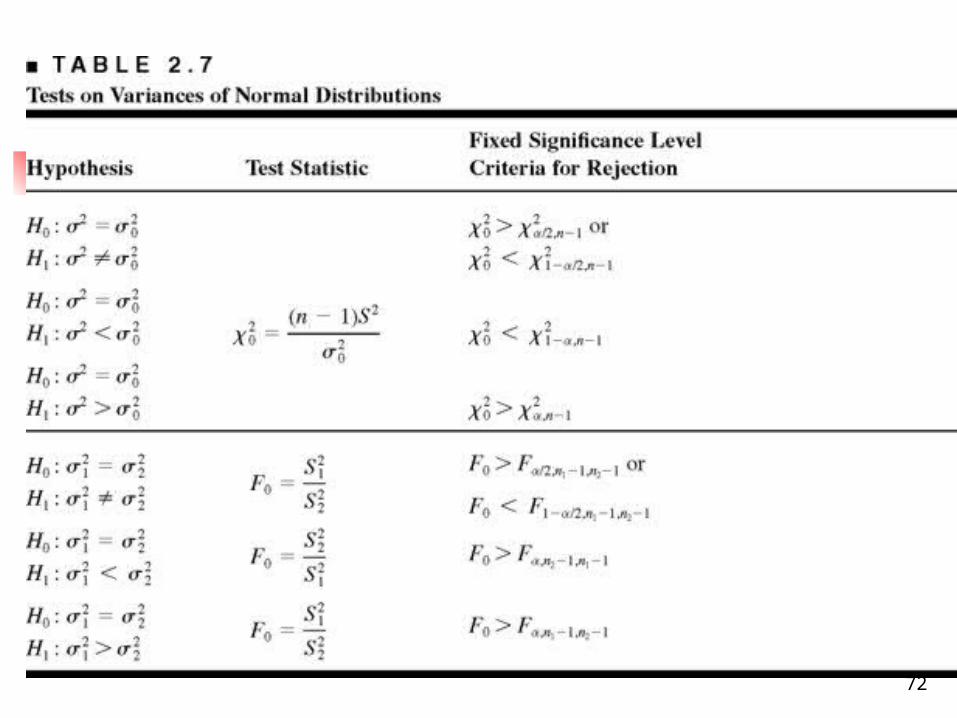
Hypothesis tests on variances– chi-square test
Paired experiments

70/72
Other Topics

71/72
Other Topics
72/72
Other Topics