Some aspects of our projects with Quebec-populations 1. Public Health Research Unit of Laval...
22
Some aspects of our projects with Quebec-populations 1. Public Health Research Unit of Laval University Medical Research Center- CHUQ,Canada 2. Department of Human Biology and Nutritional Sciences, University of Guelph,Cana [email protected] Lucas Michel1 , Blanchet C. 1 , Holub B. J. 2 , Dewailly É. 1 UNIVERSITÉ LAVAL International Scientific Conference on seal oil Ottawa, June 7, 2004
-
Upload
rosamund-higgins -
Category
Documents
-
view
213 -
download
0
Transcript of Some aspects of our projects with Quebec-populations 1. Public Health Research Unit of Laval...

Some aspects of our projects
with Quebec-populations
1. Public Health Research Unit of Laval University Medical Research Center-CHUQ,Canada
2. Department of Human Biology and Nutritional Sciences, University of Guelph,Canada
Lucas Michel1, Blanchet C.1, Holub B. J.2, Dewailly É.1
UNIVERSITÉ
LAVAL
International Scientific Conference on seal oil
Ottawa, June 7, 2004

Santé Santé QuébecQuébec 1990- 1990-
9292
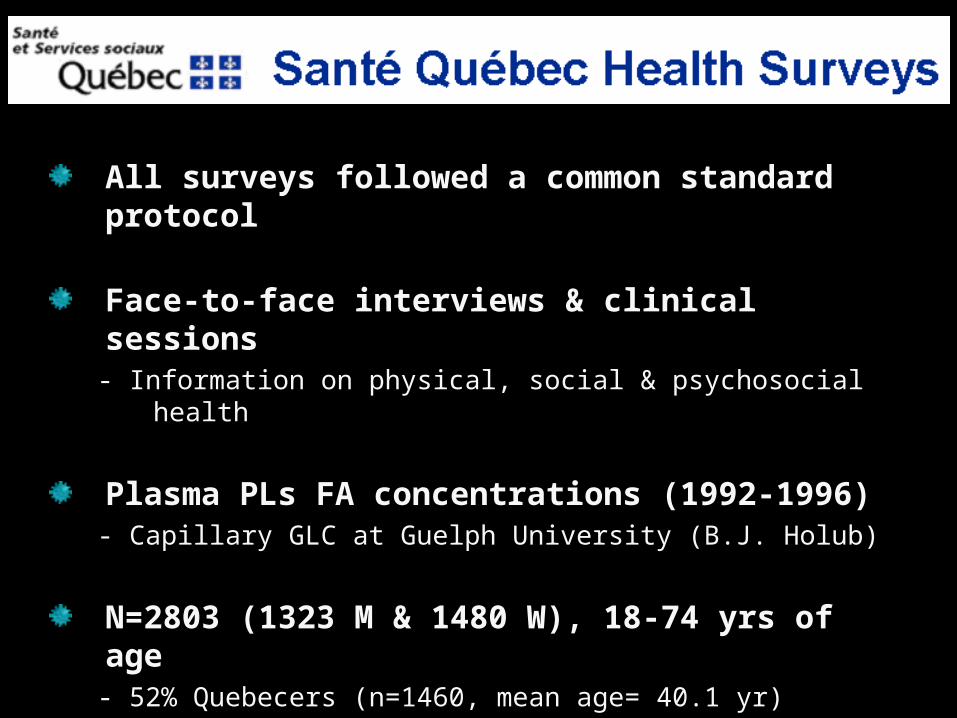
All surveys followed a common standard protocol
Face-to-face interviews & clinical sessions - Information on physical, social & psychosocial health
Plasma PLs FA concentrations (1992-1996)- Capillary GLC at Guelph University (B.J. Holub)
N=2803 (1323 M & 1480 W), 18-74 yrs of age - 52% Quebecers (n=1460, mean age= 40.1 yr)
- 33% Cree (n=917, mean age=35.2 yr)
- 15% Inuit (n=426, mean age=38.2 yr)

Characteristics of subjects who participated in the Santé Québec Health Surveysa,b

P for trend = 0.0002
Mar
ine
Foo
d In
take
(g/
d)
Dewailly et al. Lipids. 2003 Apr;38(4):359-65.
Marine Food Intake (from 24-h dietary recalls)

P for trend = 0.0002
Mar
ine
Foo
d In
take
(g/
d)
Dewailly et al. Lipids. 2003 Apr;38(4):359-65.
Marine Food Intake (from 24-h dietary recalls)
170 mgEPA+DH
A
2115 mgEPA+DH
A700-900 mgEPA+DHA
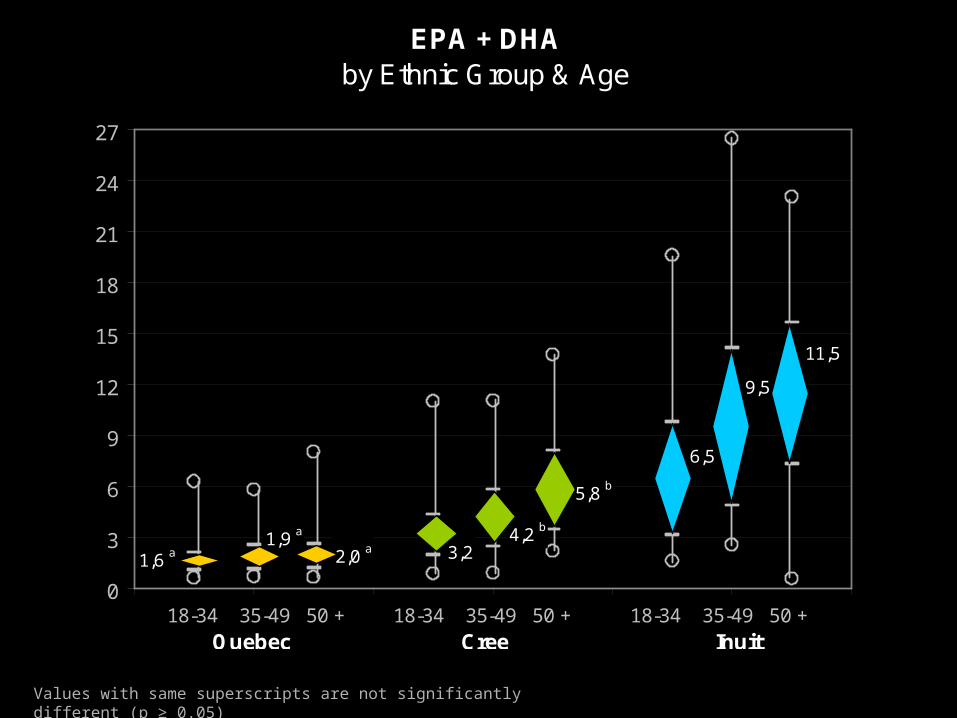
EPA + DHA by Ethnic Group & Age
11,5
9,5
6,5
1,6 a1,9 a
5,8 b
4,2 b
2,0 a 3,2
0
3
6
9
12
15
18
21
24
27
0 2 4 6 8 10 12 18-34 35-49 50 + 18-34 35-49 50 + 18-34 35-49 50 + Quebec Cree Inuit
Values with same superscripts are not significantly different (p ≥ 0.05)

P for trend = 0.0002
Dewailly et al. Lipids. 2003 Apr;38(4):359-65.
TABLE 3 Regression coefficients ( values)1 of EPA+DHA in relation with HDL cholesterol and triacylglycerols as dependant variables.
Quartiles of EPA+DHA coef. (p) coef. (p)
Quartile 1 ( 1.62) 0.088 (0.59) 1.060 (0.002)
Quartile 2 (1.62-2.35) 0.017 (0.95) -0.178 (0.81)
Quartile 3 (2.36-4.03) 0.284 (0.22) -0.962 (0.09)
Quartile 4 ( 4.04) 0.601 (< 0.001) -0.817 (< 0.001)
HDL Triacylglycerols
1 Obtained from multiple linear regression analysis; one model for each CVD risk factor; each model included age, sex, body mass index, waist girth, smoking, alcohol intake
Threshold value for a beneficial effect
0.3% Quebecer
31% Cree
84% Inuit
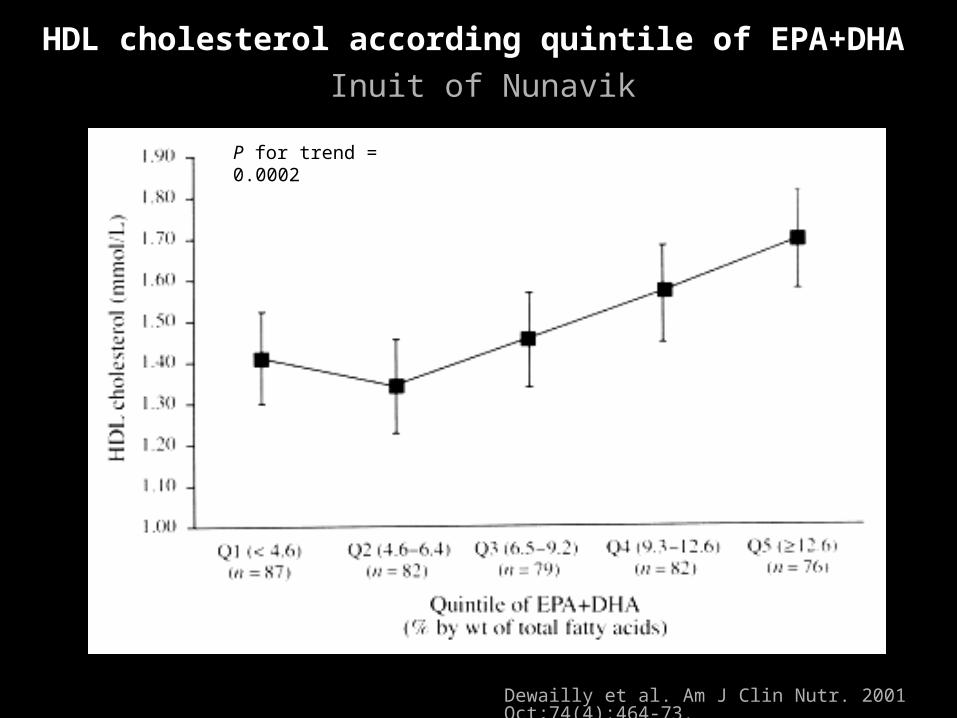
Dewailly et al. Am J Clin Nutr. 2001 Oct;74(4):464-73.
P for trend = 0.0002
HDL cholesterol according quintile of EPA+DHA
Inuit of Nunavik

P for trend = 0.03
Triacylglycerols according to quintile of EPA+DHA
Inuit of Nunavik
Dewailly et al. Am J Clin Nutr. 2001 Oct;74(4):464-73.

P for trend = 0.03
FIG 1. Odds ratios (95% CIs) of prevalent high-risk concentration of plasma HDL-Chol
by quintiles of plasma PLs ratio of EPA/AA.Dewailly et al. Am J Clin Nutr. 2001 Nov;74(5):603-11.
OR for HDL-Chol 0.9 mmol/L
Quebecers

18:2 n-6 18:3 n-3
Four Types of Dietary EFA that predict the % of Highly Unsaturated Fatty Acids (HUFA) in tissues - a useful surrogate clinical marker
Lands, Am J Clin Nutr 1995; 61(suppl): 721S-25S.
Total HUFA
HUFA n-6(20:3, 20:4, 22:4. 22:5n-6)
HUFA n-3(20:3, 20:4, 20:5, 22:5, 22:6n-3)

Arachidonic Acid (20:4n-6) by Ethnic Group & Age
6,1 a6,5 a
6,1 a6,3 a
6,5 a
10,3
9,4
6,3 a
8,7
0
2
4
6
8
10
12
14
16
18
20
0 2 4 6 8 10 12 18-34 35-49 50 + 18-34 35-49 50 + 18-34 35-49 50 + Quebec Cree Inuit
Values with same superscripts are not significantly different (p ≥ 0.05)

EPA + DHA by Ethnic Group & Age
11,5
9,5
6,5
1,6 a1,9 a
5,8 b
4,2 b
2,0 a 3,2
0
3
6
9
12
15
18
21
24
27
0 2 4 6 8 10 12 18-34 35-49 50 + 18-34 35-49 50 + 18-34 35-49 50 + Quebec Cree Inuit
Values with same superscripts are not significantly different (p ≥ 0.05)

%n-3 HUFA (in total HUFA) by Ethnic Group & Age
45
54
61
19 a 20 a
35
29
21 a25
0
10
20
30
40
50
60
70
80
90
0 2 4 6 8 10 12 18-34 35-49 50 + 18-34 35-49 50 + 18-34 35-49 50 + Quebec Cree Inuit
Values with same superscripts are not significantly different (p ≥ 0.05)
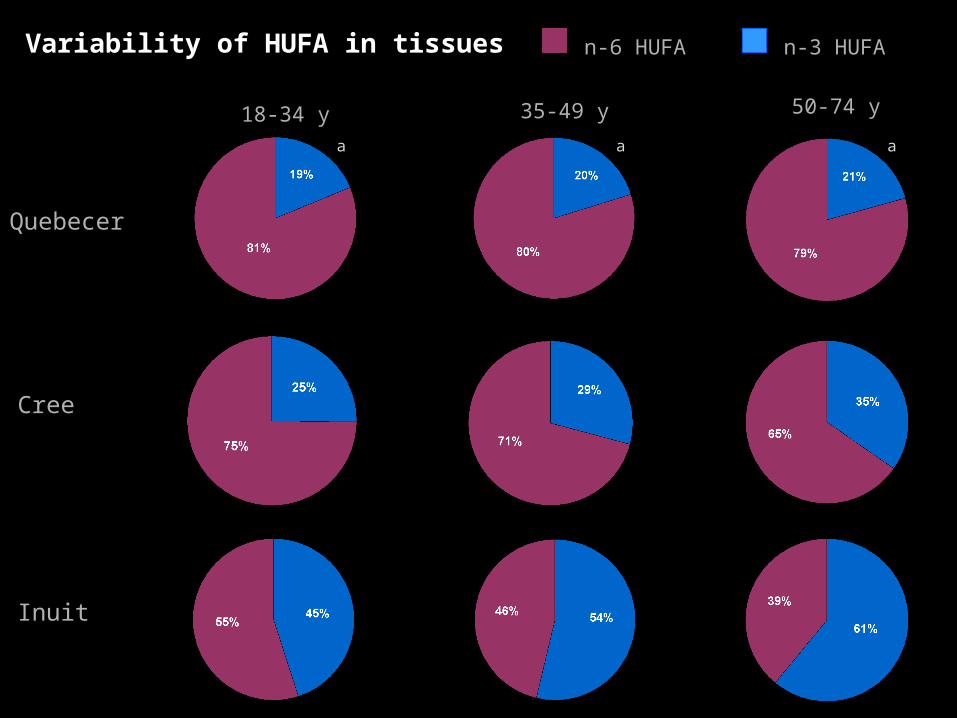
Quebecer
Cree
Inuit
18-34 y 35-49 y 50-74 y
Variability of HUFA in tissues n-6 HUFA n-3 HUFA
a a a

CHD Mortality and Tissue HUFA
y = -2,8075x + 211,97
R2 = 0,9573
0
50
100
150
200
15 25 35 45 55 65 75 85
% omega-3 in Total HUFA
CH
D M
ort
alit
y
Greenland
Japan
Quebec Inuit
Quebec Cree
USA
Quebec All
MRFIT quintiles
Spain
FIG. 2: Coronary heart disease (CHD) mortality rates (for 100,000) associated with tissue HUFA proportions. Lands W.E.M. Lipids 2003 : 317-21.
Lands et al. 1992. BBA. (1180):147-162. Lands et al. 1992. FASEB J.( 6):2530-2536. Dewailly E. et al. 2002. Am J Clin Nutr. 76(1):85-92. Dewailly E. et al. 2002. Am J Clin Nutr. 76(1):85-92. Dewailly E et al. 2001. Am J Clin Nutr 74(5):603-11.
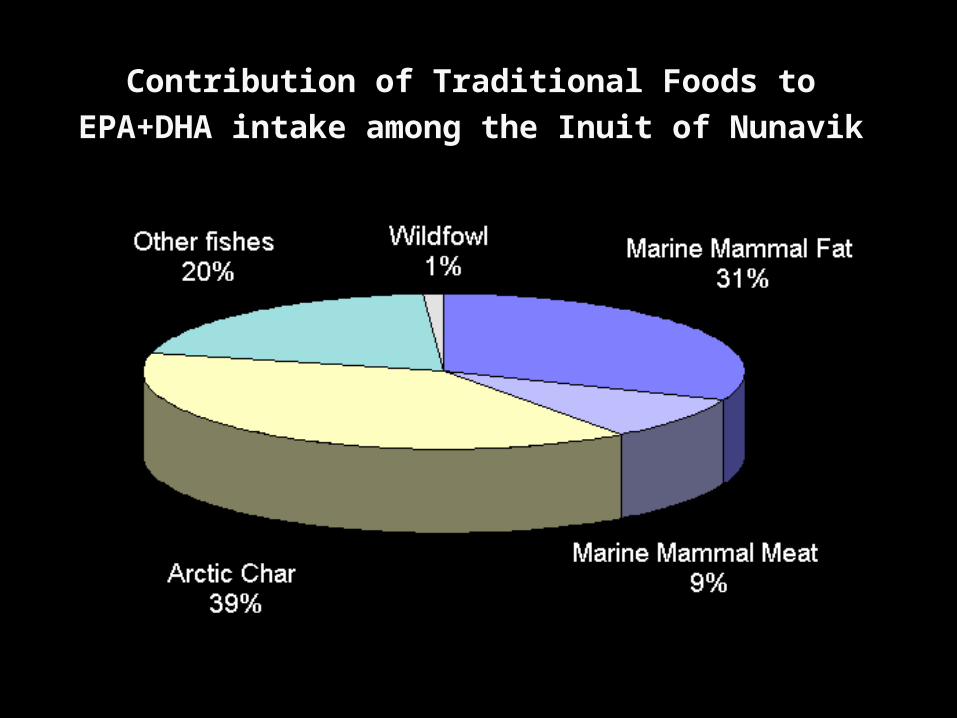
Contribution of Traditional Foods to EPA+DHA intake
among the Inuit of Nunavik

Fat (Misirak): 1.5 g/d
Fat (Misirak): 1.6 g/d
37.1-42.7 g/d
70.8-75.5 g/d
12.4-13.4 g/d
10.4-13.3 g/d
8.6-11.1 g/d
5.7-8.4 g/d
6.9-9.9 g/d

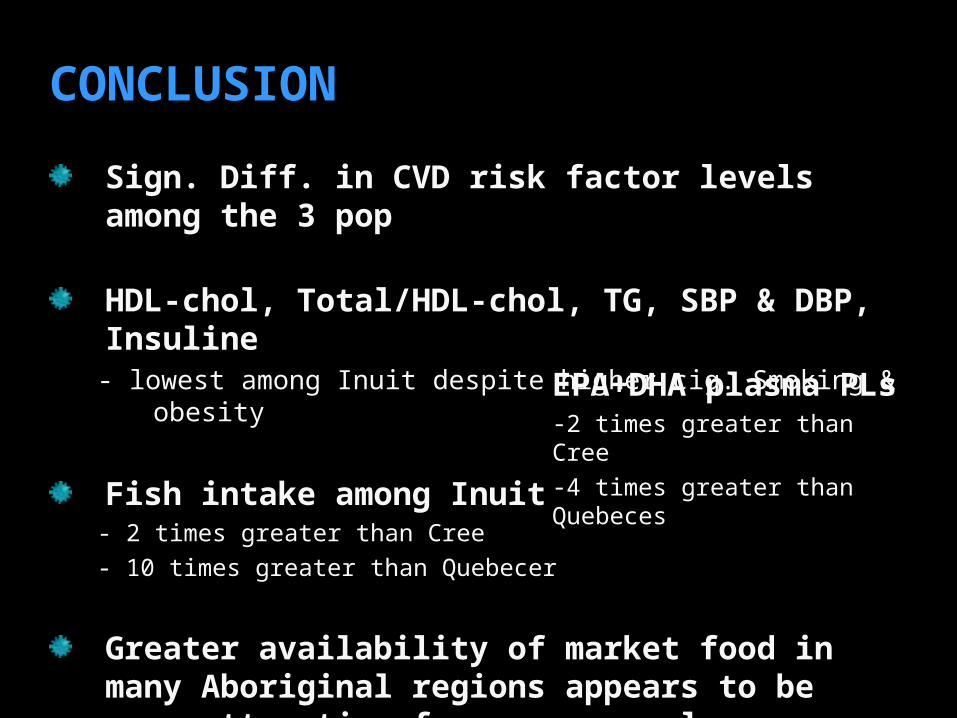
Sign. Diff. in CVD risk factor levels among the 3 pop
HDL-chol, Total/HDL-chol, TG, SBP & DBP, Insuline- lowest among Inuit despite higher cig. Smoking & obesity
Fish intake among Inuit- 2 times greater than Cree
- 10 times greater than Quebecer
CONCLUSION
EPA+DHA plasma PLs-2 times greater than Cree
-4 times greater than Quebeces
EPA+DHA
AHA 2002 ISSFAL 19990.5–1.8 g/day 0.7 g/day
Sign. Diff. in CVD risk factor levels among the 3 pop
HDL-chol, Total/HDL-chol, TG, SBP & DBP, Insuline- lowest among Inuit despite higher cig. Smoking & obesity
Fish intake among Inuit- 2 times greater than Cree
- 10 times greater than Quebecer
Greater availability of market food in many Aboriginal regions appears to be more attracting for young people.
CONCLUSION
EPA+DHA plasma PLs-2 times greater than Cree
-4 times greater than Quebeces

The Inuit Diet and Health Study
An International Study of the Impact of Diet on
Health and Disease among the Inuit and Yupik


![Thymoglobulin (anti-thymocyte globulin [rabbit])products.sanofi.ca/en/Thymoglobulin.pdf · 2016-05-03 · sanofi-aventis Canada Inc. 2905 Place Louis-R.-Renaud . Laval, Quebec H7V](https://static.fdocuments.in/doc/165x107/5d16098d88c99312028e0754/thymoglobulin-anti-thymocyte-globulin-rabbit-2016-05-03-sanofi-aventis.jpg)