Somatic Mutations and Immune Alternation in Rectal Cancer ......8 Department of Gastrointestinal...
54
1 Somatic Mutations and Immune Alternation in Rectal Cancer Following 1 Neoadjuvant Chemoradiotherapy 2 3 Dengbo Ji 1* , Haizhao Yi 1, 2* , Dakui Zhang 3* , Tiancheng Zhan 1 , Zhaowei Li 1 , Ming Li 1 , 4 Jinying Jia 1 , Meng Qiao 1 , Jinhong Xia 1 , Zhiwei Zhai 4 , Can Song 5, 6 , and Jin Gu 1, 6, 7§ 5 6 1 Key laboratory of Carcinogenesis and Translational Research(Ministry of Education), 7 Department of Gastrointestinal Surgery III, Peking University Cancer Hospital & 8 Institute, No. 52 Fucheng Rd., Haidian District, Beijing, China, 100142 9 2 Department of General Surgery 1, Affiliated Hospital of Chengde Medical College, No. 10 36 Nanyingzi Rd., Chengde, China, 067000 11 3 Department of colorectal surgery, China-Japan Friendship Hospital, 100029 12 4 Department of Gastrointestinal Surgery, Chaoyang Hospital, Beijing, China, 100020 13 5 School of Life Sciences, Tsinghua University, Beijing, China, 100084 14 6 Peking-Tsinghua Center for Life Sciences 15 7 Peking University S.G. Hospital 16 17 * These authors contributed equally to this study. 18 Running title: nCRT enables rectal cancer checkpoint blockade therapy 19 Keywords: Rectal Cancer; Neoadjuvant Chemoradiotherapy; Mutation Burden; 20 Checkpoint Blockade Therapy; Immune Activation 21 Grant Support: This work was supported by the National Natural Science 22 on April 7, 2020. © 2018 American Association for Cancer Research. cancerimmunolres.aacrjournals.org Downloaded from Author manuscripts have been peer reviewed and accepted for publication but have not yet been edited. Author Manuscript Published OnlineFirst on October 3, 2018; DOI: 10.1158/2326-6066.CIR-17-0630
Transcript of Somatic Mutations and Immune Alternation in Rectal Cancer ......8 Department of Gastrointestinal...

1
Somatic Mutations and Immune Alternation in Rectal Cancer Following 1
Neoadjuvant Chemoradiotherapy 2
3
Dengbo Ji1*, Haizhao Yi1, 2*, Dakui Zhang3*, Tiancheng Zhan1, Zhaowei Li1, Ming Li1, 4
Jinying Jia1, Meng Qiao1, Jinhong Xia1, Zhiwei Zhai4, Can Song5, 6, and Jin Gu1, 6, 7§ 5
6
1Key laboratory of Carcinogenesis and Translational Research(Ministry of Education), 7
Department of Gastrointestinal Surgery III, Peking University Cancer Hospital & 8
Institute, No. 52 Fucheng Rd., Haidian District, Beijing, China, 100142 9
2 Department of General Surgery 1, Affiliated Hospital of Chengde Medical College, No. 10
36 Nanyingzi Rd., Chengde, China, 067000 11
3 Department of colorectal surgery, China-Japan Friendship Hospital, 100029 12
4 Department of Gastrointestinal Surgery, Chaoyang Hospital, Beijing, China, 100020 13
5School of Life Sciences, Tsinghua University, Beijing, China, 100084 14
6Peking-Tsinghua Center for Life Sciences 15
7Peking University S.G. Hospital 16
17
*These authors contributed equally to this study. 18
Running title: nCRT enables rectal cancer checkpoint blockade therapy 19
Keywords: Rectal Cancer; Neoadjuvant Chemoradiotherapy; Mutation Burden; 20
Checkpoint Blockade Therapy; Immune Activation 21
Grant Support: This work was supported by the National Natural Science 22
on April 7, 2020. © 2018 American Association for Cancer Research. cancerimmunolres.aacrjournals.org Downloaded from
Author manuscripts have been peer reviewed and accepted for publication but have not yet been edited. Author Manuscript Published OnlineFirst on October 3, 2018; DOI: 10.1158/2326-6066.CIR-17-0630

2
Foundation (81772565 to D.B. J, 81372593 to J G, 81201965 to D.B. J), Beijing 23
Natural Science Foundation (7132052 to J G), and the National High Technology 24
Research and Development Program of China (863 Program) (No.2012AA02A506 25
to J G partially , 2014AA020801 to M L partially). 26
§Correspondence to: 27
Jin Gu, MD; FACS 28
Key laboratory of Carcinogenesis and Translational Research (Ministry of 29
Education), Department of Gastrointestinal Surgery III, Peking University Cancer 30
Hospital & Institute, No. 52 Fucheng Road, Haidian District, Beijing, China, 100142, 31
Tel/Fax: +86-10-88196238, e-mail: [email protected] 32
Disclosure of Potential Conflicts of Interest: 33
The authors declare no competing financial interests. 34
Word Counts: Abstract 214; Body 5,484 35
Figures: 7 Figures; 1 Table; 10 Suppl. Figures; 12 Suppl. Tables 36
37
38
39
40
41
42
43
44
45
46
47
48
on April 7, 2020. © 2018 American Association for Cancer Research. cancerimmunolres.aacrjournals.org Downloaded from
Author manuscripts have been peer reviewed and accepted for publication but have not yet been edited. Author Manuscript Published OnlineFirst on October 3, 2018; DOI: 10.1158/2326-6066.CIR-17-0630

3
49
Abstract 50
Checkpoint blockade therapy triggers tumor-specific immune responses in a variety 51
of cancer types. We presumed that rectal cancer patients could have become 52
sensitive to immunotherapy after receiving neoadjuvant chemoradiotherapy (nCRT). 53
In this study, we report immune alternation in post-nCRT patients compared to 54
pretreatment conditions from GEO data. Whole exome sequencing of 14 locally 55
advanced rectal cancer (LARC) patient samples showed that nCRT induced new 56
mutations compared to the paired pre-treatment biopsies evidenced by appearance of 57
a neoantigen landscape. An association was identified between mutation burden and 58
enrichment of immune activation-related pathways. Animal experiment results 59
further demonstrated that radiotherapy enhanced the efficacy of anti–PD-1. 60
Mutation burden and the neoantigens of LARC patients were associated with 61
response to nCRT. The mRNA expression profiling of 66 pre-treatment biopsy 62
samples from LARC patients showed that immune activation-related pathways were 63
enriched in response to nCRT. PD-L1 expression was negatively correlated with 64
disease-free survival in the CD8-low expression group who received nCRT in a 65
cohort of 296 samples. Thus, nCRT was able to alter immune function in LARC 66
patients, which may be associated with the appearance of neoantigens. Neoantigens 67
could make rectal cancer patients potential candidates to receive checkpoint 68
blockade immunotherapy, and mutation burden could be a useful biomarker to 69
stratify patients into responding and non-responding groups for immunotherapy. 70
71
on April 7, 2020. © 2018 American Association for Cancer Research. cancerimmunolres.aacrjournals.org Downloaded from
Author manuscripts have been peer reviewed and accepted for publication but have not yet been edited. Author Manuscript Published OnlineFirst on October 3, 2018; DOI: 10.1158/2326-6066.CIR-17-0630

4
Introduction 72
The treatment guidelines, published by the National Comprehensive Cancer Network 73
(NCCN) of the United States, clearly states that pre-operative neoadjuvant 74
chemoradiotherapy is crucial for rectal cancer treatment, which can improve the rate 75
of curative resection and significantly reduce local recurrence (1,2). Although local 76
recurrence and overall survival have improved, distant recurrence rate has not 77
decreased significantly. About 30% of patients treated with a curative regiment will 78
eventually develop distant metastases (3-5). Adjuvant drug therapy has been used to 79
prevent distant metastases by eliminating circulating tumor cells and 80
micrometastases. However, the use of adjuvant chemotherapy for patients with rectal 81
cancer treated with pre-operative chemoradiotherapy and surgery is still 82
controversial (6). Administration of adjuvant chemotherapy to patients with stage II 83
or III rectal cancer was based on results from phase 3 trials of adjuvant treatment for 84
colon cancer (7-10) , as well as from trials in patients with rectal cancer who were 85
treated without pre-operative chemoradiotherapy (11). Fluorouracil-based adjuvant 86
chemotherapy did not improve overall survival, disease-free survival, or distant 87
recurrences.(6,12) 88
Colorectal cancers (CRCs) with a high density of tumor-infiltrating lymphocytes 89
(TILs), especially CD8+ T lymphocytes, are associated with a better prognosis 90
(13-16), suggesting that a cytotoxic antitumor immune response is involved in 91
controlling cancer progression. Checkpoint blockade immunotherapy has improved 92
cancer treatment. Along with radical surgery, radiation therapy, chemotherapy, and 93
on April 7, 2020. © 2018 American Association for Cancer Research. cancerimmunolres.aacrjournals.org Downloaded from
Author manuscripts have been peer reviewed and accepted for publication but have not yet been edited. Author Manuscript Published OnlineFirst on October 3, 2018; DOI: 10.1158/2326-6066.CIR-17-0630
5
targeted oncogene treatment, checkpoint blockade is on the top of the list of 94
therapeutic options. Checkpoint blockade therapy utilizes monoclonal antibodies 95
(mAbs) to rescue suppressed T cells through activating and restoring their antitumor 96
activity (17). Similarly, targeting cytotoxic T lymphocyte–associated antigen 4 97
(CTLA-4) and programmed cell-death protein-1 (PD-1) pathways in metastatic 98
melanoma, non–small-cell lung cancer (NSCLC), and other malignancies has 99
significantly prolonged survival (18-20). 100
Despite revolutionary achievements, the efficacy of checkpoint blockade 101
immunotherapy varies among different tumor types, and a few cancer types, such as 102
CRC, appear to be refractory to this therapy (19,21). A notable exception is that 103
patients with mismatch repair (MMR)-deficient CRC lesions obtain clinical benefits 104
from the administration of anti–PD-1 (22). 105
Increasing evidence indicates that antitumor effects, clinically noted with checkpoint 106
inhibitors such as ipilimumab, may rely on boosting tumor-specific immune 107
responses that were pre-existing or newly induced. High somatic mutation loads are 108
correlated with responsiveness to PD-1 blockade therapy in NSCLC, melanoma, and 109
MMR-deficient CRCs (22-24). Research has revealed that radiation can not only 110
reduce tumor burden but also enhance antitumor immune responses to tumor cells 111
(25). The combination of radiation therapy, anti–CTLA-4, and anti–PD-L1 promotes 112
clinical responses in melanoma (26). 113
Therefore, we hypothesized that rectal cancer patients could be potential candidates 114
for checkpoint blockade immunotherapy after receiving nCRT. To test this 115
on April 7, 2020. © 2018 American Association for Cancer Research. cancerimmunolres.aacrjournals.org Downloaded from
Author manuscripts have been peer reviewed and accepted for publication but have not yet been edited. Author Manuscript Published OnlineFirst on October 3, 2018; DOI: 10.1158/2326-6066.CIR-17-0630

6
hypothesis, whole-exome sequencing of rectal cancer pre- and post- nCRT samples 116
was performed to analyze the mutational landscape differences. We further 117
performed an integrative analysis of mutational landscape and gene expression using 118
TCGA and GSE data to evaluate the influence of somatic mutations and its 119
association with immune response induced by treatment. 120
121
Methods and Materials 122
Patients and samples 123
Sample collection and usage was approved by the Ethics Review Committees of 124
Peking University Cancer Hospital & Institute and in accordance with the Declaration 125
of Helsinki. All patients were informed prior to the study and a consent form was 126
signed by each participant. 127
Tumor and paired normal adjacent tissue samples from cohort 1 included 14 LARC 128
patients who received nCRT and were used for whole-exome sequencing. 9 paired 129
LARC tumor tissues were obtained pre- and post-nCRT, and the remaining patients 130
only had pre-therapy biopsies due to complete pathological response (pCR) or near 131
pCR after nCRT. Pre-treatment blood samples from cohort 2 consisted of 42 LARC 132
patients who received nCRT and were used for circulating tumor DNA (ctDNA) 133
extraction and targeted ctDNA sequencing. The normal adjacent biopsies from 134
patients of cohort 2 were obtained for tissues DNA extraction and used as control. All 135
the tissue and blood samples were from patients who received nCRT and surgical 136
resections between 2014 and 2016 at the Peking University Cancer Hospital & 137
on April 7, 2020. © 2018 American Association for Cancer Research. cancerimmunolres.aacrjournals.org Downloaded from
Author manuscripts have been peer reviewed and accepted for publication but have not yet been edited. Author Manuscript Published OnlineFirst on October 3, 2018; DOI: 10.1158/2326-6066.CIR-17-0630

7
Institute (Beijing, China). Pre-treatment tumor staging was performed in all patients 138
using endorectal ultrasonography, pelvic magnetic resonance imaging, or computed 139
tomography. The radiotherapy regimen consisted of a 50.6 Gy dose delivered in 22 140
fractions with concurrent capecitabine treatment at a dose of 825 mg/m2 orally twice 141
per day for 5 weeks. 142
Inclusion criteria were: 1. diagnosis of rectal adenocarcinoma by biopsy; 2. tumor 143
staged as T3-4 or any T, N+ by endorectal ultrasonography, pelvic magnetic 144
resonance imaging, or computed tomography. Exclusion criteria were: 1. previous 145
chemotherapy or pelvic radiation; 2. presence of any other malignant disorders or 146
other chronic diseases. For cohort 1, biopsies pre nCRT collected by rectoscopy and 147
tissue samples collected by surgical resection were stored immediately in frozen in 148
liquid nitrogen and stored at −80°C until use. For cohort 2, 3.5 mL of venous blood 149
was collected prior to nCRT from each patient and processed within 1 h based on 150
protocols of NCI’s Early Detection Research Networks (EDRN). Plasma was 151
harvested after centrifugation twice at 1,600g for 10min aliquoted immediately for 152
ctDNA extraction or stored at -80 C. 153
In order to generate differential mRNA profiling between responders and 154
non-responders to nRT and evaluate the influence of PD-1 and PD-L1 on prognosis 155
after neoadjuvant therapy, large-scale cohorts of pre-therapy biopsy and cancerous 156
tissue samples were selected and categorized into cohorts 3, 4, and 5. Cohort 3 was 157
composed of biopsy samples from 66 patients before nRT and resection. All patients 158
were treated with intermediate-fraction nRT (30 Gy/10 fractions) followed by a total 159
on April 7, 2020. © 2018 American Association for Cancer Research. cancerimmunolres.aacrjournals.org Downloaded from
Author manuscripts have been peer reviewed and accepted for publication but have not yet been edited. Author Manuscript Published OnlineFirst on October 3, 2018; DOI: 10.1158/2326-6066.CIR-17-0630

8
mesorectal excision (TME) surgery. The patients achieving Grade 0 and 1 evaluated 160
using tumor regression grade (TRG) system were defined as responders. The patients 161
with Grade 3 were defined as non-responders. Inclusion criteria were: 1. diagnosis of 162
rectal adenocarcinoma by biopsy; 2. tumor staged as T3-4 or any T, N+ by endorectal 163
ultrasonography, pelvic magnetic resonance imaging, or computed tomography; 3. no 164
evidence of distant metastasis. Patients with the following characteristics were 165
excluded: 1. previous chemotherapy or pelvic radiation; 2. presence of any other 166
malignant disorders or other chronic diseases. Biopsies were collected by rectoscopy 167
and stored immediately in RNAlater (Qiagen) and then stored at −80°C until use. 168
Cohort 4 consisted of 294 CRC patients who did not receive nRT, and the samples 169
were collected after surgical resection. Patients with stage I-IV colorectal cancer, and 170
with clinicopathological characteristics and follow-up information available, were 171
included. We excluded patients if they had any other malignant disorders or other 172
chronic diseases, previous treatment with any anticancer therapy, presence of any 173
tumor type other than adenocarcinoma or mucinous carcinoma, and familial 174
adenomatous polyposis CRC. 175
Cohort 5 included 296 samples from patients who received nRT, and the samples 176
were collected after resection. The radiation dosage was 30 Gy and delivered in 10 177
fractions over 2 weeks. Inclusion criteria were: 1. diagnosis of rectal 178
adenocarcinoma by biopsy; 2. tumor staged as T3-4 or any T, N+ by endorectal 179
ultrasonography, pelvic magnetic resonance imaging, or computed tomography; 3. 180
no evidence of distant metastasis. Patients with the following characteristics were 181
on April 7, 2020. © 2018 American Association for Cancer Research. cancerimmunolres.aacrjournals.org Downloaded from
Author manuscripts have been peer reviewed and accepted for publication but have not yet been edited. Author Manuscript Published OnlineFirst on October 3, 2018; DOI: 10.1158/2326-6066.CIR-17-0630

9
excluded: 1. previous chemotherapy or pelvic radiation; 2. presence of any other 182
malignant disorders or other chronic diseases. For cohort 4 and 5, tumor tissue 183
samples were directly collected after surgical resection. All samples were 184
immediately frozen in liquid nitrogen and stored at −80°C or fixed in 10% formalin 185
for paraffin embedding. 186
A summary of the clinical characteristics of these patients is shown in 187
Supplementary Table S1-5. 188
189
Assessment of treatment response and tumor downstaging 190
The 7th edition of the American Joint Committee on Cancer TNM system was used 191
for Pathological staging(27). Neoadjuvant radiotherapy effect was evaluated after 192
surgery by specialized gastrointestinal pathologists using tumor regression grade 193
(TRG) system as follows: Grade 0: complete regression, no tumor cells; Grade 1: 194
single or small groups of tumor cells, moderate response; Grade 2: residual cancer 195
outgrown by fibrosis, minimal response; Grade 3: minimal or no tumor cells killed, 196
poor response. 197
198
Whole-exome capture and sequencing 199
Sample preparation, library construction, exome capture, next generation sequencing, 200
and bioinformatics analysis were performed at Shanghai Biotechnology Corporation. 201
(Shanghai, China). Genomic DNA from cohort 1 tumor samples was randomly 202
fragmented and used to construct an in vitro shotgun library. For each sample to be 203
on April 7, 2020. © 2018 American Association for Cancer Research. cancerimmunolres.aacrjournals.org Downloaded from
Author manuscripts have been peer reviewed and accepted for publication but have not yet been edited. Author Manuscript Published OnlineFirst on October 3, 2018; DOI: 10.1158/2326-6066.CIR-17-0630

10
sequenced, individual library preparations, hybridizations, and captures were 204
performed following the protocol of SureSelectXT Target Enrichment System for 205
Illumina Paired-End Sequencing Library (Agilent Technologies, Inc. 5301 Stevens 206
Creek Rd Santa Clara, CA95051 USA). The library fragments were flanked by index 207
adaptors following end repair and A-tailing addition. The library was further 208
enriched with biotinylated probes (SureSelect biotinylated library mix) for sequences 209
corresponding to exons through aqueous-phase hybridization capture. The 210
hybridized fragments were captured by streptavidin-based magnetic beads 211
(Dynabeads MyOne Streptavidin T1, Life Technologies, cat#65603), followed by 212
amplification, quality inspection, and massive parallel sequencing of the enriched 213
library. Quantity of library was assessed with Qubit 2.0 Fluoromete. The quality and 214
size range was assessed using 2100 Bioanalyzer High Sensitivity DNA Assay as 215
instructed in the reagent kit guide. BaseCalls directory, containing the binary base 216
call files (BCL files), was generated by Real Time Analysis (RTA, Illumina, 217
California, USA). The bcl2fastq (v1.8.3, Illumina, California, USA) was used to 218
combine the per-cycle BCL files in each run and translate them into FASTQ files. 219
The FASTQ files were aligned to a human reference genome (hg19) by 220
Burrows-Wheeler Aligner (BWA, v0.7.12,(28,29) (Sanger Institute, Cambridge, 221
UK). The aligned files (SAM/BAM format files) were initially sorted by SAM tools 222
(30)(v0.1.19, Sanger Institute, Cambridge, UK). The aligned read duplicating the 223
start position of another read was flagged as a duplicate (‘Mark duplicate’) by using 224
Picard Tools (v1.107, Broad Institute, Cambridge, MA, USA). Data was processed 225
on April 7, 2020. © 2018 American Association for Cancer Research. cancerimmunolres.aacrjournals.org Downloaded from
Author manuscripts have been peer reviewed and accepted for publication but have not yet been edited. Author Manuscript Published OnlineFirst on October 3, 2018; DOI: 10.1158/2326-6066.CIR-17-0630

11
using the Genome Analysis Toolkit (GATK, v3.1, Broad Institute, Cambridge, MA, 226
USA). Reads were locally realigned (GATK IndelRealigner), and the base qualities 227
were recalibrated (GATK BaseRecalibrator). Final mapping statistics, including 228
coverage and depth, were generated from recalibrated files by BED tools(31) 229
(v2.16.1, Quinlan Laboratory at the University of Virginia) and perl/python scripts. 230
The readings were further formatted with SAM tools, duplication was removed with 231
Picard, local realignment around InDels was processed by GATK InDelRealigner, 232
and base quality score recalibration was performed by using GATK Base 233
Recalibrator. Potential somatic substitutions were identified using GATK Unified 234
Genotyper followed by variant annotation through Annovar/VEP/snpEFF. 235
Somatic mutations were determined using MuTect2 (32)(Broad Institute, Cambridge, 236
MA, USA ) to identify mutations in matched tumor and normal samples. A detailed 237
MuTect2 procedure is available at http://www.broadinstitute.org/cancer/cga/mutect/. 238
The paired sample data was finally filtered by ANNOVAR(33) (Wed, 17 Jun 2015, 239
Center for Applied Genomics, Children’s Hospital of Philadelphia, Department of 240
Biostatistics and Epidemiology and Department of Pediatrics, University of 241
Pennsylvania, Philadelphia, PA, USA) for further analysis. 242
243
Targeted ctDNA sequencing 244
Sample preparation, library construction, exome capture, next generation sequencing, 245
and bioinformatics analysis were performed at Genecast Biotechnology Co., Ltd. 246
(Beijing, China). Plasma from cohort 2 blood samples was harvested after 247
on April 7, 2020. © 2018 American Association for Cancer Research. cancerimmunolres.aacrjournals.org Downloaded from
Author manuscripts have been peer reviewed and accepted for publication but have not yet been edited. Author Manuscript Published OnlineFirst on October 3, 2018; DOI: 10.1158/2326-6066.CIR-17-0630

12
centrifugation twice at 1,600 x g for 10 minutes and aliquoted immediately for ctDNA 248
extraction or stored at -80°C. ctDNA was extracted from 2 mL of plasma using the 249
MagMAXTM Cell-Free DNA isolation kit (Life Technologies, California, USA) and 250
quantified by Qubit dsDNA HS Assay kit or Qubit dsDNA BR Assay kit (Life 251
Technologies, California, USA). 252
Genomic DNA was sheared into 150-200 bp fragments with Covaris M220 253
Focused-ultrasonicatorTM Instrument (Covaris, Massachusetts, USA). Fragmented 254
DNA and the ctDNA library were constructed by KAPA HTP Library Preparation Kit 255
(Illumina platforms, KAPA Biosystems, Massachusetts, USA), following 256
manufacturer’s instructions. DNA libraries were captured following NimbleGen 257
SeqCap EZ Library SR (Roche, Wisconsin, USA) Users’ Guide, with a designed 0.8M 258
size panel (Genecast Biotech, Beijing, China), which included 325 major 259
tumor-related genes. The captured samples were subjected to Illumina HiSeq X-Ten 260
for paired-end sequencing. 261
Paired-end reads generated from Hiseq X-Ten platform were mapped to the hg19 262
reference genome with BWA v0.7.12 (default parameters)(28,29)(Sanger Institute, 263
Cambridge, UK), then sorted, filtered, and indexed with SAM tools(30)(1.3, Sanger 264
Institute, Cambridge, UK). In order to identify somatic single nucleotide 265
polymorphisms (SNPs) and indel mutations, the obtained BAM files from both 266
plasma and matched normal tissues from each patient were processed for pairwise 267
variant calling using VarScan (34)(v2.3.8, The Genome Institue, Washington 268
University, St. Louis, Missouri, USA). Minimum coverage for calling somatic 269
variants in matched normal tissues samples and plasma samples were 5 and 3, 270
on April 7, 2020. © 2018 American Association for Cancer Research. cancerimmunolres.aacrjournals.org Downloaded from
Author manuscripts have been peer reviewed and accepted for publication but have not yet been edited. Author Manuscript Published OnlineFirst on October 3, 2018; DOI: 10.1158/2326-6066.CIR-17-0630

13
respectively. P-value threshold to call a somatic site was 0.05, and variants with 271
<90% strand bias were kept for further study. The generated candidate mutations 272
were annotated using ANNOVAR software (33)(Wed, 17 Jun 2015, Center for 273
Applied Genomics, Children’s Hospital of Philadelphia, Department of Biostatistics 274
and Epidemiology and Department of Pediatrics, University of Pennsylvania, 275
Philadelphia, PA, USA), the dbNSFP and Exome Aggregation Consortum (ExAC) 276
database were used to remove either the benign mutations with pp2_hdiv score < 277
0.452 or the population polymorphic sites. Finally, the resulted nonsynonymous 278
mutations at the exonic regions were reserved. Tumor mutation burden (TMB) was 279
defined as the number of non-synonymous mutations per megabase of exonic region. 280
281
Mismatch repair status testing 282
Mismatch repair status was assessed using the MSI Analysis System (Promega, 283
Madison, WI), consisting of 5 pseudomonomorphic mononucleotide repeats (BAT-25, 284
BAT-26, NR-21, NR-24, and MONO-27) to detect MSI and 2-pentanucleotide repeat 285
loci (PentaC and PentaD). According to the manufacturer’s guidelines, 2ng template 286
DNA for each sample was added into the Amplification Mix including nuclease-free 287
water, gold ST*R buffer, MSI primer pair mix and AmpliTaq Gold DNA polymerase 288
(Life Technologies Cat.# N8080242) and mix gently. For the positive amplification 289
control, 2ng of the diluted K562 High Molecular Weight DNA was added into the 290
Amplification Mix. For the negative amplification control, nuclease-fee water (instead 291
of template DNA) was added into Amplification Mix. Amplification was performed 292
in a GeneAmpR PCR System 9600 (Applied Biosystems). Amplification conditions 293
were as follows: 95°C for 11 minutes, 96°C for 1 minute, then: 94°C for 30 seconds, 294
on April 7, 2020. © 2018 American Association for Cancer Research. cancerimmunolres.aacrjournals.org Downloaded from
Author manuscripts have been peer reviewed and accepted for publication but have not yet been edited. Author Manuscript Published OnlineFirst on October 3, 2018; DOI: 10.1158/2326-6066.CIR-17-0630

14
ramp 68 seconds to 58°C, hold for 30 seconds, ramp 50 seconds to 70°C, hold for 1 295
minute, for 10 cycles, then: 90°C for 30 seconds, ramp 60 seconds to 58°C, hold for 296
30 seconds, ramp 50 seconds to 70°C, hold for 1 minute for 20 cycles, then: 60°C for 297
30 minutes, 4°C soak. The primers used were provided in the MSI Analysis System 298
(Promega, Madison, WI). Following amplification of DNA, the fluorescent PCR 299
products were analyzed with the Applied Biosystems 3130xl Gene Analyzer using 300
GeneScan analysis software (Applied Biosystems, Foster City, CA, USA). The length 301
of the sequence was determined for each microsatellite locus, and the tumors were 302
designated as high-frequency MSI (MSI-H) if two or more mononucleotide loci varies 303
were identified in length compared to the germline DNA. One vary was considered as 304
low-frequency MSI (MSI-L) and none as microsatellite stable (MSS). 305
306
RNA isolation and microarray analyses 307
Total RNA from cohort 3 biopsy samples was isolated using TRIzol reagent (Life 308
technologies, Carlsbad, CA, US), according to the manufacturer’s instructions, and 309
purified by using the RNeasy Mini Kit (Qiagen, GmBH, Germany). RNA samples of 310
each group were subsequently used to generate fluorescence-labeled cRNA targets 311
for the Affymetrix Human U133 Plus 2 arrays (Affymetrix, Santa Clara, CA, US;312
Ca#900467). The labeled cRNA targets were then hybridized on slides. After 313
hybridization, slides were scanned by GeneChip® Scanner 3000 (Affymetrix, Santa 314
Clara, CA, US). Data were extracted with Command Console Software 4.0 315
(Affymetrix, Santa Clara, CA, US). Raw data were normalized by the MAS 5.0 316
on April 7, 2020. © 2018 American Association for Cancer Research. cancerimmunolres.aacrjournals.org Downloaded from
Author manuscripts have been peer reviewed and accepted for publication but have not yet been edited. Author Manuscript Published OnlineFirst on October 3, 2018; DOI: 10.1158/2326-6066.CIR-17-0630

15
algorithm and Gene Spring Software v12.6.1 (Agilent technologies, Santa Clara, CA, 317
US). The microarray experiments were performed following the protocol of 318
Affymetrix Inc. (Shanghai Biotechnology Corporation, China). 319
320
Cell lines 321
The MC38 cell line was purchased from National Infrastructure of Cell Line Resource 322
(Beijing, China) and was maintained in RPMI 1640 with 10% fetal bovine serum 323
(Gibco, Carlsbad, CA), penicillin sodium (100 U/mL), and streptomycin sulfate (100 324
mg/mL) in humidified 5% CO2 at 37°C. The cell line was tested and authenticated by 325
(STR) profiling. Cells were routinely tested for mycoplasma infection and used only 326
when negative. Cells were passaged a maximum of 3-4 times in vitro before they were 327
used in in vivo experiments. 328
329
In vivo mouse studies 330
Four- to six-week old male C57BL/6 mice were purchased from Beijing 331
Vitalriver Experimental Animal Technology Co. Ltd. (Beijing, China). Mice were 332
maintained in a pathogen-free facility and used in accordance with the institutional 333
guidelines for animal care. All animal experiments were performed following 334
protocols approved by the Institutional Animal Care and Use Committee (IACUC) at 335
the Peking University Cancer Hospital. MC38 (1×10⁴) cells were mixed with an equal 336
volume of Matrigel (BD Biosciences) and subcutaneously injected on the right leg of 337
the mice on day 0. The tumors were irradiated with 8 Gy on day 15. Blocking 338
on April 7, 2020. © 2018 American Association for Cancer Research. cancerimmunolres.aacrjournals.org Downloaded from
Author manuscripts have been peer reviewed and accepted for publication but have not yet been edited. Author Manuscript Published OnlineFirst on October 3, 2018; DOI: 10.1158/2326-6066.CIR-17-0630
16
antibodies (PD-1, clone RMP1-14; PD-L1, clone 10F.9G2 and rat IgG2B isotype, 339
clone LTF-2, all from BioXCell) were given intraperitoneally on days 16, 19, and 22. 340
All irradiation was performed using the Edge linear accelerator (Varian Medical 341
Systems, Inc., Palo Alto, CA). Antibodies used for in vivo immune checkpoint 342
blockade experiments were given intraperitoneally at a dose of 200 μg/mouse and 343
include: PD-1 (clone RMP1-14), PD-L1 (clone 10F.9G2), and rat IgG2B isotype 344
(clone LTF-2) (all from BioXCell). The tumor volumes were measured using CT 345
scans and MRI once a week. Volume was calculated using the formula L × A × B × 346
0.52, where L is the longest dimension and A and B are long and short diameters of 347
the largest coronal section, respectively. The untreated tumor volumes were 348
determined at day 14 using CT scans and were considered as a baseline tumor volume 349
(Vcont). Normalized tumor response to treatment was the measured volume (V) 350
relative to Vcont. The tumor volumes were also measured using calipers every three 351
days. Differences in survival were determined for each group by the Kaplan-Meier 352
method. The overall p-value was calculated by the log-rank test. For mouse studies, 353
an event was defined as death or when tumor burden reached a protocol-specified size 354
of 1.5 cm in maximum dimension to minimize morbidity (26). 355
356
Immunohistochemical analysis on tissue microarrays (TMAs) 357
Immunohistochemistry was performed on TMAs using rabbit polyclonal anti-human 358
PD-1 (LS-B540, LifeSpan BioSciences, USA), anti-human PD-L1 (ab58810, Abcam, 359
USA), anti-human PD-L2 (HPA013411, Sigma, USA), mouse monoclonal 360
on April 7, 2020. © 2018 American Association for Cancer Research. cancerimmunolres.aacrjournals.org Downloaded from
Author manuscripts have been peer reviewed and accepted for publication but have not yet been edited. Author Manuscript Published OnlineFirst on October 3, 2018; DOI: 10.1158/2326-6066.CIR-17-0630

17
anti-human CD8 (clone 4B11, Novus Biologicals, USA). All images were examined 361
by two experienced pathologists independently. For PD-L1 and PD-L2, the 362
immunoreactivity of the proteins detected was recorded through the intensity of 363
staining, and the percentage of immunoreactive cells scored as: tissues with no 364
staining were rated as 0, with a faint or moderate staining to strong staining in <25% 365
of cells rated as 1, strong staining in 25–50% of cells rated as 2, and strong staining 366
in >50% of cells rated as 3. The slides were further analyzed to identify PD-1 and 367
CD8 using an image analysis workstation (Spot Browser, Alphelys). The total 368
number of PD-1+ or CD8+ cells in each tissue spot was counted, and the density of 369
PD-1+ or CD8+ TILs was defined as the cell number per square millimeter. 370
371
TCGA and GEO datasets 372
Level 3 TCGA RNA-seq and DNA exome-seq data for rectal cancer patients with 373
clinical information was downloaded from the TCGA data portal, including 341 rectal 374
cancer samples on 18 July, 2015. The cases that had clear information about nCRT 375
were analyzed, including 7 rectal cancers with nCRT and 41 without nCRT. 376
EdgeR-normalized data of these 48 cases were used for correlative analysis. 377
Two patient datasets of rectal cancer were downloaded from the Gene Expression 378
Omnibus (GEO) database. GSE 15781 consisted of 22 patients with resectable 379
adenocarcinoma of the rectum, in which thirteen patients had surgery only, and nine 380
patients received nCRT. GSE 45404 included pre-treatment biopsies of 42 rectal 381
cancer patients who received nCRT with conventional fractionation (≥50 Gy in 28 382
on April 7, 2020. © 2018 American Association for Cancer Research. cancerimmunolres.aacrjournals.org Downloaded from
Author manuscripts have been peer reviewed and accepted for publication but have not yet been edited. Author Manuscript Published OnlineFirst on October 3, 2018; DOI: 10.1158/2326-6066.CIR-17-0630

18
fractions, 1.8 Gy/day, 5 sessions per week) and 5-fluorouracil (5-FU)-based 383
chemotherapy. 384
385
Mutant peptide MHC binding prediction 386
All non-synonymous point mutations identified were translated into strings of 17 387
amino acids, with the mutant amino acid situated centrally according to previous 388
research (23,24). Our initial analysis was focused on HLA-A and HLA-B (reference 389
set of 27 alleles was assembled and covered >97% of population (35), the accession 390
numbers for the reference alleles were shown in Supplementary Table S6). The 17 391
mutant amino acid fragments were analyzed by the epitope prediction program 392
NetMHC v4.0 (http://www.cbs.dtu.dk/services/NetMHC/). Epitopes with a predicted 393
affinity of <50 nm were considered to be strong potential binders, and epitopes with a 394
predicted affinity of <500 nm were considered weak potential binders, as suggested 395
by the NetMHC group. To further refine the total neoantigen burden, we repeated the 396
same process for the complementary wild-type peptide for each mutant peptide. The 397
mutant peptides that held strong potential binders were used to compare with the 398
complementary wild-type peptide, which was predicted to have a weak potential 399
binder. These mutant peptides were referred to as mutation-associated neoantigens. 400
These mutant peptides were further evaluated for putative binding to the T-cell 401
receptor (TCR) using the IEDB immunogenicity predictor with patient-specific HLA 402
types (http://tools.immuneepitope.org/immunogenicity/) and CTLPred 403
(http://www.imtech.res.in/raghava/ctlpred/). 404
on April 7, 2020. © 2018 American Association for Cancer Research. cancerimmunolres.aacrjournals.org Downloaded from
Author manuscripts have been peer reviewed and accepted for publication but have not yet been edited. Author Manuscript Published OnlineFirst on October 3, 2018; DOI: 10.1158/2326-6066.CIR-17-0630

19
405
Statistics 406
The Mann-Whitney test and Student t test were used to compare mutation burdens and 407
differences in the frequency of nucleotide changes. The log-rank test was used to 408
compare Kaplan-Meier survival curves. Correlations between the non-synonymous 409
mutation burden and the neoantigen burden, frequency of the neoantigen 410
burden/non-synonymous mutation, and immune response were calculated using the 411
Pearson correlation formula. A mixed effect linear model was used to determine 412
significance of differences in tumor growth. Statistical analyses were performed using 413
GraphPad Prism v.6. 414
Availability of data and material 415
Whole-exome sequencing data are available under the NCBI Sequence Read 416
Archive (SRA) study accession no. SRP159539. Microarray data are prepared 417
according to minimum information about a microarray gene experiment (MIAME) 418
guidelines and deposited in the GENE Expression Omnibus (GEO) database. The 419
GEO accession number is GSE119409. 420
421
Results 422
nCRT induces immune activation in LARC 423
To assess whether nCRT could affect the immune response, we compared rectal 424
cancer samples with and without treatment from GEO data (GSE 15781) using GSEA. 425
This data consisted of 22 patients with resectable adenocarcinoma of the rectum. 426
on April 7, 2020. © 2018 American Association for Cancer Research. cancerimmunolres.aacrjournals.org Downloaded from
Author manuscripts have been peer reviewed and accepted for publication but have not yet been edited. Author Manuscript Published OnlineFirst on October 3, 2018; DOI: 10.1158/2326-6066.CIR-17-0630

20
Thirteen patients had surgery only, and nine patients received nCRT. The irradiated 427
and non-irradiated tumor tissues and normal tissues were used to perform 428
genome-wide gene expression analysis. A supervised method (Significance Analysis 429
of Microarrays -SAM-) was initially used to identify a statistical significance 430
(adjusted p<0.05) in differentially expressed genes between samples with and without 431
nCRT treatment. 3359 differentially expressed genes were identified between these 432
two subgroups. Of which, 1840 genes revealed significantly higher expression in 433
post-treatment samples, whereas 1519 genes showed lower expression. A hierarchical 434
clustering analysis was subsequently performed based on the expression values of the 435
3359 genes in the 22 samples (Supplementary Fig. S1) to categorize the samples into 436
2 main subgroups (branches), in which the gene expressions showed the opposite 437
trend. 438
To further investigate the mechanism of the immune response alternation after the 439
chemoradiotherapy, the differentially expressed genes induced by chemoradiotherapy 440
with the immune-related genes defined by Gene Ontology (1776 genes) were 441
compared. A total of 342 immune-related genes were altered, with most being 442
upregulated. Unsupervised hierarchical clustering of this subset of overlapping genes 443
resulted in a clear separation of the samples by nCRT (Fig. 1A and B). 444
Reactome pathway analysis showed that immune activation-related pathways were 445
induced, including interferon signaling, antigen presentation, class I MHC-mediated 446
antigen processing and presentation, PD-1 signaling, peptide-ligand binding receptors, 447
and co-stimulation from the CD28 family (Table 1). Amongst the altered 342 448
on April 7, 2020. © 2018 American Association for Cancer Research. cancerimmunolres.aacrjournals.org Downloaded from
Author manuscripts have been peer reviewed and accepted for publication but have not yet been edited. Author Manuscript Published OnlineFirst on October 3, 2018; DOI: 10.1158/2326-6066.CIR-17-0630

21
immune-related genes, 17 genes fell into the CD28 costimulatory signal pathway 449
(defined by Reactome pathway database) (Fig. 1B). CD28, CD86, HLA class II 450
molecules, PIK3CA, PTPN11, MAPKAP1, GRB2, VAV1, FYN, and MAP3K8 were 451
upregulated (Fig 1C). In contrast, PAK1, PPP2R1A, and MLST8 were downregulated. 452
The expression of T-cell differentiation and activation markers were analyzed, and the 453
results revealed that differentiation markers (KLRG1 and PTPRC) and activation 454
markers (CD69, IL2RA, CD38) (36,37) were upregulated in LARC samples following 455
nCRT (Fig. 1D). 456
We then focused on the differentially expressed genes and performed gene set 457
enrichment analysis using a prior defined immunological signature set (signature of 458
gene expression upon perturbation of certain immune-related genes). Post-treatment 459
LARC was characterized by increased expression of most immune-related genes and 460
associated with a diffuse immune infiltrate mainly composed of TH1 cells and 461
cytotoxic T cells expressing checkpoint molecules (Fig. 1E). 462
To further assess the effect of nCRT on the infiltration of specific immune cell 463
subsets, we used CIBERSORT (38) as an approach to dissect infiltration of specific 464
immune cell subsets in the tumors. The higher fractions of monocytes, activated 465
dendritic cells, and neutrophils cells were found in rectal cancers with nCRT. The 466
faction of gamma delta T cells slightly increased from 0 to 0.78% following nCRT 467
(Supplementary Fig. S2). The list of differentially expressed genes, immune genes, 468
and CD28 co-stimulatory signals are presented in Supplementary Tables S7-9. 469
on April 7, 2020. © 2018 American Association for Cancer Research. cancerimmunolres.aacrjournals.org Downloaded from
Author manuscripts have been peer reviewed and accepted for publication but have not yet been edited. Author Manuscript Published OnlineFirst on October 3, 2018; DOI: 10.1158/2326-6066.CIR-17-0630

22
nCRT influences the mutational landscape of LARC 470
Pre- and post-nCRT tumor samples from 9 of the 14 patients of cohort 1 were 471
collected and sequenced, and the other 5 cases only had biopsy samples prior to 472
therapy because of pathologically invisible tumor masses after achieving pCR. The 473
tumor DNA sequencing generated a mean target coverage of 239X, and a mean of 474
99.8% of the target sequence was identified as a depth of minimum 10X. A median of 475
80 non-synonymous mutations per pre-nCRT sample (range 3 to 313) was detected. 476
The median number of exonic mutations per pre-nCRT sample was 122 (range 3 to 477
455). The microsatellite instability status of the nine cases was tested, and all cases 478
were microsatellite stable (MSS). The quantity and range of mutations were similar to 479
published series of CRCs (22). The nCRT-induced mutations appeared in 480
post-treatment samples. The median number of exonic mutations induced by nCRT 481
was 23 compared to pre-treatment samples (range 8 to 89). The median 482
non-synonymous mutation induced by nCRT was 15 per post-nCRT sample (range 6 483
to 57). 484
nCRT influences the neoantigens landscape of LARC 485
The landscape of neoantigens according to previously described methods (23,24) were 486
examined. This approach identified mutant nonamers with ≤500 nM binding affinity 487
for patient-specific class I human lymphocyte antigen (HLA) alleles, which were 488
considered candidate neoantigens. A median of 58 candidate neoantigens from each 489
pre-treatment tumor (range 0 to 256) and the quantity of neoantigens per tumor 490
correlated with mutation burden was identified (Pearson r 0.9491, p<0.0001; Fig. 2A). 491
on April 7, 2020. © 2018 American Association for Cancer Research. cancerimmunolres.aacrjournals.org Downloaded from
Author manuscripts have been peer reviewed and accepted for publication but have not yet been edited. Author Manuscript Published OnlineFirst on October 3, 2018; DOI: 10.1158/2326-6066.CIR-17-0630

23
New mutations induced by nCRT from post-treatment tumors also resulted in a 492
median of 11 candidate neoantigens with a range 3 to 50. These candidate neoantigens 493
significantly correlated with new mutation numbers (Pearson r=0.9640, p<0.0001; Fig. 494
2B). 495
The mutational landscape from TCGA data analysis of rectal cancer with and without 496
nCRT showed that the median non-synonymous mutation burden was 163 in tumors 497
from patients with nCRT compared to 120 in patients without nCRT (Student t test, 498
p=0.0387; Fig. 2C). The median candidate neoantigens per tumor was 22 (range 0 to 499
55), and the quantity of neoantigens per tumor correlated with mutation burden 500
(Pearson r=0.9988, p<0.0001; Fig. 2D). The median putative neoantigens binding to 501
the TCR was 18 in with nCRT patients compared to 14 in without nCRT. 502
(Mann-Whitney test, p=0.01, Fig. 2E) 503
Immune activation is related to neoantigens arising from mutation burden 504
To further confirm that immune activation following nCRT was related to 505
neoantigens arising from mutation burden, the correlation between the number of 506
mutations and the expression of all genes in rectal cancer from the TCGA DNA 507
exome-seq and RNA-seq data was studied. An ordered list of 354 significant related 508
genes were generated (Pearson r>0.8 or r<-0.8, p<0.01) for the Reactome pathway 509
database analysis. The enriched pathways focused on the immune system, signal 510
transduction, and developmental biology. An association was identified between 511
mutation burden and enrichment of immune activation-related pathways, including 512
on April 7, 2020. © 2018 American Association for Cancer Research. cancerimmunolres.aacrjournals.org Downloaded from
Author manuscripts have been peer reviewed and accepted for publication but have not yet been edited. Author Manuscript Published OnlineFirst on October 3, 2018; DOI: 10.1158/2326-6066.CIR-17-0630

24
alpha-defensins, IL2 family signaling, and other several interleukin-related pathways 513
(interleukin receptor SHC signaling, interleukin-19, 20, 22, 24, 26, 28, and 29 514
signaling, interleukin-3, 5 and GM-CSF signaling, interleukin-17 signaling) (Table 515
1). 516
RT combined with anti–PD-1 enhances control of tumor growth 517
To understand the contribution of RT to immune checkpoint blockade, we utilized 518
the MC38 CRC mouse model. Mice with right leg tumors received irradiation (RT), 519
anti–PD-1/PD-L1 (PD1/PDL1, anti-PD-1/PD-L1 are abbreviated as PD-1/PDL1), or 520
both treatments delivered sequentially (RT+PD1 or RT+PDL1) (Fig. 3A). Tumor 521
growth was controlled by RT, PD1, RT+PD1, and RT+PDL1 (p=0.0163, p=0.02, 522
p<0.0001, p=0.0035, respectively), and tumor growth was well-controlled when 523
RT+PD1 was administered compared to either treatment alone (p=0.0037, p=0.0021). 524
No significant differences among PDL1, RT, and RT+PDL1 treatments were seen 525
(Fig. 3B-D). 526
Kaplan-Meier analysis showed that PD1, RT, RT+PD1, PDL1, and RT+PDL1 527
improved the survival of mice (p=0.001, p=0.018 for comparisons of PD1 and PDL1 528
treatment groups, respectively). The largest improvement in survival was observed in 529
the RT+PD1 group. When compared with RT or PD1 alone, RT combined with PD1 530
still improved the survival significantly (p=0.046, p=0.042, respectively). No 531
significant difference among PDL1, RT, and RT+PDL1 groups was found (Fig. 3E). 532
Mutation burden and neoantigens correlated with the response to nCRT 533
on April 7, 2020. © 2018 American Association for Cancer Research. cancerimmunolres.aacrjournals.org Downloaded from
Author manuscripts have been peer reviewed and accepted for publication but have not yet been edited. Author Manuscript Published OnlineFirst on October 3, 2018; DOI: 10.1158/2326-6066.CIR-17-0630

25
The analysis of whole-exome sequencing indicated that rectal cancers with higher 534
mutation burden were more sensitive to nCRT (Fig.4 and 5A). The results showed 535
high numbers of somatic mutations in pre-nCRT biopsies, whcih were associated with 536
tumor regression grade (TRG; Pearson r=-0.5418, p=0.0454; Fig.5A). The potential 537
mutation-associated neoantigen numbers were negatively correlated with TRG but 538
was not statistically significant (Pearson r=-0.3684, p=0.1949; Fig. 5B). 539
Target-capture sequencing of plasma ctDNA and matched normal tissue DNA (cohort 540
2) was performed to detect somatic mutations in each sample, achieving a mean 541
sequencing coverage of 2313×(914~3792×) for plasma ctDNA and 1675×(765~2649×) 542
for normal tissue DNA. The correlation between the tumor mutation burden (TMB) of 543
ctDNA and the tumor regression grade varied among the patients (mean 9.76 544
mutation/Mb, range 4–16 mutations/Mb; Fig. 5C). TMB was associated with the 545
tumor regression grade (Pearson r=-0.3636, p=0.0179; Fig. 5D). The mean TMB was 546
higher in pCR patients than in non-pCR patients (13 vs 9.22, respectively; p=0.0014; 547
Fig. 5E). The patients were divided into two groups by assessing the percentage of 548
viable residual tumor cells less or more than 30% in the resected specimens. The 549
mean TMB was higher in the <30% group than in the >30% group (10.5 vs 8.78, 550
respectively; p=0.0472; Fig. 5F). 551
Immune activity correlated with the response to nCRT 552
To further investigate the correlation between gene expression and response to nRT, 553
mRNA expression in pre-therapy biopsies of cohort 3 was profiled into responding 554
(n=19) and non-responding (n=47) groups. A supervised method (Significance 555
on April 7, 2020. © 2018 American Association for Cancer Research. cancerimmunolres.aacrjournals.org Downloaded from
Author manuscripts have been peer reviewed and accepted for publication but have not yet been edited. Author Manuscript Published OnlineFirst on October 3, 2018; DOI: 10.1158/2326-6066.CIR-17-0630

26
Analysis of Microarrays -SAM-) was used to find statistical significance (adjusted 556
p<0.05) in differentially expressed genes between responding and non-responding 557
groups. A total of 59 genes were differentially expressed between these two 558
subgroups (p<0.05, fold change >1.5), with most genes presenting significantly 559
higher expression in the responding group and 4 genes with lower expression 560
(Supplementary Fig. S3). Reactome pathway analysis showed that the immune 561
activation-related pathways were enriched, including interleukin-10 signaling, 562
chemokine receptors bind chemokines, cytokine signaling in immune system, 563
peptide ligand-binding receptors, immune system, PD-1 signaling, interferon 564
signaling, and co-stimulation factors within the CD28 family (Supplementary Table 565
S10). 566
We also compared responding and non-responding rectal cancer pre-treatment 567
biopsies from GEO data (GSE 45404) consisting of 42 patients who received nCRT 568
with conventional fractionation (≥50 Gy in 28 fractions, 1.8 Gy/day, 5 sessions per 569
week) and 5-fluorouracil (5-FU)-based chemotherapy. The readings from the 570
pre-treatment patients responding (n=19) and non-responding (n=23) to 571
chemoradiotherapy were compared. Reactome pathway analysis showed similar 572
results to cohort 3(Supplementary Table S10). 573
The correlation between infiltrating immune cells and response to nCRT was further 574
assessed using CIBERSORT. The results of cohort 3 showed that the fractions of 575
CD8+ T cells (19% vs. 12%) and activated CD4+ memory T cells (0.47% vs. 0) in the 576
responding group were higher than the non-responding group. In the non-responding 577
on April 7, 2020. © 2018 American Association for Cancer Research. cancerimmunolres.aacrjournals.org Downloaded from
Author manuscripts have been peer reviewed and accepted for publication but have not yet been edited. Author Manuscript Published OnlineFirst on October 3, 2018; DOI: 10.1158/2326-6066.CIR-17-0630

27
group, the fraction of regulatory T cells (Tregs) was higher than the responding 578
group (2.29% vs. 0.59%). GSE 45404 data also showed a significant increase in the 579
fractions of CD8+ T cells (1.99% vs. 0%) and activated CD4+ memory T cells 580
(7.67% vs. 2.97%) in the responding group compared to the non-responding group 581
(Supplementary Fig. S4). 582
PD-L1 expression negatively correlates with prognosis 583
The expression pattern of PD-L1, PD-1, and PDL2 in tumors and corresponding 584
non-tumor tissue of cohort 4 was studied using IHC. PD-L1 was expressed not only 585
on tumor cells, but also on TILs. The majority of PD-L1 expression was in the tumor 586
cells, whereas weak expression was observed on TILs (Fig. 6A). A high expression 587
of PD-L1 was detected in epithelial cells with elevated expression in tumor tissue 588
compared with normal tissue (Z=-5.538, p<0.0001). 589
Expression of PD-L1 was correlated with M stage (Spearman r=0.13, p=0.03), 590
differentiation (Spearman r=0.131, p=0.029), and histological type (U=3.8158, 591
p=0.000136). PD-L1 expression in liver metastasis tissues was lower than expression 592
in paired primary tumor tissues (Z=-2.346, p=0.019, Supplementary Table S11). 593
Positive PD-L1 expression in CRC tissues was associated with a shorter overall 594
survival (OS, p=0.065) and disease-free survival (DFS, p=0.06) (Supplementary Fig. 595
S5A and B), although the tendency was not statistically significant. For stage I–III 596
CRC patients, positive PD-L1 expression was significantly associated with poor OS 597
(p=0.019) (Fig. 6B), whereas for stage IV CRC patients, positive PD-L1 expression 598
on April 7, 2020. © 2018 American Association for Cancer Research. cancerimmunolres.aacrjournals.org Downloaded from
Author manuscripts have been peer reviewed and accepted for publication but have not yet been edited. Author Manuscript Published OnlineFirst on October 3, 2018; DOI: 10.1158/2326-6066.CIR-17-0630

28
was significantly associated with favorable prognosis of CRC (p=0.001) 599
(Supplementary Fig. S5C). 600
The association between PD-L1 expression and prognosis of rectal cancer indicated 601
that positive PD-L1 expression was significantly associated with poor prognosis of 602
rectal cancer (for DFS, p=0.031; for OS, p=0.043) (Fig. 6C and D). No significant 603
correlation between PD-L1 and prognosis of colon cancer was found 604
(Supplementary Fig. S5D and E). We further performed subgroup analysis in 605
different stages of colon and rectal cancers to ascertain the effect of primary tumor 606
location on the correlation. For stage I–III rectal cancer patients, positive P-DL1 607
expression was significantly associated with poor OS (p=0.023; Supplementary Fig. 608
S6A). In stage IV rectal cancer, PD-L1 expression was associated with better OS 609
(p=0.011; Supplementary Fig. S6B). However, no significant correlation between 610
PD-L1 and prognosis of colon cancer, whether in stage I-III (p=0.069, 611
Supplementary Fig.6C) or stage IV (p=0.169; Supplementary Fig. S6D), was found. 612
PD-1 was also expressed in tumor cells and TILs, with TILs having the highest 613
expression. PD-1 expression was negatively correlated with tumor cell 614
differentiation (Spearman r=-0.135, p=0.022), but no significant correlation between 615
PD-1 and other clinical-pathological findings was found (Supplementary Table S11, 616
Supplementary Fig. S7A-D). 617
PD-L2 was also expressed not only in tumor cells, but also in TILs. However, the 618
majority of PD-L2 expression was in tumor cells (Supplementary Fig. S8A). High 619
on April 7, 2020. © 2018 American Association for Cancer Research. cancerimmunolres.aacrjournals.org Downloaded from
Author manuscripts have been peer reviewed and accepted for publication but have not yet been edited. Author Manuscript Published OnlineFirst on October 3, 2018; DOI: 10.1158/2326-6066.CIR-17-0630

29
PD-L2 expression was significantly associated with better OS (p=0.001; 620
Supplementary Fig. S8B) in all stage CRC patients. Specifically, for stage I–III CRC 621
patients, high PD-L2 expression was significantly associated with better OS (p=0.042; 622
Supplementary Fig. S8C), whereas for stage IV CRC patients, high PD-L2 expression 623
was associated with poor prognosis (p=0.067; Supplementary Fig. S8D). We also 624
performed subgroup analysis in different stages of colon and rectal cancers. For colon 625
cancer patients, a significant positive correlation between PD-L2 and prognosis in all 626
stages was seen (p<0.0001; Supplementary Fig. S8E). However, no significant 627
correlation between PD-L2 and prognosis was found in stage I-III or stage IV alone. 628
For all stage rectal cancer patients, no significant correlation between PD-L2 and 629
prognosis was seen. For stage I–III rectal cancer patients, there was no significant 630
correlation between PD-L2 and prognosis, but in stage IV rectal cancer, PD-L2 631
expression was associated with poor OS (p<0.0001, Supplementary Fig. S8F). 632
PD-L1 and PD-1 after nCRT correlated with CD45RO, CD8 and outcomes 633
To determine whether PD-L1 and PD-1 were associated with clinical and pathologic 634
features in LARC patients, tissue microarray analysis of 296 LARC patients from 635
cohort 5 was performed. The patients’ profile is listed in Supplementary Table S5 and 636
the tumor-infiltrating cytotoxic lymphocytes are shown in Fig. 7A and B. No 637
significant correlation was found between PD-L1, PD-1, and clinical-pathological 638
parameters observed (Supplementary Table S12). 639
To understand the relationship between PD-1, PDL-1, CD45RO, and CD8, the 640
on April 7, 2020. © 2018 American Association for Cancer Research. cancerimmunolres.aacrjournals.org Downloaded from
Author manuscripts have been peer reviewed and accepted for publication but have not yet been edited. Author Manuscript Published OnlineFirst on October 3, 2018; DOI: 10.1158/2326-6066.CIR-17-0630
30
correlation coefficients of PD-1, PD-L1, CD45RO, and CD8 expression among all 641
patient samples were calculated. PD-L1 was significantly correlated with CD45RO 642
(r=0.157, p=0.009, Spearman’s test) and CD8 (r=0.278, p=0.000, Spearman’s test). 643
No correlation was found between PD-1 and CD8 or CD45RO (Supplementary Table 644
S12). 645
Our previous work demonstrated that CD45RO expression significantly correlates 646
with prognosis of LARC patients with neoadjuvant radiotherapy (39). To determine if 647
prognostic associations existed between the expression of PD-L1, PD-1, CD8, and 648
patient survival, Kaplan–Meier survival curves were plotted. Again, no significant 649
correlation between DFS or OS and the expression of the proteins was found 650
(Supplementary Fig. S9A-F). 651
These results suggested that PD-1, PD-L1, and CD8 were not independent prognostic 652
factors for patient survival. However, if the patient survival was plotted against a 653
combination of PD-L1 with CD8, in the CD8-low expression group, a significant 654
negative correlation was observed in DFS (p=0.042; Fig. 7C). It seemed that 655
CD8-high expression was not associated with DFS and OS (Supplementary Fig. S10A 656
and B). The association of patient survival with the combination of PDL1 with 657
CD45RO, in the CD45RO-low expression group, a negative correlation was observed 658
in overall patient survival (p=0.081) or DFS (p=0.099), although it was not 659
statistically significant (Supplementary Fig. S10C and D). 660
661
Discussion 662
on April 7, 2020. © 2018 American Association for Cancer Research. cancerimmunolres.aacrjournals.org Downloaded from
Author manuscripts have been peer reviewed and accepted for publication but have not yet been edited. Author Manuscript Published OnlineFirst on October 3, 2018; DOI: 10.1158/2326-6066.CIR-17-0630

31
We analyzed somatic gene expression in irradiated and non-irradiated rectal cancer 663
samples from GEO data to assess the influence of nCRT on the immune condition. 664
Our study indicated that chemoradiotherapy could be able to induce an immune 665
response in rectal cancer patients. Post-treatment LARC is characterized by increased 666
expression of genes involved in immune response pathways, mainly composed of 667
cytotoxic T and TH cells, along with strong activation of antigen presentation, peptide 668
ligand-binding receptors, CD28 co-stimulatory signals, interferon signaling, and other 669
cytokine signaling in the immune system. 670
T-cell activation requires a two-step process that includes engagement of the TCR to 671
an antigen presented by an antigen-presenting cell (APC), and a second costimulatory 672
signal delivered by the engagement of CD28 to its ligands CD80 and CD86 (40). 673
Tumor cells expressing HLA class I present tumor-associated antigens on their cell 674
surface and are recognized by CD8+ cytotoxic T cells. Our analysis showed that nCRT 675
led to a significant increase in CD28, CD86, and HLA class I and II molecule 676
expression in rectal cancer cells. The class II molecule is expressed on the surface of 677
professional APCs and to some degree on cancer cells (41) and plays a central role in 678
the immune system by presenting peptides derived from extracellular proteins. Studies 679
have shown the direct requirement for competent HLA class II pathway stimulation in 680
the reduction of HLA class I-mediated response for an effective immunotherapy 681
approach (42). HLA class II antigen expression in CRC tumors is a favorable 682
prognostic marker (43). We noticed that T cell activation in post-treatment LARC was 683
mainly through IFNγ signaling activation and increased PI3K signaling. We further 684
on April 7, 2020. © 2018 American Association for Cancer Research. cancerimmunolres.aacrjournals.org Downloaded from
Author manuscripts have been peer reviewed and accepted for publication but have not yet been edited. Author Manuscript Published OnlineFirst on October 3, 2018; DOI: 10.1158/2326-6066.CIR-17-0630

32
analyzed the expression of T-cell differentiation and activation markers. 685
Differentiation markers (KLRG-1 and CD45 isotypes) and activation markers (CD69, 686
CD25 and CD38) were increased in LARC following nCRT compared to pre-nCRT 687
conditions. It was clear that nCRT could induce immune activation in LARC patients. 688
The mechanism by which radiation induces adaptive immunity remains unclear. 689
Twyman-Saint et al. report major tumor regressions in a subset of patients with 690
metastatic melanoma treated with an anti-CTLA4 and radiation, which was 691
reproduced in mouse models (26). Their study demonstrates that radiation can 692
diversify the TCR repertoire of TILs and shape the repertoire of expanded clones. 693
Reits et al. demonstrates that radiation can enhance MHC class I expression by 694
modulating the peptide repertoire (44). 695
Interest in the relationship between somatic mutational burden and antitumor immune 696
response motivated us to examine the differences in the mutational landscape between 697
the pre- and post-treatment rectal cancers by sequencing the exomes of LARCs. Our 698
analysis revealed that nCRT influenced the mutational landscape of LARC and 699
induced novel somatic mutations, and we further validated the results in TCGA 700
datasets. The most impactful finding from this study was the correlation between 701
immune activation and mutation burden in post-nCRT treated rectal cancers. 702
Although the exact mechanism of the enhanced immune response needs to be further 703
clarified, our observations clearly showed that neoantigens are associated with 704
non-synonymous mutation burden, which is consistent with the hypothesis that 705
on April 7, 2020. © 2018 American Association for Cancer Research. cancerimmunolres.aacrjournals.org Downloaded from
Author manuscripts have been peer reviewed and accepted for publication but have not yet been edited. Author Manuscript Published OnlineFirst on October 3, 2018; DOI: 10.1158/2326-6066.CIR-17-0630
33
recognition of neoantigens derived from somatic mutations is important for the 706
activity of the immune response, regardless of nCRT treatment. The tumors with 707
higher mutational load in melanoma, lung cancer, and mismatch repair–deficient 708
CRCs have a higher rate of response to checkpoint blockade therapy (22,23,45). 709
These data provide further insight for the idea that mutation-associated neoantigen 710
recognition is an important component of the endogenous antitumor immune 711
response. 712
Numerous studies have shown that chemoradiotherapy induces local immune 713
reactions that contribute to tumor regression through inflammatory infiltration. Our 714
previous work also demonstrates that the density of CD45RO+ TILs can predict 715
tumor downstaging and long-term outcomes for rectal cancer following neoadjuvant 716
radiotherapy (39). Evidence shows that a high rate of response to checkpoint therapy 717
is based on boosting tumor-specific immune activity. Therefore, we hypothesized 718
that rectal cancer patients who responded to nCRT could be good candidates for 719
checkpoint blockade immunotherapy, especially for the patients without pCR. Our 720
preclinical mouse experiments demonstrated that radiotherapy could enhance the 721
efficiency of anti–PD-1, which further supported our hypothesis. 722
In this work, we demonstrated that a higher tumor mutation burden in pre-treatment 723
tumors is correlated with a lower tumor regression grade. We also found that the 724
immune activation-related genes and pathways were enriched in the patients who 725
were responding to the nCRT. Heterogeneous immune cell infiltration was present in 726
responding and non-responding patients, and the responding patients displayed a 727
on April 7, 2020. © 2018 American Association for Cancer Research. cancerimmunolres.aacrjournals.org Downloaded from
Author manuscripts have been peer reviewed and accepted for publication but have not yet been edited. Author Manuscript Published OnlineFirst on October 3, 2018; DOI: 10.1158/2326-6066.CIR-17-0630

34
higher infiltration of CD8+ and activated CD4+ memory T cells, whereas the 728
non-responding patients displayed a significantly higher Treg infiltration. Our results 729
indicated that patients’ immune activity is related to the somatic mutation burden and 730
associated with nCRT. Mutation burden could be a useful biomarker to stratify 731
patients into sensitive and resistant categories to nCRT. 732
Several studies have addressed that tumor shrinkage induced by chemoradiotherapy 733
is not simply dependent on direct damage to tumor cells but is also affected by the 734
host immune activity. Immune infiltration could be a biomarker to predict the 735
response to nCRT in rectal cancer. Yasuda et al. previously analyzed the density of 736
CD4+ and CD8+ T lymphocytes in rectal cancer patients before nCRT and 737
demonstrated that a higher density of lymphocytes was correlated with a better 738
response to nCRT (46). Anitei et al. analyzed immunoscores, which score the 739
presence of T lymphocytes, in rectal cancer patients and show low immunoscores for 740
patients who did not respond to nCRT (47). Tumors with higher immune activity are 741
considered to be immunogenic and tend to further evoke antitumor immune 742
responses by neoantigens due to chemoradiotherapy, resulting in a better response to 743
CRT. Studies demonstrate that irradiation can promote remodeling of the 744
extracellular matrix (ECM) and tumor vasculature by increasing intratumoral 745
oxygenation and pH and upregulating the expression of cell adhesion molecules. 746
This leads to increased recruitment of immune effector cells into the tumor (48). 747
We further investigated the prognostic value of the checkpoint molecules PD-1, 748
PD-L1, and PD-L2 in CRC. PD-L1 expression was correlated with poor prognosis of 749
on April 7, 2020. © 2018 American Association for Cancer Research. cancerimmunolres.aacrjournals.org Downloaded from
Author manuscripts have been peer reviewed and accepted for publication but have not yet been edited. Author Manuscript Published OnlineFirst on October 3, 2018; DOI: 10.1158/2326-6066.CIR-17-0630

35
rectal cancer but not colon cancer. Increasing evidence suggests that CRC should be 750
considered as a heterogeneous disease, with colon and rectal cancers showing 751
multiple clinicopathological and molecular distinctions, including the immune 752
microenvironment (49,50). The TILs in CRC and its microenvironment are 753
associated with survival, and this prognostic correlation differs according to tumor 754
location (51). 755
In rectal patients without nCRT, PD-L1 expression negatively correlated with 756
prognosis in stage I-III rectal cancer patients and positively correlated in stage IV 757
rectal cancers. The expression pattern and correlation with prognosis of PD-L2, 758
another PD-1 ligand, was different from that of PD-L1. PD-L2 expression was 759
correlated with better prognosis of colon cancer but poor prognosis of stage IV rectal 760
cancer, indicating that the biological roles of PD-L1 and PD-L2 were different 761
between colon and rectal cancer. Our results are consistent with the survival analysis 762
of CRC RNA-seq data from TCGA presented in the Human Protein Atlas 763
(www.proteinatlas.org). However, our results are inconsistent with the study by 764
Wang et al (52), which shows that PD-L2 overexpression in CRC tumor cells 765
associates with poor OS of patients. It was shown that in both early CRC (AJCC 766
stage I–II) and advanced CRC (stage III–IV), higher PD-L2 expression associated 767
with worse OS. However, it should be noted that their study cohort was mostly 768
composed of colon cancer and only had two rectal cancer samples. For stages of 769
samples, the cohort only had four stage IV samples, and therefore, their results 770
mainly reflect the expression of PD-L2 in stage I-III colon cancer and its prognostic 771
on April 7, 2020. © 2018 American Association for Cancer Research. cancerimmunolres.aacrjournals.org Downloaded from
Author manuscripts have been peer reviewed and accepted for publication but have not yet been edited. Author Manuscript Published OnlineFirst on October 3, 2018; DOI: 10.1158/2326-6066.CIR-17-0630

36
significance. We think that the difference between their results and ours might be 772
due to the different composition of the study cohort and a different antibody used in 773
the study. 774
In patients with neoadjuvant radiotherapy, no significant correlation between PD-L1 775
expression and prognosis was found. CRC is considered as an immune cold tumor, 776
except in high mutation CRC with MSI-H or POLE mutation (53). Multiple factors 777
produced by tumor and stromal cells contribute to the inhibition of antitumor immune 778
response. Interaction of PD-L1 with PD-1 inhibits T-cell activation and cytokine 779
production (54,55). In tumor microenvironments, elevated PD-L1 can result in T-cell 780
exhaustion (56). T cells, thus, fail to maintain an energetic status to fight tumor cells 781
and are rendered tolerant to tumor antigens or exhausted. Chemoradiotherapy could 782
reprogram the immune-suppressive TME towards an immune-stimulating one. 783
Following neoadjuvant radiotherapy, T-cell activation was initiated by the 784
tumor-specific neoantigens resulting from nCRT, which could partially counteract the 785
effect of PD-L1. Following neoadjuvant radiotherapy, PD-L1 was significantly 786
correlated with CD45RO and CD8. In the CD8-low expression group, in which 787
antitumor immune was poorly activated, PD-L1 expression was negatively correlated 788
with DFS. Therefore, we propose that the addition of checkpoint blockade to nCRT 789
may show significant efficacy in improving prognosis of rectal cancer. T-cell 790
infiltration, such as CD8+ T cells, could be a potential biomarker to further stratify 791
post-nCRT patients into future immunotherapy groups (CD8-high expression) or 792
surgery alone group (CD8 low expression). 793
on April 7, 2020. © 2018 American Association for Cancer Research. cancerimmunolres.aacrjournals.org Downloaded from
Author manuscripts have been peer reviewed and accepted for publication but have not yet been edited. Author Manuscript Published OnlineFirst on October 3, 2018; DOI: 10.1158/2326-6066.CIR-17-0630

37
It is plausible that the immune features associated with nCRT could influence the 794
response to immunotherapeutic strategies. The mutational landscape could provide a 795
simple selection or stratification factor to identify populations of interest for such 796
treatments, and its exploration as a predictive biomarker is warranted. 797
Altogether, this work establishes the link between somatic mutations and immune 798
activity in rectal cancer patients following nCRT and supports the hypothesis that 799
rectal cancer patients with nCRT could become potential candidates for checkpoint 800
blockade immunotherapy. Further studies to identify the specific antigenic epitopes 801
are expected. Therefore, we prudently assume that LARC patients’ mutation burden 802
and immune activity are correlated with the response to nCRT. This would help to 803
develop personalized cellular adoptive immunotherapy strategies in the clinical 804
settings to optimally combine radiation and checkpoint blockade with PD-1 and 805
CTLA-4 antibodies to achieve the best therapeutic benefits. 806
807
Acknowledgments 808
The authors would like to thank Dr. Bin Dong, the Department of Pathology, Peking 809
University Cancer Hospital & Institute for her technical assistance. 810
Author contributions 811
Dengbo Ji and Haizhao Yi designed and performed the experiments, prepared the 812
figures and draft the manuscript; Dakui Zhang, Tiancheng Zhan and Ming Li assisted 813
with analysis of the whole- exome sequencing and RNA-seq data. Zhaowei Li, 814
on April 7, 2020. © 2018 American Association for Cancer Research. cancerimmunolres.aacrjournals.org Downloaded from
Author manuscripts have been peer reviewed and accepted for publication but have not yet been edited. Author Manuscript Published OnlineFirst on October 3, 2018; DOI: 10.1158/2326-6066.CIR-17-0630

38
Jinying Jia, Meng Qiao, Jinhong Xia, Zhiwei Zhai and Can Song contributed to the 815
performance of the experiments; Jin Gu supervised the work and wrote the 816
manuscript. 817
References 818
1. Braendengen M, Tveit KM, Berglund A, Birkemeyer E, Frykholm G, Pahlman L, et al. 819
Randomized phase III study comparing preoperative radiotherapy with chemoradiotherapy 820
in nonresectable rectal cancer. Journal of clinical oncology : official journal of the American 821
Society of Clinical Oncology 2008;26:3687‐94 822
2. Colorectal Cancer Collaborative G. Adjuvant radiotherapy for rectal cancer: a systematic 823
overview of 8,507 patients from 22 randomised trials. Lancet 2001;358:1291‐304 824
3. van Gijn W, Marijnen CA, Nagtegaal ID, Kranenbarg EM, Putter H, Wiggers T, et al. 825
Preoperative radiotherapy combined with total mesorectal excision for resectable rectal 826
cancer: 12‐year follow‐up of the multicentre, randomised controlled TME trial. The Lancet 827
Oncology 2011;12:575‐82 828
4. Sauer R, Liersch T, Merkel S, Fietkau R, Hohenberger W, Hess C, et al. Preoperative versus 829
postoperative chemoradiotherapy for locally advanced rectal cancer: results of the German 830
CAO/ARO/AIO‐94 randomized phase III trial after a median follow‐up of 11 years. Journal of 831
clinical oncology : official journal of the American Society of Clinical Oncology 832
2012;30:1926‐33 833
5. Engelen SM, Maas M, Lahaye MJ, Leijtens JW, van Berlo CL, Jansen RL, et al. Modern 834
multidisciplinary treatment of rectal cancer based on staging with magnetic resonance 835
imaging leads to excellent local control, but distant control remains a challenge. Eur J 836
Cancer 2013;49:2311‐20 837
6. Bujko K, Glynne‐Jones R, Bujko M. Does adjuvant fluoropyrimidine‐based chemotherapy 838
provide a benefit for patients with resected rectal cancer who have already received 839
neoadjuvant radiochemotherapy? A systematic review of randomised trials. Ann Oncol 840
2010;21:1743‐50 841
7. Moertel CG, Fleming TR, Macdonald JS, Haller DG, Laurie JA, Goodman PJ, et al. Levamisole 842
and fluorouracil for adjuvant therapy of resected colon carcinoma. The New England journal 843
of medicine 1990;322:352‐8 844
8. Taal BG, Van Tinteren H, Zoetmulder FA, group N. Adjuvant 5FU plus levamisole in colonic or 845
rectal cancer: improved survival in stage II and III. Br J Cancer 2001;85:1437‐43 846
9. Twelves C, Wong A, Nowacki MP, Abt M, Burris H, 3rd, Carrato A, et al. Capecitabine as 847
adjuvant treatment for stage III colon cancer. The New England journal of medicine 848
2005;352:2696‐704 849
10. Andre T, Boni C, Navarro M, Tabernero J, Hickish T, Topham C, et al. Improved overall 850
survival with oxaliplatin, fluorouracil, and leucovorin as adjuvant treatment in stage II or III 851
colon cancer in the MOSAIC trial. Journal of clinical oncology : official journal of the 852
American Society of Clinical Oncology 2009;27:3109‐16 853
11. Petersen SH, Harling H, Kirkeby LT, Wille‐Jorgensen P, Mocellin S. Postoperative adjuvant 854
on April 7, 2020. © 2018 American Association for Cancer Research. cancerimmunolres.aacrjournals.org Downloaded from
Author manuscripts have been peer reviewed and accepted for publication but have not yet been edited. Author Manuscript Published OnlineFirst on October 3, 2018; DOI: 10.1158/2326-6066.CIR-17-0630
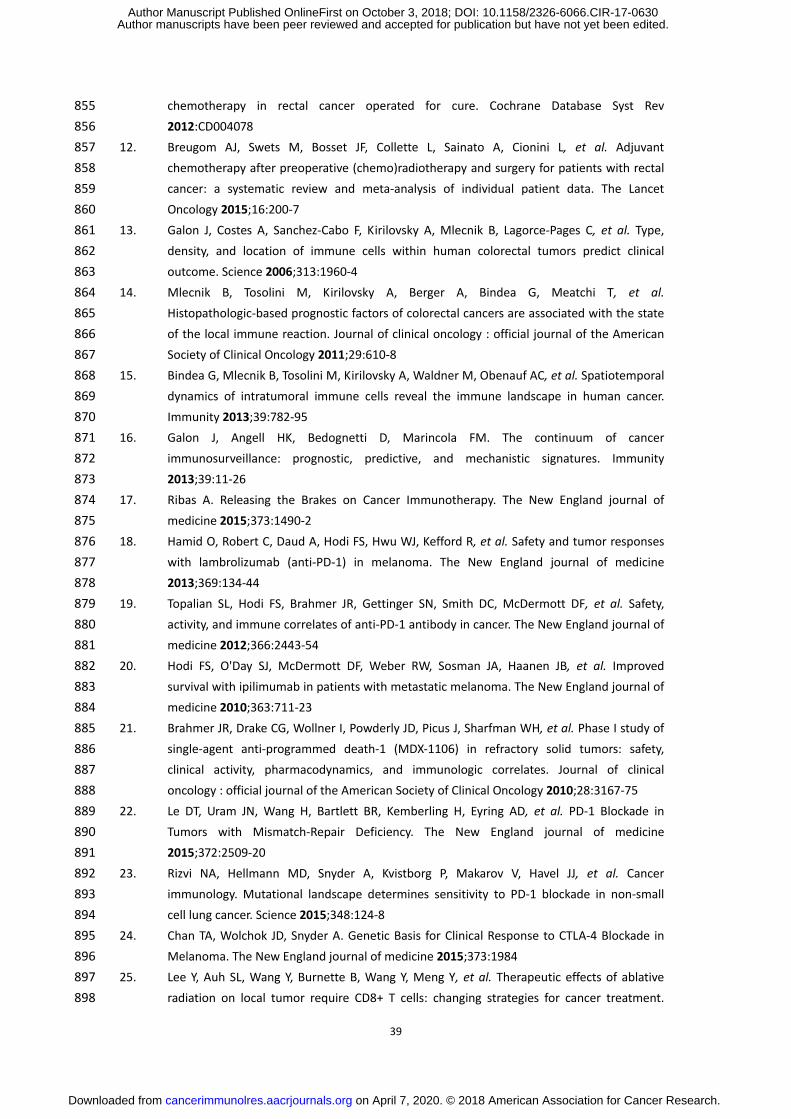
39
chemotherapy in rectal cancer operated for cure. Cochrane Database Syst Rev 855
2012:CD004078 856
12. Breugom AJ, Swets M, Bosset JF, Collette L, Sainato A, Cionini L, et al. Adjuvant 857
chemotherapy after preoperative (chemo)radiotherapy and surgery for patients with rectal 858
cancer: a systematic review and meta‐analysis of individual patient data. The Lancet 859
Oncology 2015;16:200‐7 860
13. Galon J, Costes A, Sanchez‐Cabo F, Kirilovsky A, Mlecnik B, Lagorce‐Pages C, et al. Type, 861
density, and location of immune cells within human colorectal tumors predict clinical 862
outcome. Science 2006;313:1960‐4 863
14. Mlecnik B, Tosolini M, Kirilovsky A, Berger A, Bindea G, Meatchi T, et al. 864
Histopathologic‐based prognostic factors of colorectal cancers are associated with the state 865
of the local immune reaction. Journal of clinical oncology : official journal of the American 866
Society of Clinical Oncology 2011;29:610‐8 867
15. Bindea G, Mlecnik B, Tosolini M, Kirilovsky A, Waldner M, Obenauf AC, et al. Spatiotemporal 868
dynamics of intratumoral immune cells reveal the immune landscape in human cancer. 869
Immunity 2013;39:782‐95 870
16. Galon J, Angell HK, Bedognetti D, Marincola FM. The continuum of cancer 871
immunosurveillance: prognostic, predictive, and mechanistic signatures. Immunity 872
2013;39:11‐26 873
17. Ribas A. Releasing the Brakes on Cancer Immunotherapy. The New England journal of 874
medicine 2015;373:1490‐2 875
18. Hamid O, Robert C, Daud A, Hodi FS, Hwu WJ, Kefford R, et al. Safety and tumor responses 876
with lambrolizumab (anti‐PD‐1) in melanoma. The New England journal of medicine 877
2013;369:134‐44 878
19. Topalian SL, Hodi FS, Brahmer JR, Gettinger SN, Smith DC, McDermott DF, et al. Safety, 879
activity, and immune correlates of anti‐PD‐1 antibody in cancer. The New England journal of 880
medicine 2012;366:2443‐54 881
20. Hodi FS, O'Day SJ, McDermott DF, Weber RW, Sosman JA, Haanen JB, et al. Improved 882
survival with ipilimumab in patients with metastatic melanoma. The New England journal of 883
medicine 2010;363:711‐23 884
21. Brahmer JR, Drake CG, Wollner I, Powderly JD, Picus J, Sharfman WH, et al. Phase I study of 885
single‐agent anti‐programmed death‐1 (MDX‐1106) in refractory solid tumors: safety, 886
clinical activity, pharmacodynamics, and immunologic correlates. Journal of clinical 887
oncology : official journal of the American Society of Clinical Oncology 2010;28:3167‐75 888
22. Le DT, Uram JN, Wang H, Bartlett BR, Kemberling H, Eyring AD, et al. PD‐1 Blockade in 889
Tumors with Mismatch‐Repair Deficiency. The New England journal of medicine 890
2015;372:2509‐20 891
23. Rizvi NA, Hellmann MD, Snyder A, Kvistborg P, Makarov V, Havel JJ, et al. Cancer 892
immunology. Mutational landscape determines sensitivity to PD‐1 blockade in non‐small 893
cell lung cancer. Science 2015;348:124‐8 894
24. Chan TA, Wolchok JD, Snyder A. Genetic Basis for Clinical Response to CTLA‐4 Blockade in 895
Melanoma. The New England journal of medicine 2015;373:1984 896
25. Lee Y, Auh SL, Wang Y, Burnette B, Wang Y, Meng Y, et al. Therapeutic effects of ablative 897
radiation on local tumor require CD8+ T cells: changing strategies for cancer treatment. 898
on April 7, 2020. © 2018 American Association for Cancer Research. cancerimmunolres.aacrjournals.org Downloaded from
Author manuscripts have been peer reviewed and accepted for publication but have not yet been edited. Author Manuscript Published OnlineFirst on October 3, 2018; DOI: 10.1158/2326-6066.CIR-17-0630

40
Blood 2009;114:589‐95 899
26. Twyman‐Saint Victor C, Rech AJ, Maity A, Rengan R, Pauken KE, Stelekati E, et al. Radiation 900
and dual checkpoint blockade activate non‐redundant immune mechanisms in cancer. 901
Nature 2015;520:373‐7 902
27. Edge SB BD CC. AJCC Cancer Staging Manual. 7th Ed. Chicago: Springer‐Verlag 2010. 903
28. Li H, Durbin R. Fast and accurate short read alignment with Burrows‐Wheeler transform. 904
Bioinformatics 2009;25:1754‐60 905
29. Li H, Durbin R. Fast and accurate long‐read alignment with Burrows‐Wheeler transform. 906
Bioinformatics 2010;26:589‐95 907
30. Li H, Handsaker B, Wysoker A, Fennell T, Ruan J, Homer N, et al. The Sequence 908
Alignment/Map format and SAMtools. Bioinformatics 2009;25:2078‐9 909
31. Quinlan AR, Hall IM. BEDTools: a flexible suite of utilities for comparing genomic features. 910
Bioinformatics 2010;26:841‐2 911
32. Cibulskis K, Lawrence MS, Carter SL, Sivachenko A, Jaffe D, Sougnez C, et al. Sensitive 912
detection of somatic point mutations in impure and heterogeneous cancer samples. Nature 913
biotechnology 2013;31:213‐9 914
33. Wang K, Li M, Hakonarson H. ANNOVAR: functional annotation of genetic variants from 915
high‐throughput sequencing data. Nucleic acids research 2010;38:e164 916
34. Koboldt DC, Zhang Q, Larson DE, Shen D, McLellan MD, Lin L, et al. VarScan 2: somatic 917
mutation and copy number alteration discovery in cancer by exome sequencing. Genome 918
research 2012;22:568‐76 919
35. Weiskopf D, Angelo MA, de Azeredo EL, Sidney J, Greenbaum JA, Fernando AN, et al. 920
Comprehensive analysis of dengue virus‐specific responses supports an HLA‐linked 921
protective role for CD8+ T cells. Proceedings of the National Academy of Sciences of the 922
United States of America 2013;110:E2046‐53 923
36. Fuertes Marraco SA, Neubert NJ, Verdeil G, Speiser DE. Inhibitory Receptors Beyond T Cell 924
Exhaustion. Frontiers in immunology 2015;6:310 925
37. Sharma P, Wagner K, Wolchok JD, Allison JP. Novel cancer immunotherapy agents with 926
survival benefit: recent successes and next steps. Nat Rev Cancer 2011;11:805‐12 927
38. Newman AM, Liu CL, Green MR, Gentles AJ, Feng W, Xu Y, et al. Robust enumeration of cell 928
subsets from tissue expression profiles. Nature methods 2015;12:453‐7 929
39. Wang L, Zhai ZW, Ji DB, Li ZW, Gu J. Prognostic value of CD45RO(+) tumor‐infiltrating 930
lymphocytes for locally advanced rectal cancer following 30 Gy/10f neoadjuvant 931
radiotherapy. Int J Colorectal Dis 2015;30:753‐60 932
40. Esensten JH, Helou YA, Chopra G, Weiss A, Bluestone JA. CD28 Costimulation: From 933
Mechanism to Therapy. Immunity 2016;44:973‐88 934
41. Nanda NK, Birch L, Greenberg NM, Prins GS. MHC class I and class II molecules are 935
expressed in both human and mouse prostate tumor microenvironment. Prostate 936
2006;66:1275‐84 937
42. Klyushnenkova EN, Kouiavskaia DV, Berard CA, Alexander RB. Cutting edge: permissive MHC 938
class II allele changes the pattern of antitumor immune response resulting in failure of 939
tumor rejection. J Immunol 2009;182:1242‐6 940
43. Sconocchia G, Eppenberger‐Castori S, Zlobec I, Karamitopoulou E, Arriga R, Coppola A, et al. 941
HLA class II antigen expression in colorectal carcinoma tumors as a favorable prognostic 942
on April 7, 2020. © 2018 American Association for Cancer Research. cancerimmunolres.aacrjournals.org Downloaded from
Author manuscripts have been peer reviewed and accepted for publication but have not yet been edited. Author Manuscript Published OnlineFirst on October 3, 2018; DOI: 10.1158/2326-6066.CIR-17-0630

41
marker. Neoplasia 2014;16:31‐42 943
44. Reits EA, Hodge JW, Herberts CA, Groothuis TA, Chakraborty M, Wansley EK, et al. Radiation 944
modulates the peptide repertoire, enhances MHC class I expression, and induces successful 945
antitumor immunotherapy. The Journal of experimental medicine 2006;203:1259‐71 946
45. Snyder A, Makarov V, Merghoub T, Yuan J, Zaretsky JM, Desrichard A, et al. Genetic basis for 947
clinical response to CTLA‐4 blockade in melanoma. The New England journal of medicine 948
2014;371:2189‐99 949
46. Yasuda K, Nirei T, Sunami E, Nagawa H, Kitayama J. Density of CD4(+) and CD8(+) T 950
lymphocytes in biopsy samples can be a predictor of pathological response to 951
chemoradiotherapy (CRT) for rectal cancer. Radiation oncology 2011;6:49 952
47. Anitei MG, Zeitoun G, Mlecnik B, Marliot F, Haicheur N, Todosi AM, et al. Prognostic and 953
predictive values of the immunoscore in patients with rectal cancer. Clinical cancer research : 954
an official journal of the American Association for Cancer Research 2014;20:1891‐9 955
48. Jiang W, Chan CK, Weissman IL, Kim BYS, Hahn SM. Immune Priming of the Tumor 956
Microenvironment by Radiation. Trends in cancer 2016;2:638‐45 957
49. Minoo P, Zlobec I, Peterson M, Terracciano L, Lugli A. Characterization of rectal, proximal 958
and distal colon cancers based on clinicopathological, molecular and protein profiles. 959
International journal of oncology 2010;37:707‐18 960
50. Perez‐Ruiz E, Berraondo P. Immunological Landscape and Clinical Management of Rectal 961
Cancer. Frontiers in immunology 2016;7:61 962
51. Berntsson J, Svensson MC, Leandersson K, Nodin B, Micke P, Larsson AH, et al. The clinical 963
impact of tumour‐infiltrating lymphocytes in colorectal cancer differs by anatomical subsite: 964
A cohort study. International journal of cancer 2017;141:1654‐66 965
52. Wang H, Yao H, Li C, Liang L, Zhang Y, Shi H, et al. PD‐L2 expression in colorectal cancer: 966
Independent prognostic effect and targetability by deglycosylation. Oncoimmunology 967
2017;6:e1327494 968
53. Cancer Genome Atlas N. Comprehensive molecular characterization of human colon and 969
rectal cancer. Nature 2012;487:330‐7 970
54. Blank C, Brown I, Peterson AC, Spiotto M, Iwai Y, Honjo T, et al. PD‐L1/B7H‐1 inhibits the 971
effector phase of tumor rejection by T cell receptor (TCR) transgenic CD8+ T cells. Cancer 972
research 2004;64:1140‐5 973
55. Freeman GJ, Long AJ, Iwai Y, Bourque K, Chernova T, Nishimura H, et al. Engagement of the 974
PD‐1 immunoinhibitory receptor by a novel B7 family member leads to negative regulation 975
of lymphocyte activation. The Journal of experimental medicine 2000;192:1027‐34 976
56. Curran MA, Montalvo W, Yagita H, Allison JP. PD‐1 and CTLA‐4 combination blockade 977
expands infiltrating T cells and reduces regulatory T and myeloid cells within B16 melanoma 978
tumors. Proceedings of the National Academy of Sciences of the United States of America 979
2010;107:4275‐80 980
981
on April 7, 2020. © 2018 American Association for Cancer Research. cancerimmunolres.aacrjournals.org Downloaded from
Author manuscripts have been peer reviewed and accepted for publication but have not yet been edited. Author Manuscript Published OnlineFirst on October 3, 2018; DOI: 10.1158/2326-6066.CIR-17-0630

42
Table 1. Reactome pathway analysis of with nRT vs. without nRT (GSE15781) and Mutation related pathways (TCGA) 982
983
With nRT vs. without nRT(GSE15781) Mutation related pathways(TCGA)
Pathway name Entities pValue Entities FDR Pathway name Entities pValue Entities FDR
Interferon gamma signaling 1.11E-16
1.21E-14
Developmental Biology
5.67E-11 2.34E-08
Antigen Presentation: Folding, assembly
and peptide loading of class I MHC
1.11E-16
1.21E-14
Alpha-defensins
8.46E-08 2.61E-05
Immunoregulatory interactions between
a Lymphoid and a non-Lymphoid cell
1.11E-16
1.21E-14
NCAM signaling for neurite out-growth
2.39E-06 5.89E-04
Class I MHC mediated antigen
processing & presentation
1.11E-16
1.21E-14
Interleukin-2 family signaling
2.17E-05 0.002010602
Cytokine Signaling in Immune system 1.11E-16
1.21E-14
Signalling to RAS
3.58E-05 0.002010602
Receptor binding chemokines 1.34E-13
1.34E-11
RAF/MAP kinase cascade 5.59E-05 0.002010602
PD-1 signaling 7.64E-07
6.65E-05
Interleukin receptor SHC signaling 9.43E-05 0.002545513
Peptide ligand-binding receptors 1.71E-06
1.39E-04
Interleukin-19,20,22,24,26,28 and 29
signaling
1.47E-04 0.003831806
Costimulation by the CD28 family 2.71E-05
0.00195
Interleukin-3, 5 and GM-CSF signaling
2.05E-04 0.005137273
984
985
986
987
on April 7, 2020. ©
2018 Am
erican Association for C
ancer Research.
cancerimm
unolres.aacrjournals.org D
ownloaded from
Author m
anuscripts have been peer reviewed and accepted for publication but have not yet been edited.
Author M
anuscript Published O
nlineFirst on O
ctober 3, 2018; DO
I: 10.1158/2326-6066.CIR
-17-0630

43
Figure Legends 988
Figure 1. nCRT induces immune activation of LARC. (A) Unsupervised clustering 989
highlighting genome-wide changes in gene expression. Rectal cancer samples were 990
clustered according to the expression of 342 differentially expressed immune genes 991
(p<0.05) between 13 pre- and 9 post-nCRT samples (GSE 15781). Rectal cancer 992
samples are across the horizontal axis, with 1 sample expression pattern shown in 993
each column. Gene expression values range from green (low expression) to red (high 994
expression). (B) Venn diagram showing significant overlaps of core genes from the 995
differentially expressed genes (red circle), immune related genes (blue circle), and 996
CD28 costimulatory related genes (green circle). (C) Unsupervised clustering for 17 997
differentially expressed immune genes for CD28 co-stimulatory signals (p<0.05) 998
between pre- and post-nCRT. (D) Unsupervised clustering for T-cell differentiation 999
and activation markers between pre- and post-nCRT. (E) Enriched pathways for 1000
differentially expressed immune genes after nCRT using GSEA. The twenty most 1001
significant pathways and corresponding normalized enrichment scores (NES) are 1002
shown. p ≤ 0.01, FDR q< 0.25. using Enrichment Score Calculation, Permutation test 1003
and Multiple hypothesis test. 1004
1005
Figure 2. nCRT influences the neoantigen landscape of LARC. (A) The quantity of 1006
neoantigens and mutations per tumor prior to nCRT (Cohort 1; n=14), using Pearson 1007
correlation. (B) The quantity of neoantigens and mutations per tumor post-nCRT 1008
(Cohort 1, n=9), using Pearson correlation. (C) The mutation burden in patients post 1009
nCRT (n=7) and patients without nCRT (n=41) (from TCGA data), using Student t 1010
test. (D) The candidate neoantigens and mutation burden (from TCGA data), using 1011
Pearson correlation. (E) The neoantigens binding to the T cell receptor in patients post 1012
on April 7, 2020. © 2018 American Association for Cancer Research. cancerimmunolres.aacrjournals.org Downloaded from
Author manuscripts have been peer reviewed and accepted for publication but have not yet been edited. Author Manuscript Published OnlineFirst on October 3, 2018; DOI: 10.1158/2326-6066.CIR-17-0630
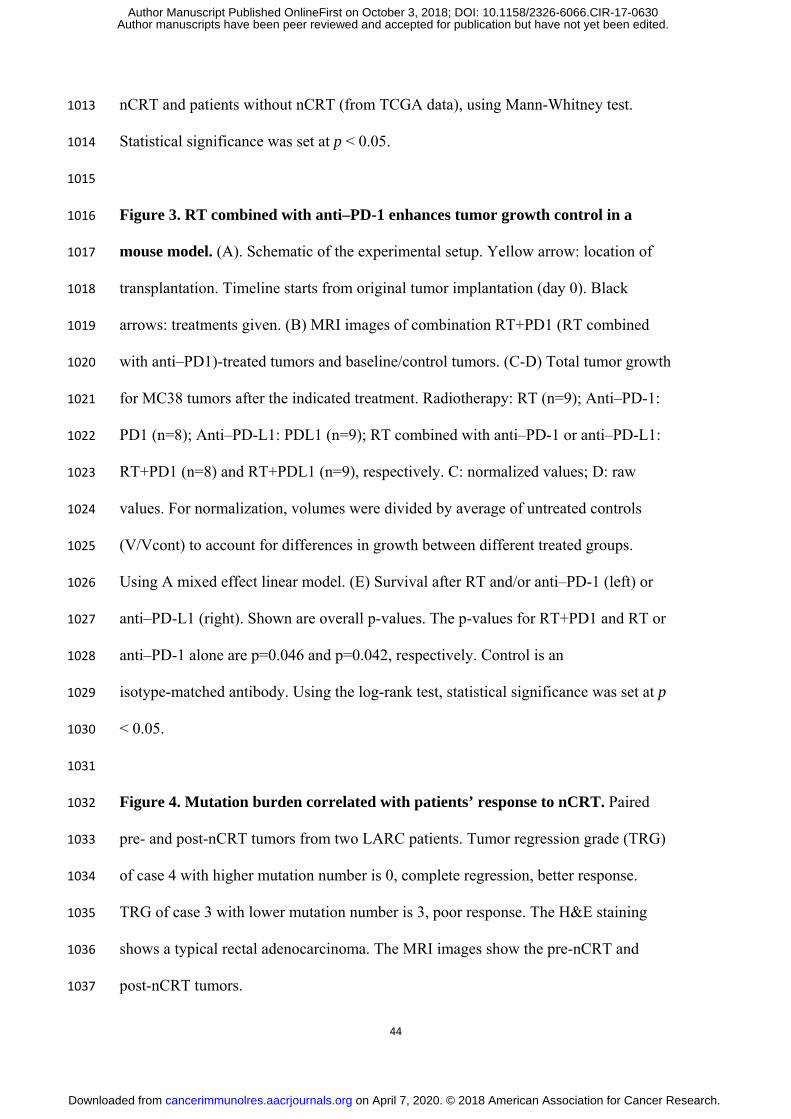
44
nCRT and patients without nCRT (from TCGA data), using Mann-Whitney test. 1013
Statistical significance was set at p < 0.05. 1014
1015
Figure 3. RT combined with anti–PD-1 enhances tumor growth control in a 1016
mouse model. (A). Schematic of the experimental setup. Yellow arrow: location of 1017
transplantation. Timeline starts from original tumor implantation (day 0). Black 1018
arrows: treatments given. (B) MRI images of combination RT+PD1 (RT combined 1019
with anti–PD1)-treated tumors and baseline/control tumors. (C-D) Total tumor growth 1020
for MC38 tumors after the indicated treatment. Radiotherapy: RT (n=9); Anti–PD-1: 1021
PD1 (n=8); Anti–PD-L1: PDL1 (n=9); RT combined with anti–PD-1 or anti–PD-L1: 1022
RT+PD1 (n=8) and RT+PDL1 (n=9), respectively. C: normalized values; D: raw 1023
values. For normalization, volumes were divided by average of untreated controls 1024
(V/Vcont) to account for differences in growth between different treated groups. 1025
Using A mixed effect linear model. (E) Survival after RT and/or anti–PD-1 (left) or 1026
anti–PD-L1 (right). Shown are overall p-values. The p-values for RT+PD1 and RT or 1027
anti–PD-1 alone are p=0.046 and p=0.042, respectively. Control is an 1028
isotype-matched antibody. Using the log-rank test, statistical significance was set at p 1029
< 0.05. 1030
1031
Figure 4. Mutation burden correlated with patients’ response to nCRT. Paired 1032
pre- and post-nCRT tumors from two LARC patients. Tumor regression grade (TRG) 1033
of case 4 with higher mutation number is 0, complete regression, better response. 1034
TRG of case 3 with lower mutation number is 3, poor response. The H&E staining 1035
shows a typical rectal adenocarcinoma. The MRI images show the pre-nCRT and 1036
post-nCRT tumors. 1037
on April 7, 2020. © 2018 American Association for Cancer Research. cancerimmunolres.aacrjournals.org Downloaded from
Author manuscripts have been peer reviewed and accepted for publication but have not yet been edited. Author Manuscript Published OnlineFirst on October 3, 2018; DOI: 10.1158/2326-6066.CIR-17-0630

45
1038
Figure 5. Mutation burden and neoantigens of LARC correlated with the 1039
response to nCRT. (A-B) Cohort 1 (n=14). (A) Mutation numbers in pre-nCRT 1040
biopsies with the different tumor regression grade, using Pearson correlation. (B) The 1041
mutation-associated neoantigens in pre-nCRT biopsies with the different tumor 1042
regression grade, using Pearson correlation. (C-F) Cohort 2 (n=42). (C) Tumor 1043
mutation burden (TMB) in pre-nCRT ctDNA. (D) The correlation between TMB in 1044
pre-nCRT ctDNA and the tumor regression grade, using Pearson correlation. (E) The 1045
TMB in pCR patients (n=6) and non-pCR patients (n=36), using Student t test. (F) 1046
The TMB in residual tumor cells <30% group (n=24) and in >30% group (n=18), 1047
using Student t test. Statistical significance was set at p < 0.05. 1048
1049
Figure 6. Association between PD-L1 and PD-1 expression and prognosis with 1050
CRC using IHC (Cohort 4). (A) Expression of PD-1 and PD-L1 in the indicated 1051
CRC tissues using IHC analysis. Positive staining shows as brown. (B) Overall 1052
survival. Kaplan–Meier analysis of TNM stage I-III CRC patients in cohort 4. 1053
Number of patients per group indicated on graph. (C) Kaplan–Meier analysis of the 1054
correlation between PD-L1 expression and disease-free survival in patients with rectal 1055
cancer in cohort 4. Number of patients per group indicated on graph. (D) 1056
Kaplan–Meier analysis of the correlation between PDL1 expression and OS in 1057
patients with rectal cancer in cohort 4. Number of patients per group indicated on 1058
graph. Using the log-rank test, statistical significance was set at p < 0.05. 1059
1060
Figure 7. Expression of PD-L1 and PD-1 in post-nRT rectal cancer tissue samples 1061
and therapeutic outcome for nRT using IHC (Cohort 5). (A) Representative 1062
on April 7, 2020. © 2018 American Association for Cancer Research. cancerimmunolres.aacrjournals.org Downloaded from
Author manuscripts have been peer reviewed and accepted for publication but have not yet been edited. Author Manuscript Published OnlineFirst on October 3, 2018; DOI: 10.1158/2326-6066.CIR-17-0630

46
images of PD-L1 expression on tumor cells and TILs (B) Representative images of 1063
PD-1 expression on tumor cells and TILs, as well as CD8 expression on TILs (C) 1064
Kaplan–Meier analysis of the correlation between PD-L1 expression and disease-free 1065
survival in patients with low CD8 expression in cohort 5. PD-L1–negative n=67; 1066
PD-L1–positive n=45. Using the log-rank test, statistical significance was set at p < 1067
0.05. 1068
1069
1070
on April 7, 2020. © 2018 American Association for Cancer Research. cancerimmunolres.aacrjournals.org Downloaded from
Author manuscripts have been peer reviewed and accepted for publication but have not yet been edited. Author Manuscript Published OnlineFirst on October 3, 2018; DOI: 10.1158/2326-6066.CIR-17-0630
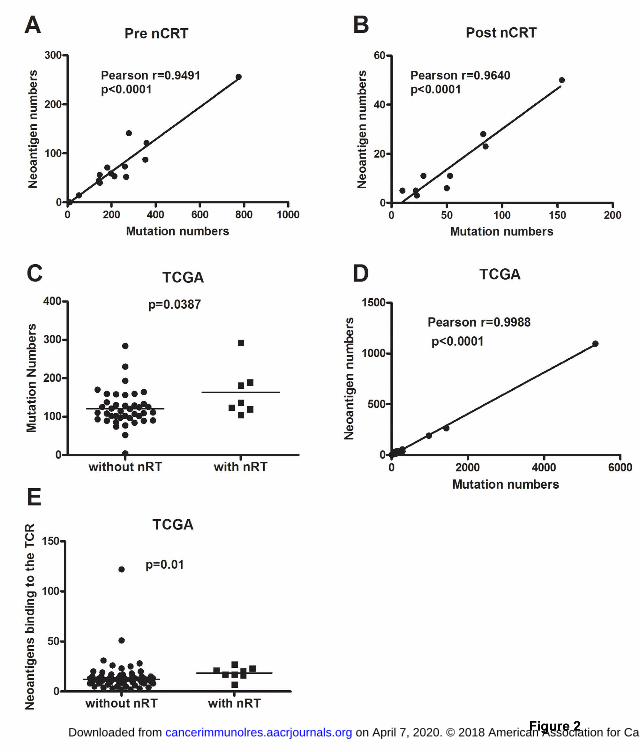

Published OnlineFirst October 3, 2018.Cancer Immunol Res Dengbo Ji, Haizhao Yi, Dakui Zhang, et al. Following Neoadjuvant ChemoradiotherapySomatic Mutations and Immune Alternation in Rectal Cancer
Updated version
10.1158/2326-6066.CIR-17-0630doi:
Access the most recent version of this article at:
Material
Supplementary
C1
http://cancerimmunolres.aacrjournals.org/content/suppl/2018/10/03/2326-6066.CIR-17-0630.DAccess the most recent supplemental material at:
Manuscript
Authorbeen edited. Author manuscripts have been peer reviewed and accepted for publication but have not yet
E-mail alerts related to this article or journal.Sign up to receive free email-alerts
Subscriptions
Reprints and
To order reprints of this article or to subscribe to the journal, contact the AACR Publications
Permissions
Rightslink site. Click on "Request Permissions" which will take you to the Copyright Clearance Center's (CCC)
.http://cancerimmunolres.aacrjournals.org/content/early/2018/10/03/2326-6066.CIR-17-0630To request permission to re-use all or part of this article, use this link
on April 7, 2020. © 2018 American Association for Cancer Research. cancerimmunolres.aacrjournals.org Downloaded from
Author manuscripts have been peer reviewed and accepted for publication but have not yet been edited. Author Manuscript Published OnlineFirst on October 3, 2018; DOI: 10.1158/2326-6066.CIR-17-0630