Solving the Out-Of-Stock Problem: A GMA/FMI Trading ... · PDF fileA GMA/FMI Trading Partner...
15
Solving the Out-Of-Stock Problem: A GMA/FMI Trading Partner Report
Transcript of Solving the Out-Of-Stock Problem: A GMA/FMI Trading ... · PDF fileA GMA/FMI Trading Partner...

Solving the Out-Of-Stock Problem: A GMA/FMI Trading Partner Report

The GMA-FMI Joint Team Clorox Lisa Malvea
Delhaize Tom Gagnon
Genco Gene Bodenheimer
HEB Ron Ozment
Inmar Steve Dollase
JDA Danny Halim
McCormick Joe Rink
Meijer Brian Sikkema
Mondelez Maura McCarthy
Nestle Jack Ryan
P&G Lois Fruhwirth
Walgreens Brad Bogan

On Shelf Availability matters every day
Reports don’t match shopper experience

“Shopportunity”
But
items is not on the shelf
Product availability is
Top 3 Reasons for where they shop
70% go to another store … Potential 10% Revenue Lost
…Three Strikes …You’re Out!

Industry Collaboration to Lead Improvement OSA Survey + Insight
2014 Industry Whitepaper
2015 Consensus & Theory
2013
• 77 responses from suppliers & retailers
• Identified critical gaps
• Transparency and alignment
• Framework • Action orientation
• Good-Better-Best Definitions and Recommendations
• Future considerations
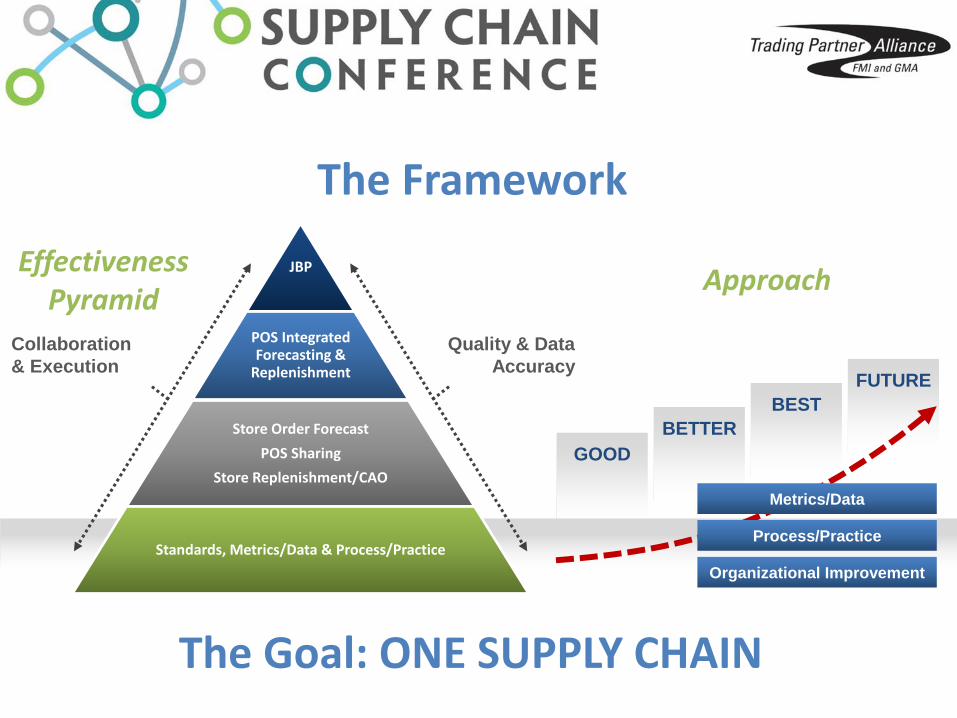
JBP
POS Integrated Forecasting &
Replenishment
Store Order Forecast
POS Sharing
Store Replenishment/CAO
Standards, Metrics/Data & Process/Practice
Collaboration
& Execution
Quality & Data
Accuracy
Effectiveness Pyramid
Approach
FUTURE
GOOD
BETTER
BEST
Process/Practice
Metrics/Data
Organizational Improvement
The Framework
The Goal: ONE SUPPLY CHAIN

Survey Completed by Retailers & Manufacturers
We thought we knew, now we have the data . . .
Metrics/Data
• 83% of retailers share POS data with suppliers
• Only 57% of suppliers use this data in their demand and production planning
• BOTH retailers (75%) and suppliers fall back and use shipment data to forecast vs. more accurate POS
Process/Practice
• 92% of retailers change promotion plans after shared with suppliers
• 58% of retailers provide forecasts 4 weeks or less before event
• 79% of manufacturers primarily use their own forecasts, only occasionally use retailer forecast to make adjustments and 50% needed 5-8 weeks production lead time
Organizational
• Almost 40% of Retailers named multiple owners for inventory, no clear accountability
• 71% of manufacturers say OSA is top priority; almost 91% say it is not in their incentive
Technology
• 53% of retailers have CAO system and yet 44% allow store overrides
• Only 53% of manufacturers incorporate OSA in their end-to-end supply chain

Critical Gaps Identified
We will only cover some of these gaps in today’s presentation
Metrics/Data
• Common Definition of OSA
• Effective Use of Data
Process/Practice
• Timing and Lead Time
• Synchronization (Internal and External)
• Process Adherence (Overrides)
Organizational
• Ownerships, Roles and Accountability
• Collaboration Definition
Technology
• High Scalability Data Automation
• Redundant Tools to Create Forecasts
• Integration between Trading Partners

Metrics/Data Gap: Common Definition of OSA
There is NO common definition of OSA With Good-Better-Best, we can all advance

OSA Definition
At minimum, the industry needs to move to "Zero on Hand“ – number of instances when an authorized item's perpetual inventory fell to
zero or below / total store item combinations.
Good
• Zero On Hand
Better
• Lost Demand
• Lost Sales
• Below Minimum Presentation
Best in Class & Future Considerations
• Based on DC to Store forecasted movements
• Consider promoted vs. non- promoted
• Use store technology to understand inventory location . . .

Process/Practice Gap: Synchronization & Timing
• 58% of Retailers provide event forecasts 4-weeks OR LESS of event kick-off date
• 76% Manufacturers need at least 5 or more weeks to produce/deliver merchandise
Recommendations • Remove event “lock date” • Collaborate early and continue to adjust through execution • Joint contingency plan (high-low)

Organizational Gap: Without clear accountability of inventory …
• Misunderstanding between trading partners
• No clear ownership of OSA • Misaligned execution leading
to OSA issues
Recommendations • Joint business planning discipline with data • Remove silos across supply chain; work to common language • Align rewards and incentives to the OSA strategies

Technology Gap: Data and Integration Automation
• High volume of data • Departmental focus /
disconnected systems • Resulted in multiple forecasts,
assumptions, buffers and information latency
Recommendations • Break system silos to support OSA strategies • Use one demand signal to drive all functions (never forecast what
you can calculate) – eliminate bullwhip effects and errors

Summary: One Supply Chain
• WIN-WIN for all participants • Progressive benefits throughout Good Better Best
$
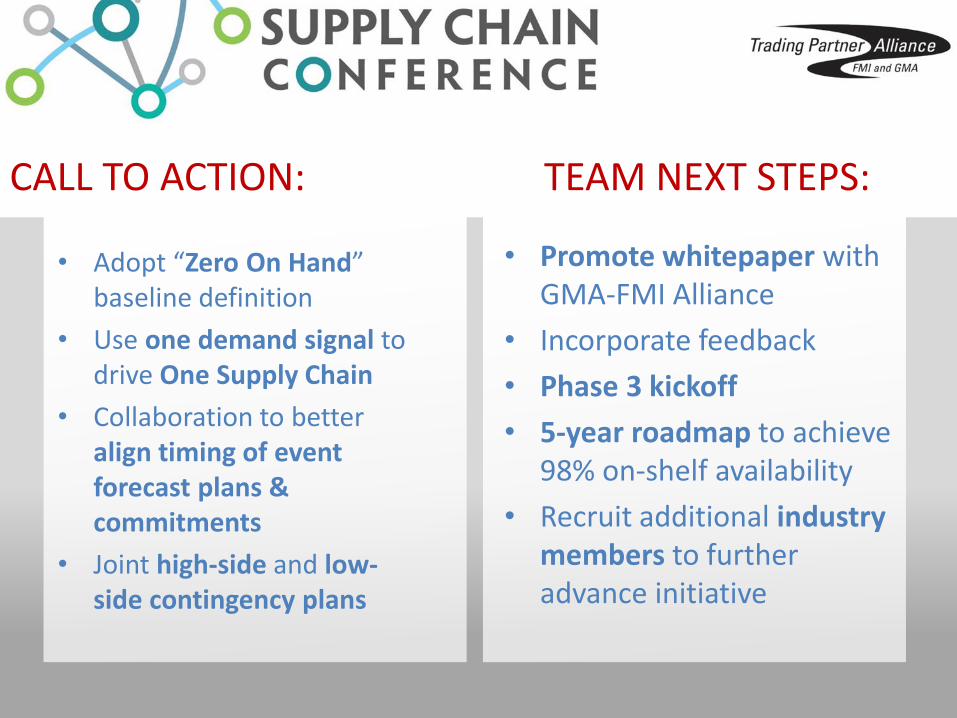
Recommendations to Advance OSA • Adopt “Zero On Hand”
baseline definition
• Use one demand signal to drive One Supply Chain
• Collaboration to better align timing of event forecast plans & commitments
• Joint high-side and low-side contingency plans
CALL TO ACTION: TEAM NEXT STEPS:
• Promote whitepaper with GMA-FMI Alliance
• Incorporate feedback
• Phase 3 kickoff
• 5-year roadmap to achieve 98% on-shelf availability
• Recruit additional industry members to further advance initiative