Solvent H-bond accepting ability induced conformational ...
11
24332 | Phys. Chem. Chem. Phys., 2016, 18, 24332--24342 This journal is © the Owner Societies 2016 Cite this: Phys. Chem. Chem. Phys., 2016, 18, 24332 Solvent H-bond accepting ability induced conformational change and its influence towards fluorescence enhancement and dual fluorescence of hydroxy meta-GFP chromophore analogue† Tanmay Chatterjee, Mrinal Mandal and Prasun K. Mandal* The effect of structural rigidity towards enhancement of fluorescence quantum yield of GFP chromophore analogues has been documented. In the present study, a new way of enhancing the fluorescence quantum yield of two ortho–meta GFP chromophore analogues meta-methoxy-ortho- hydroxy-benzylimidazolidinone (abbreviated as mOMe-HBDI) and meta-diethylamino-ortho-hydroxyl imidazolidinone (abbreviated as MOHIM) has been reported. This enhancement is controlled by the H-bond accepting ability (denoted as b value) of the solvent and happens only in the case of GFP chromophore analogues having ortho (hydroxyl)-meta (electron donating group) and not in the case of analogues having a para electron donating group. The ground state (solid) conformation of mOMe-HBDI has been obtained from single crystal X-ray analysis, exhibiting the existence of strong intramolecular H-bonding. However, in solution phase, as the solvent b value increases, the strength of intramolecular H-bonding decreases. This process has strong influence on the relative conformational orientation of phenyl and imidazolidinone rings. For mOMe-HBDI, fluorescence quantum yield increases with increase in b value of the solvents. However, the effect of solvent polarity cannot be completely ruled out. The lower wavelength emission band (B480 nm) has been assigned to the normal charge- transferred (CT) species, whereas the highly Stokes shifted emission band (B660 nm) has been assigned to the proton-transferred (PT) tautomer species for mOMe-HBDI. In solvents of low b value (say hexane) only the PT band and in solvents of high b value (say DMSO) only the CT band is observed. Quite interestingly, in solvents of intermediate b value both CT and PT bands, thus dual emission, are observed. For mOMe-HBDI when fluorescence decay is monitored at the normal CT emission band, it is observed to be biexponential in nature. The short component increases from B0.2 ns to 0.6 ns and the long component increases from 1 to 3.6 ns as the b value of the solvent increases. For a particular solvent, when fluorescence decay is monitored at the normal CT band, as the monitoring wavelength increases the amplitude of the long lifetime component increases and that of the short lifetime component decreases. Time-resolved area-normalised emission spectral (TRANES) analysis confirms the possible existence of two conformers having differential stabilisation by solvent polarity. When fluorescence decay is monitored at the PT band an instrument response limited (o60 ps) decay is noted. Strong support in favour of the above-mentioned structural, steady state and time-resolved optical observations and analyses has been obtained from the methoxy derivative mOMe-MBDI and MOMIM. Introduction The green fluorescent protein (GFP) chromophore (p-HBDI, Chart 1) residing inside a b-barrel exhibits very high fluores- cence quantum yield (F fl , B0.8) and high fluorescence lifetime (t fl , in the nanosecond range). 1 However, the same p-HBDI exhibits very low F fl (10 3 or lower) and t fl (several hundred femtoseconds to several picoseconds) in solution. 1–15 Differential optical behaviour of p-HBDI in a b-barrel and in solution has Department of Chemical Sciences, Indian Institute of Science Education and Research (IISER) Kolkata, Mohanpur, West-Bengal, 741246, India. E-mail: [email protected] † Electronic supplementary information (ESI) available: Experimental details, synthesis and characterisation of GFP chromophore analogues, additional NMR data and stack plot, crystallographic table, additional steady state and time-resolved spectroscopic data, etc. CCDC 1417289 and 1417290. For ESI and crystallographic data in CIF or other electronic format see DOI: 10.1039/c6cp04219h Received 16th June 2016, Accepted 5th August 2016 DOI: 10.1039/c6cp04219h www.rsc.org/pccp PCCP PAPER Open Access Article. Published on 05 August 2016. Downloaded on 2/18/2022 8:34:35 AM. This article is licensed under a Creative Commons Attribution-NonCommercial 3.0 Unported Licence. View Article Online View Journal | View Issue
Transcript of Solvent H-bond accepting ability induced conformational ...
24332 | Phys. Chem. Chem. Phys., 2016, 18, 24332--24342 This journal is© the Owner Societies 2016
Cite this:Phys.Chem.Chem.Phys.,
2016, 18, 24332
Solvent H-bond accepting ability inducedconformational change and its influence towardsfluorescence enhancement and dual fluorescenceof hydroxy meta-GFP chromophore analogue†
Tanmay Chatterjee, Mrinal Mandal and Prasun K. Mandal*
The effect of structural rigidity towards enhancement of fluorescence quantum yield of GFP
chromophore analogues has been documented. In the present study, a new way of enhancing the
fluorescence quantum yield of two ortho–meta GFP chromophore analogues meta-methoxy-ortho-
hydroxy-benzylimidazolidinone (abbreviated as mOMe-HBDI) and meta-diethylamino-ortho-hydroxyl
imidazolidinone (abbreviated as MOHIM) has been reported. This enhancement is controlled by the
H-bond accepting ability (denoted as b value) of the solvent and happens only in the case of GFP
chromophore analogues having ortho (hydroxyl)-meta (electron donating group) and not in the
case of analogues having a para electron donating group. The ground state (solid) conformation of
mOMe-HBDI has been obtained from single crystal X-ray analysis, exhibiting the existence of strong
intramolecular H-bonding. However, in solution phase, as the solvent b value increases, the strength of
intramolecular H-bonding decreases. This process has strong influence on the relative conformational
orientation of phenyl and imidazolidinone rings. For mOMe-HBDI, fluorescence quantum yield increases
with increase in b value of the solvents. However, the effect of solvent polarity cannot be completely
ruled out. The lower wavelength emission band (B480 nm) has been assigned to the normal charge-
transferred (CT) species, whereas the highly Stokes shifted emission band (B660 nm) has been assigned
to the proton-transferred (PT) tautomer species for mOMe-HBDI. In solvents of low b value (say hexane)
only the PT band and in solvents of high b value (say DMSO) only the CT band is observed. Quite
interestingly, in solvents of intermediate b value both CT and PT bands, thus dual emission, are
observed. For mOMe-HBDI when fluorescence decay is monitored at the normal CT emission band, it is
observed to be biexponential in nature. The short component increases from B0.2 ns to 0.6 ns and the
long component increases from 1 to 3.6 ns as the b value of the solvent increases. For a particular
solvent, when fluorescence decay is monitored at the normal CT band, as the monitoring wavelength
increases the amplitude of the long lifetime component increases and that of the short lifetime
component decreases. Time-resolved area-normalised emission spectral (TRANES) analysis confirms
the possible existence of two conformers having differential stabilisation by solvent polarity. When
fluorescence decay is monitored at the PT band an instrument response limited (o60 ps) decay is
noted. Strong support in favour of the above-mentioned structural, steady state and time-resolved
optical observations and analyses has been obtained from the methoxy derivative mOMe-MBDI
and MOMIM.
Introduction
The green fluorescent protein (GFP) chromophore (p-HBDI,Chart 1) residing inside a b-barrel exhibits very high fluores-cence quantum yield (Ffl, B0.8) and high fluorescence lifetime(tfl, in the nanosecond range).1 However, the same p-HBDIexhibits very low Ffl (10�3 or lower) and tfl (several hundredfemtoseconds to several picoseconds) in solution.1–15 Differentialoptical behaviour of p-HBDI in a b-barrel and in solution has
Department of Chemical Sciences, Indian Institute of Science Education and
Research (IISER) Kolkata, Mohanpur, West-Bengal, 741246, India.
E-mail: [email protected]
† Electronic supplementary information (ESI) available: Experimental details,synthesis and characterisation of GFP chromophore analogues, additional NMRdata and stack plot, crystallographic table, additional steady state and time-resolvedspectroscopic data, etc. CCDC 1417289 and 1417290. For ESI and crystallographicdata in CIF or other electronic format see DOI: 10.1039/c6cp04219h
Received 16th June 2016,Accepted 5th August 2016
DOI: 10.1039/c6cp04219h
www.rsc.org/pccp
PCCP
PAPER
Ope
n A
cces
s A
rtic
le. P
ublis
hed
on 0
5 A
ugus
t 201
6. D
ownl
oade
d on
2/1
8/20
22 8
:34:
35 A
M.
Thi
s ar
ticle
is li
cens
ed u
nder
a C
reat
ive
Com
mon
s A
ttrib
utio
n-N
onC
omm
erci
al 3
.0 U
npor
ted
Lic
ence
.
View Article OnlineView Journal | View Issue

This journal is© the Owner Societies 2016 Phys. Chem. Chem. Phys., 2016, 18, 24332--24342 | 24333
been attributed to structural t twist around the exocyclic doublebond connecting benzene and imidazolidinone moieties.1–14
Thus, the quest of enhancing fluorescence behaviours of theGFP chromophore in normal organic solvents is very active.There are several reports regarding enhancement of Ffl (and tfl)due to structural restriction of t twist.15–28 There are a fewreports describing how enhancement of solvent polarity orhydrogen bond donating ability of solvents reduces Ffl.
10,11,29
However, there has been no such detailed investigation till dateregarding solvent-property-controlled enhancement of Ffl inthe case of GFP chromophore analogues, especially enhance-ment of Ffl in high polarity solvents. Hydrogen bond donatingand accepting abilities of solvents have been shown to havesignificant effect on the photophysics of molecules exhibitingexcited state proton transfer.30–32 It has been shown that therelative intensity of charge transfer (CT) and proton transfer(PT) bands of these molecules is controlled by the relativedynamics of CT and PT. The latter is in turn controlledby polarity and hydrogen bond donating/accepting ability ofthe solvent.30 For several molecules it has been reported thatan excited state intramolecular PT process could suppressthe intramolecular CT process30,31 and vice versa.33 However,modulation of the extent of CT by excited state PT and its effecttowards tuning Ffl and tfl for GFP chromophore analogues havenot been investigated in detail.
It has been reported in the literature that, para and metaderivatives of GFP chromophore analogue (m-HBDI and p-HBDI,Chart 1) spectroscopically behave differently in solution.10,34–36 Ithas also been shown that an electron donating group like anamine group in the meta orientation can get involved in thecharge transfer process.36–40 It has been reported in the literaturethat as solvent polarity increases fluorescence quantum yieldand fluorescence lifetime decrease.10,29 Although there areseveral reports of observation of CT and PT emission bandsand thus dual fluorescence of other molecules, there is only onereport of dual fluorescence, i.e. that of CT and PT bands, of GFPchromophore analogues.41 It has been shown that by chemicalstructural control of the extent of CT, the relative intensity of CTand PT bands can be modulated.41 However, it has never beenreported that H-bond accepting ability can enhance fluorescencequantum yield and fluorescence lifetime significantly. In orderto shed light in the above direction four different molecules(mOMe-MBDI, m-OMe-HBDI, MOMIM and MOHIM, see Chart 1)
have been synthesised. These molecules are not new and havebeen synthesised by different groups previously.10,42 Somephotophysical data have also been reported. For exampleTolbert et al. have synthesised mOMe-MBDI and measured thephotophysical data in ethanol containing 1% DMSO solvent.42
A very high value of ffl (31%) is reported but no discussion aboutthe same was given. Chou et al. have synthesised the compoundsand measured the photophysical data in a few solvents.20 Theyobserved proton transfer tautomer emission of mOMe-HBDIin nonpolar solvents like cyclohexane. However, complicatedmultiexponential decay for mOMe-HBDI in polar solvents wasobserved. Possible existence of E–Z isomerisation in the groundand excited states and deprotonation to the polar solvents werespeculated.20 Recently mOMe-HBDI was studied by Shustova et al.in a solid scaffold-like MOF matrix.28 However, they observedgreen emission of mOMe-HBDI in MOF matrix in contrast to thered tautomer emission in solution.28 All these interesting resultsstimulated us to reinvestigate the photophysical properties of thecompounds m-OMe-HBDI and m-OMe-MBDI in detail. Studieswere extended to other similar o-hydroxy derivatives containingstronger electron donating diethylamino group in the metaposition, viz. MOMIM and MOHIM. Comparison with data onpreviously reported analogues containing hydroxy groups at theortho position has also been performed to support and validatethe interpretation made in the present study. It could be success-fully shown that fluorescence quantum yield and fluorescencelifetime were indeed enhanced as solvent H-bond accepting abilityand solvent polarity increases.
Results and discussionGround state structure analysis from X-ray and NMR studies
Solid state single crystal structures of mOMe-HBDI and mOMe-MBDI are shown in Fig. 1 ((a) and (b) respectively). Theconformation of mOMe-HBDI exhibits nearly planar relativeorientation of phenyl and imidazolidinone rings, with dihedralangle +N(5)–C(9)–C(7)–C(11) of �1.071. A smaller distanceof 2.597 Å between O(3)–N(5) and dihedral angle of 1631 for+O(3)–H–N(5) confirm the formation of a strong intramolecularhydrogen bond between the hydroxyl group of the phenylring and the sp2 nitrogen of the imidazolidinone ring. In thisconformation the proton attached to C12 of mOMe-HBDI is onthe opposite side to the sp2 nitrogen of the imidazolidinone ring(shown by an arrow). The solid state conformation of mOMe-MBDI (Fig. 1b) adopts the almost planar Z-form in the solidstate with a dihedral angle of �7.891 (+C3–C4–C6–N1), with themethoxy group on the opposite side to the sp2 nitrogen of theimidazolidinone ring due to steric bulk. This conformationkeeps the proton attached to C3 of mOMe-MBDI on the sameside and spatially closer to the sp2 nitrogen of the imidazolidinonering (shown with an arrow). The distance between the protonshown as ‘‘Ha’’ (Fig. 2b) and the sp2 nitrogen of imidazolidinonering is B2.40 Å, with +C–Ha–N angle of B1271. Such a closespatial arrangement could cause the electronic environmentaround the proton (shown with an arrow) of mOMe-MBDI
Chart 1 Chemical structure of GFP chromophore analogues.
Paper PCCP
Ope
n A
cces
s A
rtic
le. P
ublis
hed
on 0
5 A
ugus
t 201
6. D
ownl
oade
d on
2/1
8/20
22 8
:34:
35 A
M.
Thi
s ar
ticle
is li
cens
ed u
nder
a C
reat
ive
Com
mon
s A
ttrib
utio
n-N
onC
omm
erci
al 3
.0 U
npor
ted
Lic
ence
.View Article Online

24334 | Phys. Chem. Chem. Phys., 2016, 18, 24332--24342 This journal is© the Owner Societies 2016
to be highly perturbed by the electronic environment of theimidazolidinone ring.43
To arrive at the solution state conformation, 1H NMR hasbeen performed for both mOMe-HBDI and mOMe-MBDI (forMOMIM and MOHIM see ESI,† S12). In mOMe-HBDI thepresence of a strong intramolecular hydrogen bond betweenthe o-hydroxyl group and the sp2 nitrogen of the imidazolidi-none ring was confirmed from a large downfield shift of thehydroxyl proton obtained at 13.28 ppm in CDCl3.15,20 Thecorresponding peak was shifted to 13.08, 12.67, and 11.12 ppmin CD3CN, THF-d8, and DMSO-d6 respectively (Fig. 1c). Thus,as the H-bond accepting ability of the solvent increases the
corresponding peak of hydroxyl proton shifts up-field indicating‘partial rupture’ of the intramolecular H-bond.
It would be interesting to know whether because of partialrupture of the H-bond there is any change in the relativeconformation of benzyl and imidazolidinone rings. In mOMe-HBDI the proton ‘‘Ha’’ remains in the opposite direction withrespect to the sp2 nitrogen of the imidazolidinone ring (Fig. 1a)and appears at dHa = 7.86 ppm in DMSO-d6 (Fig. 1d and e). InCDCl3 this proton ‘‘Ha’’ is far apart from the imidazolidinonering and dHa in CDCl3 is 6.77 ppm. For mOMe-MBDI the d valueof the proton ‘‘Ha’’ appears at dHa = 8.42 ppm in CDCl3. Fromthe structural aspect it is expected that because of steric bulk,
Fig. 1 Single crystal structure of (a) mOMe-HBDI and (b) mOMe-MBDI. Thermal ellipsoids are drawn at the 50% probability level. (c) 1H NMR spectrashowing the variation in position of the hydroxyl proton in different solvents. (d) 1H NMR spectra showing the shift of the ‘‘Ha’’ proton, indicating solutionstate variation in conformation of mOMe-HBDI and mOMe-MBDI. (e) Solvent-dependent ground state conformation in solution ((I) mOMe-HBDI inCDCl3, (II) mOMe-HBDI in DMSO-d6, (III) mOMe-MBDI in CDCl3). The crystal structure of mOMe-HBDI was reported earlier by measuring the data at adifferent temperature (150 K). Data in the present study were recorded at room temperature (293 K). Changes in bond length and bond angle values havebeen observed.20 The crystal structure of MOMIM has already been reported.10
PCCP Paper
Ope
n A
cces
s A
rtic
le. P
ublis
hed
on 0
5 A
ugus
t 201
6. D
ownl
oade
d on
2/1
8/20
22 8
:34:
35 A
M.
Thi
s ar
ticle
is li
cens
ed u
nder
a C
reat
ive
Com
mon
s A
ttrib
utio
n-N
onC
omm
erci
al 3
.0 U
npor
ted
Lic
ence
.View Article Online

This journal is© the Owner Societies 2016 Phys. Chem. Chem. Phys., 2016, 18, 24332--24342 | 24335
the methoxy group (in mOMe-MBDI) will remain in the sameconformation as in the solid phase. In that scenario the proton‘‘Ha’’ of mOMe-MBDI will be spatially closer to the sp2 nitrogenof the imidazolidinone ring (see Fig. 1b). Deshielding of thatproton by the imidazolidinone ring is evidenced by the largedownfield shift of that proton (‘‘Ha’’) with respect to that ofmOMe-HBDI in 1H NMR spectra. Thus, a Dd value of B1.65ppm between the ‘‘Ha’’ proton in mOMe-HBDI and the ‘‘Ha’’proton in mOMe-MBDI (Fig. 1d and e, both in CDCl3) providesa clear indication of the spatial position with respect to the sp2
nitrogen of the imidazolidinone ring and hence the conforma-tion in solution. So the position of the ‘‘Ha’’ proton (d, ppmscale) in 1H NMR spectra of mOMe-MBDI and mOMe-HBDIcould be correlated with its average distance from the sp2
nitrogen atom of the imidazolidinone ring. The dHa value of
the ‘‘Ha’’ proton of mOMe-HBDI in DMSO-d6 is in between thefarthest (mOMe-HBDI in CDCl3) and closest (mOMe-MBDIin CDCl3) positions of the ‘‘Ha’’ proton with respect to theimidazolidinone ring. Thus, in a strong H-bond acceptingsolvent like DMSO, not only does the H-bond get ruptured,but also the orientation of the benzyl ring with respect to theimidazolidinone ring is in between two oppositely oriented planarconformations. Thus, the solvent b value dependent conforma-tion is noted (Fig. 1e).
Steady state spectral analysis
Absorption. Absorption spectra of mOMe-HBDI and mOMe-MBDI in different solvents are depicted in Fig. 2a and brespectively (for MOMIM and MOHIM see ESI,† S13). Absorptionmaximum of mOMe-HBDI (425 nm) is 35 nm red shifted with
Fig. 2 Absorption spectra of mOMe-HBDI in different solvents (a). Absorption spectra of mOMe-MBDI in hexane and DMSO (b). Solvent dependentemission spectra of mOMe-HBDI (inset shows normalisation of proton transfer band of mOMe-HBDI in different solvents) (c) and mOMe-MBDI (d) (lex,corresponding absorption maxima of the lowest energy band, normalised to the charge transfer band). Solvent b value dependent enhancement offluorescence quantum yield of mOMe-HBDI (inset shows enhancement of fluorescence quantum yield of mOMe-HBDI upon addition of DMSO in DCM)(e). Solvent polarity (P0)44 dependent enhancement of fluorescence quantum yield of mOMe-MBDI (f).
Paper PCCP
Ope
n A
cces
s A
rtic
le. P
ublis
hed
on 0
5 A
ugus
t 201
6. D
ownl
oade
d on
2/1
8/20
22 8
:34:
35 A
M.
Thi
s ar
ticle
is li
cens
ed u
nder
a C
reat
ive
Com
mon
s A
ttrib
utio
n-N
onC
omm
erci
al 3
.0 U
npor
ted
Lic
ence
.View Article Online

24336 | Phys. Chem. Chem. Phys., 2016, 18, 24332--24342 This journal is© the Owner Societies 2016
respect to the absorption maximum of the mOMe-MBDI(390 nm) (both in hexane). A similar red shift (22 nm) of thelong wavelength absorption band of MOHIM compared withMOMIM was observed in hexane (see ESI,† Table S3). This redshift indicates the formation of a seven-membered ring withintramolecular H-bond in mOMe-HBDI and MOHIM. Thus, thep electron gets more delocalised and hence the energy gapbetween the S0 and S1 electronic levels decreases. If that is true,then it could be anticipated that rupture of the intramolecularH-bond would cause a blue shift of absorption maxima. This isindeed what has been observed for mOMe-HBDI. As the H-bondaccepting ability or b value of the solvent increases, theabsorption maximum gets blue shifted from hexane (425 nm)to DMSO (408 nm) (Fig. 2a). The absorption maxima of mOMe-HBDI and mOMe-MBDI (408 nm and 399 nm respectively) aswell as MOHIM and MOMIM (473 nm and 476 nm respectively)are quite close to each other in DMSO.
Emission. The emission spectra of mOMe-HBDI and mOMe-MBDI in various fluid organic solvents are shown in Fig. 2c andd respectively (for MOMIM and MOHIM see ESI,† S13). Steadystate photophysical data for mOMe-HBDI and mOMe-MBDI aredepicted in Tables 1 and 2 respectively (for MOMIM andMOHIM see ESI,† Table S3). In the case of mOMe-HBDI, insolvents of low b value (say hexane) a highly Stokes shifted(48000 cm�1) emission band (maximum B660 nm) is observed.The emission maximum of this band is independent of solventpolarity (see inset of Fig. 2c). However, as the solvent b valueincreases the intensity of this highly Stokes shifted banddecreases and a new lower wavelength band appears. This lowerwavelength band emission maximum changes from 485 nm to525 nm. Similarly for MOHIM in solvents of low b value a highlyStokes shifted emission band with no solvatochromic shift wasobserved. However, in solvents of moderate or high b valuea band with large solvatochromic shift was observed (see ESI,†Fig. S20 and Table S3). For mOMe-MBDI, as the solvent polarityincreases the emission maximum increases (from 451 nm inhexane to 510 nm in DMSO), indicating the charge transfernature of the emitting species. A similar observation was madefor MOMIM (see ESI,† Fig. S19). Computational calculationshows that the electron gets transferred from the methoxy groupor diethylamino group at the meta position to the imidazolidi-none ring of mOMe-MBDI (from HOMO to LUMO, see ESI,† S10)or MOMIM.10 Comparing the emission behaviour with mOMe-MBDI, for mOMe-HBDI the lower wavelength band has beenassigned to the charge transferred (CT) species and the longerwavelength band has been assigned to the proton transferred
(PT) tautomer species. For mOMe-HBDI in hexane only theproton transferred tautomer band is observed. As the b valueof the solvent increases, the intensity of this PT band decreasesand dual fluorescence is observed (both CT and PT band). Insolvents of very high b value only the CT band is observed. Thiskind of dual fluorescence of GFP chromophore analogues andeffect of solvent polarity on relative magnitude of CT and PTbands has recently been reported in the literature.41 To the bestof our knowledge this is only the second report of this kind.Absence of the PT band in solvents of high b value confirms thatthe H-bond is indeed ruptured and thus no PT band is observed.However, more interesting is the drastic variation in ffl ofmOMe-HBDI from solvent to solvent (Fig. 2f). Solvent b valuedependent photophysical data of mOMe-HBDI are depictedin Table 1. It can be noticed from Table 1 that there is almost2000 times enhancement of fluorescence quantum yield fromhexane to DMSO for mOMe-HBDI. Also, for MOHIM, with themuch stronger electron donating diethylamino group at the metaposition, enhancement of ffl occurs from hexane to DMSO (seeESI,† Table S3). But the extent of enhancement is much less(only 10–15 times in comparison with 2000 times in mOMe-HBDI). This difference is because the emission maximum ofMOHIM is at 700 nm (red) and that of mOMe-HBDI is at 525 nm(green). Thus, another nonradiative decay channel governed bythe energy gap law becomes operative in DMSO.10,45,46 Thepresence of such nonradiative decay was previously investigatedby our group in detail for MOMIM.10 The inset of Fig. 2e showsthe enhancement of ffl with respect to addition of DMSO toa solution of mOMe-HBDI in DCM. In DMSO, mOMe-HBDIpossesses a ffl of B21% which is almost the same value asobtained for mOMe-MBDI. Similarly, MOMIM and MOHIMpossess almost the same ffl value (B0.6%) in DMSO. Theincrease in ffl of mOMe-HBDI and MOHIM in different solventscould be easily correlated with increase in solvent H-bond acceptingbasicity parameter (b value) rather than solvent polarity. We candraw this inference because tetrahydrofuran (THF) is a solvent oflower polarity but higher H-bond accepting ability than acetonitrile(ACN), and ffl of mOMe-HBDI is almost four times higherin THF than in ACN (see Table 1). Quite interestingly, ffl
of mOMe-MBDI is 4.8% in hexane and it gradually increaseswith gradual increase of polarity of non-hydroxylic solvents andreaches 15% in DMF and 21% in DMSO (see Fig. 2f andTable 2). In polar solvents with high hydrogen bond acceptingability e.g. DMSO, high fluorescence quantum yield (21%) forphysically non-restricted GFP chromophore analogues has beenobtained for mOMe-MBDI. However, for MOMIM ffl decreases
Table 1 Steady state photophysical data of mOMe-HBDI in differentsolvents
Solvents Solvent b-value labs (nm) e (M�1 cm�1) lem (nm) ffl
Hexane 0.00 425 NA 656 B10�4
DCM 0.10 419 1.0 � 104 485, 667 B10�4
ACN 0.40 409 1.1 � 104 510, 658 0.006THF 0.55 410 1.3 � 104 483, 658 0.022DMF 0.69 409 1.3 � 104 517 0.112DMSO 0.76 408 1.5 � 104 525 0.205
Table 2 Steady state photophysical data of mOMe-MBDI in differentsolvents
Solvents Solvent polarity (P0)44 labs (nm) e (M�1 cm�1) lem (nm) ffl
Hexane 0.0 390 NA 451 0.048DCM 3.1 396 1.5 � 104 489 0.063THF 4.0 390 1.2 � 104 478 0.104ACN 5.8 393 1.6 � 104 510 0.104DMF 6.4 393 1.7 � 104 503 0.149DMSO 7.2 399 1.2 � 104 510 0.210
PCCP Paper
Ope
n A
cces
s A
rtic
le. P
ublis
hed
on 0
5 A
ugus
t 201
6. D
ownl
oade
d on
2/1
8/20
22 8
:34:
35 A
M.
Thi
s ar
ticle
is li
cens
ed u
nder
a C
reat
ive
Com
mon
s A
ttrib
utio
n-N
onC
omm
erci
al 3
.0 U
npor
ted
Lic
ence
.View Article Online
This journal is© the Owner Societies 2016 Phys. Chem. Chem. Phys., 2016, 18, 24332--24342 | 24337
from hexane (ffl B 12%) to DMSO (ffl B 0.6%). This waspreviously ascribed to the energy gap law governed nonradio-active decay in DMSO due to the much red shifted emissionmaximum (lem B 690 nm for MOMIM in comparison with510 nm for mOMe-MBDI).10 However, without the presence ofelectron donating groups like methoxy or diethylamino at themeta position of the benzene ring neither of the derivativescould show such large enhancement in fluorescence properties,at least in nonpolar solvents.36–40 This enhancement is due tothe ortho–meta effect of electron donating groups in benzinoidcompounds.36–40 Consequently OHIM, CHBDI and MHBDI,studied previously by our group, were unable to show such largeenhancement in fluorescence properties in DMSO (ffl B 10�4)although similar rupture of the intramolecular H-bond wasobserved.41 For the same reason, o-HBDI studied by differentgroups earlier was nonfluorescent in solvents of different polarityand H-bond accepting basicity.15 Here it is worth mentioningthat only a single OMe or OH group as substituent at the metaposition or at the ortho position of the benzene ring is not soefficient in enhancing the fluorescence quantum yield to such alarge extent.15,34,35 Rather, combination of two electron donatingOMe groups at both meta and ortho positions of the benzene ringcould enhance the charge transfer character to such an extentthat enhancement of photophysical properties (such as ffl andtfl) is of much larger magnitude in comparison with moleculescontaining a single OMe group. This is known as the ‘‘excitedstate ortho–meta effect’’ of the electron donating groups.39,47 Inother words, mOMe-HBDI and mOMe-MBDI containing twoelectron donating groups at meta and ortho positions and havingemission maxima in the blue-green region in a variety of polarsolvents constitute an ideal choice of molecules to observesolvent polarity and H-bond accepting basicity dependentfluorescence enhancement. Interestingly, in a high polarity protic(i.e. H-bond donating) solvent like MeOH, ffl is 0.02, which canbe attributed to solute–solvent H-bonding interaction.11 Thiskind of fluorescence enhancement that is controlled by polarityand hydrogen bond accepting ability of the solvent has notbeen reported earlier. It should also be mentioned here thatthe viscosity of DMSO (2.24 cP) is higher than that of hexane(0.31 cP) or DCM (0.44 cP). However, there are plenty of reportsin the literature to show that this great increase in viscosity hasnegligible effect on t-twist, and hence the enhancement offfl of mOMe-MBDI and mOMe-HBDI in DMSO cannot be dueto viscosity.3,8,48
Fluorescence dynamics results
(a) For mOMe-MBDI. In order to understand the photophysics aswell as fluorescence dynamics in a better way, time-resolved fluores-cence spectroscopic measurements have been performed usingfemtosecond upconversion as well as picosecond–nanosecond basedtime-correlated single photon counting techniques. For mOMe-MBDI, single exponential decay behaviour was observed in hexane(Fig. 3a and Table 3) (for MOMIM see ESI,† S13 and Table S3).However, with increasing solvent polarity, excited state decay ofmOMe-MBDI becomes biexponential as well as slower (Fig. 3a).The time constants are shown in Table 3. The magnitude of the
short lifetime component (B0.36 ns) increases from 0.35 ns to0.60 ns whereas the magnitude of the long lifetime componentincreases from 1.2 ns to 3.2 ns as solvent polarity increases.The decay in hexane is independent of monitoring wavelength.However, in solvents of higher polarity fluorescence decaybecomes monitoring wavelength dependent. For example, inacetonitrile as the monitoring wavelength increases, the ampli-tude of the longer lifetime component increases gradually andthat of the short component decreases concomitantly (Fig. 3band Table 3). The magnitude of both lifetimes, however,remains independent of monitoring wavelength for a particularsolvent, say acetonitrile. Time-resolved area-normalised emis-sion spectra (TRANES) show (Fig. 3c) an isoemissive pointat 19 791 cm�1. Above the isoemissive point (in cm�1 scale)emission intensity decreases and below the isoemissive point theemission intensity increases with increase in time. However, thepossible existence of two different states, viz. LE state (unsolvated)and solvent stabilised ICT state, is excluded owing to the observednanosecond timescale of relaxation. (Solvent relaxation occurs inhundreds of femtoseconds or within a few picoseconds.) Thus asimpler model consisting of two different conformers could beconsidered. However, no rise time was noticed in 60 ps or longertimescale. Following a recent report for para derivatives ofmodified p-HBDI by Meech et al., we ascribe planar or nearlyplanar conformers to State II (see Fig. 3d), which have slightlyred shifted absorption and emission bands compared with thef-twisted conformers ascribed to State I (see Fig. 3d).3,11 It isalso expected that charge transfer efficiency for the planarconformation (State II) would be more than for the f-twistedconformer (State I). Thus, two conformers are expected to bedifferently stabilised by polar solvents. In hexane both theconformers have similar excited state lifetimes as charge transferstabilisation by the solvent is negligible. However, in polarsolvents the planar conformer (State II) will have more solventstabilisation than the twisted one (State I). Hence the excitedstate lifetime of the planar conformer (State II) will be longer(1.2 to 3.1 ns) than that of the twisted conformer (State I) (0.35to 0.57 ns). This is further supported by the fact that as themonitoring wavelength increases the amplitude of the longcomponent increases. In comparison with para derivatives theextent of charge transfer (for both nearly twisted conformation(State I) and nearly planar conformation (State II)) is higher formeta analogues. Hence a longer excited state lifetime isexpected for meta analogues and that is what has been observed(B0.35–0.57 ns and 1.2–3.1 ns for meta analogues in comparisonwith 0.28 ps and 0.85 ps for para derivative ABDI11). It isnecessary to understand why ffl and tfl of mOMe-MBDIincrease with increase in polarity of the solvent. Followingthe Michl and Bonacic-Koutecky model for a meta derivative(say mOMe-MBDI), the planar singlet state (1S*) will be morestabilised than the t-twisted geometry (1P*) in the excitedstate.10,37,49–52 It is also reported that nonradiative decay occursfrom the twisted state, thereby reducing the ffl.
37 Thus, as theenergy barrier from solvent stabilised CT state (1S*, see Fig. 3d)to t-twisted state (1P*, see Fig. 3d) increases there will be lesschance of twisted state formation; hence there is less chance of
Paper PCCP
Ope
n A
cces
s A
rtic
le. P
ublis
hed
on 0
5 A
ugus
t 201
6. D
ownl
oade
d on
2/1
8/20
22 8
:34:
35 A
M.
Thi
s ar
ticle
is li
cens
ed u
nder
a C
reat
ive
Com
mon
s A
ttrib
utio
n-N
onC
omm
erci
al 3
.0 U
npor
ted
Lic
ence
.View Article Online

24338 | Phys. Chem. Chem. Phys., 2016, 18, 24332--24342 This journal is© the Owner Societies 2016
Z–E isomerisation. Z–E isomerisation has been shown to be a majornonradiative decay channel for GFP chromophore analogues.1–14,36
Thus, as the chance of Z–E isomerisation decreases there will beenhanced ffl. For mOMe-MBDI the magnitude of fZE decreasesfrom CDCl3 (54%) to DMSO-d6 (41%) (see ESI,† S11). This isbecause of solvent polarity mediated stabilisation of mOMe-MBDI and thereby concomitant increase of the Z–E isomerisa-tion energy barrier (Fig. 3d).
Thus, tfl will be increased and hence ffl will be increased aspolarity of the solvent increases. An energy level diagram is providedfor mOMe-MBDI, and also the steady state property ffl can becorrelated to the time-resolved property tfl (see Tables 2 and 3). FormOMe-MBDI, the CT stabilisation induced emission maximumis in the blue region (B510 nm in ACN). However, for MOMIMand similar compounds, the CT stabilisation induced emissionmaximum is in the red region (690 nm for MOMIM in ACN).
Table 3 Time-resolved photophysical data of mOMe-MBDI and mOMe-HBDI in different solvents. Amplitudes of fluorescence decay components areshown in parentheses
Solvent Solvent polarity index (P0) lmon (nm)
Lifetime (ns)
lmon (nm)
Lifetime
mOMe-MBDI mOMe-HBDI
Hexane 0.0 451 t1 = 0.35 656 t1 = o60 psDCM 3.1 489 t1 = 0.35 (29.3), t2 = 1.2 (70.7) 485 t1 = 0.17 ns (30.6), t2 = 1.03 ns (69.4)
667 t1 = 0.75 ps (34), t2 = 8.05 ps (66)THF 4.0 478 t1 = 0.58 (30.1), t2 = 2.0 (69.9) 483 t1 = 0.38 ns (32.2), t2 = 1.86 ns (67.8)
658 t1 = o60 psACN 5.8 510 t1 = 0.60 (30.7), t2 = 2.72 (69.3) 510 t1 = 0.51 ns (28.9), t2 = 2.91 ns (71.1)
658 t1 = 0.36 ps (35), t2 = 6.8 ps (65)DMF 6.4 503 t1 = 0.58 (23.4), t2 = 2.71 (76.6) 517 t1 = 0.55 ns (28), t2 = 3.37 ns (72)DMSO 7.2 510 t1 = 0.57 (22.7), t2 = 3.1 (77.3) 525 t1 = 0.60 ns (21), t2 = 3.61 ns (79)
Fig. 3 (a) Variation in fluorescence decay (TCSPC) of mOMe-MBDI in different fluid organic solvents of different polarity index. (b) Fluorescence decayof mOMe-MBDI in acetonitrile monitored at different wavelengths of steady state emission spectra. (c) Construction of time-resolved area-normalisedemission spectra (TRANES) in acetonitrile. (d) Excited state relaxation dynamics of mOMe-MBDI in acetonitrile. State I (twisted) and State II (planar ornearly planar) are excited states of two conformers that differ in the extent of F twist.
PCCP Paper
Ope
n A
cces
s A
rtic
le. P
ublis
hed
on 0
5 A
ugus
t 201
6. D
ownl
oade
d on
2/1
8/20
22 8
:34:
35 A
M.
Thi
s ar
ticle
is li
cens
ed u
nder
a C
reat
ive
Com
mon
s A
ttrib
utio
n-N
onC
omm
erci
al 3
.0 U
npor
ted
Lic
ence
.View Article Online
This journal is© the Owner Societies 2016 Phys. Chem. Chem. Phys., 2016, 18, 24332--24342 | 24339
As the emission is in the red region a nonradiative decay channelwhich is governed by the energy gap law becomes effective.10,29
Hence both ffl and tfl decrease with increase of solvent polarity(see ESI,† Table S3). Hence, it could be shown that chemicalstructural modification induced control of electronic energylevels plays a crucial role in controlling ffl and tfl.
(b) For mOMe-HBDI. No Z–E isomerisation was observedfor mOMe-HBDI or MOHIM. This result is consistent with thepreviously observed results on similar o-hydroxy derivatives ofp-HBDI.53–55 This negligible Z–E isomerisation for derivativesbearing the o-hydroxy group was ascribed to the structure of themolecule at the conical intersection due to the presence of theintramolecular H-bond, which favours the return of the mole-cule to the Z-form after S1 - S0 internal conversion.53,55 In fact,in contrast to the t-twisting co-ordinate for the methoxyderivatives,11,36 the f-twisting co-ordinate is reported to be adominant nonradiative relaxation pathway for correspondinghydroxy derivatives.54,55 The decay behaviour of mOMe-HBDIand MOHIM is much more complicated. Monitoring at theproton transfer band of mOMe-HBDI, a system response limitedrise (o280 fs) and biexponential decay with time constant of360 fs and 6.8 ps were observed (see Table 3, ESI,† S8 andFig. S14). The faster decay component of 360 fs was alsoobserved for similar excited state intramolecular proton transfer(ESIPT) systems reported previously.54 But its origin is not fullyunderstood. Intramolecular vibrational redistribution, vibronicrelaxation, and internal conversion etc. have been proposedas possible origin.54 The longer decay component (6.8 ps) isassociated with the population decay of the proton transferredtautomer species. Similar ultrafast decay of proton transfertautomer emission associated with rotation around the exocyclicbond in the excited state has been reported earlier for o-HBDIand similar intramolecularly H-bonded analogues of o-HBDI.15,54
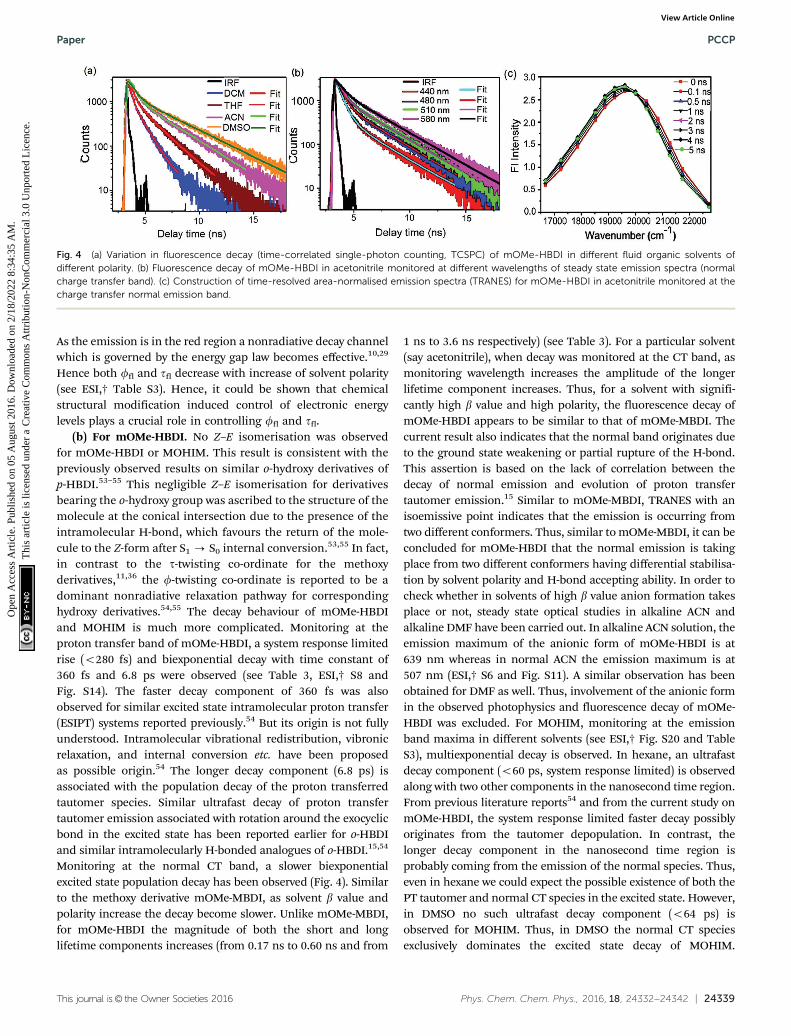
Monitoring at the normal CT band, a slower biexponentialexcited state population decay has been observed (Fig. 4). Similarto the methoxy derivative mOMe-MBDI, as solvent b value andpolarity increase the decay become slower. Unlike mOMe-MBDI,for mOMe-HBDI the magnitude of both the short and longlifetime components increases (from 0.17 ns to 0.60 ns and from
1 ns to 3.6 ns respectively) (see Table 3). For a particular solvent(say acetonitrile), when decay was monitored at the CT band, asmonitoring wavelength increases the amplitude of the longerlifetime component increases. Thus, for a solvent with signifi-cantly high b value and high polarity, the fluorescence decay ofmOMe-HBDI appears to be similar to that of mOMe-MBDI. Thecurrent result also indicates that the normal band originates dueto the ground state weakening or partial rupture of the H-bond.This assertion is based on the lack of correlation between thedecay of normal emission and evolution of proton transfertautomer emission.15 Similar to mOMe-MBDI, TRANES with anisoemissive point indicates that the emission is occurring fromtwo different conformers. Thus, similar to mOMe-MBDI, it can beconcluded for mOMe-HBDI that the normal emission is takingplace from two different conformers having differential stabilisa-tion by solvent polarity and H-bond accepting ability. In order tocheck whether in solvents of high b value anion formation takesplace or not, steady state optical studies in alkaline ACN andalkaline DMF have been carried out. In alkaline ACN solution, theemission maximum of the anionic form of mOMe-HBDI is at639 nm whereas in normal ACN the emission maximum is at507 nm (ESI,† S6 and Fig. S11). A similar observation has beenobtained for DMF as well. Thus, involvement of the anionic formin the observed photophysics and fluorescence decay of mOMe-HBDI was excluded. For MOHIM, monitoring at the emissionband maxima in different solvents (see ESI,† Fig. S20 and TableS3), multiexponential decay is observed. In hexane, an ultrafastdecay component (o60 ps, system response limited) is observedalong with two other components in the nanosecond time region.From previous literature reports54 and from the current study onmOMe-HBDI, the system response limited faster decay possiblyoriginates from the tautomer depopulation. In contrast, thelonger decay component in the nanosecond time region isprobably coming from the emission of the normal species. Thus,even in hexane we could expect the possible existence of both thePT tautomer and normal CT species in the excited state. However,in DMSO no such ultrafast decay component (o64 ps) isobserved for MOHIM. Thus, in DMSO the normal CT speciesexclusively dominates the excited state decay of MOHIM.
Fig. 4 (a) Variation in fluorescence decay (time-correlated single-photon counting, TCSPC) of mOMe-HBDI in different fluid organic solvents ofdifferent polarity. (b) Fluorescence decay of mOMe-HBDI in acetonitrile monitored at different wavelengths of steady state emission spectra (normalcharge transfer band). (c) Construction of time-resolved area-normalised emission spectra (TRANES) for mOMe-HBDI in acetonitrile monitored at thecharge transfer normal emission band.
Paper PCCP
Ope
n A
cces
s A
rtic
le. P
ublis
hed
on 0
5 A
ugus
t 201
6. D
ownl
oade
d on
2/1
8/20
22 8
:34:
35 A
M.
Thi
s ar
ticle
is li
cens
ed u
nder
a C
reat
ive
Com
mon
s A
ttrib
utio
n-N
onC
omm
erci
al 3
.0 U
npor
ted
Lic
ence
.View Article Online

24340 | Phys. Chem. Chem. Phys., 2016, 18, 24332--24342 This journal is© the Owner Societies 2016
Detailed spectroscopic investigations show that intramolecularproton transfer can take place for mOMe-HBDI and MOHIM inhexane, and DCM. In these solvents of lower b value, mOMe-HBDI and MOHIM possess ffl of B0.01% (sum of dual emis-sion). It was also observed that the proton transfer band emitsin the sub-picosecond time scale (8.05 ps in DCM for mOMe-HBDI). This fact indicates that the proton transfer state ofmOMe-HBDI and MOHIM acts as a weakly fluorescent stateand causes ultrafast nonradiative decay of the excited statepopulation. In contrast, in DMSO, owing to partial rupture ofthe intramolecularly H-bonded planar conformation, protontransfer does not take place in the excited state of mOMe-HBDIand MOHIM. As a result emission takes place exclusively fromthe normal CT state. Hence, owing to the barrier to twistinginduced by the same ortho–meta effect (as observed for mOMe-MBDI), mOMe-HBDI possesses very high values of ffl (21%)and tfl (3.2 ns) in DMSO. However, for MOHIM ffl does notincrease much in DMSO mainly due to the initiating of energygap law governed nonradiative decay as the emission maximum(700 nm) is in the red region.10,45,46
The larger the population of the proton transferred tautomerstate (proportional to the ground state intramolecular hydrogenbonding strength in different solvents), the lower the overallffl. Thus, the lower the chance of proton transfer or higher thechance of charge transfer, the higher are ffl and tfl. Hence it isnecessary to know the nature of the proton transferred state.Steady state emission spectra of mOMe-HBDI show that theproton transfer band has negligible solvatochromic shift ofemission maxima in solvents of varying polarity (hexane toACN). Similar results have been reported in the literature.31
This means that in the proton transferred species there isnegligible CT character. This suppression of CT character ismainly due to relocation of the proton between donor andacceptor centre in the excited state of mOMe-HBDI.31,33,56
Suppression of charge transfer by the proton transfer processmakes the charge transfer induced (ortho–meta effect) enhance-ment of ffl and tfl inefficient for mOMe-HBDI. The highlyStokes shifted proton transfer band also results in ultrafastdeactivation of the excited state proton transferred tautomerspecies. In accordance with literature reports, this kind ofnonradiative decay could be assigned to overtone vibrationassociated with the motion of the hydrogen bond.20,54 Inhexane, formation of the intramolecularly H-bonded planarconformation favours excited state proton transfer and conse-quently mOMe-HBDI is very weakly fluorescent (ffl B 0.01%)because of the more nonradiative nature of fluorescence decayin hexane. However, in DMSO, owing to partial rupture of theintramolecular H-bond (evidenced from the NMR spectralanalysis and steady state optical analyses), emission occursexclusively from the normal charge transfer state. This resultsin not-so-large Stokes shifted emission and thus a smallerproportion of non-radiative decay, thereby causing a higherfluorescence quantum yield (ffl = 21%) of mOMe-HBDI inDMSO. It would be interesting to investigate the relativedynamics of CT and PT for mOMe-HBDI and MOHIM indifferent solvents by means of femtosecond pump–probe
technique using ultrashort time resolution (less than 100 fs).Thus, more detailed information about the dynamics of CT andPT and its influence on relative intensity of CT and PT bandscould be understood. These experiments will be performed inthe near future.
Conclusions
The effect of H-bond accepting ability and polarity of thesolvent towards enhancement of fluorescence quantum yieldand fluorescence lifetime of meta GFP chromophore analogueshas been reported in detail for the first time. From singlecrystal X-ray analysis it could be shown that strong intra-molecular H-bonding exists in the hydroxy derivative (mOMe-HBDI). However, as the solvent H-bond accepting abilityincreases, the strength of intramolecular H-bonding decreasesand this process has strong influence on the conformationalstructure or more precisely relative orientation of phenyl andimidazolidinone rings. For the hydroxy derivative, mOMe-HBDIfluorescence quantum yield increases with increase in H-bondaccepting ability or b value of the solvents. However, an effect ofsolvent polarity cannot be completely ruled out. Quite interest-ingly dual fluorescence has been observed in the case of mOMe-HBDI. The lower wavelength emission band (B480 nm) hasbeen assigned to normal charge transferred species, whereasthe highly Stokes shifted emission band (B660 nm) has beenassigned to proton transferred tautomer species. In solvents oflow b value only the PT band and in solvents of high b valueonly the CT band is observed, whereas in solvents of inter-mediate b value both CT and PT bands, and hence dualemission, are observed. For the methoxy derivative mOMe-MBDI, fluorescence quantum yield increases as solvent polarityincreases. This observation is in stark contrast with existingliterature reports where fluorescence quantum yield of severalGFP chromophore analogues has been reported to decreasewith increase in solvent polarity. For the methoxy derivativemOMe-MBDI, fluorescence decay has been observed to bebiexponential. The short component changes from B0.4 nsto 0.6 ns whereas the long component changes from 1 ns to 3 nsas solvent polarity increases. Amplitudes of both short and longlifetimes are almost independent of solvent polarity. However,for a particular solvent (say acetonitrile), as monitoring wave-length increases the amplitude of the longer componentincreases. This observation hints at the possible existence oftwo conformers which have differential stabilisation by solvent.For mOMe-HBDI, when fluorescence decay is monitored at thenormal emission band it is observed to be biexponential innature. For mOMe-HBDI, when fluorescence decay is monitoredat the normal charge transfer band the short componentincreases from B0.2 ns to 0.6 ns and the long componentincreases from 1 ns to 3.6 ns. For a particular solvent, whenfluorescence decay is monitored at the normal charge transferband, as the monitoring wavelength increases the amplitude ofthe long lifetime component increases and that of the shortlifetime component decreases. As for mOMe-MBDI, TRANES
PCCP Paper
Ope
n A
cces
s A
rtic
le. P
ublis
hed
on 0
5 A
ugus
t 201
6. D
ownl
oade
d on
2/1
8/20
22 8
:34:
35 A
M.
Thi
s ar
ticle
is li
cens
ed u
nder
a C
reat
ive
Com
mon
s A
ttrib
utio
n-N
onC
omm
erci
al 3
.0 U
npor
ted
Lic
ence
.View Article Online

This journal is© the Owner Societies 2016 Phys. Chem. Chem. Phys., 2016, 18, 24332--24342 | 24341
analysis of mOMe-HBDI also reveals the existence of twoconformers having differential charge transfer stabilisation bysolvent. When the fluorescence decay is monitored at thetautomer band an instrument response limited (o280 fs) risefollowed by a decay (with two time constants, one of 0.4 to 0.8 psand another of 6.8 to 8.1 ps) were observed. For both mOMe-MBDI and mOMe-HBDI, as solvent polarity increases, the ICTstate (1S*) is more stabilised and the energy barrier from the ICTstate (1S*) to the twisted state (1P*) increases. Thus, there will beless chance of twisted state formation; hence there is less chanceof Z–E isomerisation. Thus, there will be enhanced ffl and tfl.
Conflict of interest
The authors declare no competing financial interests.
Acknowledgements
P. K. M. thanks IISER-Kolkata for financial help and instru-mental facilities. Support from the Fast-Track Project (SR/FT/CS-52/2011) of DST-India is gratefully acknowledged. P. K. M.acknowledges Prof. P. Ramamurthy (NCUFP) for his help infemtosecond decay measurements. T. C. and M. M. thank CSIRIndia for their respective Fellowships.
References
1 H. Niwa, S. Inouye, T. Hirano, T. Matsuno, S. Kojima,M. Kubota, M. Ohashi and F. I. Tsuji, Proc. Natl. Acad. Sci.U. S. A., 1996, 93, 13617–13622.
2 P. Altoe, F. Bernardi, M. Garavelli, G. Orlandi and F. Negri,J. Am. Chem. Soc., 2005, 127, 3952–3963.
3 J. Conyard, M. Kondo, I. A. Heisler, G. Jones, A. Baldridge,L. M. Tolbert, K. M. Solntsev and S. R. Meech, J. Phys. Chem.B, 2011, 115, 1571–1577.
4 M. S. Baranov, K. A. Lukyanov, A. O. Borissova, J. Shamir,D. Kosenkov, L. V. Slipchenko, L. M. Tolbert,I. V. Yampolsky and K. M. Solntsev, J. Am. Chem. Soc.,2012, 134, 6025–6032.
5 M. Zimmer, Chem. Rev., 2002, 102, 759–781.6 K. L. Litvinenko, N. M. Webber and S. R. Meech, J. Phys.
Chem. A, 2003, 107, 2616–2623.7 A. Follenius-Wund, M. Bourotte, M. Schmitt, F. Iyice,
H. Lami, J. J. Bourguignon, J. Haiech and C. Pigault, Bio-phys. J., 2003, 85, 1839–1850.
8 S. Rafiq, B. K. Rajbongshi, N. N. Nair, P. Sen andG. Ramanathan, J. Phys. Chem. A, 2011, 115, 13733–13742.
9 I. Petkova, G. Dobrikov, N. Banerji, G. Duvanel, R. Perez,V. Dimitrov, P. Nikolov and E. Vauthey, J. Phys. Chem. A,2010, 114, 10–20.
10 T. Chatterjee, M. Mandal, V. Gude, P. P. Bag and P. K.Mandal, Phys. Chem. Chem. Phys., 2015, 17, 20515–20521.
11 G. J. Huang, C. W. Cheng, H. Y. Hsu, C. Prabhakar, Y. P. Lee,E. W. G. Diau and J. S. Yang, J. Phys. Chem. B, 2013, 117,2695–2704.
12 K. L. Litvinenko, N. M. Webber and S. R. Meech, J. Phys.Chem. A, 2003, 107, 2616–2623.
13 D. Mandal, T. Tahara and S. R. Meech, J. Phys. Chem. B,2004, 108, 1102–1108.
14 M. E. Martin, F. Negri and M. Olivucci, J. Am. Chem. Soc.,2004, 126, 5452–5464.
15 K. Y. Chen, Y. M. Cheng, C. H. Lai, C. C. Hsu, M. L. Ho,G. H. Lee and P. T. Chou, J. Am. Chem. Soc., 2007, 129,4534–4535.
16 A. Baldridge, K. M. Solntsev, C. Song, T. Tanioka, J. Kowalik,K. Hardcastle and L. M. Tolbert, Chem. Commun., 2010, 46,5686–5688.
17 A. Baldridge, S. Feng, Y. T. Chang and L. M. Tolbert, ACSComb. Sci., 2011, 13, 214–217.
18 M. S. Baranov, K. A. Lukyanov, A. O. Borissova, J. Shamir,D. Kosenkov, L. V. Slipchenko, L. M. Tolbert, I. V. Yampolskyand K. M. Solntsev, J. Am. Chem. Soc., 2012, 134, 6025–6032.
19 T. Chatterjee, D. Roy, A. Das, A. Ghosh, P. P. Bag andP. K. Mandal, RSC Adv., 2013, 3, 24021–24024.
20 W. T. Chuang, C. C. Hsieh, C. H. Lai, C. H. Lai, C. W. Shih,K. W. Chen, W. Y. Hung, Y. H. Hsu and P. T. Chou, J. Org.Chem., 2011, 76, 8189–8202.
21 L. Wu and K. Burgess, J. Am. Chem. Soc., 2008, 130, 4089–4096.22 Y. H. Hsu, Y. A. Chen, H. W. Tseng, Z. Zhang, J. Y. Shen,
W. T. Chuang, T. C. Lin, C. S. Lee, W. Y. Hung, B. C. Hong,S. H. Liu and P. T. Chou, J. Am. Chem. Soc., 2014, 136,11805–11812.
23 A. Baldridge, S. R. Samanta, N. Jayaraj, V. Ramamurthy andL. M. Tolbert, J. Am. Chem. Soc., 2010, 132, 1498–1499.
24 J. S. Paige, K. Y. Wu and S. R. Jaffrey, Science, 2011, 333,642–646.
25 K. P. Kent, L. M. Oltrogge and S. G. Boxer, J. Am. Chem. Soc.,2009, 131, 15988–15989.
26 A. Baldridge, A. Amador and L. M. Tolbert, Langmuir, 2011,27, 3271–3274.
27 K. P. Kent and S. G. Boxer, J. Am. Chem. Soc., 2011, 133,4046–4052.
28 E. A. Dolgopolova, T. M. Moore, W. B. Fellows, M. D. Smithand N. B. Shustova, Dalton Trans., 2016, 45, 9884–9891.
29 G. J. Huang, J. H. Ho, C. Prabhakar, Y. H. Liu, S. M. Pengand J. S. Yang, Org. Lett., 2012, 14, 5034–5037.
30 P. T. Chou, M. L. Martinez and J. H. Clements, J. Phys.Chem., 1993, 97, 2618–2622.
31 C. C. Hsieh, C. M. Jiang and P. T. Chou, Acc. Chem. Res.,2010, 43, 1364–1374.
32 P. K. Mandal and A. Samanta, J. Phys. Chem. A, 2003, 107,6334–6339.
33 S. Jana, S. Dalapati and N. Guchhait, J. Phys. Chem. A, 2013,117, 4367–4376.
34 J. Dong, K. M. Solntsev, O. Poizat and L. M. Tolbert, J. Am.Chem. Soc., 2007, 129, 10084–10085.
35 K. M. Solntsev, O. Poizat, J. Dong, J. Rehault, Y. Lou,C. Burda and L. M. Tolbert, J. Phys. Chem. B, 2008, 112,2700–2711.
36 J. S. Yang, G. J. Huang, Y. H. Liu and S. M. Peng, Chem.Commun., 2008, 1344–1346.
Paper PCCP
Ope
n A
cces
s A
rtic
le. P
ublis
hed
on 0
5 A
ugus
t 201
6. D
ownl
oade
d on
2/1
8/20
22 8
:34:
35 A
M.
Thi
s ar
ticle
is li
cens
ed u
nder
a C
reat
ive
Com
mon
s A
ttrib
utio
n-N
onC
omm
erci
al 3
.0 U
npor
ted
Lic
ence
.View Article Online

24342 | Phys. Chem. Chem. Phys., 2016, 18, 24332--24342 This journal is© the Owner Societies 2016
37 F. D. Lewis, S. R. Kalgutkar and J. S. Yang, J. Am. Chem. Soc.,1999, 121, 12045–12053.
38 H. K. Sinha and K. Yates, J. Am. Chem. Soc., 1991, 113,6062–6067.
39 H. E. Zimmerman, J. Am. Chem. Soc., 1995, 117, 8988–8991.40 H. E. Zimmerman, J. Phys. Chem. A, 1998, 102, 5616.41 T. Chatterjee, M. Mandal, A. Das, K. Bhattacharyya, A. Dutta
and P. K. Mandal, J. Phys. Chem. B, 2016, 120, 3503–3510.42 J. S. Lee, A. Baldridge, S. Feng, Y. SiQiang, Y. K. Kim, L. M.
Tolbert and Y. T. Chang, ACS Comb. Sci., 2011, 13, 32–38.43 P. J. Langley, J. Hulliger, R. Thaimattamb and G. R. Desiraju,
New J. Chem., 1998, 1307–1309.44 L. R. Snyder, J. Chromatogr., 1974, 92, 223–230.45 N. J. Turro, V. Ramamurthy and J. C. Scaiano, Modern
molecular photochemistry of organic molecules, UniversityScience Books, Sausalito, CA, 2010.
46 J. V. Caspar and T. J. Meyer, J. Phys. Chem., 1983, 87,952–957.
47 H. E. Zimmerman, J. Phys. Chem. A, 1998, 102, 5616–5621.
48 J. Dong, K. M. Solntsev and L. M. Tolbert, J. Am. Chem. Soc.,2006, 128, 12038–12039.
49 V. Bonacic-Koutecky, J. Kohler and J. Michl, Chem. Phys.Lett., 1984, 104, 440–443.
50 V. Bonacic-Koutecky and J. Michl, J. Am. Chem. Soc., 1985,107, 1765–1766.
51 C. W. Cheng, G. J. Huang, H. Y. Hsu, C. Prabhakar, Y. P. Lee,E. W. G. Diau and J. S. Yang, J. Phys. Chem. B, 2013, 117,2705–2716.
52 E. M. Crompton and F. D. Lewis, Photochem. Photobiol. Sci.,2004, 3, 660–668.
53 G. Cui, Z. Lan and W. Thiel, J. Am. Chem. Soc., 2012, 134,1662–1672.
54 C. C. Hsieh, P. T. Chou, C. W. Shih, W. T. Chuang, M. W. Chung,J. Lee and T. Joo, J. Am. Chem. Soc., 2011, 133, 2932–2943.
55 Y. J. Ai, R. Z. Liao, W. H. Fang and Y. Luo, Phys. Chem.Chem. Phys., 2012, 14, 13409–13414.
56 A. P. Demchenko, K. C. Tang and P. T. Chou, Chem. Soc.Rev., 2013, 42, 1379–1408.
PCCP Paper
Ope
n A
cces
s A
rtic
le. P
ublis
hed
on 0
5 A
ugus
t 201
6. D
ownl
oade
d on
2/1
8/20
22 8
:34:
35 A
M.
Thi
s ar
ticle
is li
cens
ed u
nder
a C
reat
ive
Com
mon
s A
ttrib
utio
n-N
onC
omm
erci
al 3
.0 U
npor
ted
Lic
ence
.View Article Online