Solutions for weight management from DuPont Nutrition and Health
40
1 Solutions for weight management From DuPont Nutrition & Health by Garry J Mendelson, Applied Nutrition Science Manager EMEA NUCE, Bologna March 17-18, 2016
-
Upload
dupont-food -
Category
Food
-
view
1.073 -
download
1
Transcript of Solutions for weight management from DuPont Nutrition and Health

1
Solutions for weight management From DuPont Nutrition & Health by Garry J Mendelson, Applied Nutrition Science Manager EMEA NUCE, Bologna March 17-18, 2016
Text starts with no bullet
Click once on
’Increase Indent’ for bullet
and click max. three times
for more bulletdesign
To get previous design back,
click on ’Decrease Indent’
Change Date and insert
Presentation Title under
>Insert >Header and Footer
and write in Fixed Date field
and field ‘Footer’ >Apply to All
Deactivate by clicking
off the checkboxes
Outline
Weight management
Role of protein
Lean, high quality soy protein
Satiety
Body Composition
Additional health benefits
Role of dietary fibre in satiety
Conclusions
2

Source: www.cdc.gov/nccdphp/dnpa/obesity/index.htm
Weight Management an ongoing process balancing
energy (caloric) intake to energy utilisation in order to
control the rate of accumulation or loss of body fat. It
does not specifically target weight loss or dieting, but
rather maintenance of healthy weight
Overweight and Obesity indicate a weight that is greater
than that which is generally considered healthy for a
given height, and which may increase the likelihood of
certain diseases and health problems
Body mass index (BMI) is an index of weight-for-height
(kg/m2), commonly used to classify overweight and
obesity in adult populations and individuals.
Healthy weight is characterised as a BMI between 18.5 and 24.9
Overweight is characterised as a BMI equal to or more than 25 and 29.9
Obesity is characterised as a BMI equal to or more than 30
Weight Management – What do we mean?
3
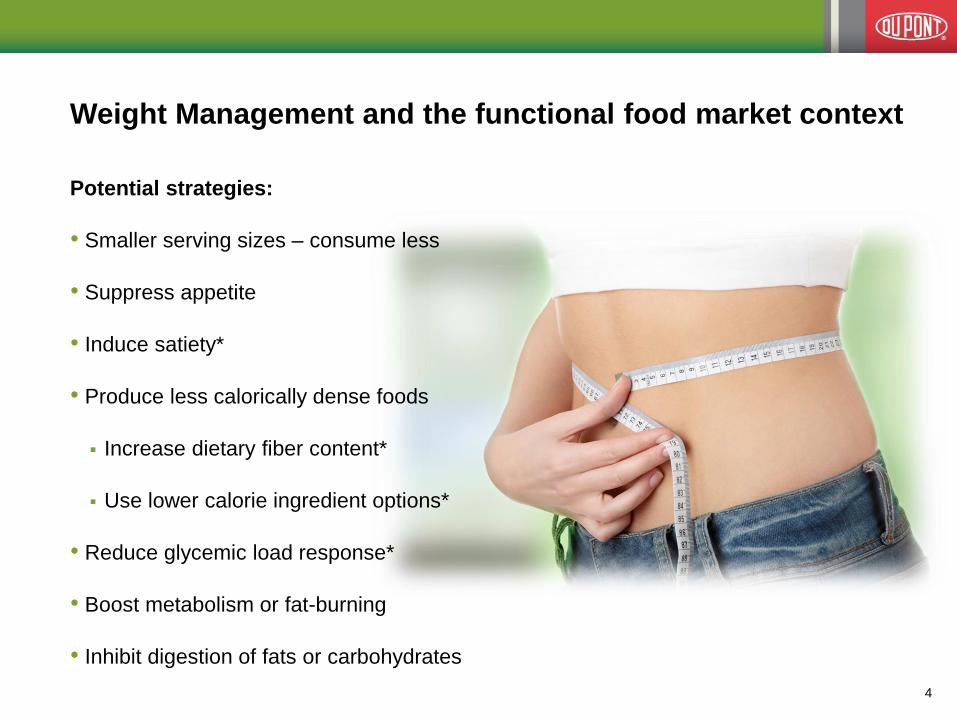
Potential strategies:
• Smaller serving sizes – consume less
• Suppress appetite
• Induce satiety*
• Produce less calorically dense foods
Increase dietary fiber content*
Use lower calorie ingredient options*
• Reduce glycemic load response*
• Boost metabolism or fat-burning
• Inhibit digestion of fats or carbohydrates
Weight Management and the functional food market context
4

Hunger and Energy Intake
Reducing Hunger and
Energy Intake have
become one of the main
goals in the strategy to
control body weight gain.
5
Copyright © 2015 DuPont N&H. All rights reserved.
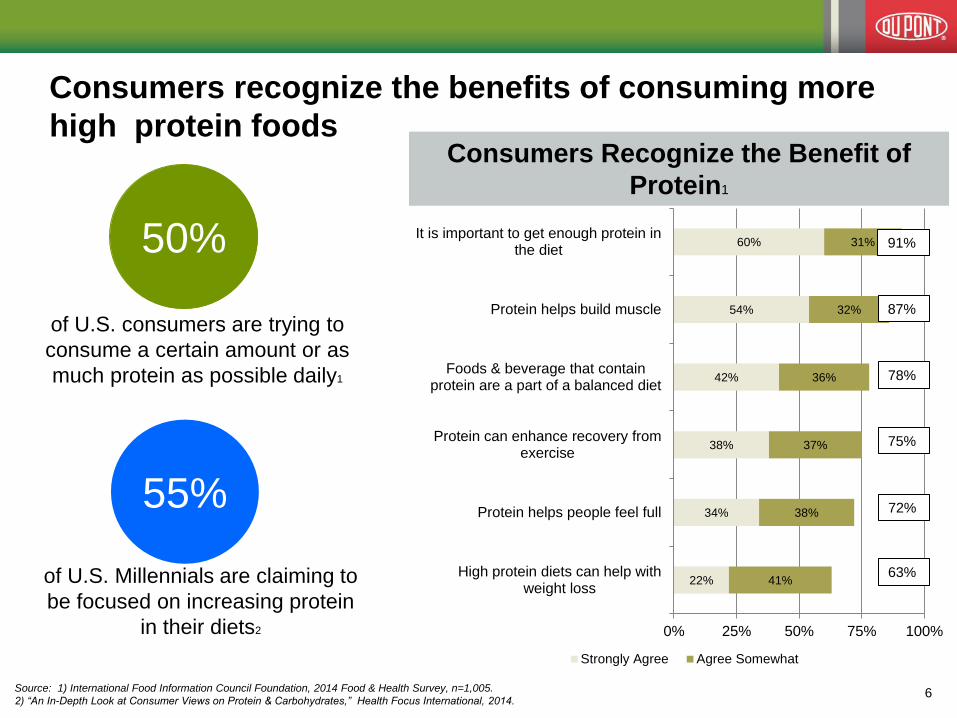
Consumers recognize the benefits of consuming more
high protein foods
22%
34%
38%
42%
54%
60%
41%
38%
37%
36%
32%
31%
0% 25% 50% 75% 100%
High protein diets can help withweight loss
Protein helps people feel full
Protein can enhance recovery fromexercise
Foods & beverage that containprotein are a part of a balanced diet
Protein helps build muscle
It is important to get enough protein inthe diet
Strongly Agree Agree Somewhat
50%
55%
of U.S. consumers are trying to
consume a certain amount or as
much protein as possible daily1
of U.S. Millennials are claiming to
be focused on increasing protein
in their diets2
91%
87%
78%
75%
72%
63%
Consumers Recognize the Benefit of
Protein1
Source: 1) International Food Information Council Foundation, 2014 Food & Health Survey, n=1,005.
2) “An In-Depth Look at Consumer Views on Protein & Carbohydrates,” Health Focus International, 2014. 6
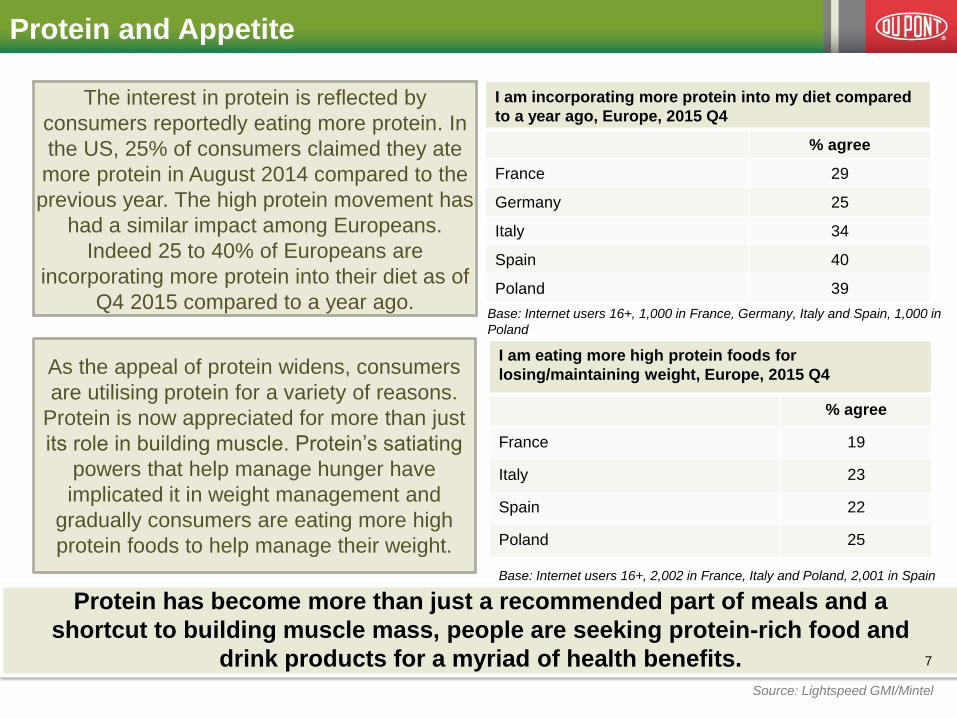
Protein and Appetite
The interest in protein is reflected by
consumers reportedly eating more protein. In
the US, 25% of consumers claimed they ate
more protein in August 2014 compared to the
previous year. The high protein movement has
had a similar impact among Europeans.
Indeed 25 to 40% of Europeans are
incorporating more protein into their diet as of
Q4 2015 compared to a year ago.
Source: Lightspeed GMI/Mintel
As the appeal of protein widens, consumers
are utilising protein for a variety of reasons.
Protein is now appreciated for more than just
its role in building muscle. Protein’s satiating
powers that help manage hunger have
implicated it in weight management and
gradually consumers are eating more high
protein foods to help manage their weight.
I am incorporating more protein into my diet compared
to a year ago, Europe, 2015 Q4
% agree
France 29
Germany 25
Italy 34
Spain 40
Poland 39
I am eating more high protein foods for
losing/maintaining weight, Europe, 2015 Q4
% agree
France 19
Italy 23
Spain 22
Poland 25
Base: Internet users 16+, 1,000 in France, Germany, Italy and Spain, 1,000 in
Poland
Base: Internet users 16+, 2,002 in France, Italy and Poland, 2,001 in Spain
Protein has become more than just a recommended part of meals and a
shortcut to building muscle mass, people are seeking protein-rich food and
drink products for a myriad of health benefits. 7
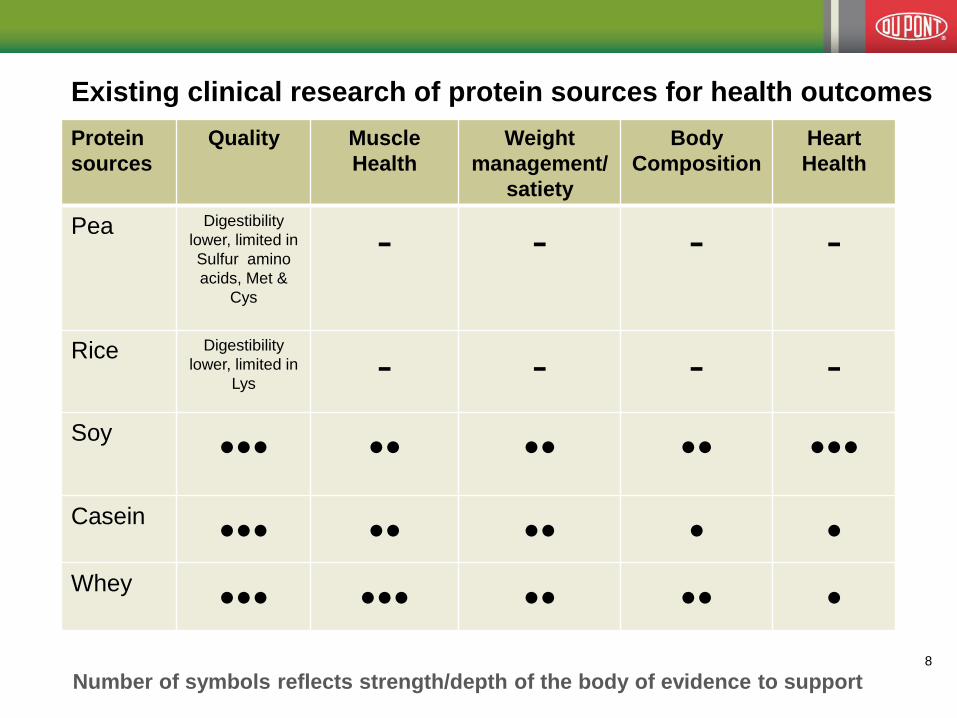
Existing clinical research of protein sources for health outcomes
Protein
sources
Quality Muscle
Health
Weight
management/
satiety
Body
Composition
Heart
Health
Pea Digestibility
lower, limited in
Sulfur amino
acids, Met &
Cys
- - -
-
Rice Digestibility
lower, limited in
Lys - - - -
Soy ••• •• •• •• •••
Casein ••• •• •• • •
Whey ••• ••• •• •• •
Number of symbols reflects strength/depth of the body of evidence to support 8

Text starts with no bullet
Click once on
’Increase Indent’ for bullet
and click max. three times
for more bulletdesign
To get previous design back,
click on ’Decrease Indent’
Change Date and insert
Presentation Title under
>Insert >Header and Footer
and write in Fixed Date field
and field ‘Footer’ >Apply to All
Deactivate by clicking
off the checkboxes
Protein Quality of commonly consumed
proteins
SUPRO Isolated Soy Protein
PDCAAS is the globally
recognized method for
determining protein quality
based on amino acid profile
and digestibility
(ISP)
Soy is a High Quality Protein - PDCAAS (Protein
Digestibility-Corrected Amino Acid Score)
PDCAAS = 1.00
Comparable to milk
& egg protein
Can be consumed
throughout the life
cycle
The only complete
vegetable protein
widely available
Isolated soy protein
is low in fat,
saturated fat,
cholesterol-free
and lactose-free
9

Text starts with no bullet
Click once on
’Increase Indent’ for bullet
and click max. three times
for more bulletdesign
To get previous design back,
click on ’Decrease Indent’
Change Date and insert
Presentation Title under
>Insert >Header and Footer
and write in Fixed Date field
and field ‘Footer’ >Apply to All
Deactivate by clicking
off the checkboxes
Across the lifespan, soy protein is a high quality protein
that can play a role in:
Child Nutrition
• healthy growth and development, tool against childhood obesity, early start
to a healthy heart, and a high quality alternative to dairy protein
Weight Management
• soy protein helps improve body composition and induces satiety
Muscle Health
• soy protein enhances muscle synthesis and promotes muscle growth
Healthy Aging
• soy protein supports heart health by improving risk factors associated with
CVD, such as circulating cholesterol
• may improve muscle health and body composition & function
SUPRO® Soy protein part of DuPont™ Danisco® ingredient range is a
high quality protein 10

Text starts with no bullet
Click once on
’Increase Indent’ for bullet
and click max. three times
for more bulletdesign
To get previous design back,
click on ’Decrease Indent’
Change Date and insert
Presentation Title under
>Insert >Header and Footer
and write in Fixed Date field
and field ‘Footer’ >Apply to All
Deactivate by clicking
off the checkboxes
Supporting Healthy Growth & Development
Preventing unhealthy weight gain during childhood & throughout adolescence may represent
most desirable approach to preventing an increase in or reducing obesity prevalence.
• Children who are obese have a higher likelihood of becoming obese adults1.
• High BMI may also have immediate consequences in children, including early onset of risk
factors of disease, such as elevated lipid concentrations and blood pressure2. 1. Wake, M., et al., Int J Obes, 2013. 37(1): p. 86-93.
2. Freedman, D., et al., J Pediatrics, 2007. 150(1): p. 12-17.
Protein is a critical nutrient for healthy
Start early for a Consumption of
protein can impact
Soy protein is a high-quality, plant-based protein
Meets the protein & amino acid needs of children age 3+
Soy protein can be an effective tool in
establishing healthier eating habits
Soy protein may help children manage a
healthy body weight
Soy protein
11
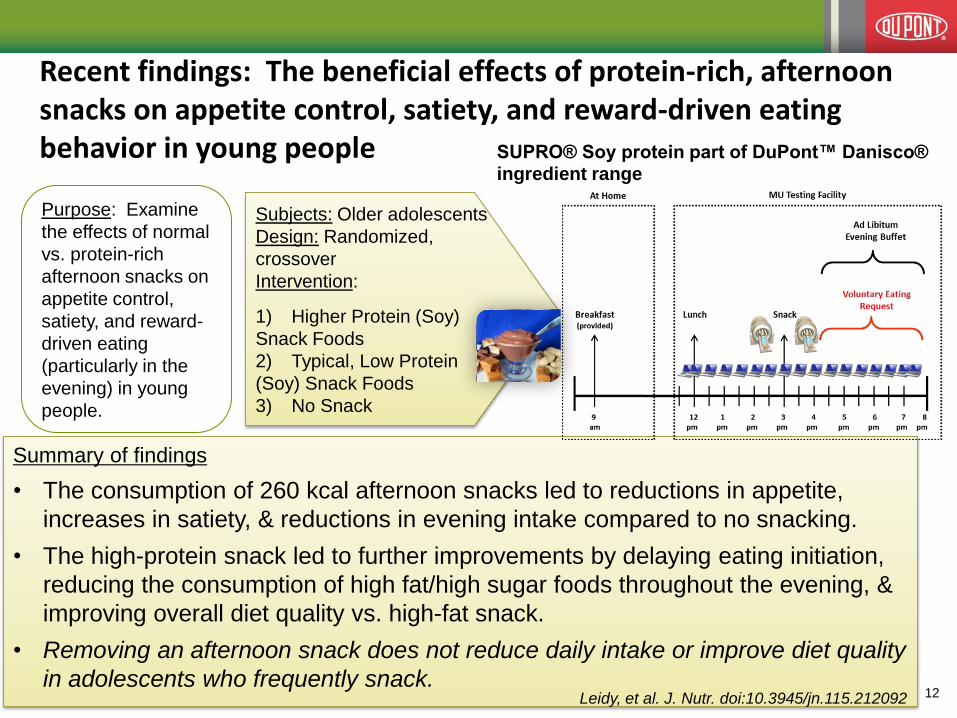
Summary of findings
• The consumption of 260 kcal afternoon snacks led to reductions in appetite,
increases in satiety, & reductions in evening intake compared to no snacking.
• The high-protein snack led to further improvements by delaying eating initiation,
reducing the consumption of high fat/high sugar foods throughout the evening, &
improving overall diet quality vs. high-fat snack.
• Removing an afternoon snack does not reduce daily intake or improve diet quality
in adolescents who frequently snack.
SUPRO® Soy protein part of DuPont™ Danisco® ingredient range
Recent findings: The beneficial effects of protein-rich, afternoon snacks on appetite control, satiety, and reward-driven eating behavior in young people
Subjects: Older adolescents
Design: Randomized,
crossover
Intervention:
1) Higher Protein (Soy)
Snack Foods
2) Typical, Low Protein
(Soy) Snack Foods
3) No Snack
Purpose: Examine
the effects of normal
vs. protein-rich
afternoon snacks on
appetite control,
satiety, and reward-
driven eating
(particularly in the
evening) in young
people.
Leidy, et al. J. Nutr. doi:10.3945/jn.115.212092 12

Randomized Crossover Study
• 31 healthy adolescents (age: 17 ± 1; BMI: 22.5 ± 0.5 kg/m2)
• 3 Snack scenarios tested (high fat, high protein, no snack)
Perceived Appetite Responses Eating Initiation
Leidy et al, J Nutr, 2015, 13
Copyright © 2015 DuPont N&H. All rights reserved.
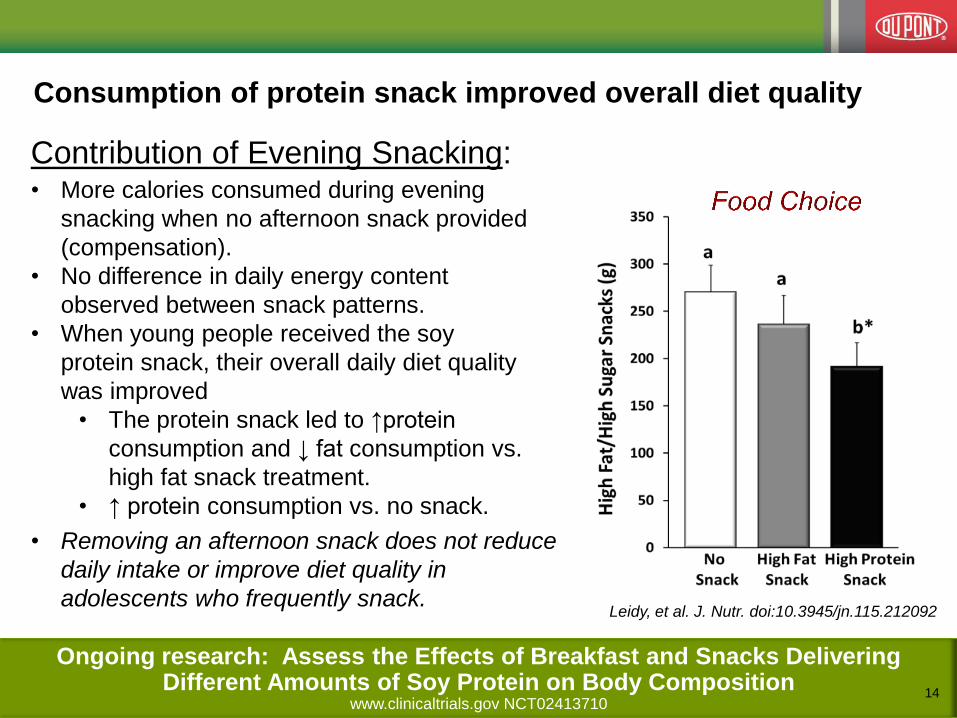
Contribution of Evening Snacking: • More calories consumed during evening
snacking when no afternoon snack provided
(compensation).
• No difference in daily energy content
observed between snack patterns.
• When young people received the soy
protein snack, their overall daily diet quality
was improved
• The protein snack led to ↑protein
consumption and ↓ fat consumption vs.
high fat snack treatment.
• ↑ protein consumption vs. no snack.
• Removing an afternoon snack does not reduce
daily intake or improve diet quality in
adolescents who frequently snack. Leidy, et al. J. Nutr. doi:10.3945/jn.115.212092
Consumption of protein snack improved overall diet quality
Ongoing research: Assess the Effects of Breakfast and Snacks Delivering Different Amounts of Soy Protein on Body Composition
www.clinicaltrials.gov NCT02413710 14

Text starts with no bullet
Click once on
’Increase Indent’ for bullet
and click max. three times
for more bulletdesign
To get previous design back,
click on ’Decrease Indent’
Change Date and insert
Presentation Title under
>Insert >Header and Footer
and write in Fixed Date field
and field ‘Footer’ >Apply to All
Deactivate by clicking
off the checkboxes
Pilot study testing effect of adding modest quantities of soy
protein and/or soy fiber
500
600
700
800
900
Control Bar Protein Bar Fiber Bar Protein and
Fiber Bar
En
erg
y (
kcal)
1000 -43 kcal
Tested individually or in combination
in comparison with a carb control
snack bar on measures of satiety
and ad libitum energy intakes
following consumption.
All groups showed similar effects on overall appetite scores;
no significant differences between groups
Protein bar resulted in the lowest kcal consumption. Results
did not reach statistical significance
Cope MB, Jenkins A, Mukherjea R, Krul E, Hughes G, Pawlik K, Campbell J, and Wolever T
A Pilot Study: Soy protein may help decrease energy intake when consumed prior to meal . FASEB J March 29, 2012 26:819.16
15
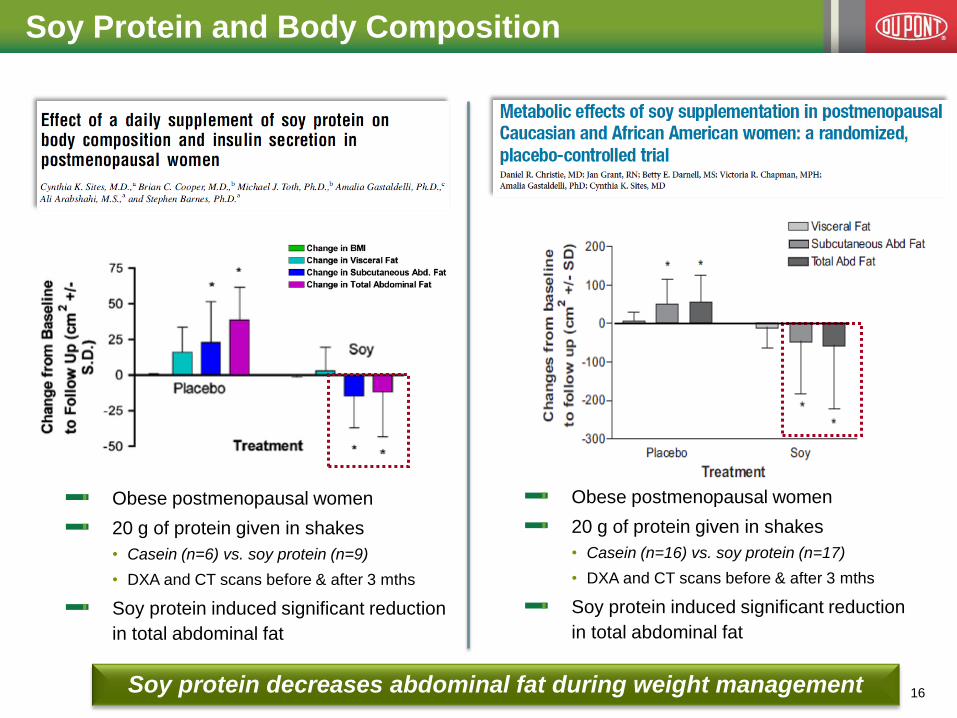
Soy Protein and Body Composition
Obese postmenopausal women
20 g of protein given in shakes
• Casein (n=6) vs. soy protein (n=9)
• DXA and CT scans before & after 3 mths
Soy protein induced significant reduction
in total abdominal fat
Obese postmenopausal women
20 g of protein given in shakes
• Casein (n=16) vs. soy protein (n=17)
• DXA and CT scans before & after 3 mths
Soy protein induced significant reduction
in total abdominal fat
Soy protein decreases abdominal fat during weight management 16
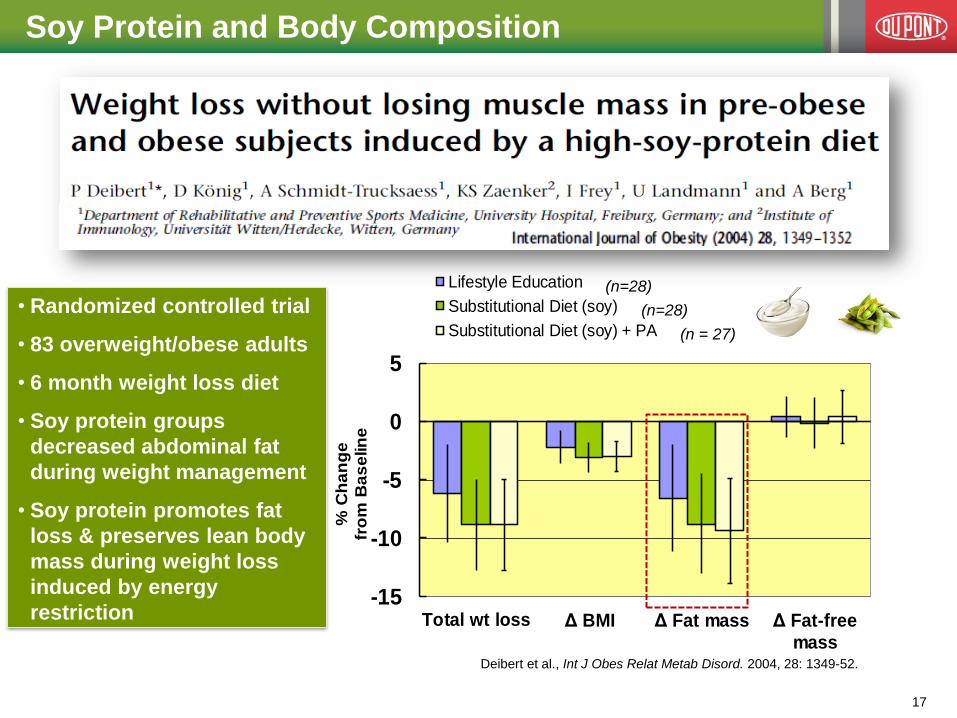
-15
-10
-5
0
5
Total wt loss Δ BMI Δ Fat mass Δ Fat-free
mass
% C
ha
ng
e
fro
m B
as
elin
e
Lifestyle Education
Substitutional Diet (soy)
Substitutional Diet (soy) + PA
Soy Protein and Body Composition
• Randomized controlled trial
• 83 overweight/obese adults
• 6 month weight loss diet
• Soy protein groups
decreased abdominal fat
during weight management
• Soy protein promotes fat
loss & preserves lean body
mass during weight loss
induced by energy
restriction
Deibert et al., Int J Obes Relat Metab Disord. 2004, 28: 1349-52.
(n=28)
(n=28)
(n = 27)
17
Text starts with no bullet
Click once on
’Increase Indent’ for bullet
and click max. three times
for more bulletdesign
To get previous design back,
click on ’Decrease Indent’
Change Date and insert
Presentation Title under
>Insert >Header and Footer
and write in Fixed Date field
and field ‘Footer’ >Apply to All
Deactivate by clicking
off the checkboxes
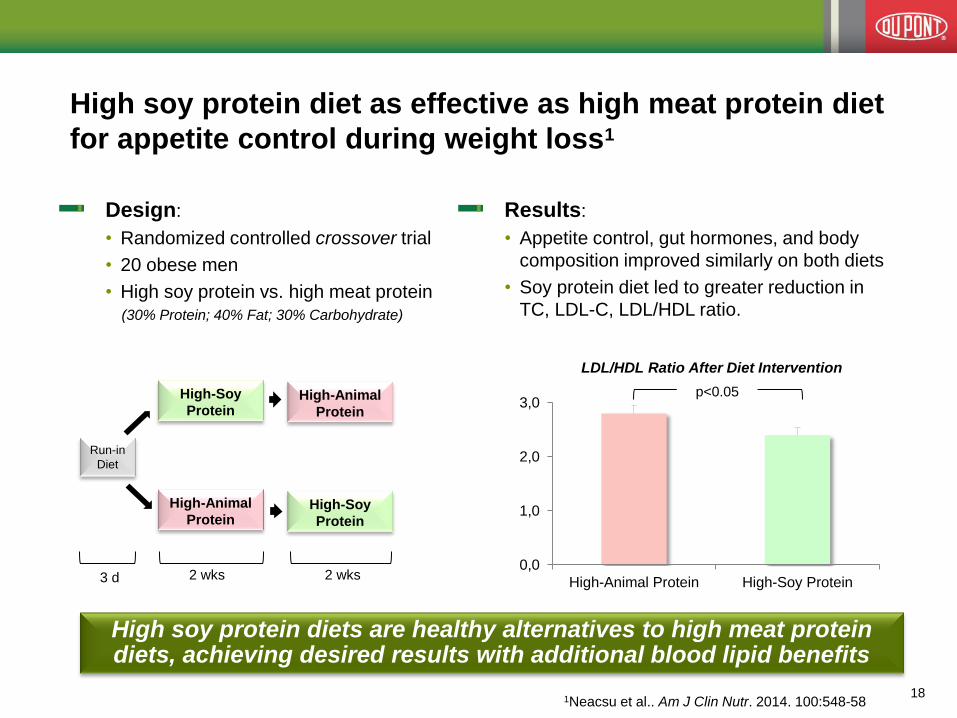
High soy protein diet as effective as high meat protein diet
for appetite control during weight loss1
1Neacsu et al.. Am J Clin Nutr. 2014. 100:548-58
Design:
• Randomized controlled crossover trial
• 20 obese men
• High soy protein vs. high meat protein
(30% Protein; 40% Fat; 30% Carbohydrate)
Results:
• Appetite control, gut hormones, and body
composition improved similarly on both diets
• Soy protein diet led to greater reduction in
TC, LDL-C, LDL/HDL ratio.
Run-in
Diet
High-Soy
Protein
High-Animal
Protein
High-Animal
Protein
High-Soy
Protein
3 d 2 wks 2 wks
High soy protein diets are healthy alternatives to high meat protein diets, achieving desired results with additional blood lipid benefits
0,0
1,0
2,0
3,0
High-Animal Protein High-Soy Protein
LDL/HDL Ratio After Diet Intervention
p<0.05
18

Text starts with no bullet
Click once on
’Increase Indent’ for bullet
and click max. three times
for more bulletdesign
To get previous design back,
click on ’Decrease Indent’
Change Date and insert
Presentation Title under
>Insert >Header and Footer
and write in Fixed Date field
and field ‘Footer’ >Apply to All
Deactivate by clicking
off the checkboxes
Design:
• Randomized controlled crossover trial
• 15 postmenopausal women with abdominal
obesity
• Weight loss diets:
• 30 g/d soy protein in place of animal protein
Run-in
Diet
High-Soy
Protein
High-Animal
Protein
High-Animal
Protein
High-Soy
Protein
1 wk 4 wks
Washout period
4 wks 4 wks
Washout period
1Van Nielen et al.. J Nutr. 2014. 114. 193706.
Results:
• Both diets lowered body weight
• Compared with animal protein diet; soy protein:
• ↓ TC, LDL-C
• ↓ CRP
• ↑ insulin sensitivity (independent of body weight)
Partly replacing meat protein with soy protein improves
insulin sensitivity and blood lipids1
Replacing meat protein with soy protein could help support blood glucose management and improve cardiovascular health
19
Copyright © 2015 DuPont N&H. All rights reserved.
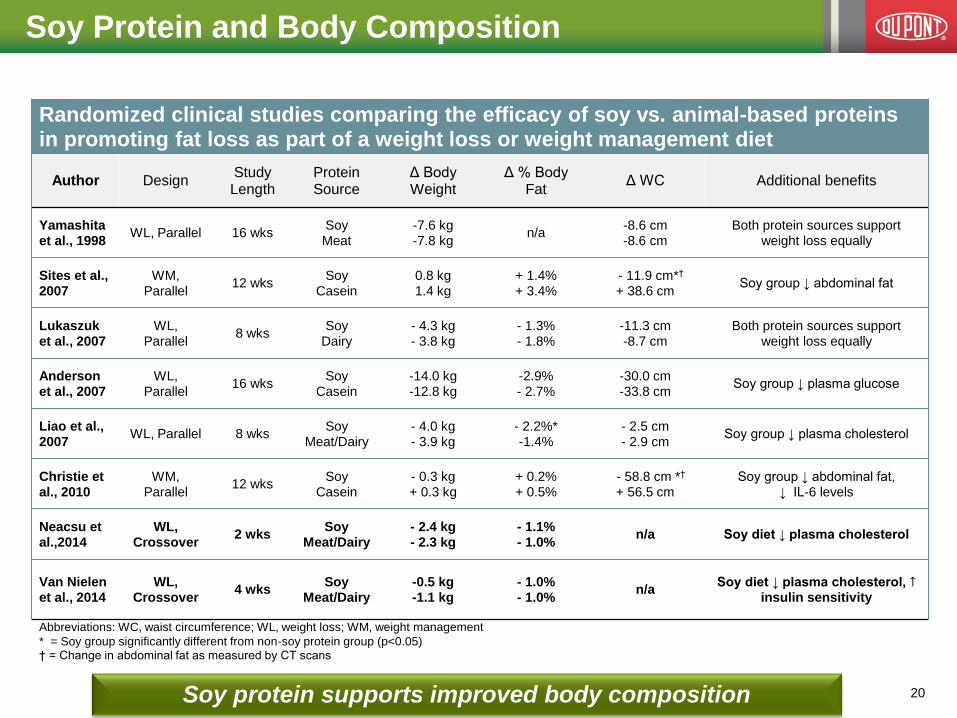
Randomized clinical studies comparing the efficacy of soy vs. animal-based proteins in promoting fat loss as part of a weight loss or weight management diet
Author Design Study Length
Protein Source
Δ Body Weight
Δ % Body Fat
Δ WC Additional benefits
Yamashita et al., 1998
WL, Parallel 16 wks Soy Meat
-7.6 kg -7.8 kg
n/a -8.6 cm -8.6 cm
Both protein sources support weight loss equally
Sites et al., 2007
WM, Parallel
12 wks Soy
Casein
0.8 kg 1.4 kg
+ 1.4% + 3.4%
- 11.9 cm*† + 38.6 cm
Soy group ↓ abdominal fat
Lukaszuk et al., 2007
WL, Parallel
8 wks Soy
Dairy
- 4.3 kg - 3.8 kg
- 1.3% - 1.8%
-11.3 cm -8.7 cm
Both protein sources support weight loss equally
Anderson et al., 2007
WL, Parallel
16 wks Soy
Casein
-14.0 kg -12.8 kg
-2.9% - 2.7%
-30.0 cm -33.8 cm
Soy group ↓ plasma glucose
Liao et al., 2007
WL, Parallel 8 wks Soy
Meat/Dairy
- 4.0 kg - 3.9 kg
- 2.2%* -1.4%
- 2.5 cm - 2.9 cm
Soy group ↓ plasma cholesterol
Christie et al., 2010
WM, Parallel
12 wks Soy
Casein
- 0.3 kg + 0.3 kg
+ 0.2% + 0.5%
- 58.8 cm *† + 56.5 cm
Soy group ↓ abdominal fat, ↓ IL-6 levels
Neacsu et al.,2014
WL, Crossover
2 wks Soy
Meat/Dairy
- 2.4 kg - 2.3 kg
- 1.1% - 1.0%
n/a Soy diet ↓ plasma cholesterol
Van Nielen et al., 2014
WL, Crossover
4 wks Soy
Meat/Dairy
-0.5 kg -1.1 kg
- 1.0% - 1.0%
n/a Soy diet ↓ plasma cholesterol, ↑
insulin sensitivity
Abbreviations: WC, waist circumference; WL, weight loss; WM, weight management
* = Soy group significantly different from non-soy protein group (p<0.05) † = Change in abdominal fat as measured by CT scans
Soy Protein and Body Composition
Soy protein supports improved body composition 20
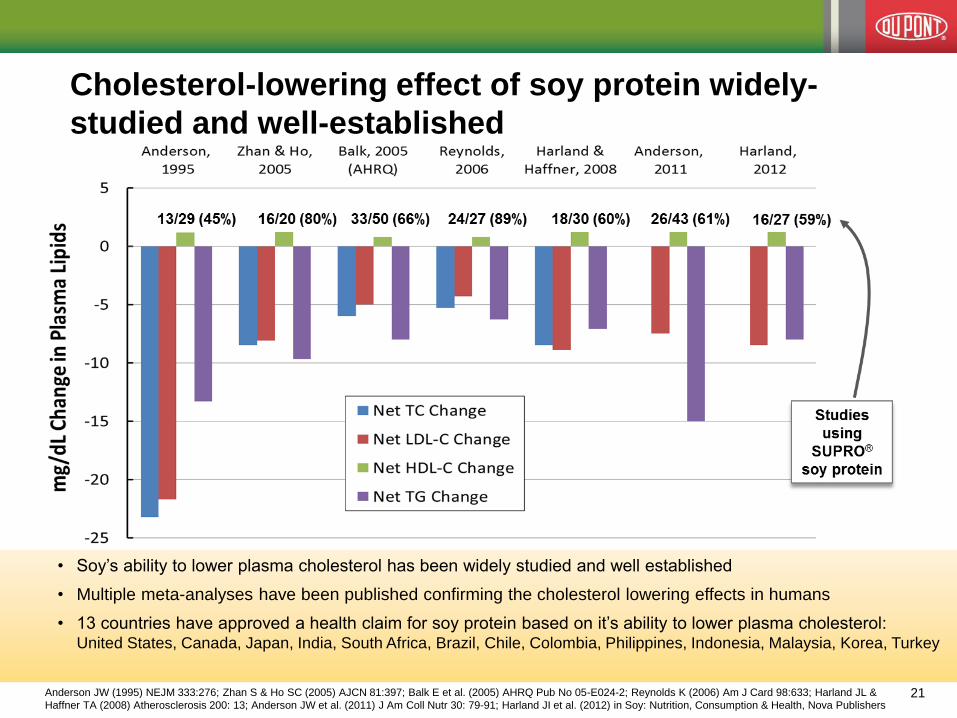
Copyright © 2015 DuPont N&H. All rights reserved. Anderson JW (1995) NEJM 333:276; Zhan S & Ho SC (2005) AJCN 81:397; Balk E et al. (2005) AHRQ Pub No 05-E024-2; Reynolds K (2006) Am J Card 98:633; Harland JL &
Haffner TA (2008) Atherosclerosis 200: 13; Anderson JW et al. (2011) J Am Coll Nutr 30: 79-91; Harland JI et al. (2012) in Soy: Nutrition, Consumption & Health, Nova Publishers
• Soy’s ability to lower plasma cholesterol has been widely studied and well established
• Multiple meta-analyses have been published confirming the cholesterol lowering effects in humans
• 13 countries have approved a health claim for soy protein based on it’s ability to lower plasma cholesterol: United States, Canada, Japan, India, South Africa, Brazil, Chile, Colombia, Philippines, Indonesia, Malaysia, Korea, Turkey
Cholesterol-lowering effect of soy protein widely-
studied and well-established
21
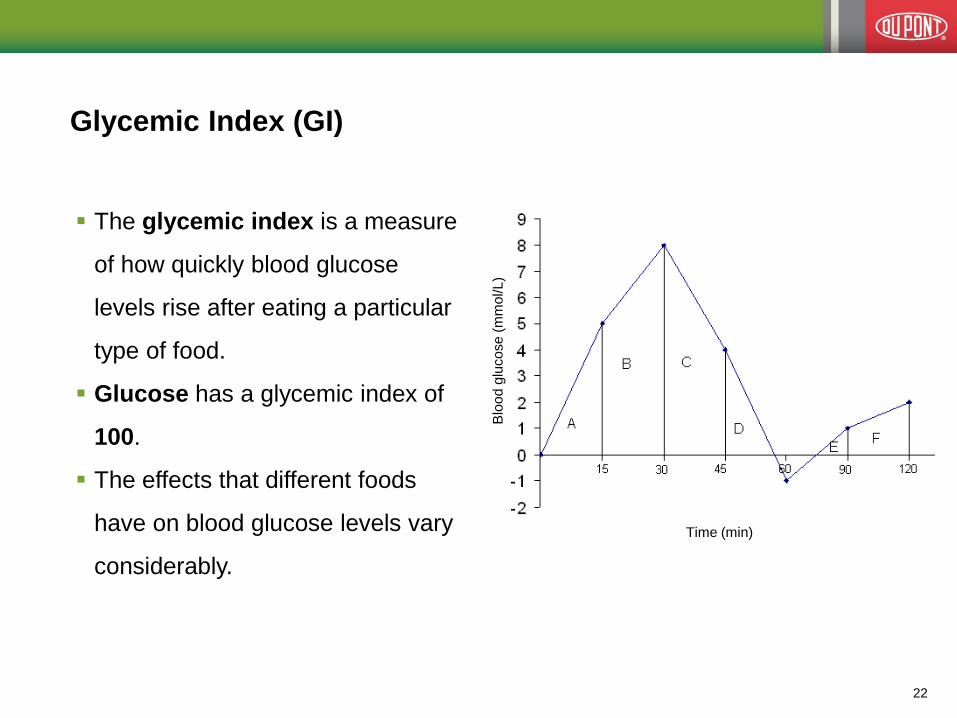
Glycemic Index (GI)
The glycemic index is a measure
of how quickly blood glucose
levels rise after eating a particular
type of food.
Glucose has a glycemic index of
100.
The effects that different foods
have on blood glucose levels vary
considerably.
Blo
od
glu
co
se
(m
mo
l/L
)
Time (min)
22
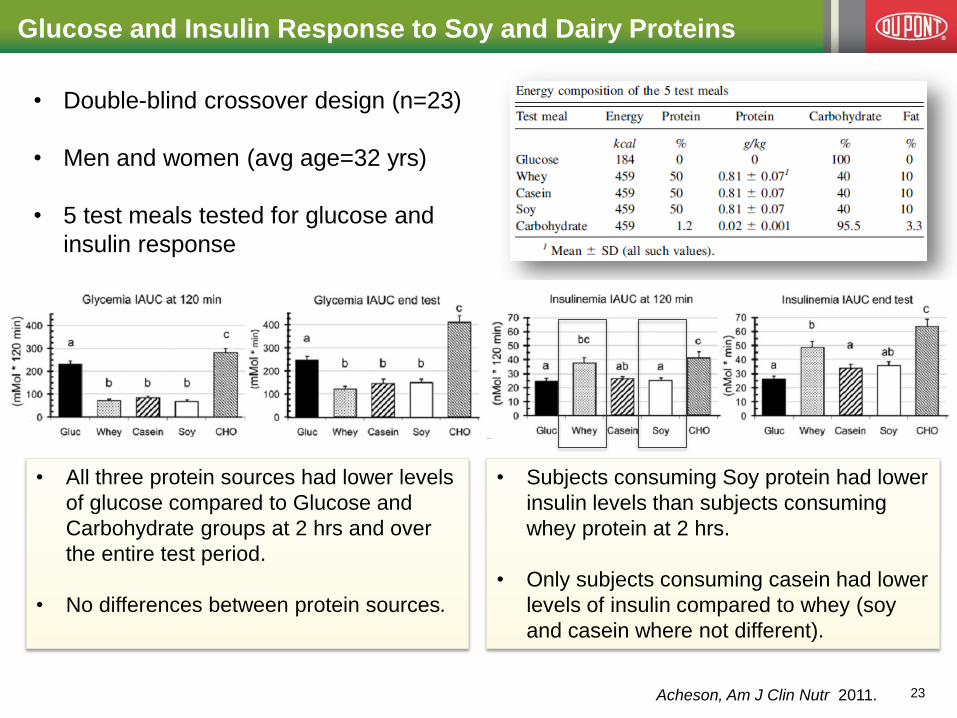
Acheson, Am J Clin Nutr 2011.
• All three protein sources had lower levels
of glucose compared to Glucose and
Carbohydrate groups at 2 hrs and over
the entire test period.
• No differences between protein sources.
• Subjects consuming Soy protein had lower
insulin levels than subjects consuming
whey protein at 2 hrs.
• Only subjects consuming casein had lower
levels of insulin compared to whey (soy
and casein where not different).
• Double-blind crossover design (n=23)
• Men and women (avg age=32 yrs)
• 5 test meals tested for glucose and
insulin response
Glucose and Insulin Response to Soy and Dairy Proteins
23

Blood glucose response to low GI soy containing meal
replacement, compared to high GI standard breakfast
Eleven male overweight or obese
subjects 52 to 63 y old consumed a
400 kcal test breakfast consisting of
High GI/low protein standard
breakfast
Low GI/High soy protein meal
replacement
In the first 2 h after breakfast, glucose
levels were significantly lower after
the intake of the meal replacement at
most time points.
After lunch, glucose concentrations
increased comparably during the first
postprandial hour but were
significantly lower at 330 and 360 min
König D, et al, Nutrition, 2012, (38) 35–39
Meals consumed
24

Adding soy protein reduces the glycemic index of foods
Low GI ≤55
Medium GI 56-69
High GI 70-100
Product Glycemic
Index
Protein
(g)
Fiber
(g)
Rice Crisp Bar 97 2 < 1
Soy Protein Crisp Bar 57 22 <1
Unpublished Internal Data
food 1 hr 2 hrs
Area Under the Curve Glycemic Index (GI):
A value given to a food based on its ability to
raise blood glucose defined as the area under
the curve after consumption of a test food
containing 50g of carbohydrate divided by the
area under the curve for a 50g carbohydrate
standard (white bread or glucose)
Soy Protein and Glycemic Index
25

Dietary fibers for Weight Management
Enhancing satiety and reducing energy intake with fiber
26
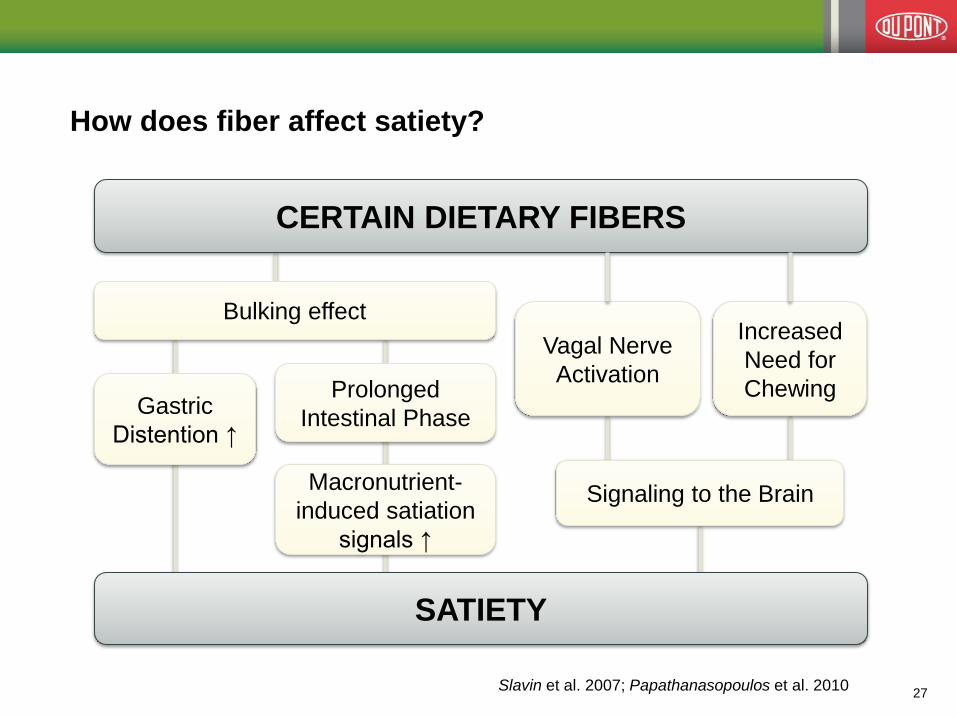
How does fiber affect satiety?
CERTAIN DIETARY FIBERS
SATIETY
Bulking effect
Gastric
Distention ↑
Prolonged
Intestinal Phase
Macronutrient-
induced satiation
signals ↑
Slavin et al. 2007; Papathanasopoulos et al. 2010
Vagal Nerve
Activation
Signaling to the Brain
Increased
Need for
Chewing
27
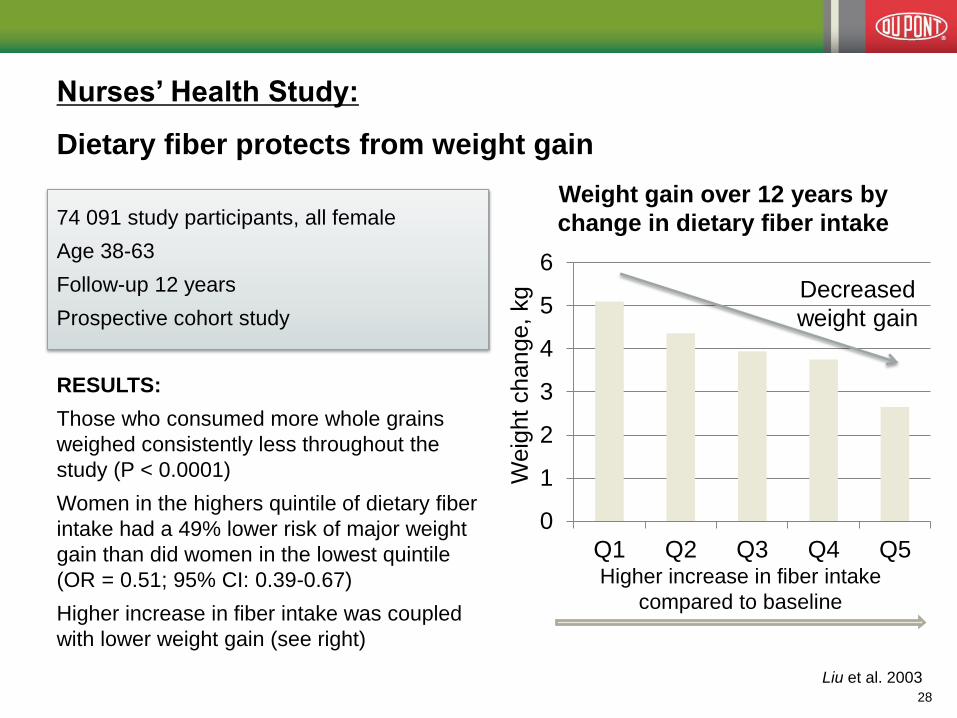
Nurses’ Health Study:
Dietary fiber protects from weight gain
74 091 study participants, all female
Age 38-63
Follow-up 12 years
Prospective cohort study
RESULTS:
Those who consumed more whole grains
weighed consistently less throughout the
study (P < 0.0001)
Women in the highers quintile of dietary fiber
intake had a 49% lower risk of major weight
gain than did women in the lowest quintile
(OR = 0.51; 95% CI: 0.39-0.67)
Higher increase in fiber intake was coupled
with lower weight gain (see right)
Liu et al. 2003
0
1
2
3
4
5
6
Q1 Q2 Q3 Q4 Q5
Weight gain over 12 years by
change in dietary fiber intake
Weig
ht
change,
kg
Higher increase in fiber intake
compared to baseline
Decreased
weight gain
28
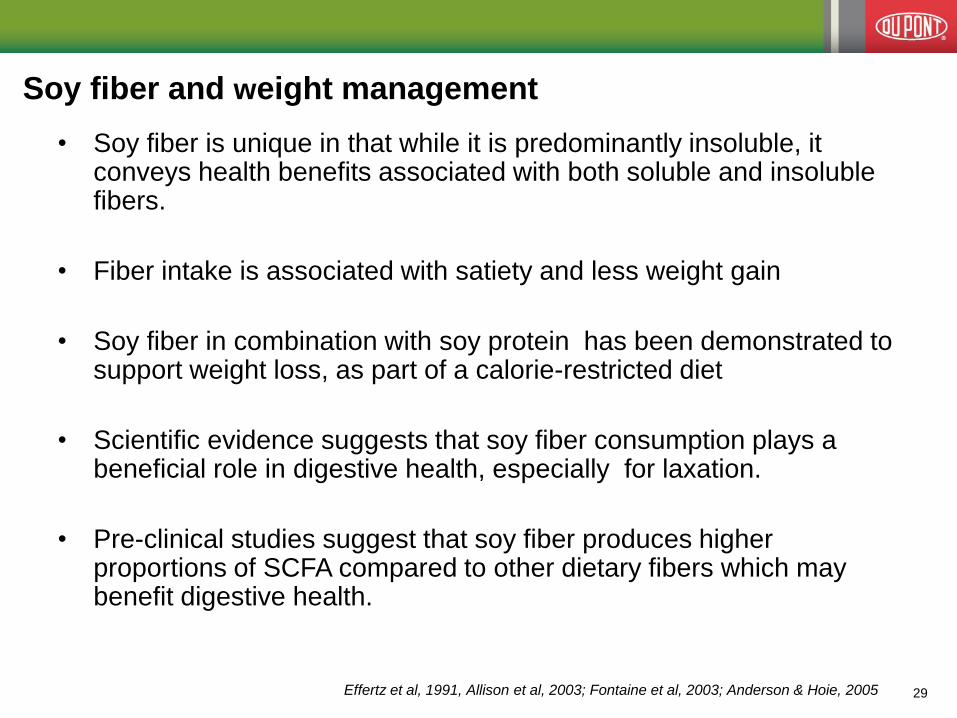
Soy fiber and weight management
• Soy fiber is unique in that while it is predominantly insoluble, it conveys health benefits associated with both soluble and insoluble fibers.
• Fiber intake is associated with satiety and less weight gain
• Soy fiber in combination with soy protein has been demonstrated to support weight loss, as part of a calorie-restricted diet
• Scientific evidence suggests that soy fiber consumption plays a beneficial role in digestive health, especially for laxation.
• Pre-clinical studies suggest that soy fiber produces higher proportions of SCFA compared to other dietary fibers which may benefit digestive health.
Effertz et al, 1991, Allison et al, 2003; Fontaine et al, 2003; Anderson & Hoie, 2005 29
Copyright © 2015 DuPont N&H. All rights reserved.
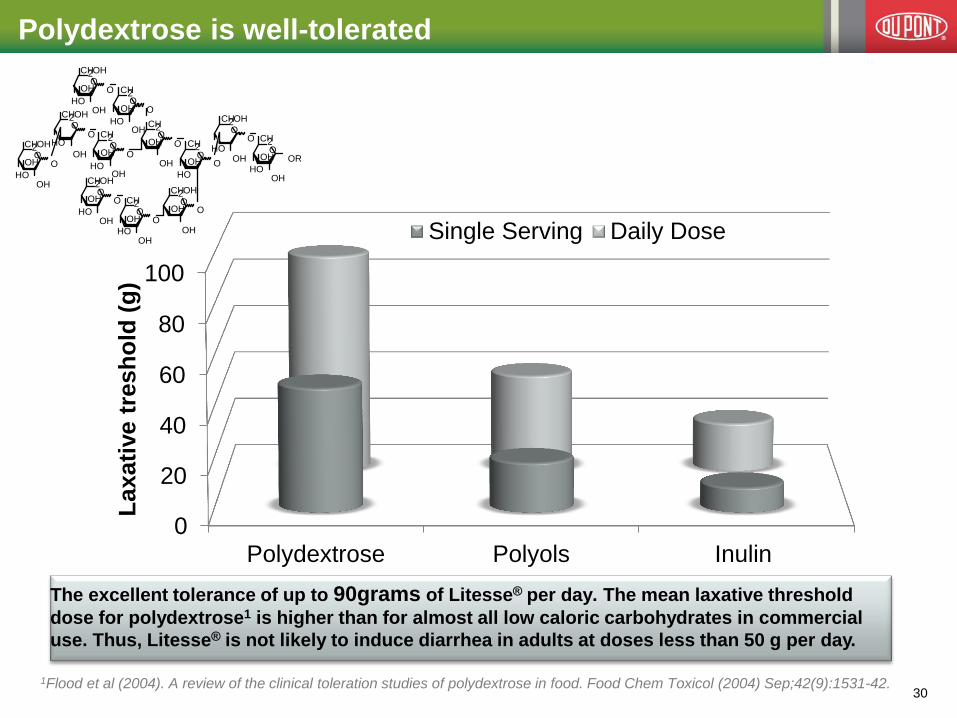
Polydextrose is well-tolerated
0
20
40
60
80
100
Polydextrose Polyols Inulin
Laxati
ve t
res
ho
ld (
g)
Single Serving Daily Dose
The excellent tolerance of up to 90grams of Litesse® per day. The mean laxative threshold
dose for polydextrose1 is higher than for almost all low caloric carbohydrates in commercial
use. Thus, Litesse® is not likely to induce diarrhea in adults at doses less than 50 g per day.
1Flood et al (2004). A review of the clinical toleration studies of polydextrose in food. Food Chem Toxicol (2004) Sep;42(9):1531-42. 30
HO
CH 2 OH
O
OH HO
O CH 2
OR
OH
OH O
CH 2 O
OH O
O
OH
OH O
CH 2
CH 2 OH
O OH
OH
O
O
HO OH
OH O
CH 2
OH
HO
HO OH
OH O
CH 2
O
HO OH
OH O
CH 2 OH
CH 2 OH
O OH
OH HO
O
CH 2 O
OH
HO O
O
HO OH
OH O
CH 2
O
CH 2 OH
O OH
OH HO
O
Preprandial Prandial Postprandial
Subjectives Experiences of Appetite
Min
Max
Hunger (Desire, Prospective Food Consumption)
Fullness
Sensory
Anticipation
generated by sight
and smell
Cognitive
Prior beliefs and
associations from
learning and experience
Sensory &
Cognitive
Rewards & Pleasure,
Changes in
palatability and
hedonic value within
meal
Pre-Absorptive
Physical characteristics
Energy/Osmotic load,
Nutrient composition
Ghrelin, CCK, GLP1 & PYY
Gut Motility
(duodenal and ileal brakes),
microbiota?
Post-absorptive
Metabolites
(Glucose & Amino-
acids) Oxidation
Insulin & leptin
Adipose tissue and
tonic energy balance
Meal
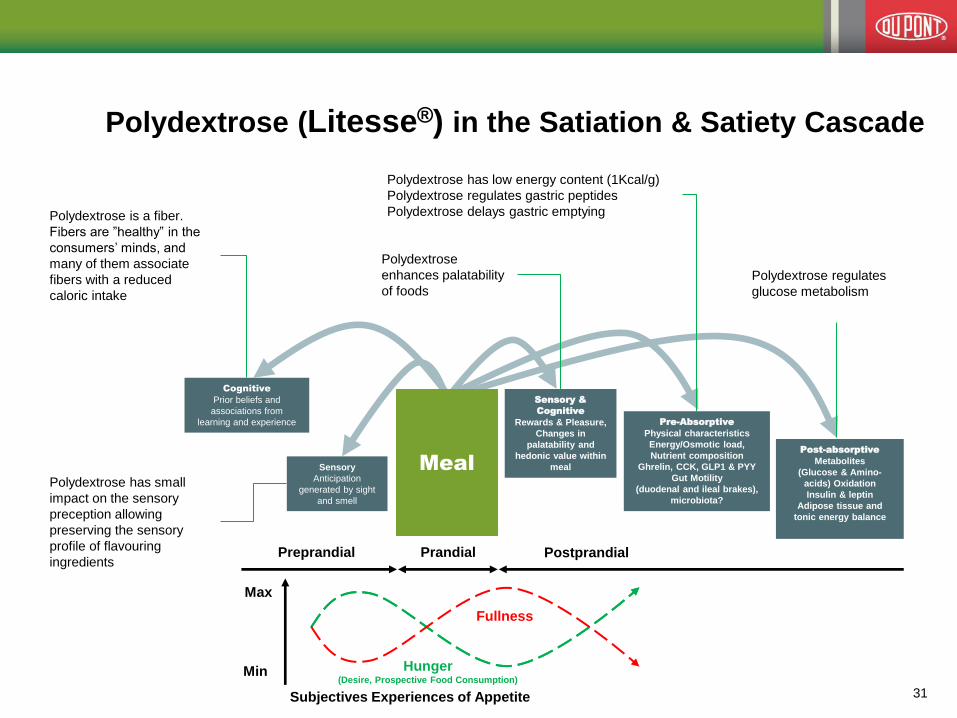
Polydextrose (Litesse®) in the Satiation & Satiety Cascade
Polydextrose has small
impact on the sensory
preception allowing
preserving the sensory
profile of flavouring
ingredients
Polydextrose is a fiber.
Fibers are ”healthy” in the
consumers’ minds, and
many of them associate
fibers with a reduced
caloric intake
Polydextrose
enhances palatability
of foods
Polydextrose has low energy content (1Kcal/g)
Polydextrose regulates gastric peptides
Polydextrose delays gastric emptying
Polydextrose regulates
glucose metabolism
31
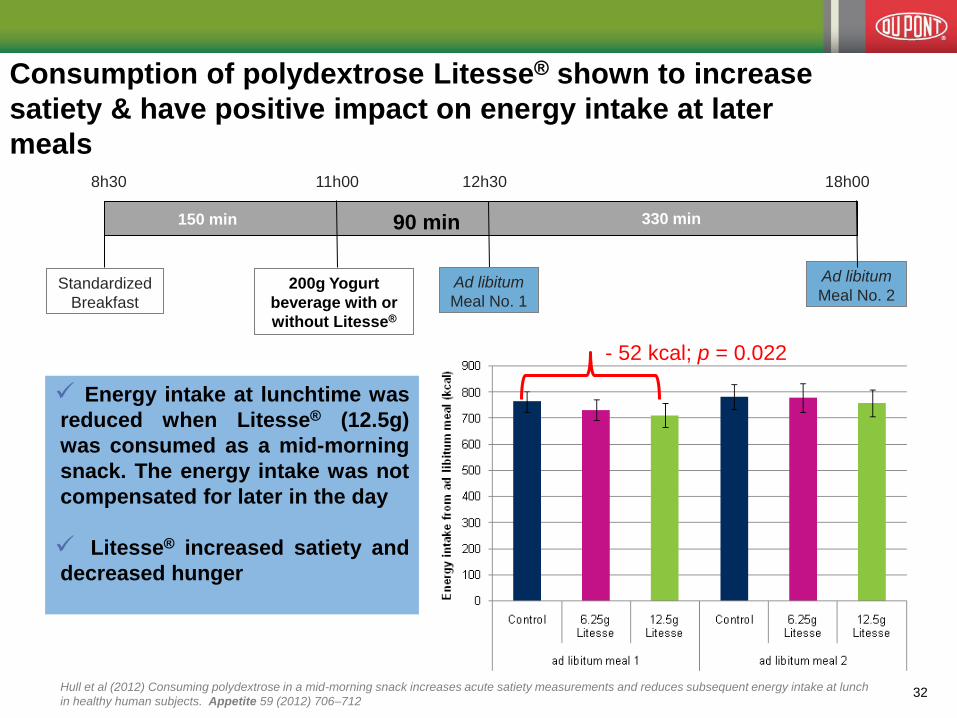
Hull et al (2012) Consuming polydextrose in a mid-morning snack increases acute satiety measurements and reduces subsequent energy intake at lunch
in healthy human subjects. Appetite 59 (2012) 706–712
Consumption of polydextrose Litesse® shown to increase
satiety & have positive impact on energy intake at later
meals
Standardized
Breakfast
12h30 18h00 8h30
200g Yogurt
beverage with or
without Litesse®
Ad libitum
Meal No. 2
11h00
150 min 330 min 90 min
Ad libitum
Meal No. 1
- 52 kcal; p = 0.022
Energy intake at lunchtime was
reduced when Litesse® (12.5g)
was consumed as a mid-morning
snack. The energy intake was not
compensated for later in the day
Litesse® increased satiety and
decreased hunger
32
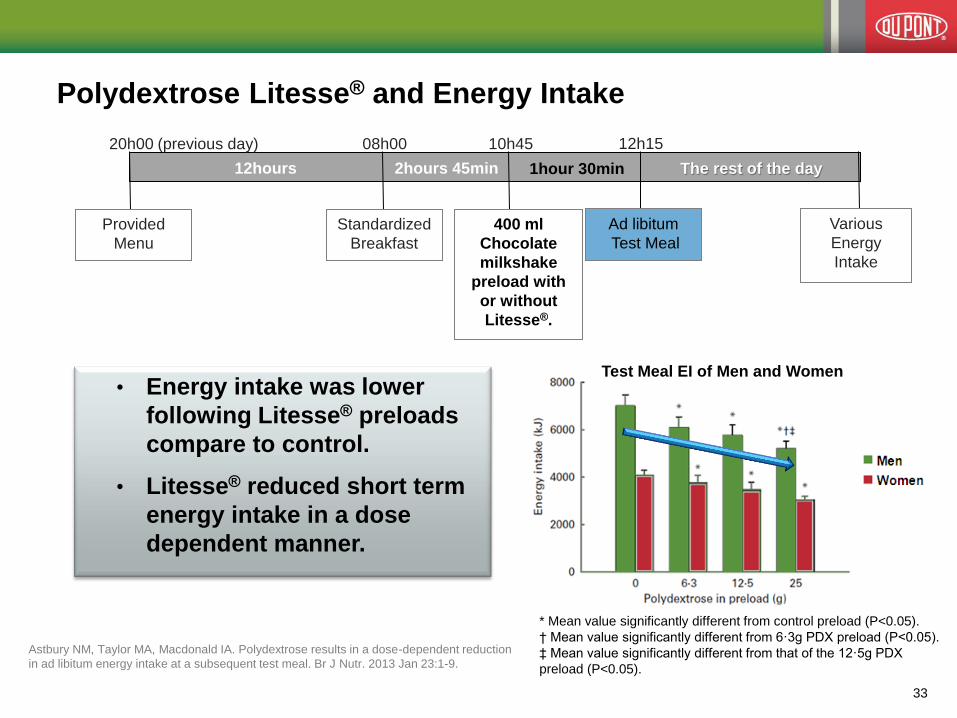
Polydextrose Litesse® and Energy Intake
Astbury NM, Taylor MA, Macdonald IA. Polydextrose results in a dose-dependent reduction
in ad libitum energy intake at a subsequent test meal. Br J Nutr. 2013 Jan 23:1-9.
12h15
Ad libitum
Test Meal
10h45 08h00
Standardized
Breakfast
20h00 (previous day)
Provided
Menu
12hours 2hours 45min 1hour 30min The rest of the day
Various
Energy
Intake
400 ml
Chocolate
milkshake
preload with
or without
Litesse®.
• Energy intake was lower
following Litesse® preloads
compare to control.
• Litesse® reduced short term
energy intake in a dose
dependent manner.
* Mean value significantly different from control preload (P<0.05).
† Mean value significantly different from 6·3g PDX preload (P<0.05).
‡ Mean value significantly different from that of the 12·5g PDX
preload (P<0.05).
Test Meal EI of Men and Women
33

Polydextrose Litesse® and satiety-related hormones
Experimental design:
Acute, randomized, double-blind, placebo-controlled, crossover trial 18
obese participants consumed a high-fat meal with or without Litesse® (15
g).
Postprandial plasma concentrations of satiety-related hormones were
assessed and the subjective feelings of appetite were evaluated as
incremental areas under the curve (iAUC).
GLP-1 results are presented using a linear mixed-effects model.
Olli et al. (2015) Postprandial effects of polydextrose on satiety hormone responses and subjective feelings of appetite in obese participants. Nutrition Journal 2015, 14:2
Litesse® increased
postprandial GLP-1 levels
more than the control treatment
(P = 0.02).
Litesse® reduced iAUC for
hunger by 40% during the post-
meal satiety period.
Hu
ng
er
iAU
C (
min
.mm
)
P la c e b o P D X
0
1 0 0 0
2 0 0 0
3 0 0 0
4 0 0 0
5 0 0 0
6 0 0 0
7 0 0 0
P = 0 .0 3
40%
reduction
34

The GI of foods is simply a ranking of foods based on
their immediate effect on blood sugar levels
Litesse® has a lower Glycemic
Response than glucose
• To make a fair
comparison, all foods
are compared with a
reference food such as
pure glucose
• Litesse® Polydextrose
elicits a low glycemic
response
Foster-Powell et al. 2002. International table of glycemic index
and glycemic load values: 2002. Am J Clin Nutr Jul;76(1):5-56.
18 35
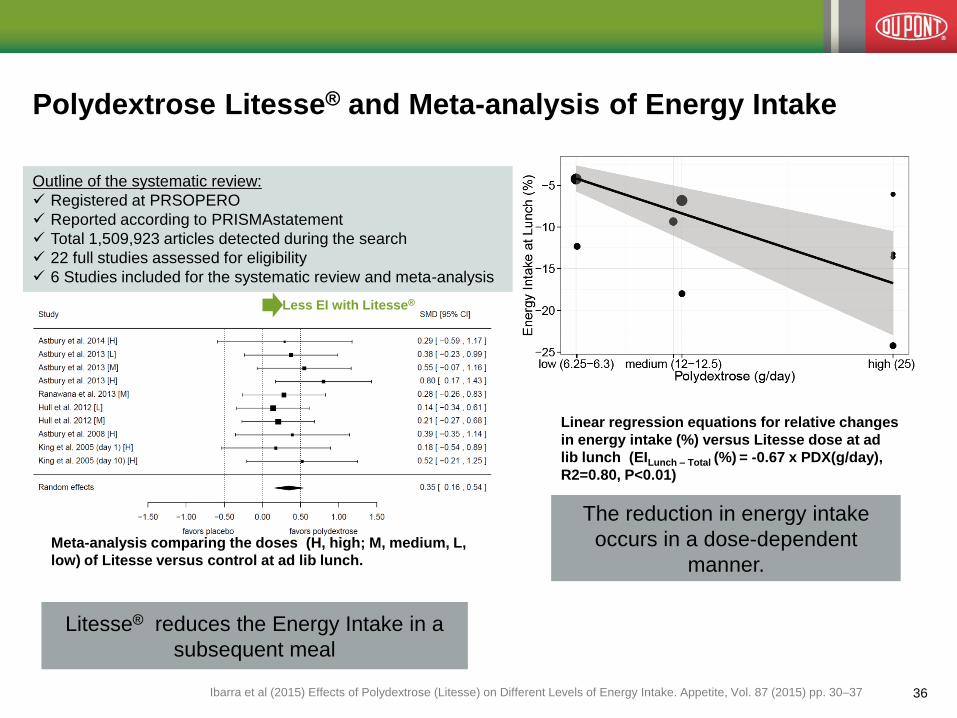
Polydextrose Litesse® and Meta-analysis of Energy Intake
Linear regression equations for relative changes
in energy intake (%) versus Litesse dose at ad
lib lunch (EILunch – Total (%) = -0.67 x PDX(g/day),
R2=0.80, P<0.01)
Litesse® reduces the Energy Intake in a
subsequent meal
The reduction in energy intake
occurs in a dose-dependent
manner.
Less EI with Litesse®
Ibarra et al (2015) Effects of Polydextrose (Litesse) on Different Levels of Energy Intake. Appetite, Vol. 87 (2015) pp. 30–37
Outline of the systematic review:
Registered at PRSOPERO
Reported according to PRISMAstatement
Total 1,509,923 articles detected during the search
22 full studies assessed for eligibility
6 Studies included for the systematic review and meta-analysis
Meta-analysis comparing the doses (H, high; M, medium, L,
low) of Litesse versus control at ad lib lunch.
36
DuPont Confidential
37
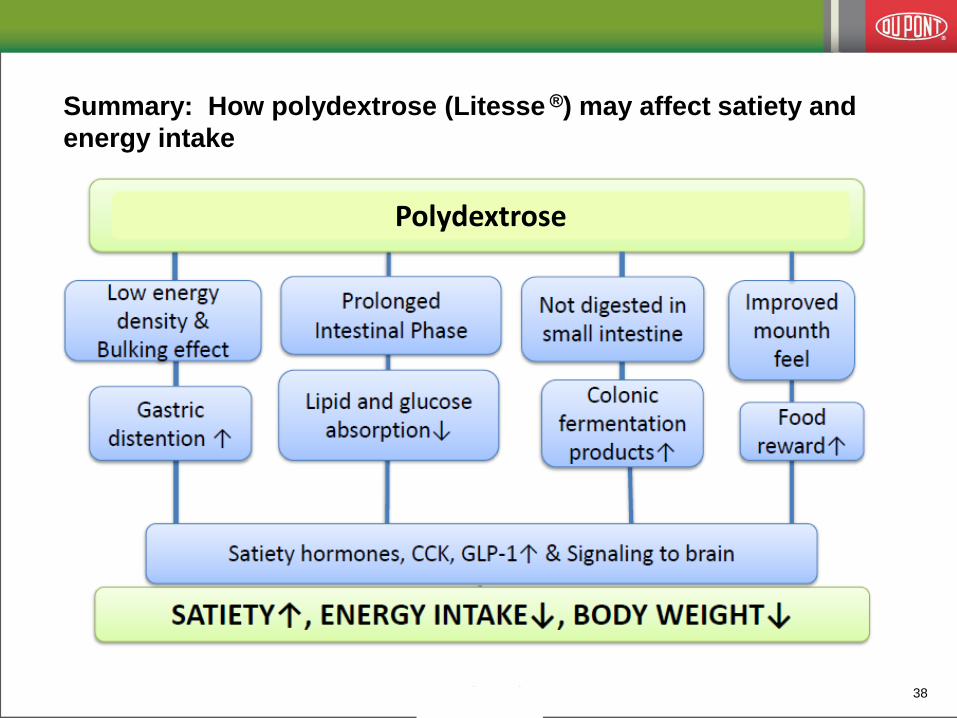
Summary: How polydextrose (Litesse ®) may affect satiety and
energy intake
38
Polydextrose
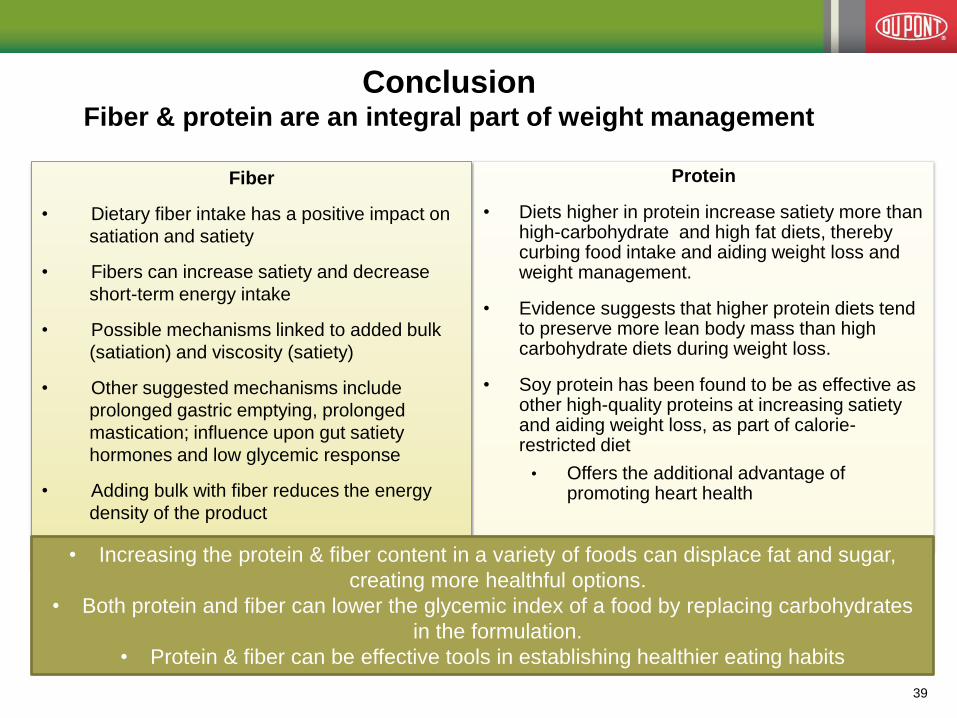
Conclusion Fiber & protein are an integral part of weight management
Protein
• Diets higher in protein increase satiety more than high-carbohydrate and high fat diets, thereby curbing food intake and aiding weight loss and weight management.
• Evidence suggests that higher protein diets tend to preserve more lean body mass than high carbohydrate diets during weight loss.
• Soy protein has been found to be as effective as other high-quality proteins at increasing satiety and aiding weight loss, as part of calorie-restricted diet
• Offers the additional advantage of promoting heart health
Fiber
• Dietary fiber intake has a positive impact on
satiation and satiety
• Fibers can increase satiety and decrease
short-term energy intake
• Possible mechanisms linked to added bulk
(satiation) and viscosity (satiety)
• Other suggested mechanisms include
prolonged gastric emptying, prolonged
mastication; influence upon gut satiety
hormones and low glycemic response
• Adding bulk with fiber reduces the energy
density of the product
• Increasing the protein & fiber content in a variety of foods can displace fat and sugar,
creating more healthful options.
• Both protein and fiber can lower the glycemic index of a food by replacing carbohydrates
in the formulation.
• Protein & fiber can be effective tools in establishing healthier eating habits
39

Copyright © 2016 DuPont or its affiliates. All rights reserved. The DuPont Oval Logo, DuPont™ Danisco® and all products denoted with ™ or ® are
registered trademarks or trademarks of E. I. du Pont de Nemours and Company or its affiliates.
Thank you!
3/16/2016
Copyright © 2016 DuPont or its affiliates. All Rights Reserved. The DuPont Oval Logo, DuPont™, The miracles of science™ and all products denoted with ® or ™ are registered trademarks or
trademarks of E.I. du Pont de Nemours and Company or its affiliated companies.
The information contained herein is based on data known to DuPont or its affiliates at the time of preparation of the information and believed by them to be reliable. This is business-to-business
information intended for food, beverage and supplement producers, and is not intended for the final consumer of a finished food, beverage or supplement product. The information is provided “as is”
and its use is at the recipient’s sole discretion and risk. It is the recipient’s sole responsibility to determine the suitability and legality of its proposed use of DuPont products for its specific purposes.
Information and statements herein shall not be construed as licenses to practice, or recommendations to infringe, any patents or other intellectual property rights of DuPont or others. DUPONT
HEREBY EXPRESSLY DISCLAIMS (I) ANY AND ALL LIABILITY IN CONNECTION WITH SUCH INFORMATION, INCLUDING, BUT NOT LIMITED TO, ANY LIABILITY RELATING TO THE
ACCURACY, COMPLETENESS, OUSEFULNESS OF SUCH INFORMATION, AND (II) ANY AND ALL REPRESENTATIONS OR WARRANTIES, EXPRESS OR IMPLIED, WITH RESPECT TO
SUCH INFORMATION, OR ANY PART THEREOF, INCLUDING ALL REPRESENTATIONS AND WARRANTIES OF TITLE, NONINFRINGEMENT OF COPYRIGHT OR PATENT RIGHTS OF
OTHERS, MERCHANTABILITY, FITNESS OR SUITABILITY FOR ANY PURPOSE, AND WARRANTIES ARISING BY LAW, STATUTE, USAGE OF TRADE OR COURSE OF DEALING. 40