059-2013: Fast Dashboards Anywhere with SAS® Visual Analytics

Solution Park Support for Visual Dashboards
CS Odessa corp.

2
Solution Park Support for Visual Dashboards
ContentsWhat is a Dashboard? ........................................................................................4
CS Odessa Role ...............................................................................................4Live Objects Technology ....................................................................................5Transforming Objects ........................................................................................5Switching Object ..............................................................................................5Data Driven Objects ..........................................................................................6
All the Solutions in Review ................................................................................7Comparison Dashboard .....................................................................................7Composition Dashboard.....................................................................................7Correlation Dashboard .....................................................................................7Frequency Distribution Dashboard .....................................................................7Meter Dashboard .............................................................................................7Spatial Dashboard ...........................................................................................8Status Dashboard ............................................................................................8Time Series Dashboard ....................................................................................8
Comparison Dashboard ......................................................................................9Benefits ..........................................................................................................9Objective .......................................................................................................9Solution Purpose .............................................................................................9Intended For ...................................................................................................9Products and methods ......................................................................................9
Solution Reference: Comparison Dashboard ......................................................9
Composition Dashboard .....................................................................................10Benefits ..........................................................................................................10Objective .......................................................................................................10Solution Purpose .............................................................................................10Intended For ...................................................................................................10Products and methods ......................................................................................10
Solution Reference: Composition Dashboard .....................................................10
Correlation Dashboard .......................................................................................11Benefits ..........................................................................................................11Objective .......................................................................................................11Solution Purpose .............................................................................................11Intended For ...................................................................................................11Products and methods ......................................................................................11
Solution Reference: Correlation Dashboard .......................................................11

3
Solution Park Support for Visual Dashboards
Frequency Distribution Dashboard .....................................................................12Benefits ..........................................................................................................12Objective .......................................................................................................12Solution Purpose .............................................................................................12Intended For ...................................................................................................12Products and methods ......................................................................................12
Solution Reference: Frequency Distribution Dashboard .....................................12
Meter Dashboard ...............................................................................................13Benefits ..........................................................................................................13Objective .......................................................................................................13Solution Purpose .............................................................................................13Intended For ...................................................................................................13Products and methods ......................................................................................13
Solution Reference: Meter Dashboard ................................................................13
Spatial Dashboard .............................................................................................14Benefits ..........................................................................................................14Objective .......................................................................................................14Solution Purpose .............................................................................................14Intended For ...................................................................................................14
Solution Reference: Spatial Dashboard ..............................................................14
Status Dashboard ..............................................................................................15Benefits ..........................................................................................................15Objective .......................................................................................................15Solution Purpose .............................................................................................15Intended For ...................................................................................................15Products and methods ......................................................................................15
Solution Reference: Status Dashboard ...............................................................15
Time Series Dashboard ......................................................................................16Benefits ..........................................................................................................16Objective .......................................................................................................16Solution Purpose .............................................................................................16Intended For ...................................................................................................16Products and methods ......................................................................................16
Solution Reference: Time Series Dashboard .......................................................16

4
Solution Park Support for Visual Dashboards
With solutions from the “What is a Dashboard?” area, we support managers and knowledge workers, providing them with Visual Dashboards. Visual Dashboards help you to track critical information at a glance, react quicker to changes and make better decisions.
The “What is a Dashboard?” area integrates solutions for the creation of different types of Visual Dashboards.
Each Solution is designed for a specific visualizing purpose. For example, a Comparison Dashboard is designed for visual item comparison - in other words, for the ranking of data series. Each Solution includes one or two Live Object Libraries.
Live Objects are special graphical objects which can read out data from a user defined external source at regular intervals, and change their appearance accordingly.
You can save the data file of your company or team dashboard into a shared cloud file storage folder, for example DropBox. This will allow your colleagues to be able to update the data for the dashboard.
Each Live Object is a ready to use Graphic Indicator, Chart or Map. So to create a custom dashboard you simply need to drag the Live Objects from the library into your dashboard page, and set the path to the data source file for each of them. Update the data source file in your free time, and your visual dashboard will show the actual data.
It’s possible to freely combine Indicators, Charts and Maps from all these solutions into your visual dashboard as you need. You also can create multi page dashboards and show them in presentation mode.
Finally you can demonstrate your dashboard on the biggest display you have, for example on a large screen TV on a wall in your office.
CS Odessa Role
CS Odessa is dedicated to bringing tools that have real user-value to the market. We do not undertake this task lightly. We are keenly focused on using our business expertise to deliver to our users the best tools available anywhere, to help them achieve professional results. Our work is focused on the company activities of our users to help them define, develop, and deliver on any business process.
Our goal is to provide simple, fast, efficient, and versatile tools that help you to successfully solve tasks in a professional manner, even if you’re working to a deadline.
What is a Dashboard?
A dashboard is a visual display of the most important information needed to achieve one or more objectives; consolidated and arranged on a single screen so the information can be monitored at a glance.
Stephen Few Dashboard Confusion, March 20, 2004

5
Solution Park Support for Visual Dashboards
Live Objects Technology
The advantage of live object technology is that with one click, a live object can be connected to a data source to give you an accurate overview of any dynamic in your organization. The types of live objects include transforming, switching, and data driven objects. ConceptDraw PRO contains a rich library of these three types of live objects. Using these live objects, you can easily present the data visually.
Live object technology is very effective for communicating the state of any process or the condition of any workflow. The ability to rapidly and visually communicate these items makes live objects a powerful tool for helping your organization function more efficiently.
For advanced users, live object technology provides a range of tools for custom development. You can create your own live objects of any type listed here, using the “Object Tables” and ConceptDraw PRO Basic for “Object Scripts”. All live objects included in ConceptDraw PRO were built using these tools. This technology allows organizations and third parties to build custom solutions that connect to company data.
Third party developers can build solutions for visualizing live data and provide customers with high value dashboard-based applications.
Transforming Objects
Users are able to manipulate the handle to change the appearance of the transforming objects. A transforming object’s behavior is defined by the object’s developer. The complexity of transforming objects depends on how many handles are used to modify the visual appearance.
Transforming objects can be very effective in situations where visual communication is important. For example, in the GUI application library you can find scrolling and editing objects that use this technology to show shapes and positions.
Switching Object
A switching object comes with its own menu button at the top right of the object, and this button allows you to use the switching menu to change the object’s appearance for different views or stages.
For example, if you have a pyramid object, you can divide it by switching the number of slices. Another good example of how this technology can be used is the GUI application prototyping library. Here you can switch between object views, highlighting items, disable/enable items, check/uncheck items, and even graphically add similar button types.

6
Solution Park Support for Visual Dashboards
Data Driven Objects
Visually, a data driven object appears as a switching or transforming object that is driven by external data, and can change shape in connection to changes within the data. Data driven objects can obtain data from an external data source such as a file, database, or Internet.
Data driven objects can be used to indicate critical business status in your organization. Key performance indicators can be rapidly demonstrated through data driven objects. Tables of numbers that at first glance have no apparent meaning are rapidly translated into graphics that explain the data.
Organizations today do not have the time or resources to extrapolate data and draw conclusions on an ongoing basis. Data driven objects do this immediately; effectively communicating status company-wide, and keeping all employees informed on company successes.
Data driven objects can source data from internet resources, such as XML data, then parse it to change the visual appearance of the object. For example, data driven objects can use XML data from a weather website and represent it with a weather symbol. Also, you can use this data driven object in your presentations, documents, or dashboards to indicate the weather.

7
Solution Park Support for Visual Dashboards
All the Solutions in Review
Comparison Dashboard
ConceptDraw PRO Comparison Dashboard templates, samples and libraries of Live Objects: Comparison Charts (Horizontal Bar Charts, Column Charts, Line Charts, Dot Plot) and Graphic Indicators (Two Columns Indicator, Two Bubbles Indicator, Scales Indicator, Left and Right Arrows Indicator, Up and Down Arrows Indicator and Two Up Arrows Indicator).
Composition Dashboard
ConceptDraw PRO Composition Dashboard templates, samples and libraries of Live Objects: Composition Charts (Pie Charts, Divided Bar Charts, Double Divided Bar Charts) and Graphic Indicators (Horizontal Divided Bar Indicator, Vertical Divided Bar Indicator and Mini Pie Chart Indicator).
Correlation Dashboard
ConceptDraw PRO Correlation Dashboard templates, samples and library of Live Objects: Comparison Charts (Scatter Plot Charts).
Frequency Distribution Dashboard
ConceptDraw PRO Frequency Distribution Dashboard templates, samples and library of Live Objects: Frequency Distribution Charts (Histograms, Area Charts).
Meter Dashboard
ConceptDraw PRO Meter Dashboard templates, samples and libraries of Live Objects - Meter Indicators (Radial Gauges and Dials, Bullets, Sliders and Level Meters).

8
Solution Park Support for Visual Dashboards
Spatial Dashboard
ConceptDraw PRO Spatial Dashboard templates, samples and library of Live Objects: Thematic Maps (Africa, Asia, Australia and Oceania, Europe, Latin America, North America, USA).
Status Dashboard
ConceptDraw PRO Status Dashboard templates, samples and library of Live Objects: Status Indicators (Alerts, Direction Indicators, Traffic Lights, Progress and Rating Indicators, Figures and Shapes Indicators).
Time Series Dashboard
ConceptDraw PRO Time Series Dashboard templates, samples and library of Live Objects: Time Series Charts (Column Charts, Line Charts, Bar Charts and Dot Plots).

9
Solution Park Support for Visual Dashboards
Comparison Dashboard
BenefitsConceptDraw PRO Comparison Dashboard templates, samples and libraries of Live Objects: Comparison Charts (Horizontal Bar Charts, Column Charts, Line Charts, Dot Plot) and Graphic Indicators (Two Columns Indicator, Two Bubbles Indicator, Scales Indicator, Left and Right Arrows Indicator, Up and Down Arrows Indicator and Two Up Arrows Indicator).
Objective Display actual critical information for item’s ranking and comparison.
Solution Purpose Draw live comparison dashboards quickly and easily.
Intended For Managers and knowledge workers.
Products and methods To create live comparison dashboards you can use the power of Live Object technology and ConceptDraw PRO diagramming and vector graphics software.
Solution Reference: Comparison DashboardThe Dashboard templates and Live Object libraries containing ready-to-use charts and graphic indicators provide professional live dashboard quickly and easily.
Tasks Actions Products
Create a Comparison Dashboard
In ConceptDraw PRO, use the template “Comparison Dashboard” and the libraries “Comparison Charts” and “Comparison Indicators”.
PRO

10
Solution Park Support for Visual Dashboards
Composition Dashboard
Benefits
ConceptDraw PRO Composition Dashboard templates, samples and libraries of Live Objects: Composition Charts (Pie Charts, Divided Bar Charts, Double Divided Bar Charts) and Graphic Indicators (Horizontal Divided Bar Indicator, Vertical Divided Bar Indicator and Mini Pie Chart Indicator).
Objective Display actual critical information to compare percent composition and components of items.
Solution Purpose Draw live composition dashboards quickly and easily.
Intended For Managers and knowledge workers.
Products and methods To create live composition dashboards you can use the power of Live Object technology and ConceptDraw PRO diagramming and vector graphics software.
Solution Reference: Composition DashboardThe Dashboard templates and Live Object libraries containing ready-to-use charts and graphic indicators provide professional live dashboard quickly and easily.
Tasks Actions Products
Create a Compositionon Dashboard
In ConceptDraw PRO, use the template “Composition Dashboard” and the libraries “Composition Charts” and “Composition Indicators”.
PRO

11
Solution Park Support for Visual Dashboards
Correlation Dashboard
BenefitsConceptDraw PRO Correlation Dashboard templates, samples and library of Live Objects: Correlation Charts (Scatter Plot Charts).
Objective Display actual critical information to evaluate predictive relationships between variables.
Solution Purpose Draw live correlation dashboards quickly and easily.
Intended For Managers and knowledge workers.
Products and methods To create live correlation dashboards you can use the power of Live Object technology and ConceptDraw PRO diagramming and vector graphics software.
Solution Reference: Correlation DashboardThe Dashboard templates and Live Object library with ready-to-use charts provide professional live dashboard quickly and easily.
Tasks Actions Products
Create a Correlation Dashboard
In ConceptDraw PRO, use the template “Correlation Dashboard” and the library “Correlation Charts”.
PRO

12
Solution Park Support for Visual Dashboards
Frequency Distribution
Dashboard
BenefitsConceptDraw PRO Frequency Distribution Dashboard templates, samples and library of Live Objects: Frequency Distribution Charts (Histograms, Area Charts).
Objective Display actual critical information to compare the items distributed into a series of progressive numerical ranges.
Solution Purpose Draw live frequency distribution dashboards quickly and easily.
Intended For Managers and knowledge workers.
Products and methods To create live frequency distribution dashboards you can use the power of Live Object technology and ConceptDraw PRO diagramming and vector graphics software.
Solution Reference: Frequency Distribution DashboardThe Dashboard templates and Live Object library containing ready-to-use charts provide professional live dashboard quickly and easily.
Tasks Actions Products
Create a Frequency Distribution Dashboard
In ConceptDraw PRO, use the template “Frequency Distribution Dashboard” and the library “Frequency Distribution Charts”.
PRO
13
Solution Park Support for Visual Dashboards
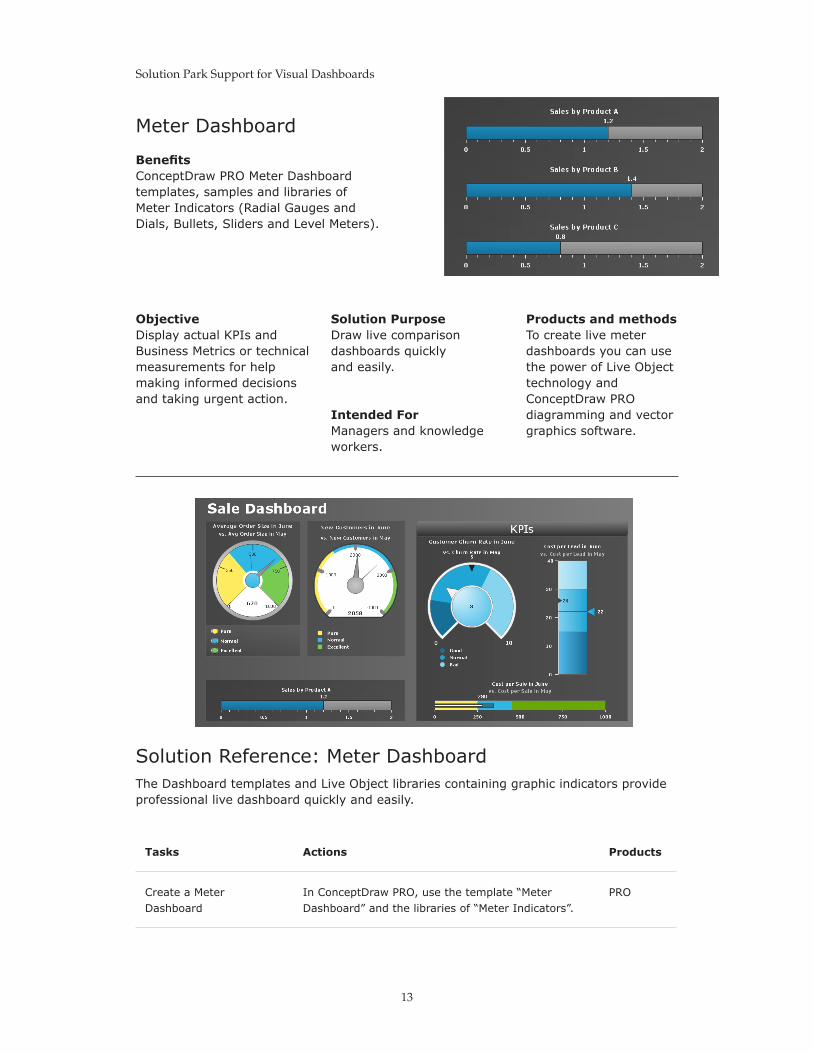
Meter Dashboard
BenefitsConceptDraw PRO Meter Dashboard templates, samples and libraries of Meter Indicators (Radial Gauges and Dials, Bullets, Sliders and Level Meters).
Objective Display actual KPIs and Business Metrics or technical measurements for help making informed decisions and taking urgent action.
Solution Purpose Draw live comparison dashboards quickly and easily.
Intended For Managers and knowledge workers.
Products and methods To create live meter dashboards you can use the power of Live Object technology and ConceptDraw PRO diagramming and vector graphics software.
Solution Reference: Meter DashboardThe Dashboard templates and Live Object libraries containing graphic indicators provide professional live dashboard quickly and easily.
Tasks Actions Products
Create a Meter Dashboard
In ConceptDraw PRO, use the template “Meter Dashboard” and the libraries of “Meter Indicators”.
PRO

14
Solution Park Support for Visual Dashboards
Spatial Dashboard
BenefitsConceptDraw PRO Spatial Dashboard templates, samples and library of Live Objects: Thematic Maps (Africa, Asia, Australia and Oceania, Europe, Latin America, North America, USA).
Objective Display actual spatial information to compare items across regions.
Solution Purpose Draw live spatial dashboards quickly and easily.
Intended For Managers and knowledge workers.
Products and methods To create live spatial dashboards you can use the power of Live Object technology and ConceptDraw PRO diagramming and vector graphics software.
Solution Reference: Spatial DashboardThe Dashboard templates and Live Object library containing thematic maps provide professional live dashboards quickly and easily.
Tasks Actions Products
Create a Spatial Dashboard
In ConceptDraw PRO, use the template “Spatial Dashboard” and the library “Thematic Maps”.
PRO

15
Solution Park Support for Visual Dashboards
Status Dashboard
BenefitsConceptDraw PRO Status Dashboard templates, samples and library of Live Objects: Status Indicators (Alerts, Direction Indicators, Traffic Lights, Progress and Rating Indicators, Figures and Shapes Indicators).
Objective Display actual status information to quickly estimate which immediate decisions and actions are required.
Solution Purpose Draw live status dashboards quickly and easily.
Intended For Managers and knowledge workers.
Products and methods To create live status dashboards you can use the power of Live Object technology and ConceptDraw PRO diagramming and vector graphics software.
Solution Reference: Status DashboardThe Dashboard templates and Live Object library containing graphic indicators provide professional live dashboards quickly and easily.
Tasks Actions Products
Create a Status Dashboard
In ConceptDraw PRO, use the template “Status Dashboard” and the library “Status Indicators”.
PRO

16
Solution Park Support for Visual Dashboards
Time Series Dashboard
BenefitsConceptDraw PRO Time Series Dashboard templates, samples and library of Live Objects: Time Series Charts (Column Charts, Line Charts, Bar Charts and Dot Plots).
Objective Display actual critical information showing a values change over time.
Solution Purpose Draw live time series dashboards quickly and easily.
Intended For Managers and knowledge workers.
Products and methods To create live time series dashboards, you can use the power of Live Object technology and ConceptDraw PRO diagramming and vector graphics software.
Solution Reference: Time Series DashboardThe Dashboard templates and Live Object library containing ready-to-use charts provide professional live dashboards quickly and easily.
Tasks Actions Products
Create a Time Series Dashboard
In ConceptDraw PRO, use the template “Time Series Dashboard” and the library “Time Series Charts”.
PRO