Solution of the theoretical problem 1 Back -and-Forth … · Solution of the theoretical problem 1...
27
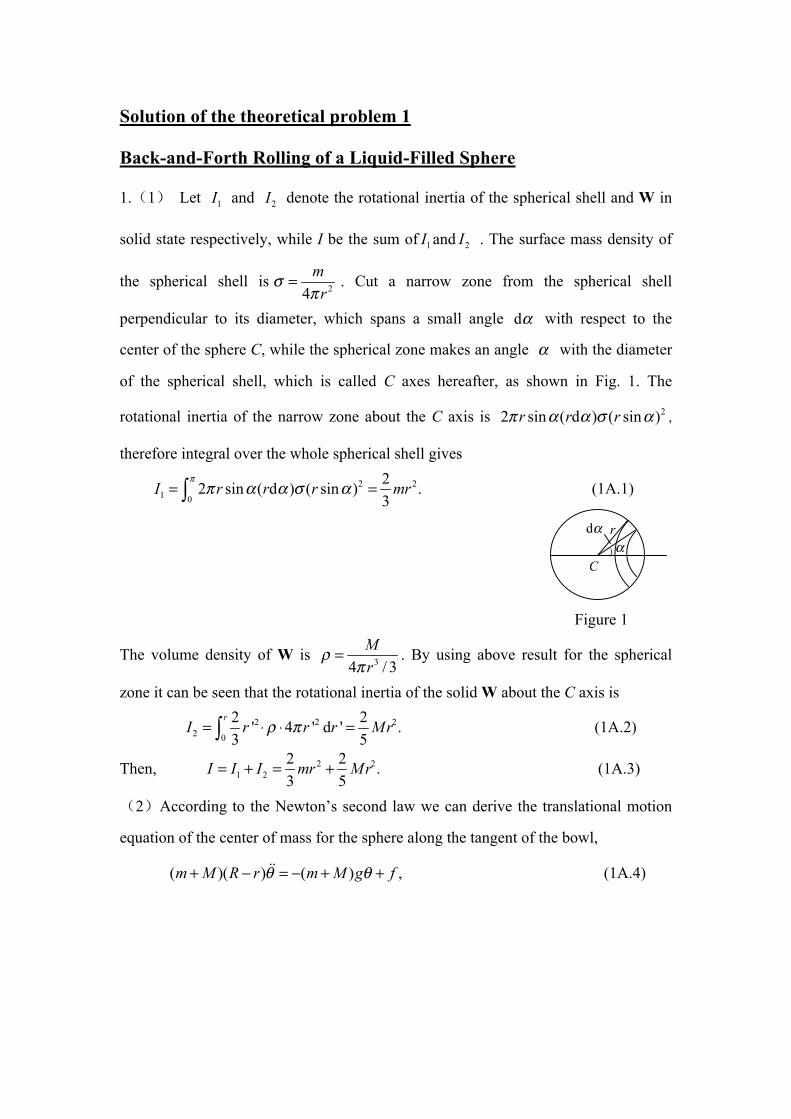
Solution of the theoretical problem 1 Back-and-Forth Rolling of a Liquid-Filled Sphere 1.(1) Let and denote the rotational inertia of the spherical shell and W in solid state respectively, while I be the sum of and . The surface mass density of the spherical shell is . Cut a narrow zone from the spherical shell perpendicular to its diameter, which spans a small angle with respect to the center of the sphere C, while the spherical zone makes an angle with the diameter of the spherical shell, which is called C axes hereafter, as shown in Fig. 1. The rotational inertia of the narrow zone about the C axis is , therefore integral over the whole spherical shell gives (1A.1) Figure 1 The volume density of W is . By using above result for the spherical zone it can be seen that the rotational inertia of the solid W about the C axis is (1A.2) Then, (1A.3) (2)According to the Newton’s second law we can derive the translational motion equation of the center of mass for the sphere along the tangent of the bowl, (1A.4) ) α dα C r
Transcript of Solution of the theoretical problem 1 Back -and-Forth … · Solution of the theoretical problem 1...
Solution of the theoretical problem 1
Back-and-Forth Rolling of a Liquid-Filled Sphere
1.(1) Let and denote the rotational inertia of the spherical shell and W in
solid state respectively, while I be the sum of and . The surface mass density of
the spherical shell is . Cut a narrow zone from the spherical shell
perpendicular to its diameter, which spans a small angle with respect to the
center of the sphere C, while the spherical zone makes an angle with the diameter
of the spherical shell, which is called C axes hereafter, as shown in Fig. 1. The
rotational inertia of the narrow zone about the C axis is ,
therefore integral over the whole spherical shell gives
(1A.1)
Figure 1
The volume density of W is . By using above result for the spherical
zone it can be seen that the rotational inertia of the solid W about the C axis is
(1A.2)
Then, (1A.3)
(2)According to the Newton’s second law we can derive the translational motion
equation of the center of mass for the sphere along the tangent of the bowl,
(1A.4)
) α dα
C
r

Figure 2
where denotes the angular position of the center of mass of the sphere as
shown in Fig.2, and f is the frictional force acting on the sphere by the inside wall of
the bowl. From the rotational dynamics, we have,
(1A.5)
where ϕ is the angular position of the reference radius CE with respect to the starting
position. Assumed constraint of pure rolling on the motion of the sphere reads,
(1A.6)
Equations (1A.4)-(1A.6) lead to
This is a motion equation of the type of simple harmonic oscillator. Therefore, we
obtain the angular frequency and period of the sphere rolling right and left:
, (1A.7)
. (1A.8)
2. This case can be treated similarly, except taking that the ideal liquid does not rotate
into consideration. Therefore Eqs. (1A.4) and (1A.6) are still applicable, while Eq.
(1A.5) needs to be modified as
(1A.9)
Equations (1A.4), (1A.6), and (1A.9) result in
f
D
θ
ϕ
(m+M)g
C C
O
E
R

Then, the angular frequency and period of the sphere rolling back-and-forth are
obtained respectively.
(1A.10)
(1A.11)
3. The time taken by the sphere from position A0 to equilibrium position O is ,
from O to , and from to O, from O to . Although the
angular amplitude decreases step by step (see below) during the rolling process of the
sphere right and left, the period keeps unchanged. This means
(1A.12)
Next, we calculate the change of the angular amplitude. When the sphere passes
through the equilibrium position O after it rolled down from the initial position ,
the velocity of its center is
(1A.13)
Now the angular velocity of the spherical shell rotating about the C axis is
(1A.14)
where C axis is the axis of rotation through the center of the sphere and perpendicular
to the paper plane of Fig.2. When W behaves as liquid (before it changes into solid
state), the angular momentum of the sphere relative to point O is
(1A.15)
When W changes suddenly into solid state, due to the fact that both gravitational and
frictional force pass through point O, the angular momentum of the sphere relative to
O is conserved, we have
(1A.16)
where and represent the angular velocity of the sphere immediately before
and after passing through point O. Therefore
(1A.17)
while after passing through point O the velocity of the center of the sphere becomes
(1A.18)
Once the sphere reaches the left highest position corresponding to the left
angular amplitude we have
However,
From above two expressions we obtain
(1A.19)
Similarly we can treat the process that the sphere rolls from position back to A1 ,
the second highest position on the right, corresponding to the second right angular
amplitude θ1, and obtain
Then,
Following the similar procedure repeatedly we finally obtain:
(1A.20)
Solution of theoretical problem 2
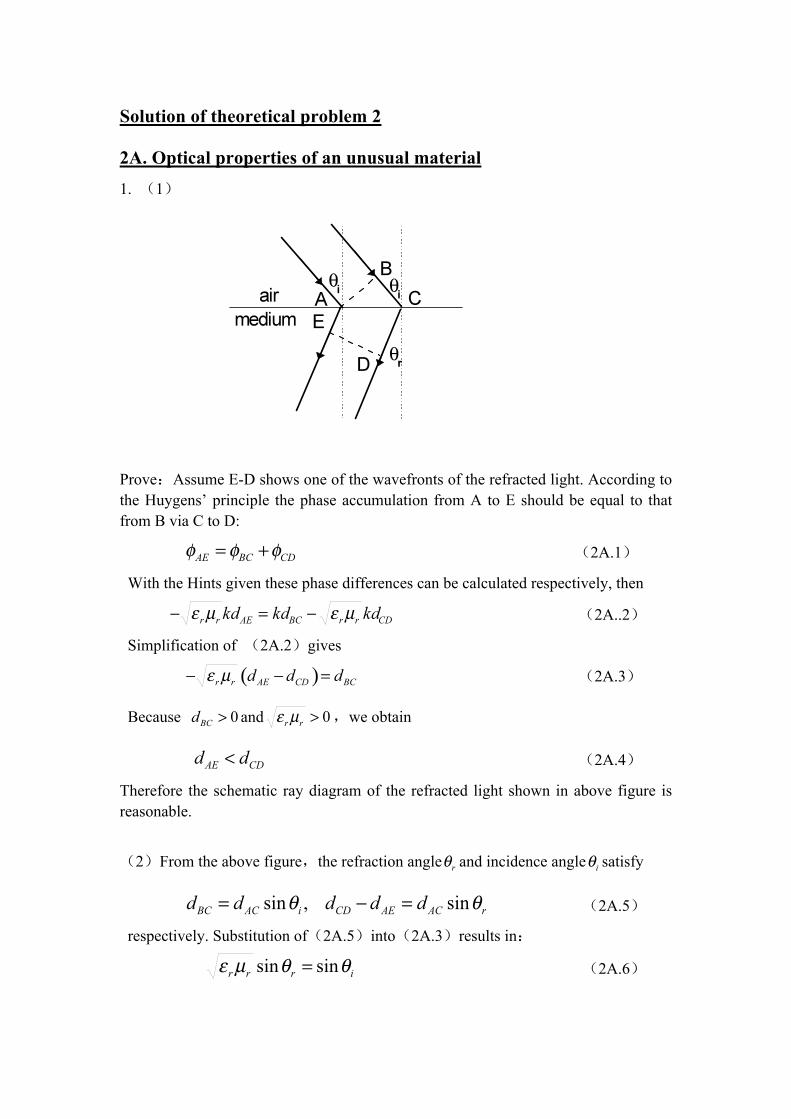
2A. Optical properties of an unusual material 1. (1)
Prove:Assume E-D shows one of the wavefronts of the refracted light. According to the Huygens’ principle the phase accumulation from A to E should be equal to that from B via C to D:
(2A.1)
With the Hints given these phase differences can be calculated respectively, then
(2A..2)
Simplification of (2A.2)gives
(2A.3)
Because and ,we obtain
(2A.4)
Therefore the schematic ray diagram of the refracted light shown in above figure is reasonable.
(2)From the above figure,the refraction angle and incidence angle satisfy
(2A.5)
respectively. Substitution of(2A.5)into(2A.3)results in:
(2A.6)

( 3)
Prove:Assume E-D shows one of the wavefronts of refracted light. According to the Huygens’ principle the phase accumulation from A to E should be equal to that from B via C to D:
(2A.7)
With the Hints given these phase differences can be calculated respectively, then
(2A.8)
Simplification of (2A.8)gives
(2A.9)
Because and ,we obtain
(2A.10)
Therefore the schematic ray diagram of the refracted light shown in the above figure is reasonable.
(4) From the above figure,the refraction angle and incidence angle satisfy
(2A.11)
respectively. Substitution of(2A.11)into(2A.9)results in :
(2A.12)
2. The ray diagram is shown below. Illustration: The light is negatively refracted at both interfaces, and the refraction angle equals to incidence angle. Meanwhile according to the Hints provided there is no reflected light from each interface. Therefore within the medium light rays converge strictly at a point symmetric to the source about the left side of the medium, and on the other side

of the medium the rays converge strictly at a point which is symmetric to the image of the source within the medium about the right side of the medium.
3. The phase difference between the two waves transmitting through the right side of the medium in succession is
(2A.13)
On the right side of above equation the first term shows the phase difference of the light wave accumulated during its propagation in air, the second term shows the phase difference of the light wave accumulated during its propagation in the unusual medium, while the third term accounts for the phase difference of the light wave accumulated due to the two reflections in succession from the interface between air
and the medium. Taking ,(2A.13)changes into
(2A.14)
Resonant condition means
(2A.15)
Thus (2A.16)

4.
From the given conditions the ray diagram can be accordingly constructed. Above figure shows schematically the ray diagram for .Because for the unusual
medium , from the solution of the first question we have
.Therefore the direction of the final out-going light deviates from
that of the incident light by .Because the direction of the incident light is given
in the y direction, only if the condition
(2A.17)
is satisfied the light signal can not reach the receiving plane. Notice
, (2A.18)
and the similarity of the monotonicity of to that of in the range of
, we find that(2A.17)goes to
. (2A.19)
Further taking the symmetry about the y axis into consideration we obtain that if the following condition
(2A.20)
is satisfied,the light emitted from a light source located on the x axis can not reach the receiving plane.

2B. Dielectric spheres inside an external electric field 1. (1) Adopting the polar coordinates, the z component of the electric field produced
by a dipole located at the origin with its axis parallel to the z axis is:
(2B.1)
where is the length of the relative position vector of the two dipoles. In the external electric field E, the energy of a dipole with its axis parallel to the z axis is:
Therefore we obtain that the interaction energy between two contacting small dielectric spheres is
(2B.2)
(2) Based on Eq. (2B.2) for the configuration (a) we obtain:
(2B.3)
For configuration (b)
(1B.4)
For configuration (c),
(1B.5)
(3) Comparison between (2B.3),(2B.4) and (2B.5) shows that configuration (a)
has the lowest energy, corresponding to the ground state of the system. 2. With the similar approach to question 1 the interaction energies for the three
different configurations can also be calculated. For configuration (d),
(2B.6)
For configuration (e),
(2B.7)

For configuration (f),
(2B.8)
Comparison shows that configuration (e) of the lowest energy is most stable, while configuration (f) of the highest energy is most unstable.
Solution of the theoretical problem 3
3A. Average specific heat of each free electron at constant volume
(1). Each free electron has 3 degrees of freedom. According to the equipartition of
energy theorem, at temperature T its average energy equals to ,therefore
the average specific heat equals to
(2). Let U be the total energy of the electron gas, then
where S is the total number of the electronic states, E the electron energy.
Substitution of (1) for in the above expression gives
,
where I represents the integral
.
Usually at room temperature . Therefore, with the simplified
I can be simplified as
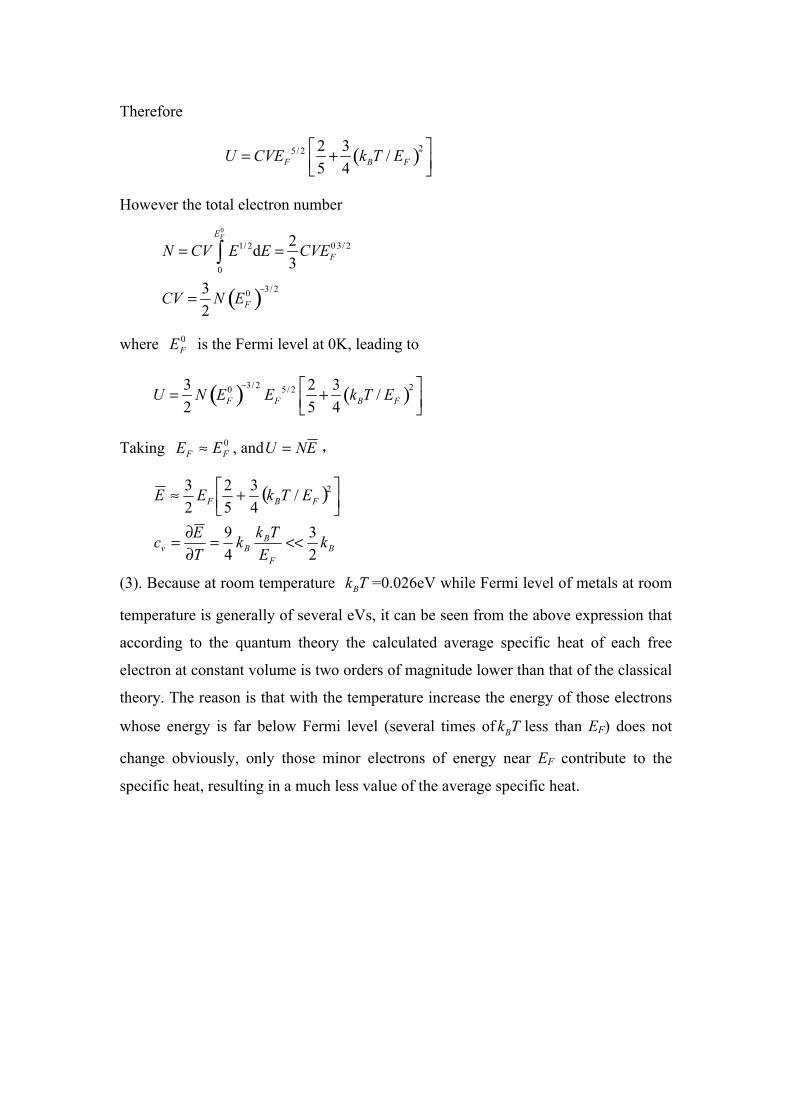
Therefore
However the total electron number
where is the Fermi level at 0K, leading to
Taking , and ,
(3). Because at room temperature =0.026eV while Fermi level of metals at room
temperature is generally of several eVs, it can be seen from the above expression that
according to the quantum theory the calculated average specific heat of each free
electron at constant volume is two orders of magnitude lower than that of the classical
theory. The reason is that with the temperature increase the energy of those electrons
whose energy is far below Fermi level (several times of less than EF) does not
change obviously, only those minor electrons of energy near EF contribute to the
specific heat, resulting in a much less value of the average specific heat.

Solution of the theoretical problem 3
3B. The Inverse Compton Scattering
1. Let and denote the momentum
and energy of the incident electron, and
the momentum and energy of the
scattered electron, and and the
energies of the incident and scattered photon
respectively. For this scattering process (see
Fig. 1) energy conservation reads
(1B.1)
while the momentum conservation can be shown as (see Figure
Fig.2)
(1B.2)
Equations (1B.1) and (1B.2), combined with the
energy-momentum relations Figure 2
(1B.3)
and (1B.4)
lead to
(1B.5)
We have assumed that the kinetic energy of the incident electron is higher than its
static energy, and the energy of the incident photon is less than , so
that . Therefore from Eq. (1B.5), it can be easily seen that
results in the maximum of , and the maximum is
(1B.6)
1
p-hv/c
θ p’ hv’/c

2.Substitution of into Eq. (1B.6) yields
(1B.7)
Due to , , and ,then we have
(1B.8)
In the case of and the wavelength of the incident photon
eV,
,
satisfying expression (1B.8). Therefore the maximum energy of the scattered photon
corresponding to a wavelength nm.
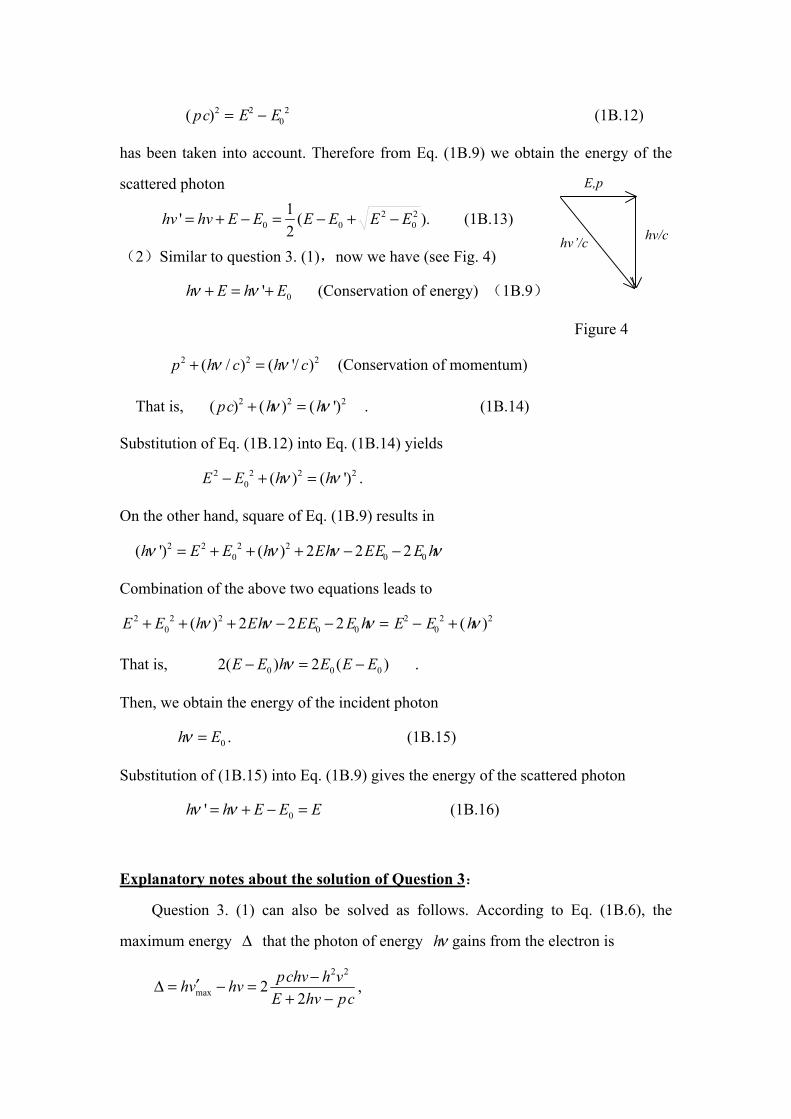
3.(1)It is obvious that if the incident electron gives its total kinetic energy to the
photon, the photon gains the maximum energy from the incident electron through the
scattering process, namely the electron should become at rest after the collision. In
this case, we have (see Fig. 3)
(Conservation of energy) (1B.9)
(Conservation of momentum)
or (1B.10) Figure 3
Subtracting (1B.10) from (1B.9) leads to the energy of the incident photon
. (1B.11)
In above equation the energy- momentum relation
E,p hv
E0
hv’
(1B.12)
has been taken into account. Therefore from Eq. (1B.9) we obtain the energy of the
scattered photon
(1B.13)
(2)Similar to question 3. (1),now we have (see Fig. 4)
(Conservation of energy) (1B.9)
Figure 4
(Conservation of momentum)
That is, . (1B.14)
Substitution of Eq. (1B.12) into Eq. (1B.14) yields
.
On the other hand, square of Eq. (1B.9) results in
Combination of the above two equations leads to
That is, .
Then, we obtain the energy of the incident photon
. (1B.15)
Substitution of (1B.15) into Eq. (1B.9) gives the energy of the scattered photon
(1B.16)
Explanatory notes about the solution of Question 3:
Question 3. (1) can also be solved as follows. According to Eq. (1B.6), the
maximum energy that the photon of energy gains from the electron is
,
E,p
hv/c hv’/c
where . To obtain the maximum , we use the extreme condition
.
Let the numerator equal to zero, a quadratic equation results:
.
Its two roots can be shown as
.
Since the negative sign leads to a meaningless negative , we have
.
where has been taken into account. This result is just the same as Eq.
(1B.11). The expression for is then the same as Eq. (1B.13).
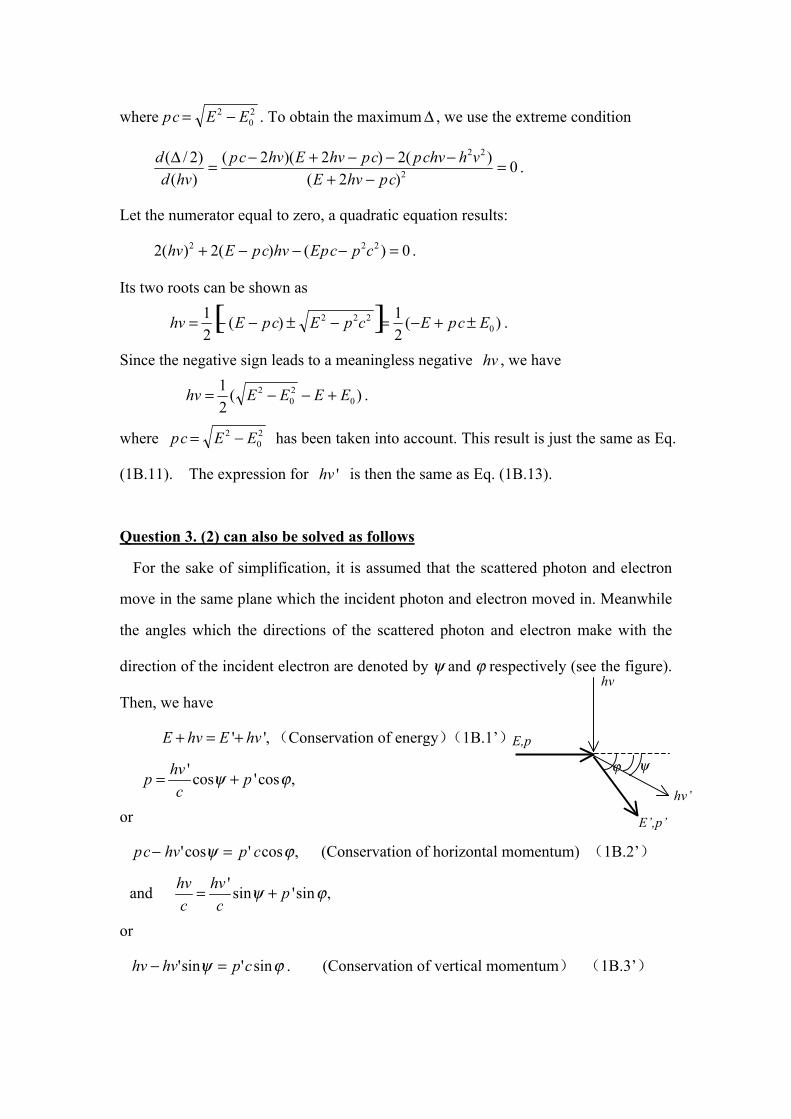
Question 3. (2) can also be solved as follows
For the sake of simplification, it is assumed that the scattered photon and electron
move in the same plane which the incident photon and electron moved in. Meanwhile
the angles which the directions of the scattered photon and electron make with the
direction of the incident electron are denoted by ψ and ϕ respectively (see the figure).
Then, we have
(Conservation of energy)(1B.1’)
or
(Conservation of horizontal momentum) (1B.2’)
and
or
. (Conservation of vertical momentum) (1B.3’)
hv
E,p
E’,p’
hv’
ϕ ψ

(1B.2’)2+(1B.3’)2 leads to
(1B.4’) Square of Eq.(1B.1’) results in
.
Substitution of the energy-momentum relation
into the above equation of energy conservation leads to
(1B.5’)
Comparison between Eq.(1B.4’)and Eq. (1B.5’) yields the energy of the scattered
photon
. (1B.6’)
From (1B.6’) it can be seen that if , the energy of the
scattered photon reaches the maximum,
. (1B.7’)
The energy that the photon gets from the electron is
. (1B.8’)
The extreme condition for is
=0, (1B.9’)
where
and .
results in

Simplifying this equation leads to
i.e., .
Squaring both of the two sides of this equation yields
Substitution of into the above equation and making some
simplifications yield
,
that is,
.
After some simplifications we obtain
,
which yields (1B.10’)
Substitution of (1B.10’) into Eq. (1B.7’) leads to
. (1B. 11’)
The results (1B.10’) and (1B.11’) are just the same as Eqs. (1B.15) and (1B.16) in the former solution.
Solution of Problem EX1
Using the interference method to measure the thermal expansion
coefficient and temperature coefficient of refractive index of glass
1.Questions(2.4 point)
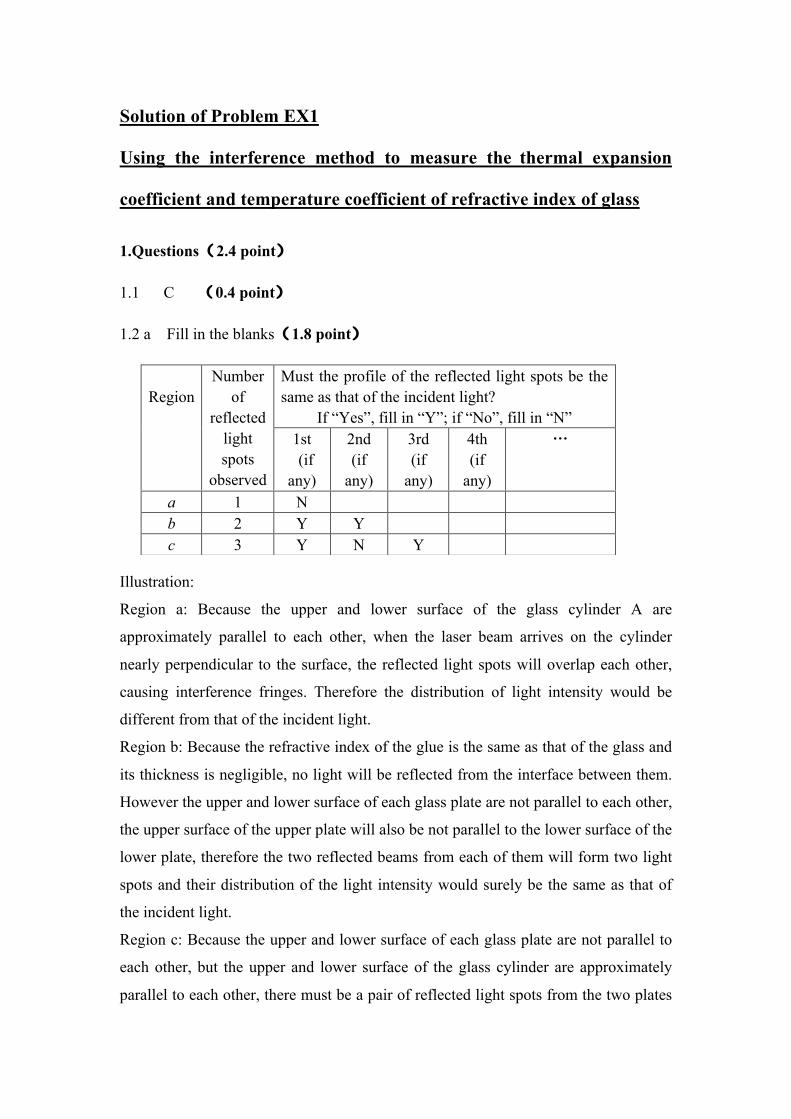
1.1 C (0.4 point) 1.2 a Fill in the blanks(1.8 point)
Illustration:
Region a: Because the upper and lower surface of the glass cylinder A are
approximately parallel to each other, when the laser beam arrives on the cylinder
nearly perpendicular to the surface, the reflected light spots will overlap each other,
causing interference fringes. Therefore the distribution of light intensity would be
different from that of the incident light.
Region b: Because the refractive index of the glue is the same as that of the glass and
its thickness is negligible, no light will be reflected from the interface between them.
However the upper and lower surface of each glass plate are not parallel to each other,
the upper surface of the upper plate will also be not parallel to the lower surface of the
lower plate, therefore the two reflected beams from each of them will form two light
spots and their distribution of the light intensity would surely be the same as that of
the incident light.
Region c: Because the upper and lower surface of each glass plate are not parallel to
each other, but the upper and lower surface of the glass cylinder are approximately
parallel to each other, there must be a pair of reflected light spots from the two plates
Must the profile of the reflected light spots be the same as that of the incident light?
If “Yes”, fill in “Y”; if “No”, fill in “N”
Region
Number of
reflected light spots
observed
1st
(if any)
2nd (if
any)
3rd (if
any)
4th (if
any)
⋯
a 1 N
b 2 Y Y
c 3 Y N Y

overlap each other, causing interference fringes, while the light intensity distribution
of the other two reflected light spots would be the same as that of the incident light.
1.2 b (0.2 point) If you choose “No” (N),use one keyword to account for the reason: interference .
2. Experiment: Measuring β and γ (7 . 6 points)
2.1 Design the Experiment, Draw the experimental ray diagrams and derive the
formulae relevant to the measurement(3.2 points)
The experimental ray diagrams for measuring β (left) and γ (right) are shown in Fig.1
Fig.1
When the laser light is reflected from the c region of the sample as shown in
Fig.1 (left), three reflected light spots can be observed on the screen, some
interference fringes appear at spot v, which are caused by the interference between
the two light rays reflected from the bottom surface of the upper glass plate and the
top surface of the lower glass plate. The difference between the optical lengths of
the two light rays is 2L. After the electric oven starts heating, assume that the
temperature T has increased by ΔT, the length increment of the sample due to the
thermal expansion of glass will be , and the shift in the number of the

moving interference fringes is m1. Then, ,where λ stands for the
wavelength of the laser light. Thus,
.
With the given L and λ, from the graphic relation of m1 and T we obtain the shift in
the number of the moving fringes m1 over the temperature range from 40℃ to 90℃.
Then, β can be obtained.
When the laser light is reflected from the region a as shown in Fig.1 (right), the
difference between the optical paths is 2nL. The variation of optical path difference
caused by temperature increase Δ T is
.
Assume that at this time the shift in the number of the moving interference fringes
is m2,
,
i.e., .
From the graphic relation of we obtain the shift in the number of the
moving interference fringes m2 over the temperature range from 40℃ to 90℃.
Thus, γ can be obtained.
2.2 (1) Data recorded during the measurement of the thermal expansion coefficient β
(0.8 points)
Measured Relation of m1 and T:
m1
(fringes)
1 2 3 4 5 6 7 8
T(oC) 30.0 35.4 40.6 46.1 50.6 54.4 58.6 63.1
m1
(fringes)
9 10 11 12 13 14 15
T(oC) 67.6 72.2 75.8 79.8 83.8 87.4 90.9
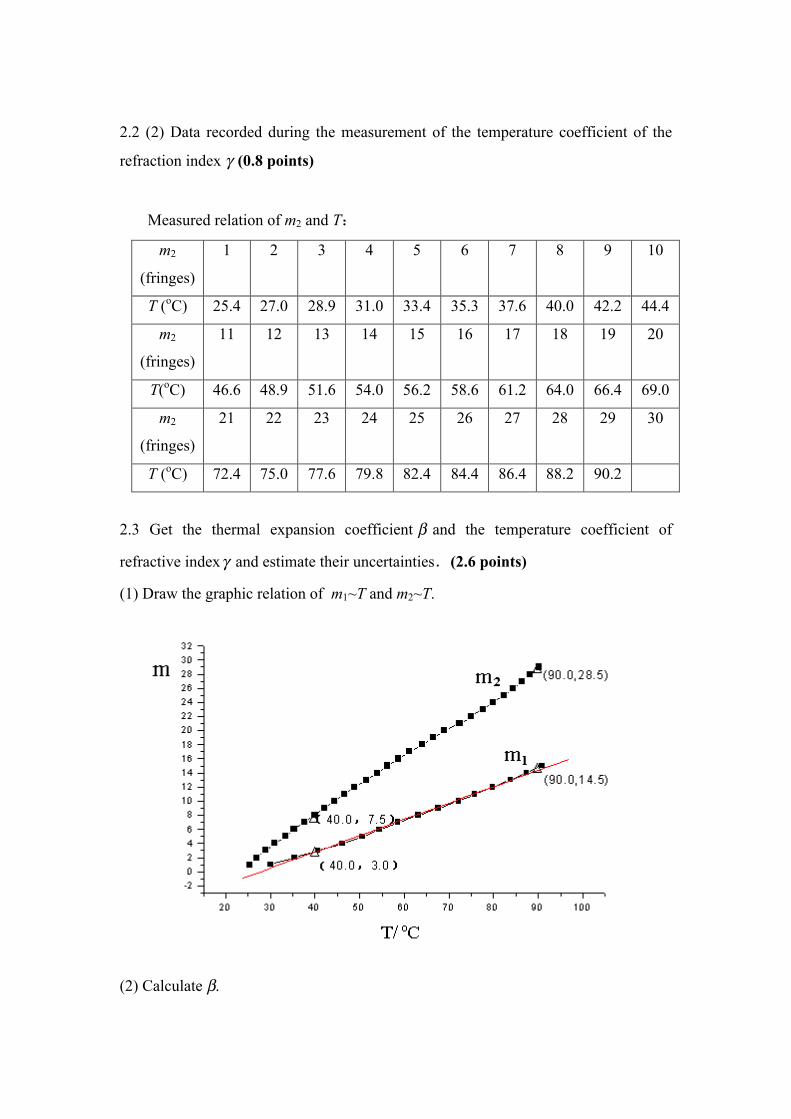
2.2 (2) Data recorded during the measurement of the temperature coefficient of the
refraction index γ (0.8 points)
Measured relation of m2 and T:
m2
(fringes)
1 2 3 4 5 6 7 8 9 10
T (oC) 25.4 27.0 28.9 31.0 33.4 35.3 37.6 40.0 42.2 44.4
m2
(fringes)
11 12 13 14 15 16 17 18 19 20
T(oC) 46.6 48.9 51.6 54.0 56.2 58.6 61.2 64.0 66.4 69.0
m2
(fringes)
21 22 23 24 25 26 27 28 29 30
T (oC) 72.4 75.0 77.6 79.8 82.4 84.4 86.4 88.2 90.2
2.3 Get the thermal expansion coefficient and the temperature coefficient of
refractive index and estimate their uncertainties.(2.6 points)
(1) Draw the graphic relation of m1~T and m2~T.
(2) Calculate β.
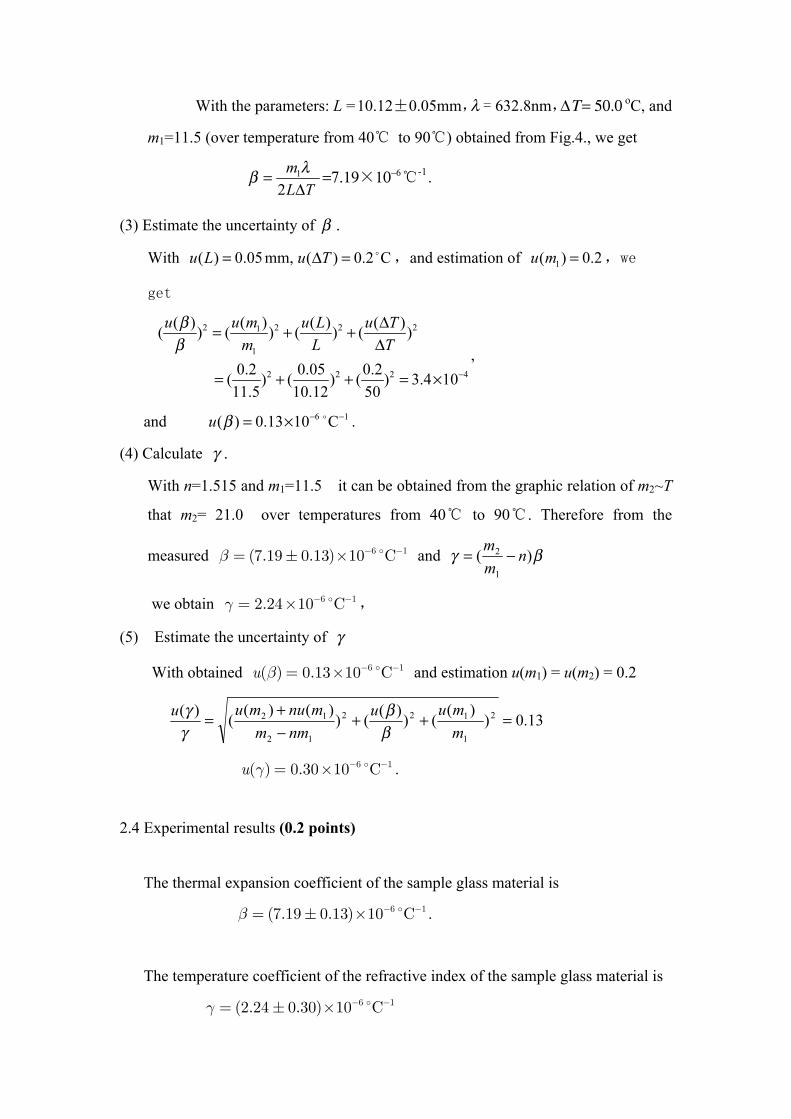
With the parameters: L =10.12±0.05mm,λ = 632.8nm,ΔΤ = 50.0 oC, and
m1=11.5 (over temperature from 40℃ to 90℃) obtained from Fig.4., we get
=7.19×10⁻⁶ ℃-1 .
(3) Estimate the uncertainty of β .
With mm, ,and estimation of ,we
get
,
and .
(4) Calculate .
With n=1.515 and m1=11.5 it can be obtained from the graphic relation of m2~T
that m2= 21.0 over temperatures from 40℃ to 90℃. Therefore from the
measured β = (7.19 ± 0.13)×10−6 C−1 and
we obtain γ = 2.24×10⁻⁶ C−1,
(5) Estimate the uncertainty of
With obtained u(β) = 0.13×10⁻⁶ C−1 and estimation u(m1) = u(m2) = 0.2
u(γ) = 0.30×10⁻⁶ C−1 .
2.4 Experimental results (0.2 points)
The thermal expansion coefficient of the sample glass material is
β = (7.19 ± 0.13)×10−6 C−1 .
The temperature coefficient of the refractive index of the sample glass material is
γ = (2.24 ± 0.30)×10−6 C−1

1
Solution of EX2
Measurement of liquid electric conductivity 1.Graph the experimental circuit diagram for scaling the sensor of liquid
conductivity and the connection of the circuit.
2. Measure for different standard resistors. Record the data in the Table
designed by yourself.
Vi(V) Vo(V) R(Ω) Vo / Vi 1 / R(S)
1.95 1.621 0.1 0.831 10.000 1.95 1.494 0.2 0.766 5.000 1.95 1.342 0.3 0.688 3.333 1.95 1.216 0.4 0.624 2.500 1.95 1.091 0.5 0.559 2.000 1.95 0.987 0.6 0.506 1.667 1.95 0.912 0.7 0.468 1.429 1.95 0.837 0.8 0.429 1.250 1.95 0.775 0.9 0.397 1.111 1.95 0.718 1.0 0.368 1.000 1.95 0.508 1.5 0.260 0.667 1.95 0.396 2.0 0.203 0.500 1.95 0.318 2.5 0.163 0.400 1.95 0.270 3.0 0.138 0.333 1.95 0.230 3.5 0.118 0.286 1.95 0.201 4.0 0.103 0.250 1.95 0.177 4.5 0.091 0.222
2
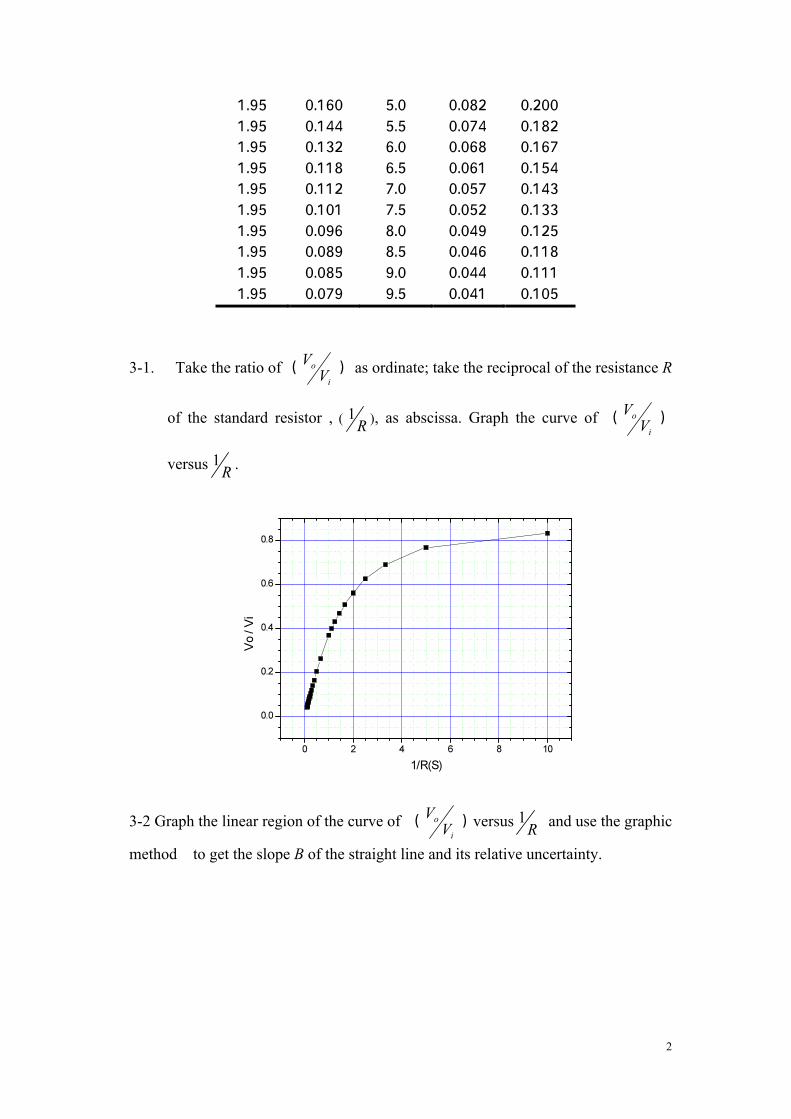
1.95 0.160 5.0 0.082 0.200 1.95 0.144 5.5 0.074 0.182 1.95 0.132 6.0 0.068 0.167 1.95 0.118 6.5 0.061 0.154 1.95 0.112 7.0 0.057 0.143 1.95 0.101 7.5 0.052 0.133 1.95 0.096 8.0 0.049 0.125 1.95 0.089 8.5 0.046 0.118 1.95 0.085 9.0 0.044 0.111 1.95 0.079 9.5 0.041 0.105
3-1. Take the ratio of ( ) as ordinate; take the reciprocal of the resistance R
of the standard resistor , ( ), as abscissa. Graph the curve of ( )
versus .
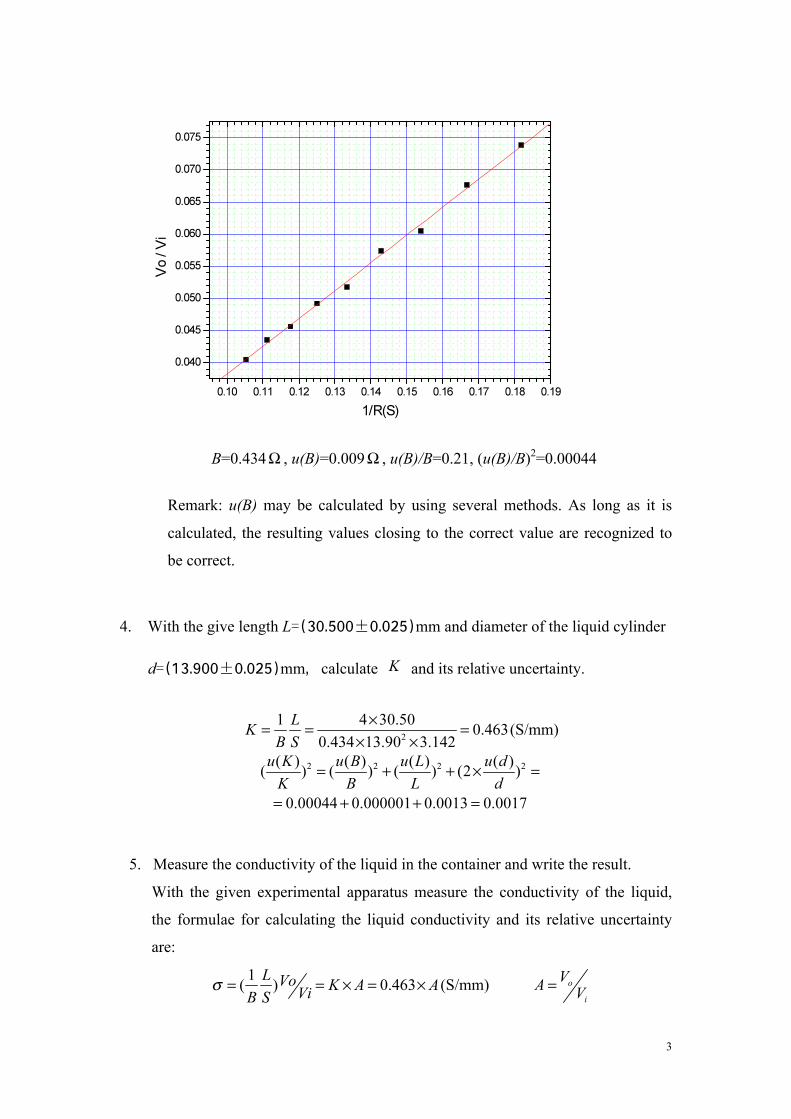
3-2 Graph the linear region of the curve of ( )versus and use the graphic
method to get the slope B of the straight line and its relative uncertainty.
3
B=0.434 , u(B)=0.009 , u(B)/B=0.21, (u(B)/B)2=0.00044
Remark: u(B) may be calculated by using several methods. As long as it is
calculated, the resulting values closing to the correct value are recognized to
be correct.
4. With the give length L=(30.500±0.025)mm and diameter of the liquid cylinder
d=(13.900±0.025)mm,calculate and its relative uncertainty.
(S/mm)
5. Measure the conductivity of the liquid in the container and write the result.
With the given experimental apparatus measure the conductivity of the liquid,
the formulae for calculating the liquid conductivity and its relative uncertainty
are:
(S/mm)

4
Repeat the measurement of for six times. The resulting data suggested are
listed in the Table below:
Vi(V) Vo(V) Vo / Vi
1.95 0.037 0.0190 1.95 0.037 0.0190 1.95 0.037 0.0190 1.95 0.037 0.0190 1.95 0.038 0.0195 1.95 0.038 0.0195
(S/mm)
, , ,
(S/mm)
Therefore the measured conductivity of the liquid is:
or 。
Remark: The above experimental data are obtained with a homogeneous solution after stirring, and the solute is salt (NaCl, 100mL), while the solvent is water (700mL,10.1oC).