Solidification Stresses and Hot Tearing in Solidifying...
24
ANNUAL REPORT 2008 UIUC, August 6, 2008 Matthew Rowan (Ph.D. Student) Department of Mechanical Science and Engineering University of Illinois at Urbana-Champaign Solidification Stresses and Hot Tearing in Solidifying Steel Shells University of Illinois at Urbana-Champaign • Metals Processing Simulation Lab • M Rowan 2 Background • Stress develops in solidifying shell in CC due to: – 1) Thermal loading – 2) Mechanical loading • Phenomena: – Thermal contraction – Phase transformation – Temperature gradients – Interface friction • Leads to Cracks – Internal hot tears – Surface cracks C. Bernhard and G. Xia, Ironmaking and Steelmaking, 2006
Transcript of Solidification Stresses and Hot Tearing in Solidifying...

ANNUAL REPORT 2008UIUC, August 6, 2008
Matthew Rowan (Ph.D. Student)
Department of Mechanical Science and Engineering
University of Illinois at Urbana-Champaign
Solidification Stresses and Hot
Tearing in Solidifying Steel Shells
University of Illinois at Urbana-Champaign • Metals Processing Simulation Lab • M Rowan 2
Background
• Stress develops in solidifying shell in CC due to: – 1) Thermal loading – 2) Mechanical loading
• Phenomena:– Thermal contraction– Phase transformation– Temperature gradients– Interface friction
• Leads to Cracks– Internal hot tears– Surface cracks C. Bernhard and G. Xia, Ironmaking
and Steelmaking, 2006

University of Illinois at Urbana-Champaign • Metals Processing Simulation Lab • M Rowan 3
Steel Shrinkage Varies with Composition
Fe-C equilibrium phase diagram
MoCrSiNiMnCcp %1.0%04.0%1.0%04.0%04.0% ⋅−⋅−⋅−⋅+⋅+=
Cp wt.-%
T,
°Cδ
δ+L
γ γ+L
L
γδ +
1536
1495
1393
0,1 0,17 0,5
C. Bernhard, Univ. Leoben, 2002
University of Illinois at Urbana-Champaign • Metals Processing Simulation Lab • M Rowan 4
SSCT Experiment
INDUCTION FURNACE
STEEL MELT(20kg, CONTROLLED
SUPER HEAT)
TEST DUMMY
140
5637Dimensions in [mm]
C. Bernhard, Univ. Leoben, 2007

University of Illinois at Urbana-Champaign • Metals Processing Simulation Lab • M Rowan 5
SSCT Experiment Operation
60
Spray CoatedZr-Oxide
(0.4 +/- 0.02mm)
Isolation
Data Acquisition
LoadCell
TemperatureMeasurement
Thermal Contraction
C. Bernhard, Univ. Leoben, 2007
University of Illinois at Urbana-Champaign • Metals Processing Simulation Lab • M Rowan 6
Measurements from Each Experiment
• Alloy composition
• Pour temperature
• Temperature Histories (2 thermocouples)– Inside Cylinder (2mm from exterior face)
– Melt (16-20mm from exterior face)• Varies with each test
• Final Shell Thickness
• Force History (load cell)

University of Illinois at Urbana-Champaign • Metals Processing Simulation Lab • M Rowan 7
Objectives
1) Create thermal-mechanical model of temperature & stress-strain behavior of the steel solidification experiment (cylinder & shell)
2) Validate model with all measurements
3) Plot model stress / strain histories to better understand experiment
4) Evaluate crack criteria
- compare model predictions based on previous crack criteria with crack measurements (this work and previous)
University of Illinois at Urbana-Champaign • Metals Processing Simulation Lab • M Rowan 8
Solution Procedure
• Thermal stress analysis model in ABAQUS– Temperature determines stress
– Employ user subroutines for constitutive equations and 2-level local integration method (Koric, 2006)
• Temperature, strain-rate, phase-, and C content dependant

University of Illinois at Urbana-Champaign • Metals Processing Simulation Lab • M Rowan 9
Model Assumptions
Assumptions:- axisymmetry
- no contact resistances at interface
- no heat transfer prior to t=0
- melt TC indicates time of start and end of test
- force data used in the event TC data failure
- no heat loss to container walls or top surface
- initial temp-gradient across Zr
- for stress convergence
- shell thickness defined at solid fraction = 0.1
- zero displacement of cylinder at immersion surface
University of Illinois at Urbana-Champaign • Metals Processing Simulation Lab • M Rowan 10
Model Validation – Analytical Solution
• Boley and Weiner
Twall = 1000 oC41.6
0.4Tinitial = 1495 oC
Units [mm]
oC1000Mold Temperature
oC1495Initial Temperature
GPa15Elastic Modulus above
Solidus Temp
GPa40Elastic Modulus at Mold
Temp.
kPa35Yield Stress above Solidus
Temp.
MPa20Yield Stress at Mold Temp.
--0.3Poisson’s Ratio
m/(moC)2.00E-05Coefficient of Expansion
W/(m-K)33Thermal Conductivity
kJ/kg272Latent Heat
J/(kg-K)661Specific Heat
kg/m37500Density
UnitsValueProperty
Tsol = 1494.38 oCTliq = 1494.48 oCTwall = 1000 oC, h = 220 kW/(m2-K)

University of Illinois at Urbana-Champaign • Metals Processing Simulation Lab • M Rowan 11
Temperature ValidationTemperature Profile Validation
1100
1150
1200
1250
1300
1350
1400
1450
1500
0 5 10 15 20 25
Time [sec]
Tem
per
atu
re [
oC
]
B&W 5mm
ABAQUS 5mm
B&W 10 mm
ABAQUS 10 mm
B&W 30mm
ABAQUS 30mm
University of Illinois at Urbana-Champaign • Metals Processing Simulation Lab • M Rowan 12
Stress Validation
Stress through the Plate Thickness
-20
-15
-10
-5
0
5
10
15
0 4 8 12 16 20
Distance Beneath Shell Surface (mm)
Str
ess
(MP
a)
Numerical 1s Analytical 1s2s 2s5s 5s10s 10s20s 20s30s 30s

University of Illinois at Urbana-Champaign • Metals Processing Simulation Lab • M Rowan 13
Shell Growth Validation
Shell Thickness Growth
02
46
810
1214
1618
20
0 5 10 15 20 25 30
Time (s)
Sh
ell
Th
ickn
ess (m
m)
Analytical Solution
Numerical Solution
University of Illinois at Urbana-Champaign • Metals Processing Simulation Lab • M Rowan 14
Verification – Tension Test
• Data based on experiments by Wray (1976)
• Abaqus with UMAT (Koric)
• Temperatures – 950 oC, 1100 oC
• Strain Rate – 1.4 x 10⁻⁴ [1/sec]
u (t)
36.8
3.2
( ) tL εtu 0=
Dimensions in [mm]

University of Illinois at Urbana-Champaign • Metals Processing Simulation Lab • M Rowan 15
Constitutive Equations for Solid Steel
University of Illinois at Urbana-Champaign • Metals Processing Simulation Lab • M Rowan 16
950 oC, 1.2 x 10⁻⁴ 1/s
Plastic strain
0.000 0.005 0.010 0.015 0.020 0.025 0.030
Str
ess,
MP
a
0
5
10
15
20
25
0.005% C - numerical0.005% C - experimental0.46% C - numerical0.46% C - experimental1.24% C - numerical1.24% C - experimental
Tensile Test Simulation
1100 oC, 1.2 x 10⁻⁴ 1/s
Plastic Strain
0.000 0.005 0.010 0.015 0.020 0.025 0.030
Str
ess
, M
Pa
0
2
4
6
8
10
12
14
0.005% C - numerical 0.005% C - experimental0.46% C - numerical0.46% C - experimental1.24% C - numerical1.24% C - experimental

University of Illinois at Urbana-Champaign • Metals Processing Simulation Lab • M Rowan 17
Provided Data• Alloying content
– C, Si, Mn, P, S, Ni• Combined to form ‘Cp’
– Crack formation sensitive to this factor
• Temperature– 2 locations in the test cylinder
• 2mm from molten steel interface
– 2 locations in the steel melt• Test dependent
– 16-20 mm from test cylinder
• Shell Thickness
• Force
Image Source:http://www.xnqy.cn/shebei1-e.htm
University of Illinois at Urbana-Champaign • Metals Processing Simulation Lab • M Rowan 18
SSCT Model Domain
C. Bernhard, Univ. Leoben, 2007
60
University of Illinois at Urbana-Champaign • Metals Processing Simulation Lab • M Rowan 19
2D Domain of Experimental Apparatus
No flux boundary conditions
No axial (y) displacement at top face of the cylinder
Axisymmetric elements (4 nodes)
Tinitial, steel melt ~1540 oC (1535-1548)Tinitial, test cylinder =25 oC
Mesh size biased to regionsof solidification and large temperature gradients
0.04mm plasma-sprayed zirconia layer at test cylinder and melt interface
Steel MeltTest Cylinder
Air Gap
University of Illinois at Urbana-Champaign • Metals Processing Simulation Lab • M Rowan 20
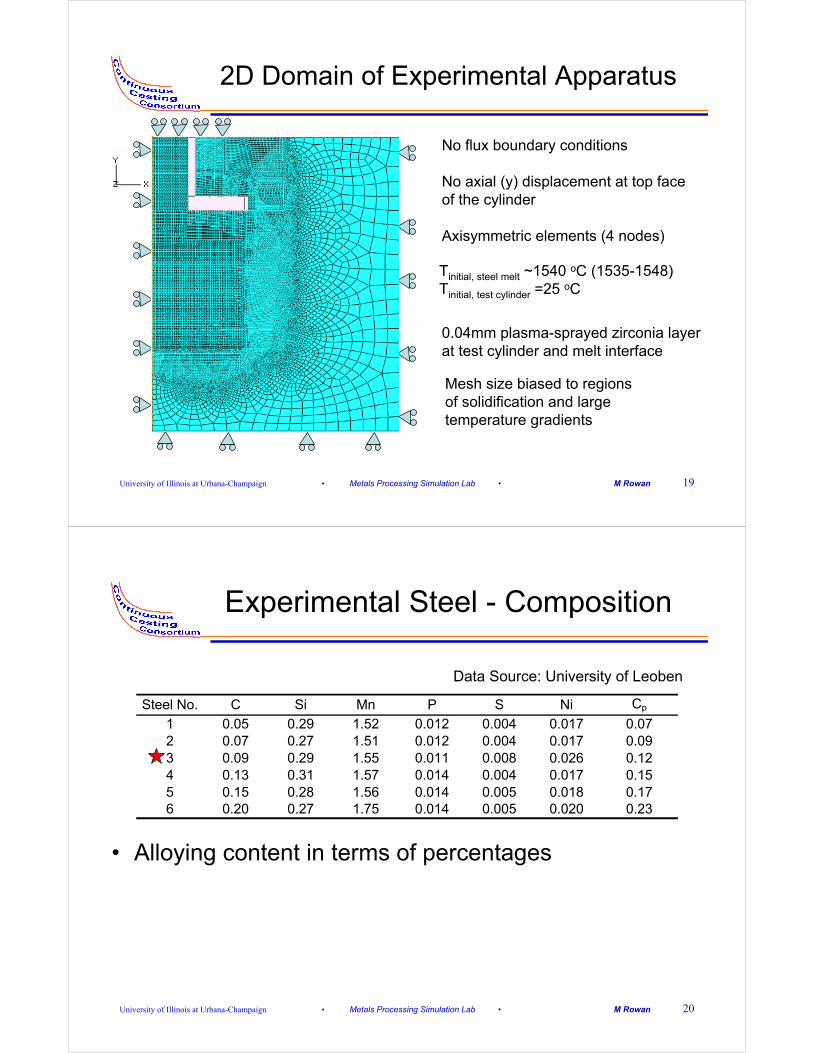
Experimental Steel - Composition
Steel No. C Si Mn P S Ni Cp
1 0.05 0.29 1.52 0.012 0.004 0.017 0.072 0.07 0.27 1.51 0.012 0.004 0.017 0.093 0.09 0.29 1.55 0.011 0.008 0.026 0.124 0.13 0.31 1.57 0.014 0.004 0.017 0.155 0.15 0.28 1.56 0.014 0.005 0.018 0.176 0.20 0.27 1.75 0.014 0.005 0.020 0.23
• Alloying content in terms of percentages
Data Source: University of Leoben

University of Illinois at Urbana-Champaign • Metals Processing Simulation Lab • M Rowan 21
Background – Experimental Conditions
19.8*
18.7*
20.3
24.6
19.6
24.7
Immersion Time*[sec]
15451508.7, 1454
8.750.236
15351513.5, 1467.8
8.90.175
15431514.8, 1470.2
10.140.154
15481518.1, 1476.3
8.50.123
15371520.1, 1486.6
8.760.092
15471521.5, 1494
8.80.071
Temperature (Pour, Liquidus, Solidus) [oC]
Shell Thickness
[mm]CpTest #
*(Derived from Melt TC, except tests 5&6 used estimated finish time)
University of Illinois at Urbana-Champaign • Metals Processing Simulation Lab • M Rowan 22
Temperature and Force Profile (Raw Data), Steel Test 3
0
500
1000
1500
2000
2500
3000
3500
4000
0 10 20 30
Raw Time Data [sec]
Fo
rce
[N]
0
200
400
600
800
1000
1200
1400
1600
Tem
per
atu
re [
oC
]
Force
Temperature
Sharp increase indicates immersion
t ~ 8.1 sec
Removal initiates t ~ 32.7 sec
Total simulation time
0 24.6Simulation time (s)-8.1
Sample Data File

University of Illinois at Urbana-Champaign • Metals Processing Simulation Lab • M Rowan 23
Data and Simulation Comparison
• Temperature history– Immersion (raw data, t ≠ 0) indicates time at which
simulation begins (simulation time, t = 0)
• Test completed when:– 1) Melt thermocouple temperature decreases
– 2) Force data decreases (indicated by those running the experiment)
• Neglect transient effect of immersing and extracting – ~2.5 seconds for immersion
– ~2.5 seconds for extraction
University of Illinois at Urbana-Champaign • Metals Processing Simulation Lab • M Rowan 24
Simulation Initiation
Temperature in the Steel Melt, 16 mm, Steel Test 3
0
200
400
600
800
1000
1200
1400
1600
1800
-10 -5 0 5 10 15 20 25 30
Simulation Time [sec]
Te
mp
era
ture
[oC
]
TM1
Simulation
tsimulation = 0 sectraw data = 8.1 sec
Simulation starts when temperature sharply increases
University of Illinois at Urbana-Champaign • Metals Processing Simulation Lab • M Rowan 25
Temperature Inside Test Cylinder, Test 3
0
100
200
300
400
500
600
700
-10 -5 0 5 10 15 20 25 30
Simulation Time [sec]
Te
mp
era
ture
[oC
]
TC1
TC2
Simulation
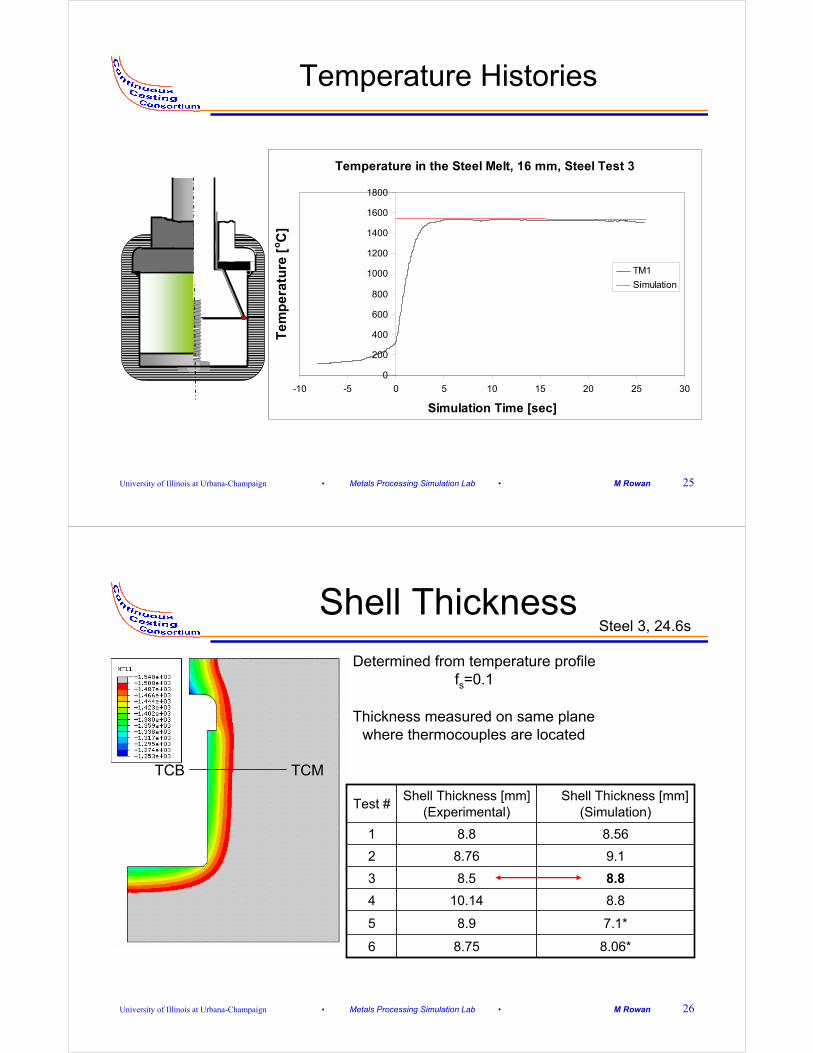
Temperature in the Steel Melt, 16 mm, Steel Test 3
0
200
400
600
800
1000
1200
1400
1600
1800
-10 -5 0 5 10 15 20 25 30
Simulation Time [sec]
Te
mp
era
ture
[oC
]TM1
Simulation
Temperature Histories
60
University of Illinois at Urbana-Champaign • Metals Processing Simulation Lab • M Rowan 26
Shell Thickness
Thickness measured on same planewhere thermocouples are located
Determined from temperature profilefs=0.1
TCB TCM
8.75
8.9
10.14
8.5
8.76
8.8
Shell Thickness [mm](Experimental)
8.06*6
7.1*5
8.84
8.83
9.12
8.561
Shell Thickness [mm](Simulation)
Test #
Steel 3, 24.6s
University of Illinois at Urbana-Champaign • Metals Processing Simulation Lab • M Rowan 27
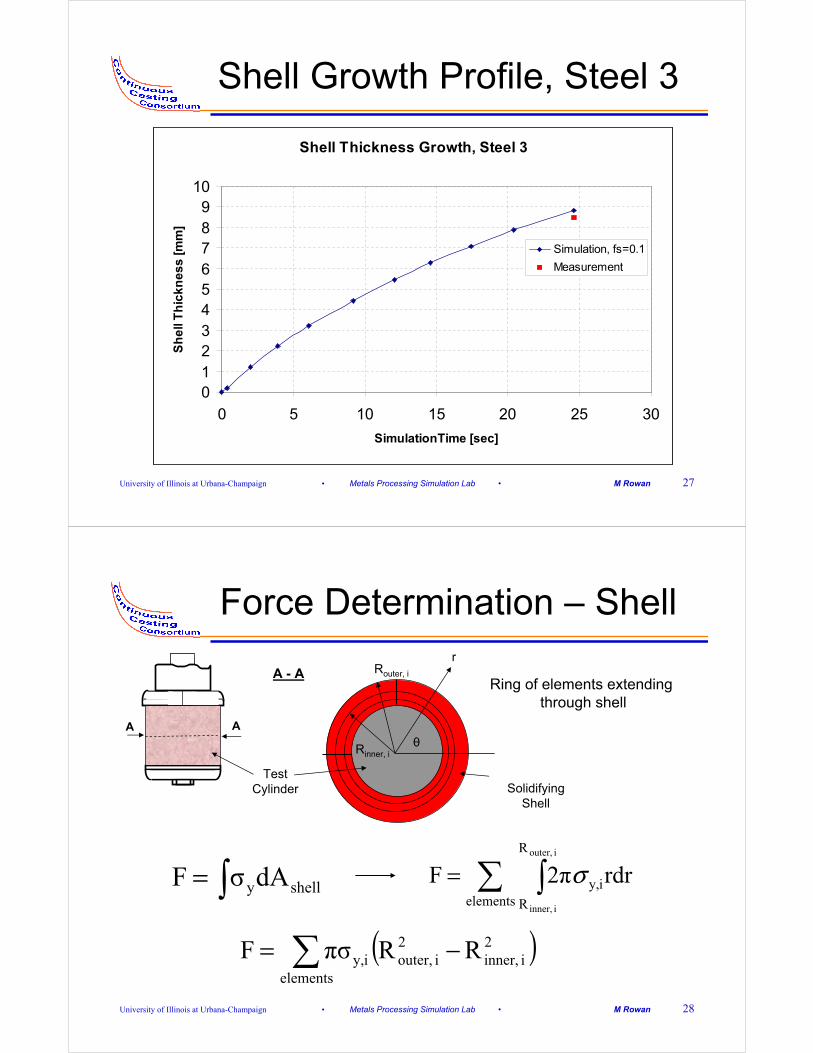
Shell Growth Profile, Steel 3
Shell Thickness Growth, Steel 3
0123456789
10
0 5 10 15 20 25 30
SimulationTime [sec]
Sh
ell
Th
ick
ne
ss
[m
m]
Simulation, fs=0.1
Measurement
University of Illinois at Urbana-Champaign • Metals Processing Simulation Lab • M Rowan 28
Force Determination – Shell
shellydAσF ∫= ∑ ∫=elements
R
Riy,
i outer,
i inner,
rdr2πF σ
( )∑ −=elements
2i inner,
2i outer,iy, RRπσF
Test Cylinder
r
Ring of elements extending through shell
SolidifyingShell
θ
Router, i
Rinner, i
A - A
A A

University of Illinois at Urbana-Champaign • Metals Processing Simulation Lab • M Rowan 29
Axial Stress Distribution in Shell (Steel 3, t= 24.6 sec)
Note: Previous researchersonly look at one location
Delta Ferrite(1518.1 T > 1463 oC)
University of Illinois at Urbana-Champaign • Metals Processing Simulation Lab • M Rowan 30
Shell Strength
• Different phases present across the shell thickness
• Increase in strength occurs during phase transformation of delta ferrite to austenite
• Location of maximum force in shell may change during solidification– Multiple locations investigated

University of Illinois at Urbana-Champaign • Metals Processing Simulation Lab • M Rowan 31
Phase Fraction for 0.09% C Plain Carbon Steel
0
0.1
0.2
0.3
0.4
0.5
0.6
0.7
0.8
0.9
1
600 800 1000 1200 1400 1600
Temperature [oC]
Phas
e Fr
actio
n
Alpha
Gamma Austenite
Delta Ferrite
Liquid
University of Illinois at Urbana-Champaign • Metals Processing Simulation Lab • M Rowan 32
Axial Stress Distribution in Shell (Steel 3, t= 24.6 sec)
1
8Location of Maximum Strength
Changes During Simulation
University of Illinois at Urbana-Champaign • Metals Processing Simulation Lab • M Rowan 33
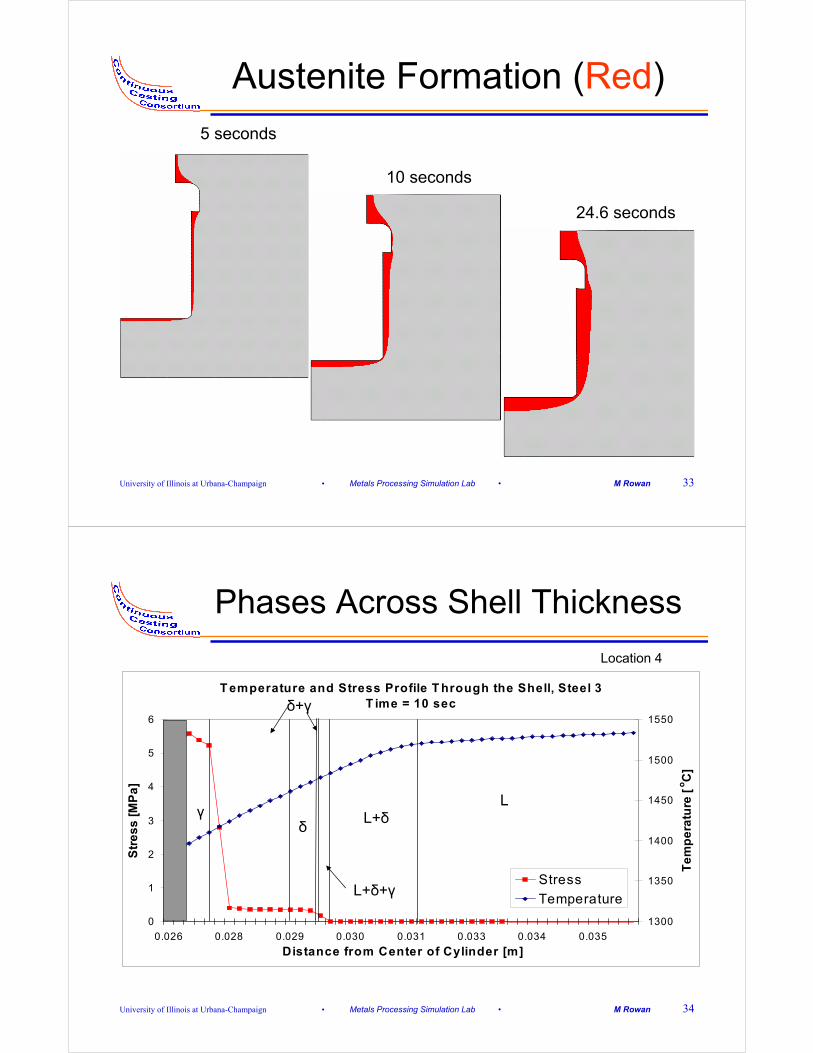
Austenite Formation (Red)5 seconds
10 seconds
24.6 seconds
University of Illinois at Urbana-Champaign • Metals Processing Simulation Lab • M Rowan 34
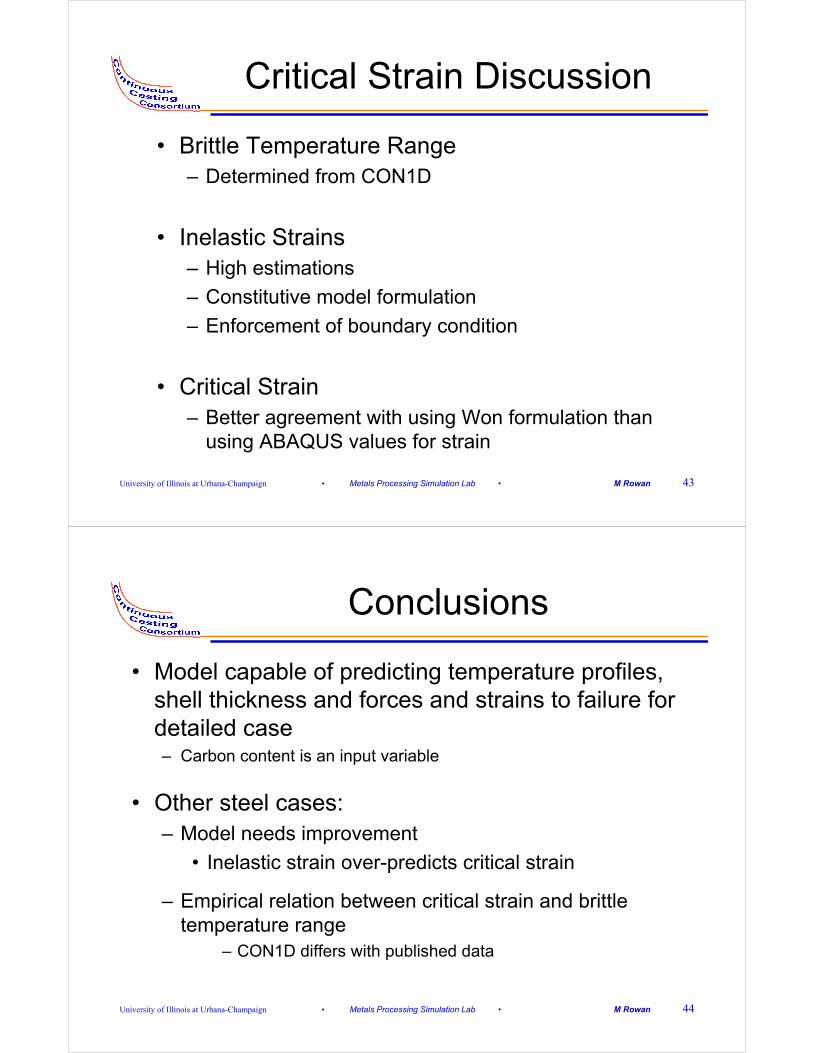
Phases Across Shell Thickness
T emperature and Stress Profile T hrough the Shell, Steel 3T ime = 10 sec
0
1
2
3
4
5
6
0.026 0.028 0.029 0.030 0.031 0.033 0.034 0.035
Distance from Center of Cylinder [m]
Str
es
s [
MP
a]
1300
1350
1400
1450
1500
1550
Te
mp
era
ture
[oC
]
Stress
Temperature
LL+δ
L+δ+γ
δ+γ
δγ
Location 4

University of Illinois at Urbana-Champaign • Metals Processing Simulation Lab • M Rowan 35
Shell Strength, Steel 3
Comparison of Shell Strengths vs. Location
0
500
1000
1500
2000
2500
-10 -5 0 5 10 15 20 25 30 35
Time [sec]
Fo
rce
[N
]
Experiment
1
2
3
4
5
6
7
8
Comparison of Experimental and Maximum Shell Strength
0
500
1000
1500
2000
2500
-10 -5 0 5 10 15 20 25 30 35
Time [sec]
Fo
rce
[N]
Experiment
Maximum Force
University of Illinois at Urbana-Champaign • Metals Processing Simulation Lab • M Rowan 36
Shell Strength Analysis
• Maximum shell strength depends on:– Heat transfer
– Temperature
– Formation of austenite
• Thickest shell section is not the strongest

University of Illinois at Urbana-Champaign • Metals Processing Simulation Lab • M Rowan 37
Hot Tearing Mechanisms
#) P.-D. Grasso, J.-M. Drezet and M. Rappaz, January 2002 JOM-e: http://www.tms.org/pubs/journals/JOM/0201/Grasso/Grasso-0201.html
Breaking of solid-solid bridges (Verö, 1936)Liquid film rupture (Pellini, 1952)Liquid distribution between dendrites/grains (Borland 1960)
Still basis of most hot tearing criteria
Segregation is important to hot tearing in steel (Bernhard, Pierer, 2007)Modeling of HTS in CC process as segregation phenomenon
#)
University of Illinois at Urbana-Champaign • Metals Processing Simulation Lab • M Rowan 38
Hot Tear Crack Prediction
• Simulations do not take cracking into account– Cracking indicated by ‘plateau’ in force measurement
data
• Time when simulation starts to deviate from experimental forces likely indicates start of crack formation
• To predict cracks: compare calculated and critical strain

University of Illinois at Urbana-Champaign • Metals Processing Simulation Lab • M Rowan 39
Calculation of Critical Strain
• Equation fit over large range of strain rates and cooling rates– (5 – 90 x 10-4 1/sec)
• ΔTB = Brittle temperature difference– Temperature difference between 90% and 99% solid
fraction
• Strain rate found from simulation* Won, MY, Yeo, TJ, Seol, DJ and Oh, KH, “A New Criterion for Internal Crack Formation in Continuously Cast Steels”, Met. Trans. B, Vol. 31B, 2000, pp. 779-94
0.3131 0.8638
0.02821crit
BTε
ε=
Δ*
University of Illinois at Urbana-Champaign • Metals Processing Simulation Lab • M Rowan 40
Inelastic Strain at Failure, t = 10 sec, Steel 3
12.2 % strain
6.2 % strain

University of Illinois at Urbana-Champaign • Metals Processing Simulation Lab • M Rowan 41
Summary of Critical Strain Results
2.99.4x10-4121470.161514.84
3.96.4x10-4101467.841513.475
2.68.7x10-4141476.261518.083
3.98.6x10-491493.991521.51
εcritε. (1/sec)ΔTbrittle
(oC)Tsol (oC)Tliq (oC)Steel #
University of Illinois at Urbana-Champaign • Metals Processing Simulation Lab • M Rowan 42
Critical Strain as a Function of Carbon Content
0
1
2
3
4
5
6
7
0 0.05 0.1 0.15 0.2 0.25
Carbon Content (% C)
Cri
tica
l S
trai
n (
%)
Simulation, Won Eqn.Simulation, ABAQUSMatsumiya, 1986
Critical Strain as a Function of Carbon Content
University of Illinois at Urbana-Champaign • Metals Processing Simulation Lab • M Rowan 43
Critical Strain Discussion
• Brittle Temperature Range – Determined from CON1D
• Inelastic Strains– High estimations
– Constitutive model formulation
– Enforcement of boundary condition
• Critical Strain– Better agreement with using Won formulation than
using ABAQUS values for strain
University of Illinois at Urbana-Champaign • Metals Processing Simulation Lab • M Rowan 44
Conclusions
• Model capable of predicting temperature profiles, shell thickness and forces and strains to failure for detailed case– Carbon content is an input variable
• Other steel cases:– Model needs improvement
• Inelastic strain over-predicts critical strain
– Empirical relation between critical strain and brittle temperature range
– CON1D differs with published data

University of Illinois at Urbana-Champaign • Metals Processing Simulation Lab • M Rowan 45
What We Need to Improve
• Need more certain values of experimental conditions– Pour Temperature (superheat )
• Shell thickness
– Experiment Duration
– Initial temperature of test cylinder• Time between tests?
– Multiple tests of one specific alloy to determine variance
University of Illinois at Urbana-Champaign • Metals Processing Simulation Lab • M Rowan 46
Acknowledgements
• Continuous Casting Consortium Members
• Christian Bernhard & Robert Pierer– University of Leoben
• National Center for Supercomputing Applications (NCSA) at UIUC
• ABAQUS
University of Illinois at Urbana-Champaign • Metals Processing Simulation Lab • M Rowan 47
Supplemental Material
University of Illinois at Urbana-Champaign • Metals Processing Simulation Lab • M Rowan 48
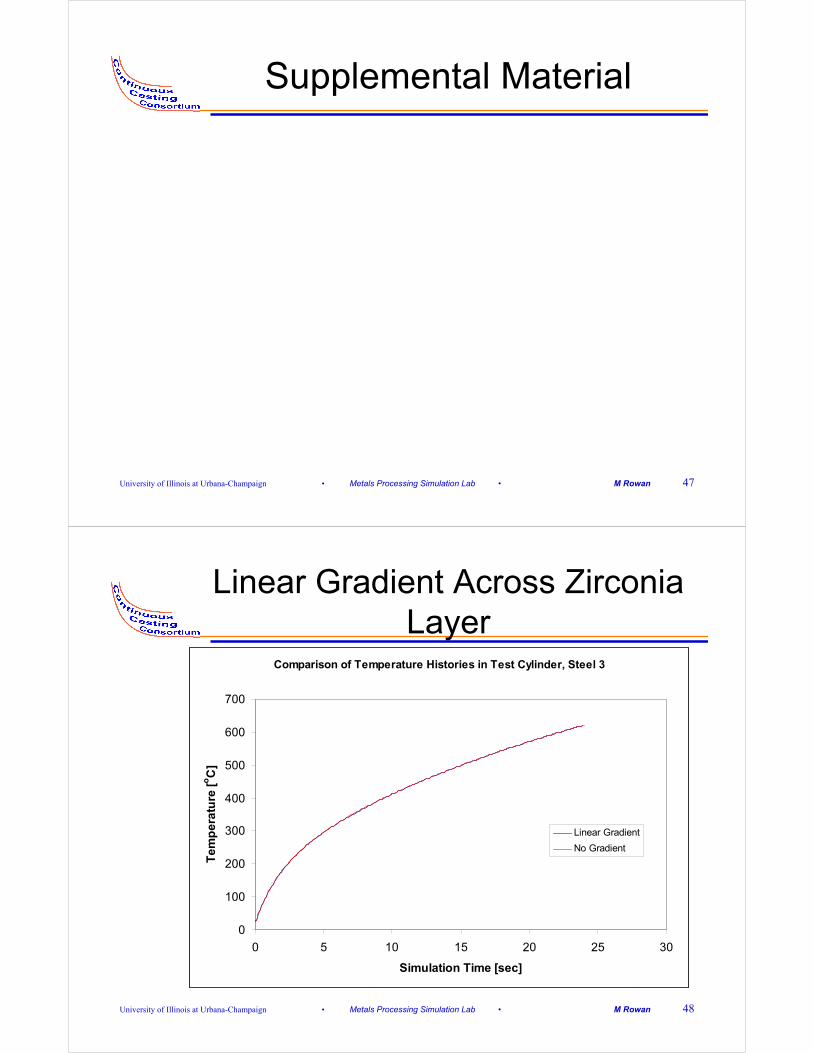
Linear Gradient Across Zirconia Layer
Comparison of Temperature Histories in Test Cylinder, Steel 3
0
100
200
300
400
500
600
700
0 5 10 15 20 25 30
Simulation Time [sec]
Te
mp
era
ture
[oC
]
Linear Gradient
No Gradient