Solidification Cracking Mechanism of Carbon Steel Weld … · passes were used to study the effect...
10
WELDING RESEARCH FEBRUARY 2018 / WELDING JOURNAL 55-s Introduction To date, many papers have report- ed the effect of S and/or P content on solidification cracking susceptibility of carbon steel weld metals. For ex- ample, Senda et al. observed that the solidification cracking susceptibility of carbon steel weld metal increased with increasing S and P contents while using Trans-Varestraint testing (Refs. 1, 2). Masumoto and Ozaki found that the solidification cracking susceptibility of carbon steel weld metal increased for >0.1 wt-% C in carbon steel due to the formation of S compounds on the grain boundaries, but the influence of P content on so- lidification cracking susceptibility was low (Ref. 3). Tamaki et al. reported that the cause of solidification crack- ing of carbon steel weld metals was segregation of P and S, as impurity el- ements along the grain boundaries, and that S assisted the harmful effect of P (Ref. 4). Randall et al. found that solidification cracking was not ob- served in structural low-alloy steels containing <0.03 wt-% of S and P dur- ing submerged arc welding (Ref. 5). From these studies, it is generally agreed that the solidification cracking susceptibility of carbon steels increas- es with increasing S and/or P content, and decreases in S and P contents of carbon steel weld metals seem to pre- vent solidification cracking. The present authors have used low C, low S, and P filler metal wire for welding of low/medium carbon steels with different C contents for many years without observing solidification cracking. The ranges of C content for low and medium carbon steels, are 0.2 wt-% or less and 0.32 to 0.38 wt-%, re- spectively. However, solidification cracking was recently observed in a weld metal using the same materials in combination with new welding param- eters. In this case, the S and P con- tents were approximately 0.005 and 0.015 wt-%, respectively. The S and P contents of these carbon steels were much lower than those of the test ma- terials used in the earlier quoted re- search. Therefore, it was assumed that the detected solidification cracking was associated with specific welding parameters. Some researchers have reported that solidification cracking susceptibility of carbon steels depends on the welding conditions (Refs. 6–8). Khallaf et al. evaluated the influence of welding pa- rameters on solidification cracking sus- ceptibility using a medium-carbon steel during submerged arc welding. Solidifi- cation cracking susceptibility of the weld metal decreased with decreasing welding current or increasing travel speed (Ref. 7). However, the effects of the welding parameters on solidification cracking susceptibility of the carbon Solidification Cracking Mechanism of Carbon Steel Weld Metal The solidification cracking mechanism of weld metal for low S/P carbon steels with different carbon content has been clarified BY T. AMAYA, T. YONEZAWA, K. OGAWA, M. J. PELTONEN, AND H. HÄNNINEN ABSTRACT It is well known that the solidification cracking susceptibility of carbon steel weld metal increases with increasing Sulfur (S) and Phosphorus (P) contents. However, solidification cracking was detected in the weld metal of low/medium carbon (C) steels welded by low-carbon welding wire, even in low S/P content steels, after changing the welding parameters. To clarify the mechanism of solidi- fication cracking of the weld metal for low S/P, low/medium carbon steels welded by low-C welding wire, the effect of travel speed on solidification cracking susceptibility was studied, and the S and/or P compounds formed on the solidifi- cation cracks were identified by energy-dispersive x-ray spectroscopy (EDS) and Auger electron spectroscopy (AES). The solidification cracking susceptibility of the weld metal increased with increasing travel speed. The C content of the weld metal also increased with the increasing travel speed, but the S/P contents did not change at any of the studied travel speeds. The S compounds were detected on the solidification cracks. It was concluded that the S content in the remaining liquid phase in the solid-liquid region increases with increasing travel speed due to the increasing amount of the austenite phase formed during the peritectic re- action. In this way, the solidification cracking susceptibility of carbon steel increased with increasing travel speed. KEYWORDS • Carbon Steel • Carbon Content • Weld Solidification Cracking • Peritectic Reaction • Travel Speed • Sulfur Compound
Transcript of Solidification Cracking Mechanism of Carbon Steel Weld … · passes were used to study the effect...

WELDING RESEARCH
FEBRUARY 2018 / WELDING JOURNAL 55-s
Introduction
To date, many papers have report-ed the effect of S and/or P content onsolidification cracking susceptibilityof carbon steel weld metals. For ex-ample, Senda et al. observed that thesolidification cracking susceptibilityof carbon steel weld metal increasedwith increasing S and P contentswhile using Trans-Varestraint testing(Refs. 1, 2). Masumoto and Ozakifound that the solidification crackingsusceptibility of carbon steel weldmetal increased for >0.1 wt-% C in
carbon steel due to the formation of Scompounds on the grain boundaries,but the influence of P content on so-lidification cracking susceptibility waslow (Ref. 3). Tamaki et al. reportedthat the cause of solidification crack-ing of carbon steel weld metals wassegregation of P and S, as impurity el-ements along the grain boundaries,and that S assisted the harmful effectof P (Ref. 4). Randall et al. found thatsolidification cracking was not ob-served in structural low-alloy steelscontaining <0.03 wt-% of S and P dur-ing submerged arc welding (Ref. 5). From these studies, it is generally
agreed that the solidification crackingsusceptibility of carbon steels increas-es with increasing S and/or P content,and decreases in S and P contents ofcarbon steel weld metals seem to pre-vent solidification cracking. The present authors have used lowC, low S, and P filler metal wire forwelding of low/medium carbon steelswith different C contents for manyyears without observing solidificationcracking. The ranges of C content forlow and medium carbon steels, are 0.2wt-% or less and 0.32 to 0.38 wt-%, re-spectively. However, solidificationcracking was recently observed in aweld metal using the same materials incombination with new welding param-eters. In this case, the S and P con-tents were approximately 0.005 and0.015 wt-%, respectively. The S and Pcontents of these carbon steels weremuch lower than those of the test ma-terials used in the earlier quoted re-search. Therefore, it was assumed thatthe detected solidification crackingwas associated with specific weldingparameters. Some researchers have reported thatsolidification cracking susceptibility ofcarbon steels depends on the weldingconditions (Refs. 6–8). Khallaf et al.evaluated the influence of welding pa-rameters on solidification cracking sus-ceptibility using a medium-carbon steelduring submerged arc welding. Solidifi-cation cracking susceptibility of theweld metal decreased with decreasingwelding current or increasing travelspeed (Ref. 7). However, the effects ofthe welding parameters on solidificationcracking susceptibility of the carbon
Solidification Cracking Mechanism ofCarbon Steel Weld Metal
The solidification cracking mechanism of weld metal for low S/P carbon steelswith different carbon content has been clarified
BY T. AMAYA, T. YONEZAWA, K. OGAWA, M. J. PELTONEN, AND H. HÄNNINEN
ABSTRACT It is well known that the solidification cracking susceptibility of carbon steelweld metal increases with increasing Sulfur (S) and Phosphorus (P) contents.However, solidification cracking was detected in the weld metal of low/mediumcarbon (C) steels welded by low-carbon welding wire, even in low S/P contentsteels, after changing the welding parameters. To clarify the mechanism of solidi-fication cracking of the weld metal for low S/P, low/medium carbon steels weldedby low-C welding wire, the effect of travel speed on solidification crackingsusceptibility was studied, and the S and/or P compounds formed on the solidifi-cation cracks were identified by energy-dispersive x-ray spectroscopy (EDS) andAuger electron spectroscopy (AES). The solidification cracking susceptibility ofthe weld metal increased with increasing travel speed. The C content of the weldmetal also increased with the increasing travel speed, but the S/P contents didnot change at any of the studied travel speeds. The S compounds were detectedon the solidification cracks. It was concluded that the S content in the remainingliquid phase in the solid-liquid region increases with increasing travel speed dueto the increasing amount of the austenite phase formed during the peritectic re-action. In this way, the solidification cracking susceptibility of carbon steelincreased with increasing travel speed.
KEYWORDS • Carbon Steel • Carbon Content • Weld Solidification Cracking • Peritectic Reaction • Travel Speed • Sulfur Compound
AMAYA ET AL FEB 2018 SUPP_Layout 1 1/11/18 3:45 PM Page 55

steel weld metal with different C con-tents has not yet been examined. Also,the identification of S and/or P com-pounds formed along the dendriteboundaries of low S and P content weldmetals has not been systematically ex-amined to our knowledge. Therefore, to clarify the mechanismof solidification cracking of low S and Pcarbon steels with different C contentsfor the present study, the effect of travelspeed on solidification cracking suscep-tibility was studied, and the S and/or Pcompounds formed on the fracture sur-faces of the solidification cracks wereidentified using energy-dispersive x-rayspectroscopy (EDS) and Auger electronspectroscopy (AES).
Experimental Procedures
Test Materials, Test Coupons,Fixture Design, and WeldingConditions
Solidification cracking susceptibili-ty was evaluated using welding testmock-ups made of two types of testmaterials and a conventional weldingwire with different carbon contents.The chemical compositions of a low-Csteel L-C, a medium-C steel M-C, and a1.4-mm-diameter welding wire (AWSA5.18/A5.18M.) are listed in Table 1. The welding test mock-up configu-ration, fixture design, and weld beadlocations were determined from pre-liminary testing with a travel speed of34 cm/min, as follows: 1) Test materials of steels L-C andM-C were cut into the test couponswith dimensions of 300 mm in length 50 mm in width. The thicknesses ofthe three test coupons were 20, 40,and 80 mm. Grooves of 6 mm in width 12 mm in depth for steel L-C, and 3mm in width 12 mm in depth forsteel M-C, were milled on one side ofthe test coupons. The other three sidesof the test coupons were machined to10 mm in thickness and 15 mm inwidth, as shown in Fig. 1A. 2) The welding test mock-ups wereassembled from steel L-C and M-C testcoupons, and butt-joint welded usingthe low-C welding wire. The testcoupons were thoroughly cleaned withacetone prior to welding, then re-strained between backing restrainingplates in the fixture. All bolts were
torqued to a fixed value to ensure con-sistent restraint conditions, as shownin Fig. 1B. 3) The weld beads were built up bytwo passes in the groove of the butt-welded joints to study solidificationcracking susceptibility of the 1st and
2nd pass weld beads. The welding beadlocation was 1 mm from the center to-ward steel M-C for the 1st pass and 5mm from the center toward steel M-Cfor the 2nd pass. In this study, three mock-ups andweld bead locations for the 1st and 2nd
WELDING RESEARCH
WELDING JOURNAL / FEBRUARY 2018, VOL. 9756-s
Fig. 1 — Schematic illustrations of the mock-ups for weld solidification cracking sus-ceptibility testing: A — The configurations of test coupons for assembling themock-up; B — assembled welding test mock-up (test coupons were restrained bybolts and restraining plates on a strong back); C — welding sequence for 1st and 2nd
pass weld beads on the groove of test coupons L-C and M-C, and their bead lengthand location.
A
B
C
Table 1 — Chemical Compositions of the Test Materials (wt-%)
C Si Mn P S Ti + Zr
Steel L-C 0.12 0.14 1.20 0.019 0.002 — Steel M-C 0.34 0.24 0.82 0.013 0.003 — Filler Metal 0.06 0.61 1.16 0.012 0.006 0.10
AMAYA ET AL FEB 2018 SUPP_Layout 1 1/11/18 3:45 PM Page 56

passes were used to study the effect oftravel speed on solidification crackingsusceptibility.
Six travel speeds were then used toevaluate their influence on solidifica-tion cracking susceptibility (Table 2).
The travel speed was chosen in therange of 20 to 80 cm/mm compared to34 cm/min used in the preliminarytesting. Three kinds of two-pass weld beadswere built up at different locations bydifferent travel speeds in the grooves ofthe welding test mock-ups, as shown inFig. 1C. These build-up beads were 50mm long with a spacing of 40 mm. Thewelding order of these build-up beadswas changed as follows. The first weldbeads were built up in the center part ofthe mock-up. Then, the second weldbeads were applied to the right side ofthe test mock-up, and the third weldbeads were applied on the left side ofthe test mock-up. The interpass temper-ature for the 2nd pass weld beads wascontrolled to about 100˚C and moni-tored by a noncontact infrared radiationthermometer. The interpass tempera-ture was measured from the industrialwelded structure, where solidificationcracks were observed in the 1st and 2nd
pass weld beads. In addition, this tem-perature is used in practical auto weld-ing machines without observing coldcracking or other weld defects. The
WELDING RESEARCH
FEBRUARY 2018 / WELDING JOURNAL 57-s
Fig. 2 — Typical solidification cracks in the 1st and 2nd pass weld beads: A — Opti-cal microscopy of the cross section of the 1st and 2nd pass weld beads; B — SEMimage of the solidification crack surface in the 1st pass weld bead; C — IPF EBSDmap near the solidification crack tip in the 2nd pass weld bead.
A C
B
Table 2 — Welding Parameters for the 1st and 2nd Pass Weld Beads between Test Coupons L-C and M-C
Current (A) Voltage (V) Travel Speed (cm/min) Heat Input (kJ/mm)
Case 1 20 25.5 Case 2 27 18.9 Case 3 34 15.0 Case 4 300 28.3 49 10.4 Case 5 64 8.0 Case 6 80 6.4
6.5 m/min wire feed speed.100C interpass temperature for the 2nd pass weld bead.Ar-20% CO2 shielding gas.
AMAYA ET AL FEB 2018 SUPP_Layout 1 1/11/18 3:45 PM Page 57
shielding gas was Ar-20% CO2 using ametal active gas semiautomatic weldingmachine. In this way, by using the sametype of welding test mock-ups, the ef-fect of six travel speeds on solidificationcracking susceptibility was evaluated.
Observation of SolidificationCracking and Analysis ofChemical Composition of theWeld Metal
The welding test mock-ups, includ-ing the three buildup weld beads, werecut into three pieces containing eachbuildup weld bead. Each of thesepieces was then cut into two speci-mens at the center of the length ofeach weld bead. One side of the testspecimens of each of the buildup weldbeads was polished by emery paperand diamond paste, and then etchedby 2–3% Nital solution for metallogra-phy. Solidification cracks were exam-ined on cross sections of polished andetched test specimens by optical mi-croscopy, scanning electron mi-croscopy (SEM), EDS, and electronbackscatter diffraction (EBSD) using aHitachi SU-70 electron microscope. The opposite sides of each testspecimen of the buildup beads wereground by a SiC grinder. For thesespecimens, glow discharge opticalemission spectrometry (GDOES) usinga GD-Profiler2 provided quantitativeanalysis of the chemical compositionof the weld metal. It is believed thatthe amount of low-C welding wire andthe dilution ratios of steels L-C and M-C in the weld pool change due to thetravel speed. Therefore, the location ofthe GDOES analysis was at the centerof the weld metal to measure thechanges of the chemical compositionby the travel speed. Before the analy-ses, quantitative GDOES calibrationcurves for the emission intensities ofC, Si, Mn, P, and S were obtained usingfive different commercial carbonsteels.
Analysis of S and PCompounds onSolidification Cracks
To analyze any S and/or P com-pounds at the solidification crack tipsby EDS, test specimens with solidifica-tion cracks in the analyzed location
were cut from the larger solidificationcrack containing pieces. These speci-mens were ground and polished byemery paper and diamond paste. In addition, the S and/or P com-pounds on the fracture surfaces of so-lidification cracks were analyzed byAES using a ULVAC-PHI SAM680Auger spectrometer. The 2-mm-diameter test specimens for AES weremachined containing solidificationcracks in the analyzed location of theweld metal. The AES test specimenswere fractured by the tensile testingmachine within the AES spectrometerat a slow strain rate of 0.001 mm/minin an ultrahigh vacuum. The in-situfracture surface of a solidificationcrack was then studied to identify theS and P compounds.
Results
Solidification CrackingSusceptibility Testing UsingWeld Mock-Ups
Figure 2A shows solidificationcracks in the 1st and 2nd pass weldbeads prepared at the 34 cm/min trav-el speed on 20-mm-thick test coupons.Few solidification cracks were ob-served in the 1st and 2nd pass weldbeads. Figure 2B shows a SEM imageof a solidification crack surface. Thedendrite structure was observed onthe fracture surface. In addition, Fig.
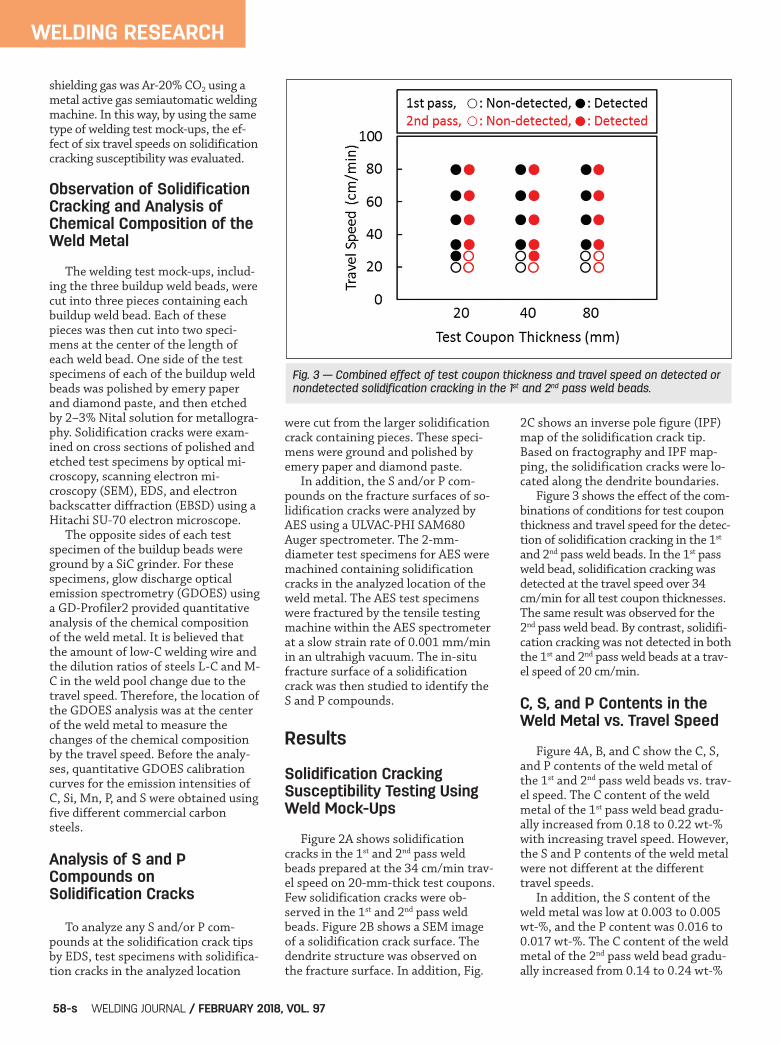
2C shows an inverse pole figure (IPF)map of the solidification crack tip.Based on fractography and IPF map-ping, the solidification cracks were lo-cated along the dendrite boundaries. Figure 3 shows the effect of the com-binations of conditions for test couponthickness and travel speed for the detec-tion of solidification cracking in the 1st
and 2nd pass weld beads. In the 1st passweld bead, solidification cracking wasdetected at the travel speed over 34cm/min for all test coupon thicknesses.The same result was observed for the2nd pass weld bead. By contrast, solidifi-cation cracking was not detected in boththe 1st and 2nd pass weld beads at a trav-el speed of 20 cm/min.
C, S, and P Contents in theWeld Metal vs. Travel Speed
Figure 4A, B, and C show the C, S,and P contents of the weld metal ofthe 1st and 2nd pass weld beads vs. trav-el speed. The C content of the weldmetal of the 1st pass weld bead gradu-ally increased from 0.18 to 0.22 wt-%with increasing travel speed. However,the S and P contents of the weld metalwere not different at the differenttravel speeds. In addition, the S content of theweld metal was low at 0.003 to 0.005wt-%, and the P content was 0.016 to0.017 wt-%. The C content of the weldmetal of the 2nd pass weld bead gradu-ally increased from 0.14 to 0.24 wt-%
WELDING RESEARCH
WELDING JOURNAL / FEBRUARY 2018, VOL. 9758-s
Fig. 3 — Combined effect of test coupon thickness and travel speed on detected ornondetected solidification cracking in the 1st and 2nd pass weld beads.
AMAYA ET AL FEB 2018 SUPP_Layout 1 1/11/18 3:45 PM Page 58

C with increasing travel speed, as alsoobserved in the 1st pass weld bead. TheS and P contents of the weld metalwere not different at the differenttravel speeds. The S content of the 2nd
pass weld bead was low at 0.004 to0.006 wt-%, and the P content was0.016 to 0.017 wt-%.
Total Length of SolidificationCracks vs. C Content of theWeld Metal
The total length of the solidifica-tion cracks was determined to com-pare the solidification cracking suscep-tibility and the C content of the weldmetal. The total length of the solidifi-cation cracks in the 1st and 2nd passweld beads depended on the C contentof the weld metal, as shown in Fig. 5.In addition, it can be seen that the to-tal length of the solidification cracksin the 1st and 2nd pass weld beads in-creased above approximately 0.18 wt-% C content in the weld metal.
S and PCompoundsFormed onSolidificationCracks
EDS maps of iron(Fe), manganese(Mn), S, and P wereobtained to identifythe segregation ofthese elements near
the solidification crack tips. Figure 6shows SEM images and EDS maps ofthese elements. Particles of MnS weredetected on the fracture surfaces of thesolidification cracks. By contrast, phos-phorous was not detected on the solidi-fication cracks. The AES maps of Fe, Mn, S, and Pas well as spectrum analyses were usedto identify the segregation of elementsat the fracture surface of the solidifica-tion cracks. Figure 7A shows an SEMimage and AES maps of these ele-ments on the fracture surface of thesolidification cracks after tensile test-ing at a slow strain rate in an ultrahighvacuum. In the AES maps of Fe, Mn, S,and P on the solidification crack frac-ture surfaces, higher, lower, and verylow concentrations of S were detectedon points (a), (b), and (c), respectively. There is a correlation between thehigh S and Mn locations, which is evi-dence for the MnS particles beingformed on the fracture surfaces of thesolidification cracks. In part of the
fracture surface, which is surroundedby a yellow rectangle in Fig. 7A, onlyiron was detected and Mn, S, and Pwere not present at that location. Itwas concluded that this location wasnot a solidification crack but a me-chanically fractured region during thetensile testing. By contrast, phospho-rous was not detected by AES on thefracture surface of the solidificationcracks. Figure 7B shows the result of AESspectrum analyses at the points (a)and (b). Peaks of S, chlorine (Cl), C, ni-trogen (N), Mn, and Fe were observed,but the peak for carbide was not ob-served at points (a) and (b). Therefore,the peaks of C, Cl, and N may havebeen partly due to contamination. Theatomic concentrations of Mn and Swere estimated with the peaks of Mnand S from the AES spectrum analysesto determine the S compound atpoints (a) and (b) based on theISO18118:2015 standard. Accordingto ISO18118:2015, the atomic concen-tration of the element on the surfaceis given by
where Xi is the atomic concentration ofthe element; i Ii; and Ij are measuredpeak intensities of elements i and j;and SiRSF and SjRSF are the relative sensi-
Xi =
IiSiRSF
�
���
��
j=1n�
I jS jRSF
�
���
�
���
(1)
WELDING RESEARCH
FEBRUARY 2018 / WELDING JOURNAL 59-s
Fig. 4 — Chemical composition of the weld metal of the 1st
and 2nd pass weld beads vs. travel speed: A — Carbon con-tent; B — sulfur content; C — phosphorus content.
A B
C
AMAYA ET AL FEB 2018 SUPP_Layout 1 1/11/18 3:45 PM Page 59

tivity factors for elements i and j. Therelative sensitivity factor SiRSF is ob-tained with the following equation:
where Iiref is the peak intensity of thepure element i, and Ikey is the measuredpeak intensity of the key material. Therelative sensitivity factors of Mn and Swere 0.122 and 0.652, respectively,which are taken from the database ofPHI MultiPakTM version 9. Pure silverwas used as Ikey to estimate the relativesensitivity factor of Mn and S in thedatabase. Table 3 shows the results of the esti-mated peak intensities of Mn and Sfrom the AES spectrum analyses andthe atomic concentrations of Mn and Sat points (a) and (b) in Fig. 7B. The Mnand S concentrations were 54.3 and45.7 at.-%, respectively, at point (a). Asthe Mn concentration was higher thanthe S concentration, the S compoundwas considered to be MnS. By contrast,the Mn and S concentrations were 45.5and 54.5 at.-%, respectively, at point(b). Because the S atomic concentrationwas higher than the Mn concentration,the S compound was considered to alsocontain FeS, i.e., the compound can berepresented by (Fe, Mn)S.
Discussion
Effect of S and Mn/S Ratioon Solidification CrackingSusceptibility of CarbonSteel Weld Metal
Ohshita et al. and Shankar et al. re-ported that the solidification crackingsusceptibility in the case of 0.05 to 0.1wt-% C steels can be attributed to theadditional shrinkage strains associatedwith ferrite to austenite transforma-tion taking place within the brittlenesstemperature range during solidification(Refs. 6, 9). By contrast, Bailey et al. re-ported that the solidification crackingwas promoted by C, S, and P. In addi-tion, reducing the C content below 0.08wt-% gave no further improvement incracking resistance, although carbonpromoted solidification cracking (Ref.10). In the case of 0.08 wt-% C or less, ferrite + austenite formed from the -
ferrite phase during the peritectic reac-tion (Ref. 11). In the case of 0.08 to0.16 wt-% C, ferrite + austeniteformed from liquid + ferrite. The dif-ference between these phase transfor-mations is the presence of the liquid
phase. It is assumed that the solidifica-tion cracking susceptibility is attributedto the decreasing solidification temper-ature due to segregation of impurity el-ements to the liquid phase when morethan 0.08 wt-% C. The solidification
SiRSF =IirefIkey
(2)
WELDING RESEARCH
WELDING JOURNAL / FEBRUARY 2018, VOL. 9760-s
Fig. 5 — Correlation between the total crack length of solidification cracks in the 1st
and 2nd pass beads vs. C content of the weld metal.
Table 3 – Estimated Mn and S Concentration (at.-%) on the Fracture Surfaces ofSolidification Cracks, the Relative Sensitivity Factors, and the Peak Intensities ofMn and S for AES Spectrum Analysis
Peak Intensity(a) Atomic Concentration (at.-%)(b)
IMn IS XMn XS
Point (a) 23122 104126 54.3 45.7
Point (b) 6290 40316 45.5 54.5
(a) Measured peak intensity of Mn and S of AES spectrum analysis.(b) XMn or S are the atomic concentration of Mn and S based on the ISO18118:2015 standard.
is the relative sensitivity factor Mn 0.122.
is the relative sensitivity factor S 0.652.
Xi =
IiSiRSF
�
���
��
j=1n�
I jS jRSF
�
��
�
��
, i, j = Mn or S
SMnRSF
SSRSF
AMAYA ET AL FEB 2018 SUPP_Layout 1 1/11/18 3:45 PM Page 60

cracking susceptibility is associated withthe shrinkage strains in the weld metaldue to the austenite forming from the ferrite in the case of 0.08 wt-% C or less.In this study, C contents of the weldmetals were 0.14 to 0.24 wt-% and Scompounds were detected on the frac-ture surfaces of the solidification cracks,as shown in Fig. 7. Therefore, the effectof S in the weld metal on the solidifica-tion cracking susceptibility was studied.
Lancaster reported that an ade-quate amount of Mn tends to inhibitthe deleterious effect of S and that aMn/S (wt-%) ratio in carbon steel weldmetal of >50 reduces significantly so-lidification cracking susceptibility(Ref. 12). Senda et al. found that the solidifi-cation cracking occurs because of thelower solidification temperature of theFe-(Mn, Fe)S-(Fe, Mn)S ternary eutec-
tic in the solid-liquid region. By con-trast, the solidification temperature ofMnS particles is approximately1620˚C, which is higher than that ofthe ternary eutectic. Therefore, in-creasing amounts of Mn and S in thesolid-liquid region during solidifica-tion were studied to determine theequilibrium distribution coefficientsof these elements. The Mn content tothe fifth power vs. S (Mn5/S) was ob-served, independent of the solid phasepresent, to be the same compositionratio in the solid-liquid region. TheMn and S contents were examined toreduce solidification cracking suscepti-bility with Mn5/S as the preferredmeasure of solidification cracking sus-ceptibility. In the case of carbon steel,which contains approximately 1 wt-%Mn, Mn5/S (wt-%) ratios <14–26 in-creased solidification cracking suscep-tibility due to the low solidificationtemperature of the ternary eutectic.By contrast, Mn5/S (wt-%) ratios of310–560 reduced solidification crack-ing susceptibility due to MnS particleformation (Ref. 13). Both Mn/S and Mn5/S ratios wereestimated from the Mn and S contents(wt-%) of the weld metal as analyzedby GDOES. Table 4 shows the resultsfor the Mn/S and Mn5/S ratios of the
WELDING RESEARCH
FEBRUARY 2018 / WELDING JOURNAL 61-s
Fig. 6 — SEM image and EDS maps of Fe, Mn, S, and P of a solidification crack onthe cross section of the 1st pass weld bead.
Table 4 — Estimated Mn/S and Mn5/S Ratios of the Weld Metal as Potential Parameters to Determine the SolidificationCracking Susceptibility
Weld Bead Pass Travel Speed Mn/S Ratios(a) Mn5/S Ratios(b) Solidification Cracking(c)
(cm/min)
20 194 173 Nondetected 27 216 294 Detected 34 353 443 Detected 1st pass 49 247 235 Detected 64 198 188 Detected 80 243 217 Detected
20 164 154 Nondetected 27 214 283 Nondetected 34 267 347 Detected 2nd pass 49 215 288 Detected 64 253 267 Detected 80 177 226 Detected
(a) Mn vs. S ratio.Mn/S ratios above 50 reduce solidification cracking susceptibility (Ref. 9).
(b) Mn to the fifth power vs. S ratio. Mn5/S ratios of 310–560 reduce solidification cracking susceptibility (Ref. 10).
(c) Detected or nondetected solidification cracking on the cross section of weld metal.
AMAYA ET AL FEB 2018 SUPP_Layout 1 1/12/18 2:40 PM Page 61

weld metals for the test coupon thick-ness of 20 mm. The same tendencywas confirmed for the test coupons of40 and 80 mm in thickness. The Mn/Sratio was over 50 in the weld metalsfor all the travel speeds studied. However, solidification crackingwas detected in the 1st pass weld beadonly at travel speeds >27 cm/min andin the 2nd pass weld bead at travelspeeds >34 cm/min. In addition, thesolidification cracking susceptibilitywas not precisely determined by theMn5/S ratio. For example, solidifica-tion cracking was not detected in the1st pass weld bead at the travel speed20 cm/min, even though the Mn5/S ra-tio was not in the range 310–560. It isbelieved that the Mn/S and Mn5/S ra-tios do not take into account the dif-ferent solubility of S in ferrite and inaustenite. The amount of ferrite andaustenite phases depend on the C con-tent of the weld metal during the peri-tectic reaction. Consequently, the ef-fect of C content on the solidificationcracking susceptibility of the weldmetal during the peritectic reactionwas evaluated as follows.
Effect of Carbon Content onSolidification CrackingSusceptibility during thePeritectic Reaction
The relationship between the totallength of the solidification cracksformed in the test coupon of 20 mmthickness, and the C content of theweld metal, was evaluated using theperitectic reaction for the Fe-C binaryequilibrium phase diagram, as shownin Fig. 8 (Ref. 11). The equilibriumphase diagram is not directly applica-ble in the case of rapid solidification ofweld metal. Therefore, it was assumedthat the ratio of phases formed duringthe transformation does not changeeven though the peritectic reaction oc-curs by rapid solidification. The occur-rence of a peritectic reaction in thecase of rapid solidification is wellknown in the literature (Refs. 14–16). The amounts of ferrite or austen-ite phases in the solid-liquid regionduring the peritectic reaction changesas a function of the C content in thecarbon steel weld metal: 1) Region I (up to 0.08 wt-% C): -ferrite phase forms from (liquid +
ferrite), and then ( ferrite + austen-ite) forms from the -ferrite phase. 2) Region II (0.08 to 0.16 wt-% C):( ferrite + austenite) forms from (liq-uid + ferrite). 3) Region III (0.16 to 0.51 wt-%C):(austenite + liquid) forms from ( fer-rite + liquid). The ferrite forms as a solid phaseduring the peritectic reaction in Re-gions I and II. By contrast, in RegionIII, austenite phase forms in the solidi-fication reaction. The transformationratio of the austenite phase increaseswith increasing C content in the solid-liquid two-phase region of Region III.The solubility of S in the -ferrite phaseand austenite phase is 0.14 and 0.05wt-%, respectively, at the temperatureof 1365˚C. The solubility of S in theaustenite phase decreases with decreas-ing temperature from 1365˚ to 912˚C(Ref. 11). In addition, it is considered
that the austenite phase forms at thelower temperature due to undercoolingin the case of rapid solidification.Therefore, the austenite phase with lowsolubility of S forms in Region III. Forthese reasons, the S content in the re-maining liquid phase increases with in-creasing transformation ratio of theaustenite phase in the solid-liquid re-gion of Region III shown in Fig. 8. Fig-ure 7 shows that S compounds identi-fied as probably FeS and (Fe, Mn)S werepresent on most areas of the fracturesurfaces of solidification cracks. Matsuura et al. reported that FeSand (Fe, Mn)S on grain and dendriteboundaries form as the eutectic sulfideof Fe-MnS-FeS ternary eutectic (Ref.17). The solidification temperature ofthe eutectic is about 1000˚C, which ismuch lower than the solidificationtemperature of the carbon steel weldmetal (Ref. 18).
WELDING RESEARCH
WELDING JOURNAL / FEBRUARY 2018, VOL. 9762-s
Fig. 7 — SEM image, AES maps, and spectra on the fracture surface of a solidifica-tion crack of a tensile test specimen tested at a slow strain rate to fracture in anultrahigh vacuum: A — SEM image and AES maps of Fe, Mn, S, and P; B — AESspectra at points (a) and (b) of the SEM image.
A
B
AMAYA ET AL FEB 2018 SUPP_Layout 1 1/12/18 2:47 PM Page 62

In the case of Region III of Fig. 8,the S content in the remaining liquidphase increases with increasing trans-formation ratio of the austenite phasein the solid-liquid region. Therefore,the solidification cracking susceptibili-ty of the carbon steel weld metal in-creases with increasing C content dueto the decreasing solidification tem-perature of the Fe-MnS-FeS eutectic.By contrast, in the case of Regions Iand II, the S content in the remainingliquid phase decreases with increasingtransformation ratio of the -ferritephase in the solid-liquid region. Thus,solidification cracking susceptibility ofcarbon steel weld metal decreases withdecreasing C content. To verify the decreasing solidifica-tion cracking susceptibility of carbonsteel weld metal with decreasing Ccontent, the same experiments wereconducted using the steel L-C and thelow-C welding wire as shown in Table1. A travel speed of 80 cm/min wasused (Table 2). The thicknesses of thetest coupons were 20, 40, and 80 mm.Figure 9 shows the optical macro-graphs of the weld cross sections of0.23 and 0.11 wt-% C in the 1st pass, aswell as 0.24 and 0.11 wt-% C in the 2nd
pass weld metal, respec-tively, at the 80 cm/mintravel speed on a 20-mm-thick test coupon. Solidifi-cation cracking was notdetected at a low-C con-tent for both the 1st and2nd pass weld beads for thestudied plate thicknesses.The experimental resultswere in good agreementwith the decreasing solidi-
fication cracking susceptibility at alow-C content of the weld metal.
Effect of Travel Speed onSolidification CrackingSusceptibility of CarbonSteels with DifferentCarbon Contents
As a result of weld testing usingmock-ups (which consisted of the low-C steel L-C test coupon, and the medi-um-C steel M-C test coupon welded bythe low-C welding wire), the C contentof the weld metal increased with in-creasing travel speed, as shown in Fig.4. In addition, the S content in the 1st
and 2nd pass weld metals did notchange even when the travel speedchanged. These results are interpretedas follows: 1) The amount of low-C weldingwire per test coupon in the weld metaldecreased with increasing travel speed.Therefore, the C content of the weldmetal increased with the increasingtravel speed. 2) The S contents of steels L-C andM-C, and the welding wire were low.
Thus, the S and P contents in the weldmetal did not change with the travelspeed. The solidification cracking suscepti-bility increased with increasing C con-tent in Region III, as shown by the re-sults in Fig. 8. Therefore, the solidifi-cation cracking susceptibility of theweld metal increased with increasingtravel speed due to the increasingamount of the austenite phase formedin the solid-liquid region. It was considered that the solidifi-cation cracking susceptibility of theweld metal for different C content car-bon steels was affected by the travelspeed due to the change of C contentand the increasing amount of austen-ite phase formed in the weld metal,even though the S content was low. Bycontrast, in the case of a very low trav-el speed, it was believed that the solid-ification cracking susceptibility be-came low due to the decreasing C con-tent of the weld metal and the increas-ing amount of ferrite formed in thesolid-liquid region.
Conclusions
Carbon steels with low S and P con-tents can be susceptible to solidifica-tion cracking, when carbon steels withdifferent C contents are welded by alow-C welding wire. To clarify the mechanism of solidi-fication cracking of the low S and Pcarbon steels with different C con-tents, the effect of travel speed on so-lidification cracking susceptibility wasstudied together with the identifica-tion by EDS and AES of the S and/or P
WELDING RESEARCH
FEBRUARY 2018 / WELDING JOURNAL 63-s
Fig. 8 — Relationship between the total length of de-tected solidification cracks on the cross section ofweld metal and the C content of the equilibrium bi-nary Fe-C phase diagram.
Fig. 9 — Optical microscopy of the cross- section of 1st and 2nd passweld beads: A — 0.22 and 0.24 wt-% C in the 1st and 2nd pass weldbeads, respectively; B — 0.11 wt-% C in the 1st and 2nd pass weld beads.
A B
AMAYA ET AL FEB 2018 SUPP_Layout 1 1/11/18 3:45 PM Page 63

compounds formed on the fracturesurfaces of the solidification cracks. From these results, the followingmechanisms are considered to operate: In the case of the higher travelspeed, the amount of low-C weldingwire in the weld pool relative tolow/medium C base steels decreases,and the C content in the weld metalincreases with increasing travel speed.Therefore, in the solid-liquid region,the amount of austenite phase increas-es and the S content in the remainingliquid phase increases with the in-creasing travel speed. The solidifica-tion temperature decreases due to theformation of a Fe-MnS-FeS eutectic.Solidification cracking susceptibilitythen increases with increasing travelspeed. In the case of the lowest travelspeed, the amount of the welding wirein the weld pool relative to the basesteels increases and the C content inthe weld metal decreases. Therefore, inthe solid-liquid region, the amount ofthe -ferrite phase increases and the Scontent in the remaining liquid phasedecreases. Consequently, the solidifica-tion cracking susceptibility decreases.
1. Senda, T., Matsuda, F., Takano, G.,Watanabe, K., Kobayashi, T., and Matsuza-ka, T. 1972. Studies of solidification cracksusceptibility for weld metals with Trans-Varestraint test (1). J. Jpn. Weld. Soc. 41:
709–723 (in Japanese). 2. Senda, T., Matsuda, F., Nakagawa, H.,Watanabe, K., and Matsusaka, T. 1974.Sulphide and its effect on solidificationcracking in weld metal of steel (Report 5).J. Jpn. Weld. Soc. 43: 57–65 (in Japanese). 3. Masumoto, I., and Ozaki, H. 1973.Effect of carbon content on the hot crack-ing in solidified steel. J. Jpn. Weld. Soc. 42:674–684 (in Japanese). 4. Tamaki, K., Kawakami, H., and Suzu-ki, J. 2002. Effect of carbon content andperitectic reaction on the hot cracking ofweld metal of high carbon steel. J. Jpn.Weld. Soc. 20: 266–275 (in Japanese). 5. Randall, M. D., Monroe, R. E., andNichols, H. J. 1961. Study of the causes ofcracking in submerged-arc welds in con-structional alloy steels. Welding Journal40(9): 385-s to 392-s. 6. Ohshita, S., Yurioka, N., Mori, N.,and Kimura, T. 1983. Prevention of solidi-fication cracking in very low carbon steelwelds. Welding Journal 62(5): 129-s to 136-s. 7. Khallaf, M. E., Ibrahim, M. A., EI-Ma-hallawy, N. A., and Taha, M. A. 1997. Oncrack susceptibility in the submerged arcwelding of medium-carbon steel plates.Journal of Material Processing Technology68(1): 43–49. 8. Nelson, T. W., Lippold, J. C., Lin, W.,and Baeslack III, W. A. 1997. Evaluation ofthe circular patch test for assessing weldsolidification cracking, Part I — Develop-ment of a test method. Welding Journal76(3): 110-s to 119-s. 9. Shankar, V., and Devletian, J. H.2005. Solidification cracking in low alloysteels. Science and Technology of Welding andJoining 10: 236–243. 10. Bailey, N., and Jones, S. B. 1978.
The solidification cracking of ferritic steelduring submerged arc welding. WeldingJournal 57(8): 217-s to 231-s. 11. Baker, H., Okamoto, H., Henry, S.,Davidson, G., Fleming, M., Kacprzak, L.,Lampman, H., Scott, W. Jr., and Uhl, R.1992. ASM Handbook, Vol. 3, Alloy PhaseDiagrams, 0-87170-381-5. ASM Interna-tional, Materials Park, Ohio. 12. Lancaster, J. F. 1999. Metallurgy ofWelding, 6th Ed. Abington Publishing, Cam-bridge, England. 13. Senda, T., Matsuda, F., Nakagawa,H., Watanabe, K., and Matsusaka, T. 1974.Sulphide and its effect on solidificationcracking in weld metal of steel (Report 7).J. Jpn. Weld. Soc. 43: 57–65 (in Japanese). 14. Fredriksson, H., and Stjerndahl, J.1982. Solidification of iron-base alloys.Material Science 16: 575–585. 15. Shibata, H., Arai, Y., Suzuki, M., andEmi, T. 2000. Kinetics of peritectic reac-tion and transformation in Fe-C alloys.Metallurgical and Materials Transaction B31B: 981–991. 16. Phelan, D., and Li, H. 2016. K-TIGwelding of peritectic steels. Proceedings ofthe 69th IIW Annual Assembly and Interna-tional Conference, Melbourne, Australia. 17. Matsuura, K., Ito, Y., and Matsub-ara, K. 1998. Effects of composition andcooling rate on the solidification tempera-ture range of carbon steel. Bulletin of Facul-ty of Engineering, Hokkaido University, No.143, pp. 1–12 (in Japanese). 18. Vogel, R., and Hotop, W. 1937/1938. The phase diagram of the iron-ironsulphide-manganese sulphide manganesesystem (in German). Archiv für das Eisen-hüttenwesen 11: 41–54.
WELDING RESEARCH
WELDING JOURNAL / FEBRUARY 2018, VOL. 9764-s
TORU AMAYA is with HEDC, Caterpillar Japan LLC, Akashi, Japan. TOSHIO YONEZAWA is with FRI, NICHe, Tohoku University, Sendai, Japan.KAZUHIRO OGAWA is with FRI, Graduate School of Engineering, Tohoku University, Sendai, Japan. MIKKO J. PELTONEN and HANNU HAN-NINEN are with Aalto University School of Engineering, Espoo, Finland.
References
..
AMAYA ET AL FEB 2018 SUPP_Layout 1 1/11/18 3:45 PM Page 64