Solidification Analysis of Investment Cast Knee Joint Implant
7
www.ijsret.org 24 International Journal of Scientific Research Engineering & Technology (IJSRET), ISSN 2278 – 0882 Volume 4, Issue 1, January 2015 Solidification Analysis of Investment Cast Knee Joint Implant Mrs. M. S.Shirke 1 , Prof. (Dr.) V.D.Shinde 2 1 Student, Textile and Engineering Institute, Ichalkaranji, Maharashtra, 2 Professor, Textile and Engineering Institute, Ichalkaranji, Maharashtra ABSTRACT Nowadays in manufac turing field, time and money saving has become a prime importance because of tough competition. In investment casting process, the manufacturer has to go through many trials to a sound cast component. Main objective of investment casting process is to form intricate shapes. Knee joint implant is one of the intricate shapes which are planted in the human body when the knee joint fails. Thus knee joint implant because of its intricacy is manufactured by investment casting. To avoid number of trials, simulation software will be used to achieve defect free implant casting. Main objective of this project is to know the solidification behavior in the knee implant cast component with different process parameters. Use of simulation software reduces the trial cost and helps to design correct method with minimizing melt scrap of defective castings. The key process parameters under investigation are pouring time, pouring temperature, mould preheating temperature and firing temperature. The output criteria such as material density, Critical Fraction Solid Time (CFST), Niyama criterion and temperature gradient were studied for solidification analysis of knee implant cast component. Keywords - Modeling software, investment casting, simulation, p rocess pa rameters, Niyama c riterion. 1. INTRODUCTION Casting, one of the economical manufacturing processes used in industries, is a complicated process, which involves considerable metallurgical and mechanical aspects [1]. The rate of solidification governs the microstructure largely, which in turn controls the mechanical properties like strength, hardness, machinability, etc. The location, size and shape of riser in a casting depend on the geometry of the casting, mould design and thermal properties of metal, old and other process parameters [2]. Wrong designed riser results either defective casting with shrinkage cavity or lower yield, as directional solidification has not achieved. There are number of casting simulation software are developed and are used in foundry worldwide. The application of casting simulation software’s are also increasing day to day in Indian foundry as it essentially replaces or minimizes the shop floor trials to achieve the desired internal quality at the highest possible time[3]. Recently, due to the development of computer technology, an effort is done to predict casting defects directly as a consequence of the physical phenomena that are involved. A modeling approach based on an improved description of the physical proce sses has become a more realistic, prac tical and straightforward option. Shrinkage related defects result from the interplay of phenomena such as fluid flow, heat transfer with solidification, feeding flow and its free surfaces, deformation of the solidified layers and so on. 2. CASTING SOLIDIFICATION SIMULATION Computer simulation provides a clear insight regarding the location and extent of internal defects, ensuring castings. It requires a 3D CAD model of the method layout (with mold cavities, cores, feeders, and gating channels), proper setting of boundary conditions for each virtual trial, and correct interpretation of results. In the past the foundryma n have strived for ways to improve the casting process and eliminate the defects that occurred in the castings by trial and error and past experiences. The time needed to produce a particular product is a time-consum ing process. Problems occu rred in the casting may only be solved through trial and error. Scientists throughout the years have studied the science of casting and metallurgy and developed theories and mathematical models to explain the properties of metals while going through the solidification process. Simulation programs were developed from these methods which are useful in predicting how the casting will come out. Defects and problems can be discovered before the actual casting is cast avoiding costly tests to prevent the problems. Fig.1 shows the steps involved in simulation process.
Transcript of Solidification Analysis of Investment Cast Knee Joint Implant
8/20/2019 Solidification Analysis of Investment Cast Knee Joint Implant
http://slidepdf.com/reader/full/solidification-analysis-of-investment-cast-knee-joint-implant 1/7
www.ijsret.org
International Journal of Scientific Research Engineering & Technology (IJSRET), ISSN 2278 – 0882
Volume 4, Issue 1, January 2015
Solidification Analysis of Investment Cast Knee Joint Implant
Mrs. M. S.Shirke1, Prof. (Dr.) V.D.Shinde
2
1Student, Textile and Engineering Institute, Ichalkaranji, Maharashtra,2Professor, Textile and Engineering Institute, Ichalkaranji, Maharashtra
ABSTRACT Nowadays in manufacturing field, time and money
saving has become a prime importance because of toughcompetition. In investment casting process, themanufacturer has to go through many trials to a sound
cast component. Main objective of investment casting process is to form intricate shapes. Knee joint implant is
one of the intricate shapes which are planted in thehuman body when the knee joint fails. Thus knee joint
implant because of its intricacy is manufactured byinvestment casting. To avoid number of trials,simulation software will be used to achieve defect free
implant casting. Main objective of this project is toknow the solidification behavior in the knee implant cast
component with different process parameters. Use ofsimulation software reduces the trial cost and helps todesign correct method with minimizing melt scrap ofdefective castings. The key process parameters underinvestigation are pouring time, pouring temperature,
mould preheating temperature and firing temperature.The output criteria such as material density, CriticalFraction Solid Time (CFST), Niyama criterion andtemperature gradient were studied for solidificationanalysis of knee implant cast component.
Keywords - Modeling software, investment casting, simulation, process parameters, Niyama criterion.
1. INTRODUCTIONCasting, one of the economical manufacturing processes
used in industries, is a complicated process, whichinvolves considerable metallurgical and mechanicalaspects [1]. The rate of solidification governs themicrostructure largely, which in turn controls themechanical properties like strength, hardness,
machinability, etc. The location, size and shape of riserin a casting depend on the geometry of the casting,mould design and thermal properties of metal, old andother process parameters [2]. Wrong designed riserresults either defective casting with shrinkage cavity or
lower yield, as directional solidification has notachieved. There are number of casting simulation
software are developed and are used in foundry
worldwide. The application of casting simulationsoftware’s are also increasing day to day in Indianfoundry as it essentially replaces or minimizes the shop
floor trials to achieve the desired internal quality at thehighest possible time[3]. Recently, due to thedevelopment of computer technology, an effort is doneto predict casting defects directly as a consequence of
the physical phenomena that are involved. A modelingapproach based on an improved description of the
physical processes has become a more realistic, practica
and straightforward option. Shrinkage related defectsresult from the interplay of phenomena such as fluid
flow, heat transfer with solidification, feeding flow andits free surfaces, deformation of the solidified layers andso on.
2. CASTING SOLIDIFICATION
SIMULATIONComputer simulation provides a clear insight regarding
the location and extent of internal defects, ensuring
castings. It requires a 3D CAD model of the methodlayout (with mold cavities, cores, feeders, and gating
channels), proper setting of boundary conditions for eachvirtual trial, and correct interpretation of results. In the
past the foundryman have strived for ways to improvethe casting process and eliminate the defects thatoccurred in the castings by trial and error and past
experiences. The time needed to produce a particular product is a time-consuming process. Problems occurred
in the casting may only be solved through trial and errorScientists throughout the years have studied the scienceof casting and metallurgy and developed theories andmathematical models to explain the properties of metalswhile going through the solidification process
Simulation programs were developed from thesemethods which are useful in predicting how the castingwill come out. Defects and problems can be discovered
before the actual casting is cast avoiding costly tests to prevent the problems. Fig.1 shows the steps involved in
simulation process.
8/20/2019 Solidification Analysis of Investment Cast Knee Joint Implant
http://slidepdf.com/reader/full/solidification-analysis-of-investment-cast-knee-joint-implant 2/7
www.ijsret.org
International Journal of Scientific Research Engineering & Technology (IJSRET), ISSN 2278 – 0882
Volume 4, Issue 1, January 2015
I.
Solid Modeling of part (3 D modeling of Gating,feeding and component part)
II. Pre-processing (assigning simulation thermal parameters)
III. Processing (processing simulations iteratively)IV. Post-processing (For analyzing temperature ,
shrinkage, thermal gradient etc.,)
Fig.1: Steps for simulation process [1]
3. SOLID MODELINGSolid modeling permits engineers to visualize
and understand the part’s actual appearance and functionwithin an assembly by displaying the critical relationship
of part layouts, interference, and clearances. The mass property data (weight, center of gravity, moments of
inertia, etc.) of parts and assemblies can be obtained.This eliminates the need for hand calculations toestimate these values from drawings or sketches. The
mechanical integrity of the design may be investigatedusing various finite element methods to determinestructural, thermal, kinematics, and vibration properties.
These capabilities allow the engineer to design, analyze,and iterate on the CAE software using the same solid
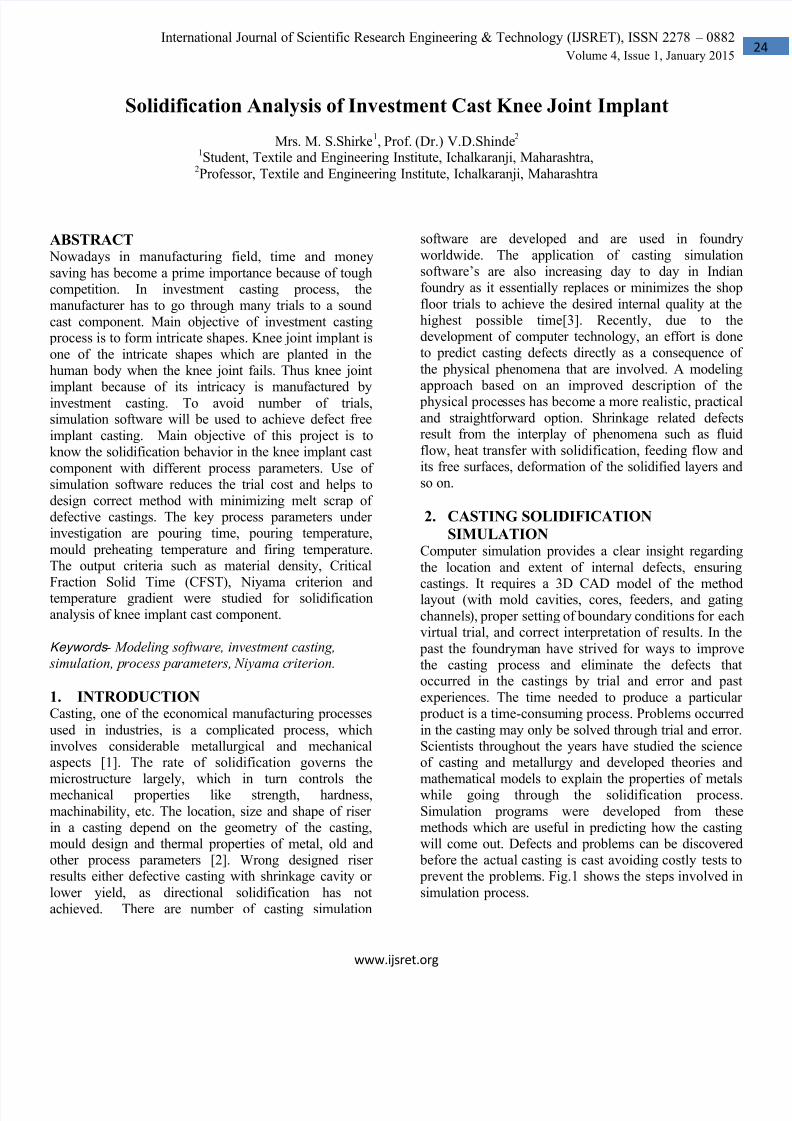
model. In solid modeling basically first a 3 dimensionalmodel is prepared and then it is converted to STL fileformat. STL file format is the loaded in to other softwarewhere the simulation process is carried out. Fig.2a
indicates the solid model of knee implant and meshing isindicated in Fig.2b. In first pattern layout Fig.3a the gateand runner system width dimensions are kept as those ofthe length of the component, the number of patternformed are 18. In the second pattern layout Fig.3b to tworunners are added parallel to each other thus we get 16
cavities of the component. In the third pattern layoutFig.3c, to increase the yield runner width is reduce thus
we have 24 component planned in this. Finally in the last
pattern layout Fig.3d we can see the combination of thirdand second pattern layout, with the same width that of
the third pattern layout, number of cavities reaches to 24Above pattern tree are formed with different designs to
increase the yield. Simulation is carried out on each ofthe layout and final design is suggested.
Fig.2a. knee prosthesis Fig.2b.Meshed knee prosthesis
4. PRE-PROCESSINGIn Pre-processing, the input parameters are
assigned for the simulation process. Process parameter
which affects investment casting product includes mould preheating temperature, firing temperature, pouringtemperature, pouring time, shell thickness. InSOLIDCast software input parameters are 3 dimensionamodel in binary STL format, assigning materials for cast
and mold part, meshing details like node size, pouringtime, pouring temperature, room temperature. In thisstudy the input parameters are same for all the type of
8/20/2019 Solidification Analysis of Investment Cast Knee Joint Implant
http://slidepdf.com/reader/full/solidification-analysis-of-investment-cast-knee-joint-implant 3/7
www.ijsret.org
International Journal of Scientific Research Engineering & Technology (IJSRET), ISSN 2278 – 0882
Volume 4, Issue 1, January 2015
pattern tree. The 3 dimensional model is drafted in adrafting software Pro-E and is converted to STL file
format so as we can use that file in SOLIDCastsimulation software. Input parameters related to casting
material considered are, detailed in table-I. We need toassign ambient temperature and pouring time which is
32.222˚C and 23 second respectively, pouring time isdefined as the time required for filling the mould cavity
by molten metal. Pouring time input is considered by
experimental method. For knee joint implant materialused is SS 316 L with chemical composition is listed intable.2Material properties of SS316 are excellent in a range ofatmospheric environments and many corrosive media -
generally more resistant. Good oxidation resistance inintermittent service to 870°C and in continuous service
to 925°C. Excellent weldability by all standard fusionand resistance methods, both with and without filler
metals. 316L stainless steel is also easier to machinecompared to 316 stainless steel due its lower carboncontent. Material temperature factor is taken by the
software as we select the material in it.
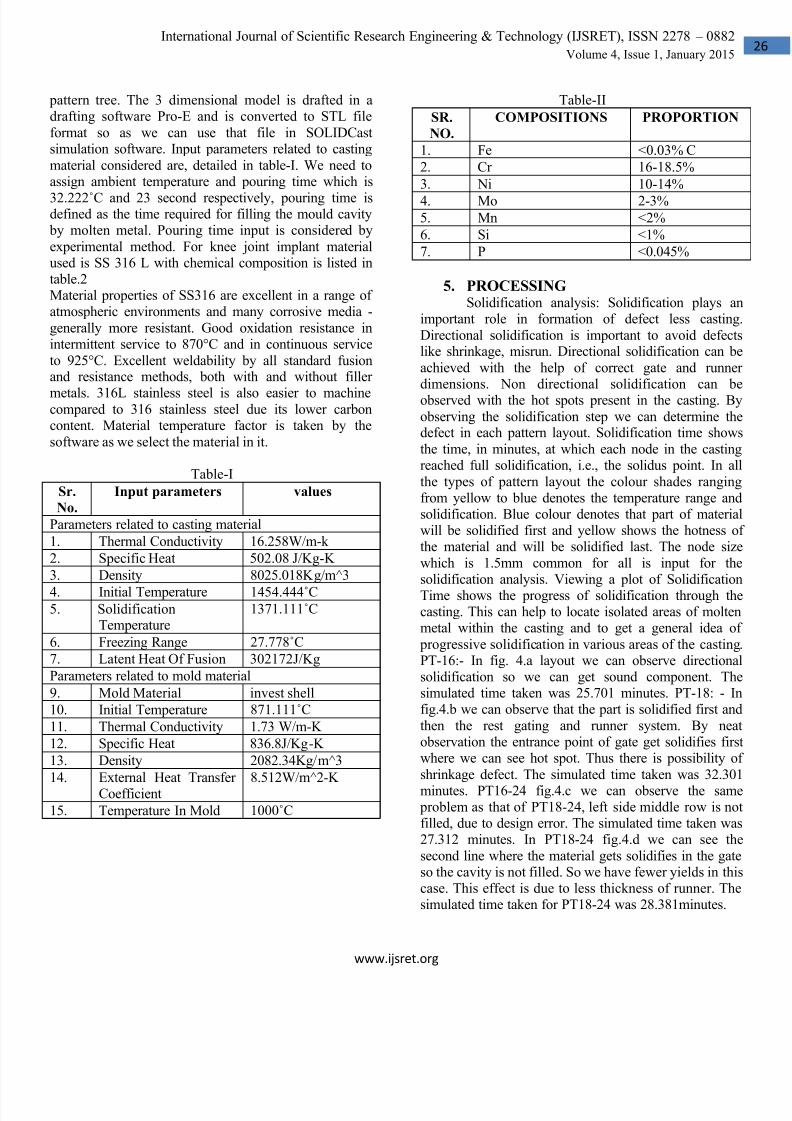
Table-I
Sr.
No.
Input parameters values
Parameters related to casting material
1. Thermal Conductivity 16.258W/m-k
2. Specific Heat 502.08 J/Kg-K
3. Density 8025.018Kg/m^3
4. Initial Temperature 1454.444˚C 5. Solidification
Temperature1371.111˚C
6. Freezing Range 27.778˚C
7. Latent Heat Of Fusion 302172J/Kg
Parameters related to mold material
9. Mold Material invest shell
10. Initial Temperature 871.111˚C
11. Thermal Conductivity 1.73 W/m-K
12. Specific Heat 836.8J/Kg-K
13. Density 2082.34Kg/m^3
14. External Heat TransferCoefficient
8.512W/m^2-K
15. Temperature In Mold 1000˚C
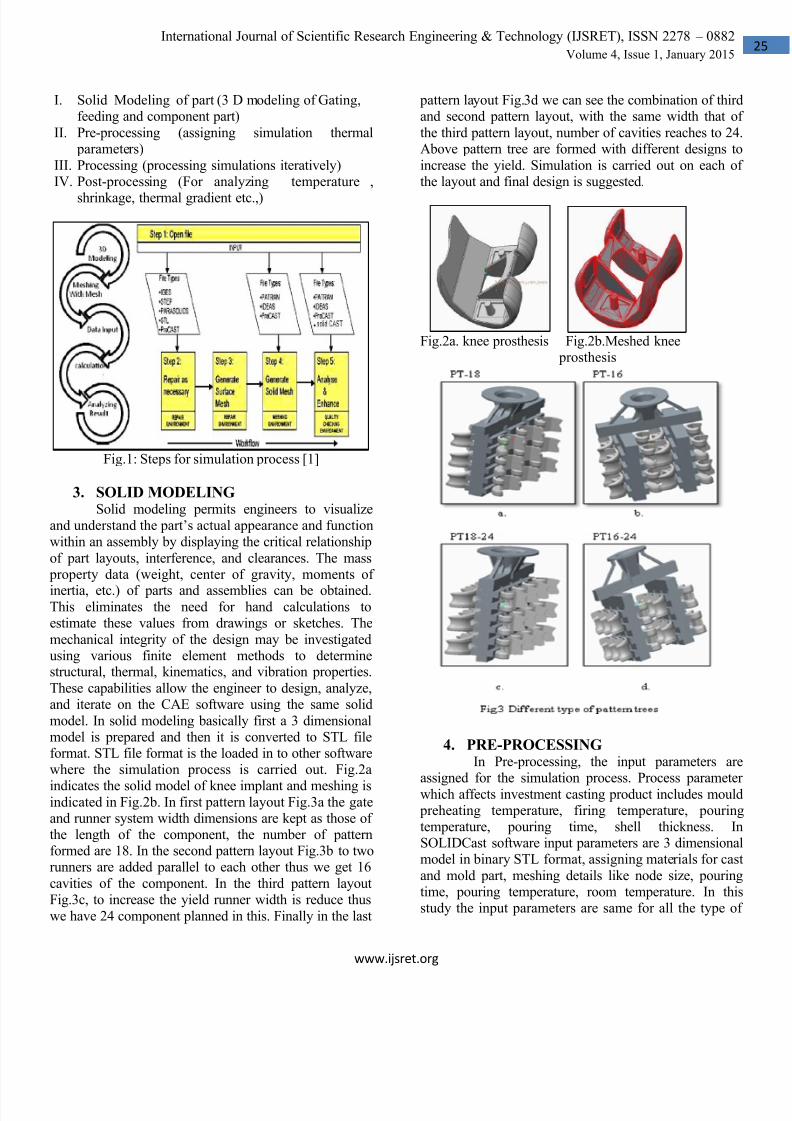
Table-II
SR.
NO.
COMPOSITIONS PROPORTION
1. Fe <0.03% C
2. Cr 16-18.5%
3. Ni 10-14%
4. Mo 2-3% 5. Mn <2%
6. Si <1%
7. P <0.045%
5. PROCESSINGSolidification analysis: Solidification plays an
important role in formation of defect less casting
Directional solidification is important to avoid defectslike shrinkage, misrun. Directional solidification can be
achieved with the help of correct gate and runnerdimensions. Non directional solidification can beobserved with the hot spots present in the casting. By
observing the solidification step we can determine thedefect in each pattern layout. Solidification time shows
the time, in minutes, at which each node in the castingreached full solidification, i.e., the solidus point. In al
the types of pattern layout the colour shades rangingfrom yellow to blue denotes the temperature range andsolidification. Blue colour denotes that part of materiawill be solidified first and yellow shows the hotness ofthe material and will be solidified last. The node size
which is 1.5mm common for all is input for thesolidification analysis. Viewing a plot of SolidificationTime shows the progress of solidification through thecasting. This can help to locate isolated areas of moltenmetal within the casting and to get a general idea of
progressive solidification in various areas of the castingPT-16:- In fig. 4.a layout we can observe directionalsolidification so we can get sound component. Thesimulated time taken was 25.701 minutes. PT-18: - Infig.4.b we can observe that the part is solidified first and
then the rest gating and runner system. By neatobservation the entrance point of gate get solidifies firswhere we can see hot spot. Thus there is possibility of
shrinkage defect. The simulated time taken was 32.301
minutes. PT16-24 fig.4.c we can observe the same problem as that of PT18-24, left side middle row is notfilled, due to design error. The simulated time taken was27.312 minutes. In PT18-24 fig.4.d we can see the
second line where the material gets solidifies in the gateso the cavity is not filled. So we have fewer yields in thiscase. This effect is due to less thickness of runner. Thesimulated time taken for PT18-24 was 28.381minutes.
8/20/2019 Solidification Analysis of Investment Cast Knee Joint Implant
http://slidepdf.com/reader/full/solidification-analysis-of-investment-cast-knee-joint-implant 4/7
www.ijsret.org
International Journal of Scientific Research Engineering & Technology (IJSRET), ISSN 2278 – 0882
Volume 4, Issue 1, January 2015
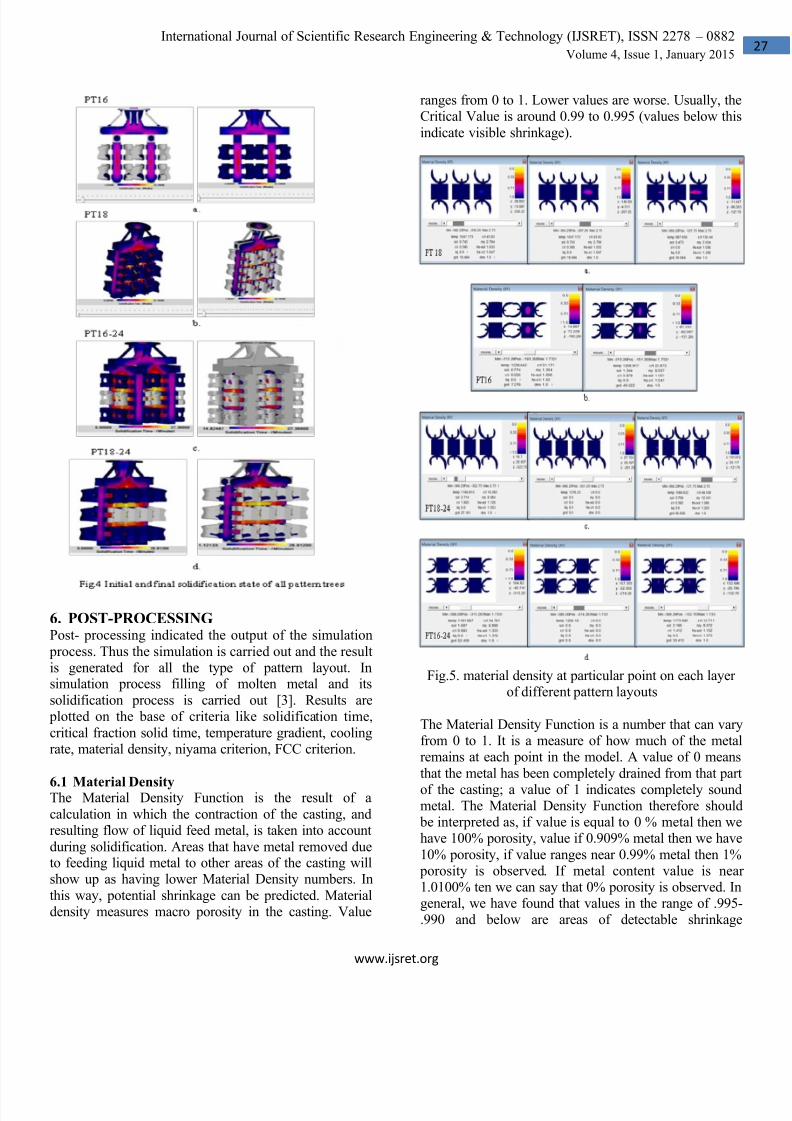
6. POST-PROCESSINGPost- processing indicated the output of the simulation
process. Thus the simulation is carried out and the resultis generated for all the type of pattern layout. Insimulation process filling of molten metal and its
solidification process is carried out [3]. Results are plotted on the base of criteria like solidification time,
critical fraction solid time, temperature gradient, coolingrate, material density, niyama criterion, FCC criterion.
6.1
Material DensityThe Material Density Function is the result of a
calculation in which the contraction of the casting, andresulting flow of liquid feed metal, is taken into account
during solidification. Areas that have metal removed dueto feeding liquid metal to other areas of the casting willshow up as having lower Material Density numbers. In
this way, potential shrinkage can be predicted. Materialdensity measures macro porosity in the casting. Value
ranges from 0 to 1. Lower values are worse. Usually, theCritical Value is around 0.99 to 0.995 (values below this
indicate visible shrinkage).
Fig.5. material density at particular point on each layerof different pattern layouts
The Material Density Function is a number that can varyfrom 0 to 1. It is a measure of how much of the metalremains at each point in the model. A value of 0 means
that the metal has been completely drained from that part
of the casting; a value of 1 indicates completely soundmetal. The Material Density Function therefore should
be interpreted as, if value is equal to 0 % metal then wehave 100% porosity, value if 0.909% metal then we have
10% porosity, if value ranges near 0.99% metal then 1% porosity is observed. If metal content value is nea1.0100% ten we can say that 0% porosity is observed. Ingeneral, we have found that values in the range of .995-.990 and below are areas of detectable shrinkage
8/20/2019 Solidification Analysis of Investment Cast Knee Joint Implant
http://slidepdf.com/reader/full/solidification-analysis-of-investment-cast-knee-joint-implant 5/7
www.ijsret.org
International Journal of Scientific Research Engineering & Technology (IJSRET), ISSN 2278 – 0882
Volume 4, Issue 1, January 2015
porosity in castings. The Material Density Function is ameasure of macroporosity and is most useful in ferrous
castings. In Fig 5.a show the cut plane of each layer of pattern layout (PT18) which contains 6 component
cavities. In this at each point of the component we havematerial density as 1. In Fig 5.b pattern layout (PT16)
we have 2 layer. At each layer we have 8 component, weget density value 1 at each point.Fig 5.c show the cut
plane of each layer of pattern layout (PT18-24) and have
8 components. In first layer we have 8 components and 1value for material density is obtained. In the secondlayer we have all the values as 0 which denotes that thereis no material filled in the lower side of the layer here wecan get 4 components. In the third layer again we have
density as 1 for all components. Fig 5.d show the cut plane of each layer of pattern layout (PT16-24) and have
8 components. In first layer we have 8 components and 1value for material density is obtained.In the second layer
we have all the values as 0 which denotes that there is nomaterial filled in the mould cavity. So in this total layerthe material solidifies in between and all 8 cavities
remain unfilled. In the third layer we have again materialdensity value as 1 for all the components.
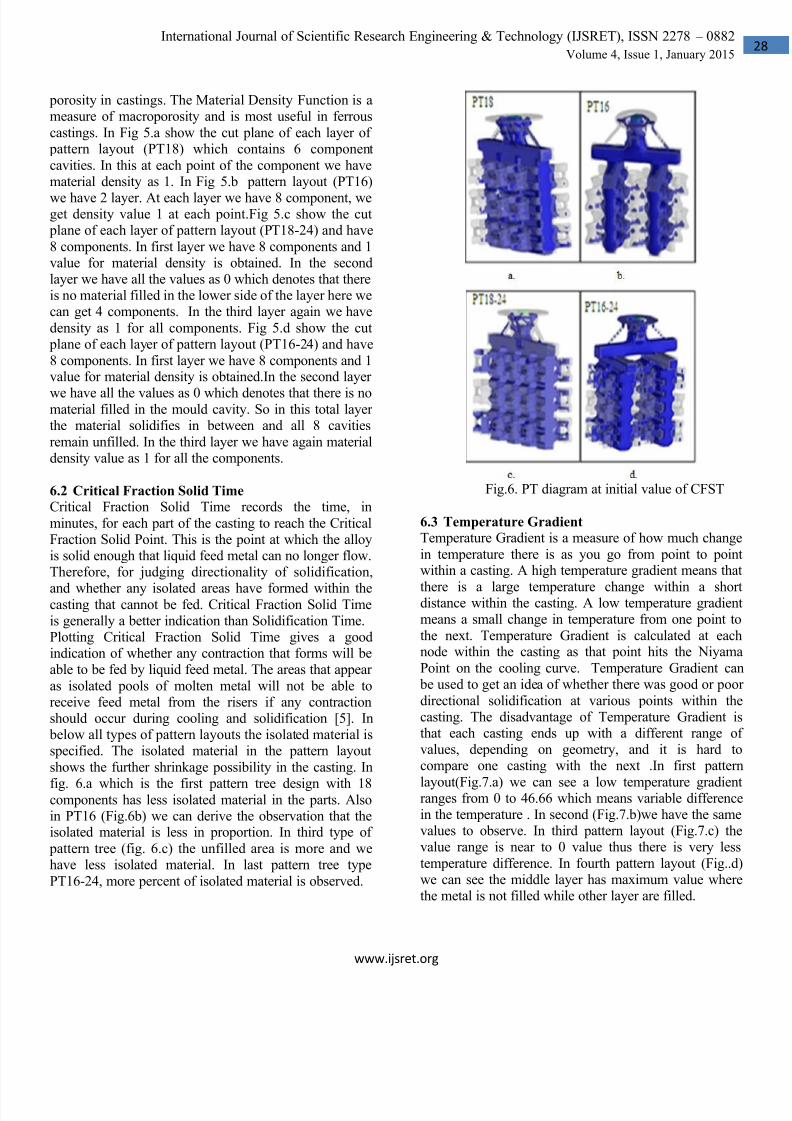
6.2
Critical Fraction Solid Time
Critical Fraction Solid Time records the time, in
minutes, for each part of the casting to reach the CriticalFraction Solid Point. This is the point at which the alloyis solid enough that liquid feed metal can no longer flow.Therefore, for judging directionality of solidification,
and whether any isolated areas have formed within thecasting that cannot be fed. Critical Fraction Solid Timeis generally a better indication than Solidification Time.Plotting Critical Fraction Solid Time gives a goodindication of whether any contraction that forms will beable to be fed by liquid feed metal. The areas that appear
as isolated pools of molten metal will not be able toreceive feed metal from the risers if any contractionshould occur during cooling and solidification [5]. In
below all types of pattern layouts the isolated material isspecified. The isolated material in the pattern layout
shows the further shrinkage possibility in the casting. In
fig. 6.a which is the first pattern tree design with 18components has less isolated material in the parts. Alsoin PT16 (Fig.6b) we can derive the observation that theisolated material is less in proportion. In third type of
pattern tree (fig. 6.c) the unfilled area is more and wehave less isolated material. In last pattern tree type
PT16-24, more percent of isolated material is observed.
Fig.6. PT diagram at initial value of CFST
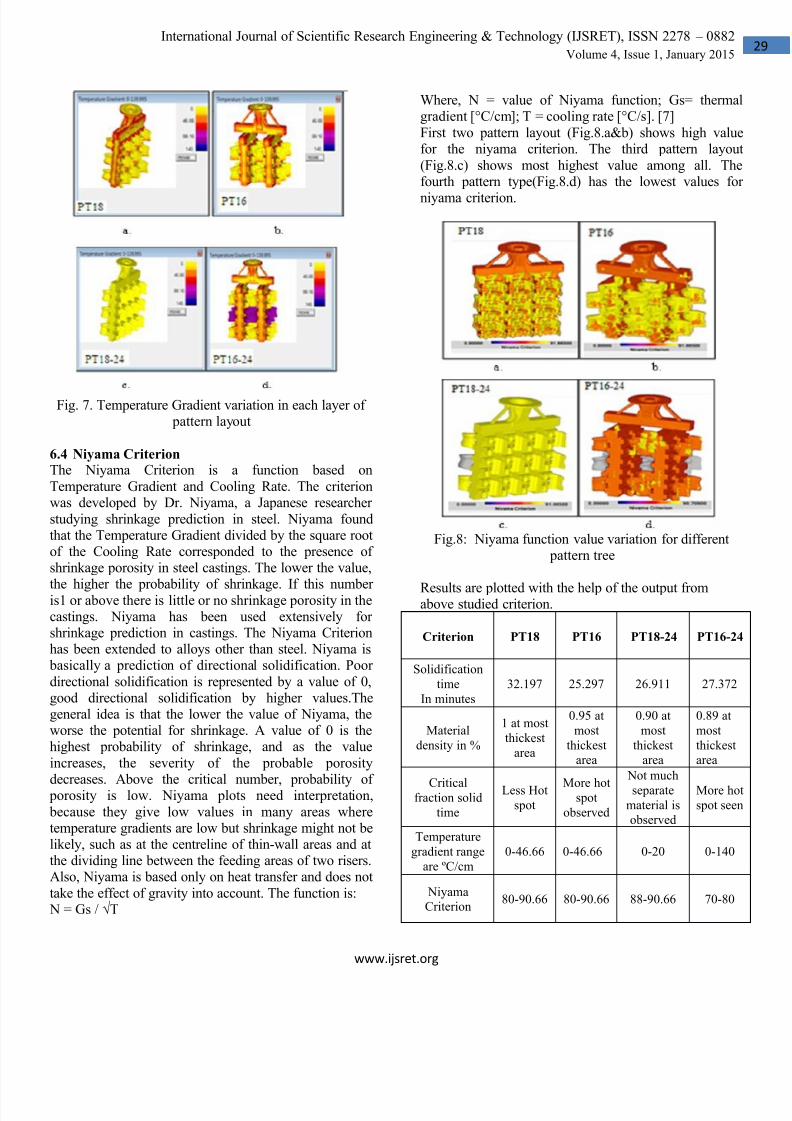
6.3
Temperature Gradient
Temperature Gradient is a measure of how much change
in temperature there is as you go from point to pointwithin a casting. A high temperature gradient means that
there is a large temperature change within a shortdistance within the casting. A low temperature gradientmeans a small change in temperature from one point to
the next. Temperature Gradient is calculated at eachnode within the casting as that point hits the Niyama
Point on the cooling curve. Temperature Gradient can be used to get an idea of whether there was good or poor
directional solidification at various points within thecasting. The disadvantage of Temperature Gradient isthat each casting ends up with a different range ofvalues, depending on geometry, and it is hard tocompare one casting with the next .In first pattern
layout(Fig.7.a) we can see a low temperature gradientranges from 0 to 46.66 which means variable differencein the temperature . In second (Fig.7.b)we have the samevalues to observe. In third pattern layout (Fig.7.c) thevalue range is near to 0 value thus there is very less
temperature difference. In fourth pattern layout (Fig..d)we can see the middle layer has maximum value wherethe metal is not filled while other layer are filled.
8/20/2019 Solidification Analysis of Investment Cast Knee Joint Implant
http://slidepdf.com/reader/full/solidification-analysis-of-investment-cast-knee-joint-implant 6/7
www.ijsret.org
International Journal of Scientific Research Engineering & Technology (IJSRET), ISSN 2278 – 0882
Volume 4, Issue 1, January 2015
Fig. 7. Temperature Gradient variation in each layer of pattern layout
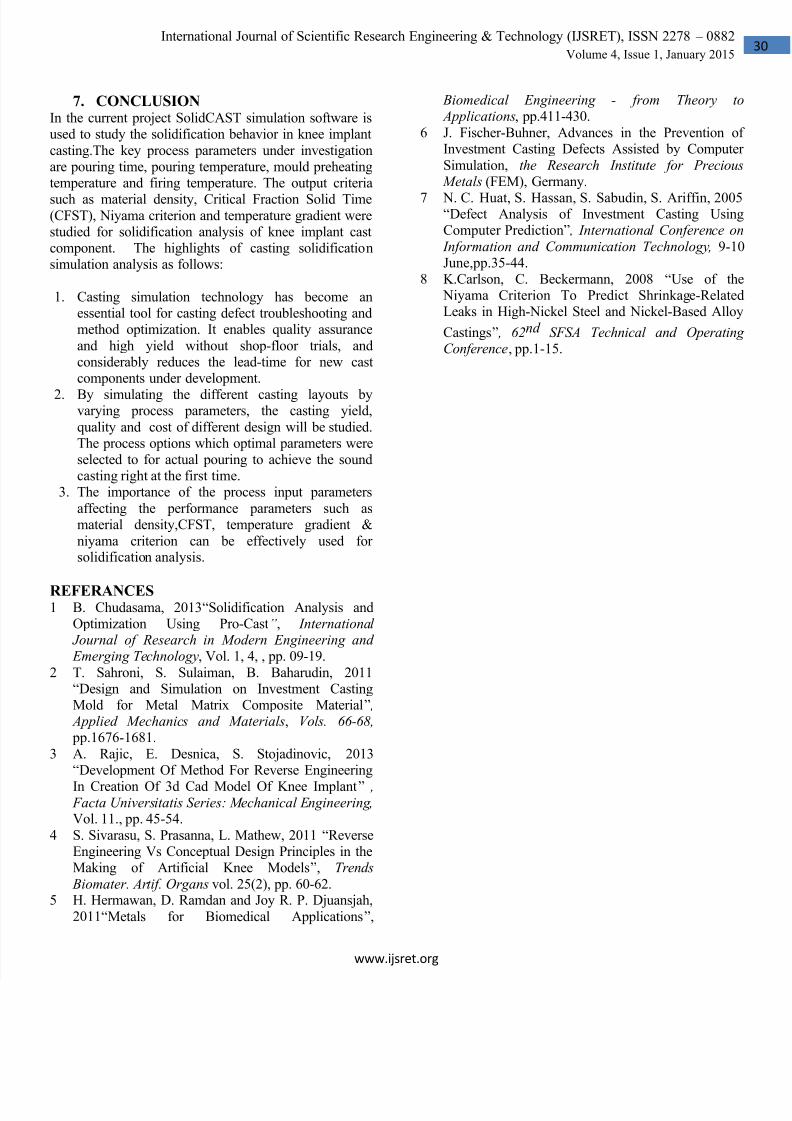
6.4
Niyama CriterionThe Niyama Criterion is a function based on
Temperature Gradient and Cooling Rate. The criterionwas developed by Dr. Niyama, a Japanese researcher
studying shrinkage prediction in steel. Niyama foundthat the Temperature Gradient divided by the square rootof the Cooling Rate corresponded to the presence ofshrinkage porosity in steel castings. The lower the value,
the higher the probability of shrinkage. If this numberis1 or above there is little or no shrinkage porosity in thecastings. Niyama has been used extensively forshrinkage prediction in castings. The Niyama Criterionhas been extended to alloys other than steel. Niyama is
basically a prediction of directional solidification. Poor
directional solidification is represented by a value of 0,good directional solidification by higher values.Thegeneral idea is that the lower the value of Niyama, theworse the potential for shrinkage. A value of 0 is thehighest probability of shrinkage, and as the value
increases, the severity of the probable porosity
decreases. Above the critical number, probability of porosity is low. Niyama plots need interpretation,
because they give low values in many areas wheretemperature gradients are low but shrinkage might not belikely, such as at the centreline of thin-wall areas and atthe dividing line between the feeding areas of two risers.Also, Niyama is based only on heat transfer and does not
take the effect of gravity into account. The function is: N = Gs / √T
Where, N = value of Niyama function; Gs= thermalgradient [°C/cm]; T = cooling rate [°C/s]. [7]
First two pattern layout (Fig.8.a&b) shows high valuefor the niyama criterion. The third pattern layou
(Fig.8.c) shows most highest value among all. Thefourth pattern type(Fig.8.d) has the lowest values for
niyama criterion.
Fig.8: Niyama function value variation for different pattern tree
Results are plotted with the help of the output fromabove studied criterion.
Criterion PT18 PT16 PT18-24 PT16-24
Solidification
time
In minutes
32.197 25.297 26.911 27.372
Material
density in %
1 at most
thickest
area
0.95 at
most
thickest
area
0.90 at
most
thickest
area
0.89 at
most
thickest
area
Criticalfraction solid
time
Less Hotspot
More hotspot
observed
Not much
separatematerial is
observed
More hospot seen
Temperature
gradient range
are ºC/cm
0-46.66 0-46.66 0-20 0-140
Niyama
Criterion80-90.66 80-90.66 88-90.66 70-80
8/20/2019 Solidification Analysis of Investment Cast Knee Joint Implant
http://slidepdf.com/reader/full/solidification-analysis-of-investment-cast-knee-joint-implant 7/7
www.ijsret.org
International Journal of Scientific Research Engineering & Technology (IJSRET), ISSN 2278 – 0882
Volume 4, Issue 1, January 2015
7. CONCLUSIONIn the current project SolidCAST simulation software isused to study the solidification behavior in knee implant
casting.The key process parameters under investigationare pouring time, pouring temperature, mould preheatingtemperature and firing temperature. The output criteria
such as material density, Critical Fraction Solid Time(CFST), Niyama criterion and temperature gradient werestudied for solidification analysis of knee implant castcomponent. The highlights of casting solidificationsimulation analysis as follows:
1. Casting simulation technology has become anessential tool for casting defect troubleshooting andmethod optimization. It enables quality assurance
and high yield without shop-floor trials, andconsiderably reduces the lead-time for new castcomponents under development.
2.
By simulating the different casting layouts byvarying process parameters, the casting yield,
quality and cost of different design will be studied.The process options which optimal parameters wereselected to for actual pouring to achieve the soundcasting right at the first time.
3. The importance of the process input parameters
affecting the performance parameters such asmaterial density,CFST, temperature gradient &
niyama criterion can be effectively used forsolidification analysis.
REFERANCES1 B. Chudasama, 2013“Solidification Analysis and
Optimization Using Pro-Cast”, International Journal of Research in Modern Engineering and Emerging Technology, Vol. 1, 4, , pp. 09-19.
2 T. Sahroni, S. Sulaiman, B. Baharudin, 2011“Design and Simulation on Investment CastingMold for Metal Matrix Composite Material” ,
Applied Mechanics and Materials, Vols. 66-68, pp.1676-1681.
3 A. Rajic, E. Desnica, S. Stojadinovic, 2013 “Development Of Method For Reverse Engineering
In Creation Of 3d Cad Model Of Knee Implant” , Facta Universitatis Series: Mechanical Engineering, Vol. 11., pp. 45-54.
4 S. Sivarasu, S. Prasanna, L. Mathew, 2011 “ReverseEngineering Vs Conceptual Design Principles in theMaking of Artificial Knee Models”, Trends
Biomater. Artif. Organs vol. 25(2), pp. 60-62.5
H. Hermawan, D. Ramdan and Joy R. P. Djuansjah,2011“Metals for Biomedical Applications”,
Biomedical Engineering - from Theory to Applications, pp.411-430.
6 J. Fischer-Buhner, Advances in the Prevention ofInvestment Casting Defects Assisted by Computer
Simulation, the Research Institute for Precious Metals (FEM), Germany.
7
N. C. Huat, S. Hassan, S. Sabudin, S. Ariffin, 2005“Defect Analysis of Investment Casting UsingComputer Prediction” , International Conference on
Information and Communication Technology, 9-10June,pp.35-44.
8
K.Carlson, C. Beckermann, 2008 “Use of the Niyama Criterion To Predict Shrinkage-RelatedLeaks in High-Nickel Steel and Nickel-Based Alloy
Castings” , 62nd SFSA Technical and OperatingConference, pp.1-15.