Solid Waste Rate and Service Study - El Dorado County · 2017-05-13 · August 5, 2008 Ms. Gerri...
178
Prouldy serving our clients for thirteen years 1995 ~ 2008 Solid Waste Rate and Service Study Environmental Management Department August 5, 2008
Transcript of Solid Waste Rate and Service Study - El Dorado County · 2017-05-13 · August 5, 2008 Ms. Gerri...

Prouldy serving our clients for thirteen years
1995 ~ 2008
Solid Waste Rate
and Service Study
Environmental Management Department
August 5, 2008

Prouldy serving our clients for thirteen years
1995 ~ 2008
Solid Waste Rate
and Service Study
Environmental Management Department
August 5, 2008

August 5, 2008 Ms. Gerri Silva, Director Environmental Management Department County of El Dorado 330 Fair Lane Placerville, California 95667
Regarding: Solid Waste Rate and Service Study – Final Report
Dear Ms. Silva:
NewPoint Group, Inc. is pleased to provide the County of El Dorado (County) with our final report for the above referenced study. This report includes nine (9) report sections, and three (3) appendices. “County” references throughout the report are for the unincorporated areas franchised by the County and do not include Cameron Park and El Dorado Hills as they are under separate non-County franchises.
This August 5, 2008, final report follows from our June 10, 2008, draft report submittal. As we collected primary data at various times throughout this study, the data we collected and presented in this report was as of a point in time significantly before the August 5, 2008 final report date (e.g., as of January 2008 for surveyed rates of comparative jurisdictions).
In this letter we provide an executive summary for our report. Below we summarize our key study findings and recommendations by grouped areas that correspond to report sections.
This executive summary is organized as follows: A. Introduction and Background for Study B. Solid Waste Rates and Service Levels Including Comparisons Between the County and Selected Jurisdictions C. Solid Waste Franchise Fees, Including Comparisons Between the County and Selected Jurisdictions D. Solid Waste Services Profitability Level and Waste Management Industry Standards,
Including Comparisons Between the County and Selected Jurisdictions E. Franchise Agreement Valuations for County Solid Waste Services F. Franchise Agreement Options for County Solid Waste Services G. Recommendations for County Solid Waste Management, Rates, and Service Levels.
A. Introduction and Background for Study (Report Section 1)
We prepared this report in response to the County’s scope of work request for solid waste rate and service consulting assistance. NewPoint Group finalized a contract with the County on February 12, 2008, to perform these services. We relied upon comparative jurisdiction surveys, our own database of waste management industry data, onsite visits/interviews of the hauling companies, and other primary data collection efforts. The County has solid waste collection franchises with six (6) companies, two (2) of which are Waste Connections of California companies, and three (3) of which are South Tahoe Refuse

Ms. Gerri Silva August 5, 2008 Page 2
companies. The County distinguishes between the more urban West Slope service areas, and the more rural East Slope service areas. The six companies are as follows:
Waste Connections of California Amador Disposal Service (ADS) – West Slope El Dorado Disposal Services (EDDS) – West Slope
South Tahoe Refuse Company American River Disposal Service (ARDS) – East Slope Sierra Disposal Service (SDS) – West Slope South Tahoe Refuse Company (STR) – East Slope
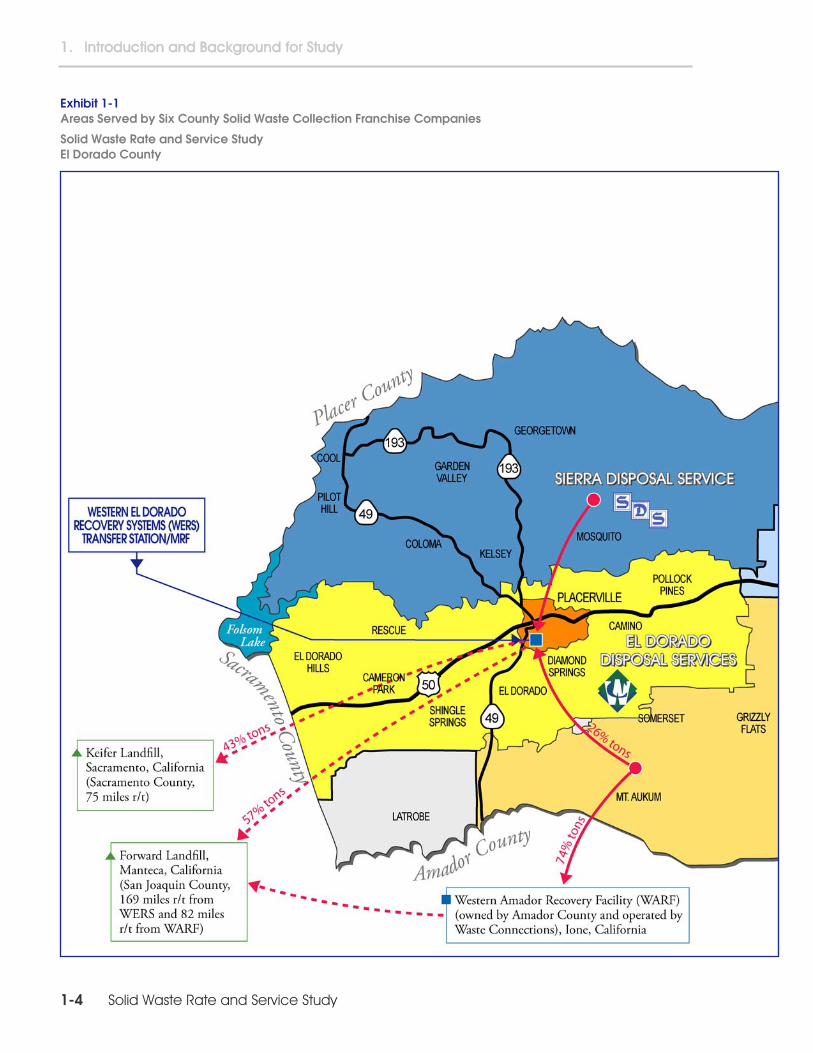
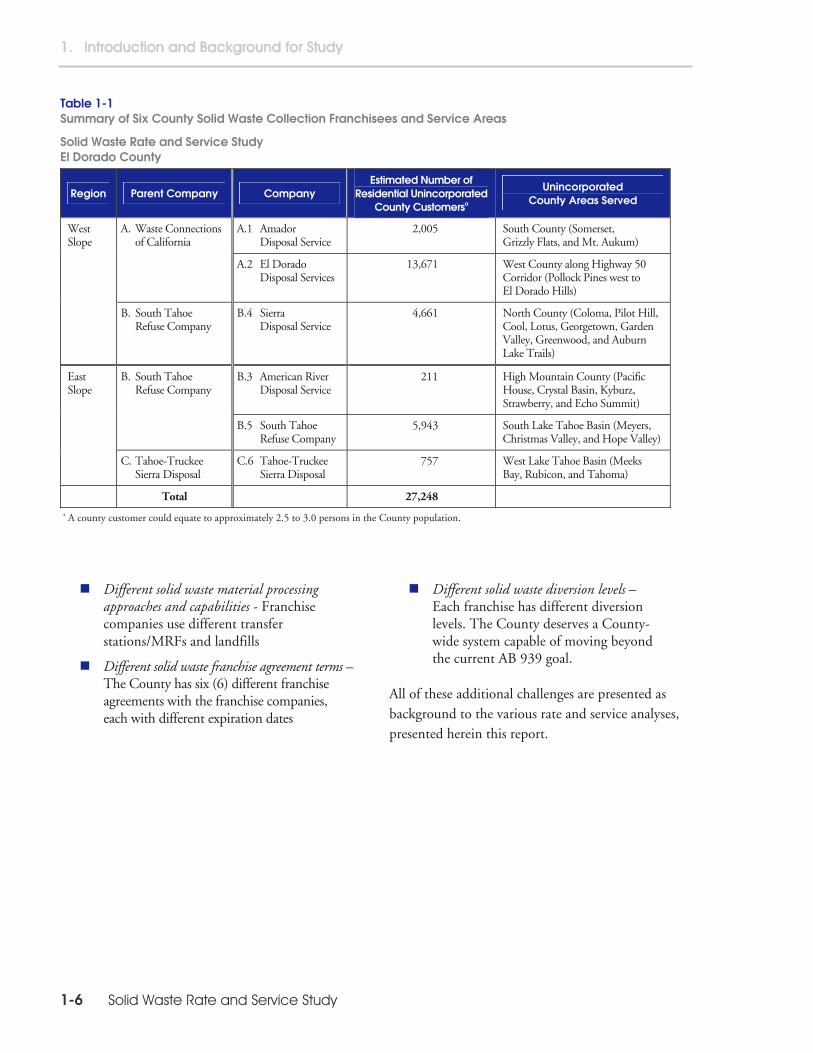
Tahoe Truckee Sierra Disposal Company (TTSD) – East Slope. Exhibit 1-1, on pages 1-4 and 1-5, shows a detailed geographic map of the County’s waste management system. As shown in Table 1 below, Waste Connections companies serve approximately 57 percent of the County’s residential solid waste management accounts. South Lake Tahoe Refuse companies serve another approximately 40 percent of the County’s residential accounts, while Tahoe-Truckee Sierra Disposal serves only approximately three (3) percent to the County’s residential accounts. Table 1 Summary of Six County Solid Waste Collection Franchisees and Service Areas
Solid Waste Rate and Service Study El Dorado County
Estimated Number of Residential Unincorporated County Customersa
Region Parent Company Company Can
CustomersCart
CustomersTotal
Customers
Unincorporated County Areas Served
West Slope
A. Waste Connections of California
Amador Disposal Service
1,747 258 2,005 South County (Somerset, Grizzly Flats, and Mt. Aukum)
El Dorado Disposal Services
6,092 7,579 13,671 West County along Highway 50 Corridor (Pollock Pines west to El Dorado Hills)
B. South Tahoe Refuse Company
Sierra Disposal Service
4,661 0 4,661 North County (Coloma, Pilot Hill, Cool, Lotus, Georgetown, Garden Valley, Greenwood, and Auburn Lake Trails)
East Slope
B. South Tahoe Refuse Company
American River Disposal Service
211 0 211 High Mountain County (Pacific House, Crystal Basin, Kyburz, Strawberry, and Echo Summit)
South Tahoe Refuse Company
5,943 0 5,943 South Lake Tahoe Basin (Meyers, Christmas Valley, and Hope Valley)
C. Tahoe-Truckee Sierra Disposal
Tahoe-Truckee Sierra Disposal
757 0 757 West Lake Tahoe Basin (Meeks Bay, Rubicon, and Tahoma)
Total 19,411 7,837 27,248 a A county customer could equate to approximately 2.5 to 3.0 persons in the County population.

Ms. Gerri Silva August 5, 2008 Page 3
nagement system issues. The
Different solid waste service levels ls
tions, including the non-mandatory collection
s and capabilities
s.
istorically, the County’s waste management system has worked fairly well, particularly when
County is presently at a crossroads. The County is bridged between a legacy waste for an
. Solid Waste Rates and Service Levels, unty and Selected Jurisdictions
For residential refuse service, the County generally has a can collection system, with cart service
ve
ered
A can-based system represents one where the customer provides his/her own container or can er
waste
The County is currently faced with several challenging waste maCounty is unique due to its (1) relatively large geographic size and variability, (2) urban and rural population mixes, and (3) diverse climate conditions. Waste management in the County is furthercomplicated by several other important County-wide non-homogeneous factors, as summarized below:
Different solid waste diversion leve Different solid waste management op(self-haul) option, and the yard waste burn option Different solid waste material processing approache
Different solid waste rate setting methodologies Different solid waste rates and rate structures Different solid waste franchise agreement term
H
the County was more rural in nature. Now, the County has grown, and in the future the County will become even more urban. However, the County will always retain a rural nature due to its foothill and mountain geography. The management system that has well served a primarily rural County population, and the need updated, or more refined, waste management system to meet the demands of an ever evolving urban/rural population mix, and ever more stringent environmental requirements. B
Including Comparisons Between the Co(Report Sections 2, 3, and 4; and Appendices A and B)
le ls offered by ADS and EDDS, in their more urban areas. For over two-thirds of the County unincorporated areas, there is no refuse cart service available. For curbside recycling services, the County has some areas with a recyclable bag system, and some areas with biweekly cart service offonly by EDDS. The County does not have any yard waste service, except for areas served by EDDS (via cart service). (typically sized at 32-gallons). A cart-based system is one where the company provides the customwith a wheeled cart(s) (sometimes called a “toter”). Often in a cart-based system, the customer can select a refuse cart size that matches their waste generation level (typically either a 32-gallon, 64-gallon, or 96-gallon cart). Carts also can be provided for curbside recycling and/or curbside yardcollection. In a cart-based system, the company is responsible for purchasing, maintaining, repairing, and replacing the cart.

Ms. Gerri Silva August 5, 2008 Page 4
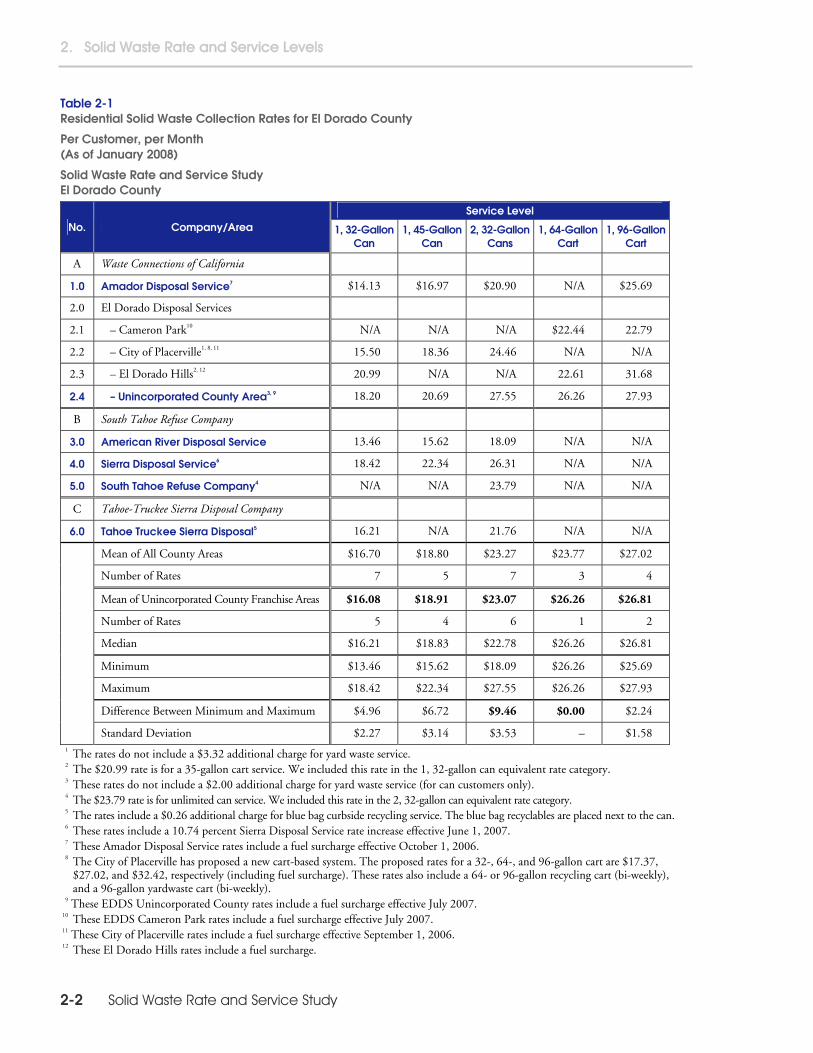
There is an extensive amount of comparative quantitative solid waste rate survey information presented in the relevant report sections and appendices. Almost all of this information required labor intensive, primary data collection. We have never compiled this much numerical California rate information before in one client document. This County and comparative rate information includes residential solid waste collection; commercial solid waste collection; industrial solid waste collection; and transfer stations and landfills. We provide extensive rate comparisons between the County and fourteen (14) other similar neighboring unincorporated counties. Many of the surveyed counties had multiple different service areas within the county. In total, for the residential rate comparison alone, we provide comparative data for 54 different county areas within the 14 counties surveyed. Current County residential rates are shown in Table 2 on the following page. Current County solid waste management rates are (1) clearly comparable to other relevant jurisdictions for the residential sector; (2) are mostly comparable to other relevant jurisdictions for the commercial sector; and (3) are somewhat comparable to other relevant jurisdictions for the industrial sector. These findings suggest that on an overall basis, solid waste rate comparisons are not a policy issue for the County. County mean rates, in comparison to the mean of 14 comparative jurisdictions, were as follows:
Residential 1, 32-gallon can 8.6 percent below the comparative mean 2, 32-gallon cans 3.8 percent below the comparative mean 1, 64-gallon cart 1.1 percent below the comparative mean 1, 96-gallon cart 18.9 percent below the comparative mean Commercial 2 yd./1 per week 44.9 percent below the comparative mean 2 yd./2 per week 21.2 percent below the comparative mean 3 yd./1 per week 33.2 percent below the comparative mean 3 yd./2 per week 27.0 percent below the comparative mean 4 yd./1 per week 28.0 percent below the comparative mean 6 yd./1 per week 26.5 percent below the comparative mean Industrial 20 yd/pick up 13.6 percent above the comparative mean 30 yd/pick up 38.6 percent above the comparative mean.
County residential rates are consistently comparable across all service levels, contrasted to other jurisdictions which have similar solid waste collection systems, demographics, and/or geographic terrain characteristics to the County. Rate variations between different service levels tend to be larger for the more linear residential rate structures, in which rates vary more widely by service selection. The County has a more tightly grouped residential rate structure, so it may not be unusual that County rates are easily comparable to linear rate structure jurisdictions. County residential rates were generally comparative across all service levels, for both can service, and cart service, and across most companies.

Ms. Gerri Silva August 5, 2008 Page 5
Table 2 Residential Solid Waste Collection Rates for El Dorado County
Per Customer, per Month (As of January 2008)
Solid Waste Rate and Service Study El Dorado County
Service Level No. Company/Area 1, 32-Gallon
Can 1, 45-Gallon
Can 2, 32-Gallon
Cans 1, 64-Gallon
Cart 1, 96-Gallon
Cart
A Waste Connections of California
1.0 Amador Disposal Service7 $14.13 $16.97 $20.90 N/A $25.69
2.0 El Dorado Disposal Services
2.1 – Cameron Park10 N/A N/A N/A $22.44 22.79
2.2 – City of Placerville1, 8, 11 15.50 18.36 24.46 N/A N/A
2.3 – El Dorado Hills2, 12 20.99 N/A N/A 22.61 31.68
2.4 – Unincorporated County Area3, 9 18.20 20.69 27.55 26.26 27.93
B South Tahoe Refuse Company
3.0 American River Disposal Service 13.46 15.62 18.09 N/A N/A
4.0 Sierra Disposal Service6 18.42 22.34 26.31 N/A N/A
5.0 South Tahoe Refuse Company4 N/A N/A 23.79 N/A N/A
C Tahoe-Truckee Sierra Disposal Company
6.0 Tahoe Truckee Sierra Disposal5 16.21 N/A 21.76 N/A N/A
Mean of All County Areas $16.70 $18.80 $23.27 $23.77 $27.02
Number of Rates 7 5 7 3 4
Mean of Unincorporated County Franchise Areas $16.08 $18.91 $23.07 $26.26 $26.81
Number of Rates 5 4 6 1 2
Median $16.21 $18.83 $22.78 $26.26 $26.81
Minimum $13.46 $15.62 $18.09 $26.26 $25.69
Maximum $18.42 $22.34 $27.55 $26.26 $27.93
Difference Between Minimum and Maximum $4.96 $6.72 $9.46 $0.00 $2.24
Standard Deviation $2.27 $3.14 $3.53 – $1.58 1 The rates do not include a $3.32 additional charge for yard waste service. 2 The $20.99 rate is for a 35-gallon cart service. We included this rate in the 1, 32-gallon can equivalent rate category. 3 These rates do not include a $2.00 additional charge for yard waste service (for can customers only). 4 The $23.79 rate is for unlimited can service. We included this rate in the 2, 32-gallon can equivalent rate category. 5 The rates include a $0.26 additional charge for blue bag curbside recycling service. The blue bag recyclables are placed next to the can. 6 These rates include a 10.74 percent Sierra Disposal Service rate increase effective June 1, 2007. 7 These Amador Disposal Service rates include a fuel surcharge effective October 1, 2006. 8 The City of Placerville has proposed a new cart-based system. The proposed rates for a 32-, 64-, and 96-gallon cart are $17.37,
$27.02, and $32.42, respectively (including fuel surcharge). These rates also include a 64- or 96-gallon recycling cart (bi-weekly), and a 96-gallon yardwaste cart (bi-weekly).
9 These EDDS Unincorporated County rates include a fuel surcharge effective July 2007. 10 These EDDS Cameron Park rates include a fuel surcharge effective July 2007. 11 These City of Placerville rates include a fuel surcharge effective September 1, 2006. 12 These El Dorado Hills rates include a fuel surcharge.

Ms. Gerri Silva August 5, 2008 Page 6
The County reported a diversion rate above the fifty (50) percent AB 939 diversion goal in 2006, of 53 percent. El Dorado County also has an additional five (5) percent biomass diversion credit for the unincorporated County. Generally, compared to twelve (12) jurisdictions meeting the fifty percent AB 939 diversion requirement, County overall residential rates are comparable. County mean residential rates were between 3.2 and 27.1 percent below the mean residential rates of the twelve (12) comparative jurisdictions meeting AB 939 goals. If County mean residential rates are compared to just those eight (8) jurisdictions with similar “tightly grouped” rate structures to the County (i.e., with relatively little price incentive built into the rate structure) and meeting AB 939 goals, County mean residential rates were between 11.1 percent below, and 11.0 percent above, the mean of these eight (8) jurisdictions. C. Solid Waste Franchise Fees,
Including Comparisons Between the County and Selected Jurisdictions (Report Section 5)
Franchise fees are paid by each of the solid waste franchise companies to the County. Franchise fees generally are expressed as a percentage of gross revenues earned by the hauling company providing solid waste services. The County currently requires the franchise companies to remit franchise fees for five (5) percent of gross revenues (the same for all six franchisees). According to our franchise fee surveys, average franchise fees for the fourteen (14) comparable jurisdictions we surveyed range from approximately seven (7) percent to ten (10) percent. For a separate analysis of fifty (50) city and county franchise fees that we compiled, we found that franchise fees ranged from 4 to 16 percent of gross revenues with a mean of 9.6 percent. The County’s relatively low franchise fees help maintain its relatively competitive refuse rates. On the other hand, the County has latitude to raise their franchise fees in the future to help fund needed County solid waste improvements. D. Solid Waste Services Profitability Level and Waste Management Industry Standards,
Including Comparisons Between the County and Selected Jurisdictions (Report Section 6)
There is an extensive amount of comparative quantitative solid waste management company profitability level information presented in this report section. The most common method that California jurisdictions use to determine franchise waste management company profitability is the operating ratio method. This ratio shows the efficiency of a company’s management by comparing operating expenses to revenues. For our surveyed jurisdictions, the median operating ratio was 90.0 percent (a profit rate of approximately eleven (11) percent of revenues). Mean operating ratios of nine (9) publicly traded companies between 1997 and 2007 were 87 percent on a weighted average basis. Mean operating ratios for privately held companies from 2001 to 2007 were 94.7 percent.
Ms. Gerri Silva August 5, 2008 Page 7
In the past, when the County has specifically provided a regulated operating ratio return to a franchise hauler, the operating ratio has either been 90 percent or has varied dependent upon recycling recovery levels (e.g., 87 to 94.3 percent, or 80 to 100 percent). There is also a considerable amount of comparative quantitative solid waste efficiency standards information presented in this report section. Productivity and efficiency measures discussed include collection measures, customer service measures, direct labor measures, cost measures, and other measures. Based on our site visits to each of the parent franchise companies, interviews of company management, and analyses of data provided by the six companies, we provide an assessment of the relative productivity and efficiencies of each franchise company. Generally, each of the six franchise companies cannot materially increase their refuse collection operating efficiencies given the constraints of their rural, seasonal, and hard-to-serve service areas, though they may be able to increase curbside recycling opportunities and efficiencies. Summary findings were that:
ADS cannot materially increase its collection operating efficiencies given the constraints of its rural and hard-to-service areas.
EDDS cannot materially increase its collection operating efficiencies in the hard-to-serve areas. EDDS has adapted by using manual-automated trucks to maximize efficiencies for collecting cans and carts in its rural areas. EDDS has sufficiently met current AB 939 diversion goals for the unincorporated County areas it serves
ARDS cannot materially increase its collection operating efficiencies given the constraints of its rural, seasonal, and hard-to-service areas
SDS cannot materially increase its collection operating efficiencies in its hard-to-service areas. With some degree of automation/cart-based service in the certain rural areas, SDS might be able to marginally increase its efficiencies
STR cannot materially increase its collection operating efficiencies given the range of conditions present in its service areas
TTDS cannot materially increase its collection operating efficiencies given the constraints of its rural and hard-to-service areas.
E. Franchise Agreement Valuations for County Solid Waste Services
(Report Section 7 and Appendix C)
At the request of the County we valued County solid waste services franchise agreements for each of the six companies. Among the County agreements, for upcoming expiration, one franchise expires in late 2009 (TTSD), some franchises expire in 2012 (ADS and EDDS), and the other franchises expire in 2014 (ARDS, SDS, and STR).
For solid waste services franchise valuations, we estimated discounted future profitability cash flows. Net present values of projected financial profitability varied substantially by company.

Ms. Gerri Silva August 5, 2008 Page 8
Net present values for projected allowable profits, assuming a ten year franchise term, ranged from $142,980 (ARDS) to $5,352,510 (EDDS). These are relatively small estimated franchise values compared to franchise values in many other California cities and counties. These franchise agreement valuation projections should only to be used as high level estimates for County planning purposes.
F. Franchise Agreement Options for County Solid Waste Services (Report Section 8)
The County faces decisions with each of its franchises as to whether or not to extend their franchises. We discuss factors that the County should consider when evaluating franchise extensions. We also assess options available to the County related to franchise agreements with its franchised solid waste companies. We recommend that the County take the following steps with its franchisees:
1. The County should develop at least a high level County solid waste management system plan before negotiating franchise extensions with any of its franchisees. This plan should align its future solid waste management system goals with the goals embodied in its franchise agreements. The system management plan should identify diversion plans; franchise boundaries; mandatory collection provisions; materials recovery facilities, transfer stations, and disposal facilities; rate setting process and methodologies; rate structure and rate objectives; service levels; and waste flows.
2. The County should entertain structured negotiations with each franchisee when time appropriate to assess the willingness of that franchisee to enhance its services to meet County solid waste management planning goals. Examples of enhanced services include piloting, or phasing in, new residential curbside collection programs such as full three-cart collection systems, cart-based recycling collection, or cart-based yardwaste collection, in portions of, or all of, a franchisee’s service area.
3. The County should conduct well documented, transparent, negotiations with its franchise companies to address the potential for new programs and/or services. The County should identify whether each negotiated term or condition is a County benefit, ratepayer benefit, franchisee benefit, or a combination benefit. The County may want to consider not only new services, but new franchise terms and conditions (e.g., rate setting process and methodology, annual adjustments, annual rate caps, rate freezes)
4. The County should structure future franchises with a base term of nine (9) years, with three (3) additional, two-year extensions (each with required approval by the County only). In total, a new franchise would represent a maximum potential 15-year term (including the three (3), two-year extensions)
5. The County should only consider a new formal competitive bid process for its refuse providers unless it can not come to agreeable terms with its current franchisees
6. The County should not contemplate refuse collection operations of its own, and the County should continue to utilize private sector franchises for refuse collection.

Ms. Gerri Silva August 5, 2008 Page 9
G. Recommendations for County Solid Waste Management, Rates, and Service Levels (Report Section 9) The County is presently faced with a number of complex, and interrelated, substantive solid
waste planning and rate setting issues. These issues will affect the County’s future ability to manage its overall solid waste system. We summarize the following key recommendations for the County.
1. Solid Waste Management Disparities
a. County Franchises and Authorities
i. The County should carefully negotiate any future franchise extension requests to capture additional services, including waste diversion programs, and benefits from their haulers in return for an extension. A broad range of appropriate diversion discussion items should be part of every new franchise extension request negotiation
ii. The County should work with its franchisees to enhance current curbside recycling programs in each franchise area. For some franchise areas, or portions of these franchise areas, this may involve piloting, or phasing in, cart-based curbside recycling. For other areas, this may involve placing materials in separate blue-bags outside the refuse container
b. “Non-Mandatory” Residential Refuse Collection
i. The County should clarify and expand its mandatory residential collection situation with Tahoe-Truckee Sierra Disposal, and with other relevant regulatory entities, for the East Slope of the Sierra. The County should require, and strictly enforce, mandatory residential refuse collection for unincorporated County areas served by both Tahoe-Truckee Sierra Disposal and South Tahoe Refuse on the East Slope of the County
ii. The County should undertake a formal study of the feasibility and impact of eliminating non-mandatory collection for the West Slope of the County. We believe that over the long-term the County likely will be best served with County-wide mandatory collection
c. Regulated Yard Waste Burning and Yard Waste Collection
i. The County should develop long-term alternatives to yard waste burning for all unincorporated areas
ii. The County should undertake a formal study of the feasibility and impact of eliminating the yard waste burning option for the West Slope of the County. This study would address issues of self-haul and illegal dumping; the impact of the policy of the need for new transfer stations in some rural parts of the County; and the potential interaction with the non-mandatory collection situation. We believe that over the long-term the County likely will be best served by elimination of the yard waste burning option

Ms. Gerri Silva August 5, 2008 Page 10
d. Disposal Facilities and Waste Management Facilities
i. The County should conduct some long range special planning studies to help address County waste management facility issues, including studies of (1) long-term siting a new landfill in the County; (2) truck long haul of solid waste out-of-state; (3) rail haul of solid waste out-of-County or state; and (4) other non-traditional disposal options
ii. The County should start to have some direct involvement in terms of ownership and/or control of its waste management facilities, however this should not extend to County run collection operations
iii. The County should study the issue of West Slope solid waste flow control and the eventual need for a West Slope Joint Powers Authority
iv. The County should integrate results of all of the above waste management recommendation initiatives into a comprehensive County solid waste management plan
2. Solid Waste Rate, Rate Structure, and Service Level Disparities
a. The County should accept some variation in its residential refuse, curbside recycling, and yard waste collection service levels throughout the County, as much of this variation is entirely justified due to the unique challenging operating conditions of the service areas. This does not mean that the County should remain status quo with its operations and service levels, but rather the County should work with its franchisees to implement thoughtful and incremental service level changes
b. The County should develop, implement, and enforce one common rate setting methodology that would be used for all six of its franchise refuse haulers
c. The County should use a rate setting methodology based on accounting for hauler allowable costs, pass through costs, and non-allowable costs using the industry standard ninety (90) percent operating ratio
d. The County should review, and if necessary refine, each franchise haulers’ rate structure at implementation of the common rate setting methodology. Some refuse haulers, like STR, should move from the unlimited can service rate to a more tiered residential rate structure. Other haulers, like SDS, should move toward a more tiered residential rate structure for some of their less remote areas. Finally some haulers, like EDDS, should create better pricing incentives by revising their residential rate structures.
* * * * *
NewPoint Group wishes to thank County management and staff from the Environmental Management Department who enthusiastically assisted us on this rapid, four month study. These persons included Ms. Gerri Silva, Mr. Greg Stanton, Ms. Kerri Williams, and Mr. Kevin Gilliland. We also wish to thank management of all three parent franchise companies for their full cooperation on this project, each of whom spent considerable time and effort responding to our numerous information requests.

Ms. Gerri Silva August 5, 2008 Page 11
The statements and conclusions in this report are those of NewPoint Group, and not necessarily those of the Environmental Management Department. The Department gave us full independence in developing our findings and recommendations, and the Department assumes no liability for information in the succeeding text. If there are any questions, or comments, concerning this report, please do not hesitate to contact me, at (916) 442-0189, or Mr. Erik Nylund, at (916) 442-2456, in Sacramento. Thank you for the opportunity to provide these waste management consulting services to the County.
Very truly yours,
James A. Gibson, Ph.D. Director
cc: Greg Stanton, Deputy Director,
Environmental Management Department

Table of Contents
Section Page
1. Introduction and Background for Study.........................................1-1 A. Study Objectives and Scope........................................................................1-2
B. County Franchise Background ...................................................................1-2
2. Solid Waste Rate and Service Levels ..............................................2-1 A. Residential Solid Waste Collection .............................................................2-1
B. Commercial Solid Waste Collection ...........................................................2-6
C. Industrial Solid Waste Collection ...............................................................2-8
D. Transfer Stations and Landfills ...................................................................2-8
E. Summary of Solid Waste Rate and Service Levels .....................................2-12
3. Solid Waste Rate and Service Levels and Comparisons between the County and Selected Jurisdictions ..........................3-1
A. Residential Solid Waste Collection Comparisons........................................3-2
B. Commercial Solid Waste Collection Comparisons......................................3-7
C. Industrial Solid Waste Collection Comparisons........................................3-16
D. Tipping Fee Comparisons ........................................................................3-18
E. Summary of Solid Waste Collection Comparisons....................................3-21
4. Solid Waste Rate and Service Level Comparisons between the County and Jurisdictions Meeting AB 939 Diversion Levels ......4-1
A. Historical Assembly Bill 939 Diversion Levels ............................................4-1
B. Residential Solid Waste Collection Comparisons........................................4-4
C. Summary of Residential Rate and Service Level Comparisons...................4-10
5. Solid Waste Franchise Fees and Comparisons.................................5-1 A. El Dorado County Franchise Fees ..............................................................5-1
B. Comparative Jurisdiction Franchise Fees ....................................................5-2
C. Franchise Fee Comparisons ........................................................................5-7
6. Solid Waste Services Profitability Level and Waste Management Industry Standard Comparisons Between the County and Selected Jurisdictions .............................6-1
A. Regional Solid Waste Services Profitability Levels.......................................6-1
B. Waste Management Industry Profitability Standards ..................................6-4
C. Overview of Industry Productivity and Efficiency Standards ......................6-8
D. Discussion of El Dorado County Collection Company Operating Efficiencies ..............................................................................6-10

Table of Contents
Section Page
7. Franchise Agreement Valuations for County Solid Waste Services ......................... 7-1 A. Overview of El Dorado County Solid Waste Services Franchise Agreements ............................. 7-1
B. Valuations of Solid Waste Services Franchise Agreement Terms................................................ 7-4
C. Franchise Agreement Valuation Summary ................................................................................ 7-8
8. Franchise Agreement Options for County Solid Waste Services.................................. 8-1 A. County Franchise Extension Requests....................................................................................... 8-2
B. Selected Factors to Consider With Franchise Extensions........................................................... 8-6
C. Evaluation of Franchise Options ............................................................................................... 8-8
D. Recommendations for Franchise Extension Negotiations ........................................................ 8-12
9. Recommendations for County Solid Waste Management, Rates, and Service Levels ............................................................................................. 9-1 A. Key Solid Waste Management Disparities and Recommendations ............................................ 9-1
B. Solid Waste Rate, Rate Structure, and Service Level Disparities and Recommendations............ 9-6
C. Solid Waste Rate Setting Disparities and Recommendations..................................................... 9-9
Appendices Page
A. Comparative Jurisdiction Solid Waste Rate and Service Level Surveys..................A-1
B. Solid Waste Rate and Service Levels for Jurisdictions Meeting AB 939 Diversion Levels.................................................................................................B-1
C. Profitability Projections and Discounted Profitability Cash Flow Analyses for Franchise Companies............................................................................................. C-1
ii Solid Waste Rate and Service Study
Section 1 Introduction and
Background for Study

1. Introduction and Background for Study
The County of El Dorado (County) contracted with NewPoint Group, Inc. (NewPoint Group) to conduct this solid waste rate and service study to: (1) assess current County rates and service levels; (2) compare County operations and financial results with other jurisdictions; (3) assess profitability and system requirements of its franchise companies; and (4) recommend a new residential collection system and rate structure.
NewPoint Group was retained to assist the County with a broad range of waste management issues. This report presents our work results on thirteen (13) work tasks, presented in our Phase I Work Plan. These thirteen work tasks are cross-referenced to the different sections of this report, below.
Contract Work Tasks Report Sections
1. Compare and analyze current County rates and service levels (Section 2)
2. Survey, comparable to the County, rates and service levels (Section 3)
3. Identify diversion levels, rates, and service levels of the County; (Section 4) and compare them to similar jurisdictions meeting AB 939 goals
4. Recommend adjustments to County rates and service levels (Section 9)
5. Identify County rate and service level problems, and (Section 9) recommend solutions
6. Recommend an effective and efficient County residential (Section 9) collection system and rate schedule
7. Survey profitability levels for companies serving (Section 6) County areas
8. Survey industry profitability, productivity, and (Section 6) efficiency standards
9. Value franchise agreements for the County franchise companies (Section 7)
10. Survey, comparable to the County, franchise fees paid by haulers (Section 5)
11. Participate in County meetings to convey study results (Section 1)
12. Prepare draft, and final, reports for the County (Entire Report)
13. Assess County franchise agreement extension options. (Section 8).
The remainder of this section is organized as follows:
A. Study Objectives and Scope B. County Franchise Background.

1. Introduction and Background for Study
A. Study Objectives and Scope We prepared analyses in this report in response
to the County’s scope of work request for solid waste rate and service consulting assistance. NewPoint Group submitted a proposal to provide solid waste rate and service assistance to the County on November 2, 2007. NewPoint Group finalized a contract with the County on February 12, 2008, to perform these services.
To fully understand the range of waste management problems and issues affecting the entire County, this study included both West Slope, and East Slope, County service areas. This comprehensive County-wide scope was necessary to develop meaningful and practical waste management findings and recommendations.
In this study, we obtained supporting information for current rates and service levels from the County, and its franchise companies, for all the residential, commercial, and industrial sectors. We also obtained comparative information for residential, commercial, and industrial rates, and service levels, as well as transfer stations and landfills, by conducting comparative jurisdiction surveys.
In addition, we obtained franchise company profitability (where available), and diversion information, pertaining to the County. For waste management company financial return data, we drew upon historical data in our own database of returns for publicly held, and privately held, solid waste collection and disposal companies. Based on all the information collected, we developed a series of summary matrices that compared franchise company rates and service levels; tipping fees; franchise fees; and diversion levels.
As requested by the County, we valued the County franchise agreements. By analyzing recent financial statements; rate applications and rate review documents; and other cost information for
each company, we projected up to fifteen years of discounted profitability cash flow for each company.
B. County Franchise Background El Dorado County (County) is currently faced
with several challenging waste management system issues. The County is unique due to its (1) relatively large size, and geographic variability; (2) urban and rural population mixes; and (3) diverse climate conditions.
The recent annual total County population growth of eight to ten percent is among the State’s highest, with the 2025 total County population projected at 243,000 persons. This demographic projection means that 67,000 new persons would be added to the County’s 2006 total population of approximately 176,000 persons, during the 19-year period, from 2006 to 2025.
The County has solid waste collection franchises with the following six (6) companies, two of which are Waste Connections companies, and three of which are South Tahoe Refuse companies:
A. Waste Connections of California 1. Amador Disposal Service
– West Slope
2. El Dorado Disposal Services – West Slope
B. South Tahoe Refuse Company 3. American River Disposal Service
– East Slope
4. Sierra Disposal Service – West Slope
5. South Tahoe Refuse Company – East Slope
C. Tahoe-Truckee Sierra Disposal Company 6. Tahoe-Truckee Sierra Disposal
– East Slope.
The County has solid waste collection franchise agreements with each of these six companies. These six companies service six (6)
1-2 Solid Waste Rate and Service Study
different unincorporated County areas, as shown in Exhibit 1-1, on the next page. In the 1970s, over nearly forty years ago, the County established these geographic areas based on legacy factors such as road/bridge infrastructure and proximity to landfill sites.
The County distinguishes between West Slope service areas, and East Slope services areas. The West Slope service areas include areas within the current boundaries of the solid waste collection franchises for (1) Amador Disposal Service, (2) El Dorado Disposal Services, and (3) Sierra Disposal Service.1 East Slope service areas are those served by (1) American River Disposal Service, (2) South Tahoe Refuse Company, and (3) Tahoe-Truckee Sierra Disposal.1
As shown in Table 1-1, on page 1-6, Waste Connections companies serve approximately 57 percent of the County’s residential accounts. South Lake Tahoe Refuse companies serve another approximately 40 percent of the County’s residential accounts, while Tahoe-Truckee Sierra Disposal serves approximately three (3) percent of the County’s residential accounts.
El Dorado Disposal Services (Waste Connections) also serves Cameron Park (Cameron Park Community Services District), El Dorado Hills (El Dorado Hills Community Services District), and the City of Placerville under separate non-County franchises. Finally, South Tahoe Refuse Company, also serves the City of South Lake Tahoe, under a separate non-County franchise.
Estimated 2006 populations for four, non-County franchise areas are as follows:
Cameron Park – 18,000
El Dorado Hills – 35,000
City of Placerville – 10,000
City of South Lake Tahoe – 24,000.
1 Source: Franchise Agreements between the County and the haulers.
Western El Dorado Recovery Systems, a company with common ownership to El Dorado Disposal Services, provides transfer station and Materials Recovery Facility (MRF) operations, and an on-site certified recycling redemption and household hazardous waste (HHW) center for various customers on the West Slope of the County. South Tahoe Refuse Transfer Station, owned by South Tahoe Refuse Company, serves the surrounding Lake Tahoe area, and also operates a MRF and transfer station that includes a buy-back center and a free HHW program for various customers on the East Slope of the County. Tahoe Truckee Sierra Disposal Company operates a transfer station and MRF, buyback center, and HHW operation in unincorporated Placer County, near Truckee, California.
Given the current challenging waste management conditions for the County (a large and varied geography, a diverse and growing population, and a wide range of climates), waste management in the County is further complicated by several other important key factors, as summarized below:
Different rate structures and rates – Residential solid waste rates vary widely by service area
Different rate setting methodologies – The County uses different solid waste rate setting methodologies for different franchise areas
Different service levels – The urban portions, and rural portions, of the County receive different solid waste service levels
Different residential solid waste management options – There are two residential solid waste management options, in addition to the current solid waste collection services, as follows:
Yard waste burn option
Non-mandatory collection (self-haul) option
1-3
1. Introduction and Background for Study
Exhibit 1-1 Areas Served by Six County Solid Waste Collection Franchise Companies
Solid Waste Rate and Service Study El Dorado County
1-4 Solid Waste Rate and Service Study

1-5
1. Introduction and Background for Study
Table 1-1 Summary of Six County Solid Waste Collection Franchisees and Service Areas
Solid Waste Rate and Service Study El Dorado County
Region Parent Company Company Estimated Number of
Residential Unincorporated County Customersa
Unincorporated County Areas Served
West Slope
A. Waste Connections of California
A.1 Amador Disposal Service
2,005 South County (Somerset, Grizzly Flats, and Mt. Aukum)
A.2 El Dorado Disposal Services
13,671 West County along Highway 50 Corridor (Pollock Pines west to El Dorado Hills)
B. South Tahoe Refuse Company
B.4 Sierra Disposal Service
4,661 North County (Coloma, Pilot Hill, Cool, Lotus, Georgetown, Garden Valley, Greenwood, and Auburn Lake Trails)
East Slope
B. South Tahoe Refuse Company
B.3 American River Disposal Service
211 High Mountain County (Pacific House, Crystal Basin, Kyburz, Strawberry, and Echo Summit)
B.5 South Tahoe Refuse Company
5,943 South Lake Tahoe Basin (Meyers, Christmas Valley, and Hope Valley)
C. Tahoe-Truckee Sierra Disposal
C.6 Tahoe-Truckee Sierra Disposal
757 West Lake Tahoe Basin (Meeks Bay, Rubicon, and Tahoma)
Total 27,248 a A county customer could equate to approximately 2.5 to 3.0 persons in the County population.
Different solid waste material processing approaches and capabilities - Franchise companies use different transfer stations/MRFs and landfills
Different solid waste franchise agreement terms – The County has six (6) different franchise agreements with the franchise companies, each with different expiration dates
Different solid waste diversion levels – Each franchise has different diversion levels. The County deserves a County-wide system capable of moving beyond the current AB 939 goal.
All of these additional challenges are presented as background to the various rate and service analyses, presented herein this report.
1-6 Solid Waste Rate and Service Study

Section 2 Solid Waste Rate
and Service Levels

2. Solid Waste Rate and Service Levels
This section describes the solid waste collection systems in use for the County. The collection systems handle County refuse, recycling, and yard waste services. The County currently has six (6) exclusive franchise companies. These exclusive franchise companies provide residential, commercial, and industrial solid waste collection; transportation; processing and recycling; and disposal services for the County franchise area customers.
In this section, County rates and service levels are described for residential, commercial, and industrial services, by franchise company and area. For residential solid waste collection services, we provide information for refuse, curbside recycling, and yard waste services. Under each rate and service category, for each of the three residential, commercial, and industrial service sectors, we calculated rate statistics, such as average, median, minimum and maximum; difference between minimum and maximum; and standard deviation.
This section includes current County residential, commercial, and industrial solid waste collection rate and service level data, as baseline data for this study. An understanding of the existing solid waste collection rates, and service levels, is necessary so recommendations can be made to improve County rates and service levels; to resolve rate or service level problems; and to identify and develop effective and efficient solid waste collection systems and rate schedules for the County.
The remainder of this section is organized as follows:
A. Residential Solid Waste Collection B. Commercial Solid Waste Collection C. Industrial Solid Waste Collection D. Transfer Stations and Landfills E. Summary of Solid Waste Rate and Service Levels.
A. Residential Solid Waste Collection 1. Residential Solid Waste Collection Rates
In Table 2-1, on the next page, we show El Dorado County residential solid waste collection rates for five (5) service levels. For El Dorado Hills, served by El Dorado Disposal Services, the $20.99 rate is for a 35-gallon cart service level. We included this rate in the 1, 32-gallon can category as an equivalent rate. For the County franchise area served by South Tahoe Refuse Company, the $23.79 rate is for unlimited can service. We included this rate in the 2, 32-gallon can category as an equivalent rate.
2. Solid Waste Rate and Service Levels
Table 2-1 Residential Solid Waste Collection Rates for El Dorado County
Per Customer, per Month (As of January 2008)
Solid Waste Rate and Service Study El Dorado County
Service Level No. Company/Area 1, 32-Gallon
Can 1, 45-Gallon
Can 2, 32-Gallon
Cans 1, 64-Gallon
Cart 1, 96-Gallon
Cart
A Waste Connections of California
1.0 Amador Disposal Service7 $14.13 $16.97 $20.90 N/A $25.69
2.0 El Dorado Disposal Services
2.1 – Cameron Park10 N/A N/A N/A $22.44 22.79
2.2 – City of Placerville1, 8, 11 15.50 18.36 24.46 N/A N/A
2.3 – El Dorado Hills2, 12 20.99 N/A N/A 22.61 31.68
2.4 – Unincorporated County Area3, 9 18.20 20.69 27.55 26.26 27.93
B South Tahoe Refuse Company
3.0 American River Disposal Service 13.46 15.62 18.09 N/A N/A
4.0 Sierra Disposal Service6 18.42 22.34 26.31 N/A N/A
5.0 South Tahoe Refuse Company4 N/A N/A 23.79 N/A N/A
C Tahoe-Truckee Sierra Disposal Company
6.0 Tahoe Truckee Sierra Disposal5 16.21 N/A 21.76 N/A N/A
Mean of All County Areas $16.70 $18.80 $23.27 $23.77 $27.02
Number of Rates 7 5 7 3 4
Mean of Unincorporated County Franchise Areas $16.08 $18.91 $23.07 $26.26 $26.81
Number of Rates 5 4 6 1 2
Median $16.21 $18.83 $22.78 $26.26 $26.81
Minimum $13.46 $15.62 $18.09 $26.26 $25.69
Maximum $18.42 $22.34 $27.55 $26.26 $27.93
Difference Between Minimum and Maximum $4.96 $6.72 $9.46 $0.00 $2.24
Standard Deviation $2.27 $3.14 $3.53 – $1.58 1 The rates do not include a $3.32 additional charge for yard waste service. 2 The $20.99 rate is for a 35-gallon cart service. We included this rate in the 1, 32-gallon can equivalent rate category. 3 These rates do not include a $2.00 additional charge for yard waste service (for can customers only). 4 The $23.79 rate is for unlimited can service. We included this rate in the 2, 32-gallon can equivalent rate category. 5 The rates include a $0.26 additional charge for blue bag curbside recycling service. The blue bag recyclables are placed next to the can. 6 These rates include a 10.74 percent Sierra Disposal Service rate increase effective June 1, 2007. 7 These Amador Disposal Service rates include a fuel surcharge effective October 1, 2006. 8 The City of Placerville has proposed a new cart-based system. The proposed rates for a 32-, 64-, and 96-gallon cart are $17.37,
$27.02, and $32.42, respectively (including fuel surcharge). These rates also include a 64- or 96-gallon recycling cart (bi-weekly), and a 96-gallon yardwaste cart (bi-weekly).
9 These EDDS Unincorporated County rates include a fuel surcharge effective July 2007. 10 These EDDS Cameron Park rates include a fuel surcharge effective July 2007. 11 These City of Placerville rates include a fuel surcharge effective September 1, 2006. 12 These El Dorado Hills rates include a fuel surcharge.
2-2 Solid Waste Rate and Service Study

Table 2-2 Residential Solid Waste Collection Rates for El Dorado Disposal Services
Per Customer, per Month (As of January 2008)
Solid Waste Rate and Service Study El Dorado County
Area 1, 64-Gallon
Cart 1, 96-Gallon
Cart
Cameron Park $22.44 $22.79
City of Placerville N/A N/A
El Dorado Hills $22.61 $31.68
Unincorporated County Area $26.26 $27.93
We didn’t include the additional charges for yard waste service, if any, in the rates presented in Table 2-1. For example, the City of Placerville, served by El Dorado Disposal Services, has a $3.32 additional charge for yard waste service. The Unincorporated County area served by El Dorado Disposal Services, has a $2.00 additional charge for yard waste service for can customers. For the County franchise area, served by Tahoe-Truckee Sierra Disposal, the rates include a $0.26 additional charge for curbside recycling bag service.
For the purposes of this study, we focused on the unincorporated County franchise areas, which include the following areas:
1.0 Amador Disposal Service
2.4 El Dorado Disposal Services, Unincorporated County Area
3.0 American River Disposal Service
4.0 Sierra Disposal Service
5.0 South Tahoe Refuse Company
6.0 Tahoe-Truckee Sierra Disposal.
Our statistics and analyses in the report were based on these unincorporated County franchise area rates. For example, “County mean” refers to the mean of unincorporated County franchise
areas; same for the other statistics, such as median, minimum, maximum, difference between minimum and maximum, and standard deviation.
County mean residential solid waste collection rates, per customer, per month, were as follows:
1, 32-gallon can: $16.08
1, 45-gallon can: $18.91
2, 32-gallon cans: $23.07
1, 64-gallon cart: $26.26
1, 96-gallon cart: $26.81.
The mean 2, 32-gallon can rate was lower than the mean 1, 64-gallon cart rate, differing by $3.19, or 12 percent.
County residential rates vary widely by service level. Among the service levels, the 2, 32-gallon cans service level has the largest range, and the 1, 64-gallon cart service level has the smallest range, compared to the other service levels within the County. Not all five service levels are provided by each company.
County residential rates also vary widely by service area. For example, El Dorado Disposal Services serves four County residential collection areas, and has different rates for each area. We assessed rate differences across those areas served by this company.
Table 2-2, left, shows El Dorado Disposal Services residential rates for 64-, and 96-gallon cart service levels, by its different service areas, including Cameron Park Community Services District (Cameron Park CSD), the City of Placerville, El Dorado Hills CSD, and the Unincorporated County area. For these four areas, El Dorado Hills has a much larger rate difference between the 64- and 96-gallon cart service levels than the other three collection areas do. In contrast, for Cameron Park CSD and the Unincorporated County area, there are small rate differences between the 64- and 96-gallon cart service levels, so customers may have little incentive to select the cart size most appropriate for their refuse generation level.
2-3

2. Solid Waste Rate and Service Levels
Table 2-3 Residential Solid Waste Collection Service Levels for El Dorado County
Per Customer, per Month (As of January 2008)
Solid Waste Rate and Service Study El Dorado County
Service Type No. Company/Area
Refuse* Curbside Recycling* Yard Waste*
A Waste Connections of California
1.0 Amador Disposal Service 32 or 45-gallon can(s), or 96-gallon cart, weekly
Blue bag in the cans, weekly None
2.0 El Dorado Disposal Services
2.1 – Cameron Park 64 or 96-gallon cart, weekly 64-gallon or 96-gallon cart, biweekly 96-gallon carts, biweekly
2.2 – City of Placerville 32 or 45-gallon can(s), weekly
Blue bin or customer provided containers, weekly
Customer provided bags or containers, taken to the Recycle Center for free by customer
2.3 – El Dorado Hills 35, 64, or 96-gallon cart, weekly
64-gallon or 96-gallon cart, biweekly 96-gallon carts, biweekly
2.4 – Unincorporated County Area 32 or 45-gallon can(s), or 64 or 96-gallon cart, weekly
64 or 96-gallon carts, or blue bags, biweekly
96-gallon carts, bags, or bundles, biweekly
B South Tahoe Refuse Company
3.0 American River Disposal Service 32 or 45-gallon can(s), weekly
None, material is sorted at MRF
None, material is sorted at MRF
4.0 Sierra Disposal Service 32 or 45-gallon can(s), weekly Blue bags, weekly None
5.0 South Tahoe Refuse Company Unlimited can(s), weekly None, material is sorted at MRF
None, material is sorted at MRF
C Tahoe-Truckee Sierra Disposal Company
6.0 Tahoe-Truckee Sierra Disposal 32-gallon can(s), weekly Blue bags (outside refuse container), weekly None
* Carts are provided by the companies. Cans are provided by customers.
2. Residential Solid Waste Collection Service Levels
We summarized current County residential solid waste collection service levels for refuse, curbside recycling, and yard waste services, in Table 2-3, above. This table includes detailed information on container sizes, container types, and collection frequencies, for each of the franchise areas.
a. Residential Refuse Services
Pursuant to Section 6 of the Franchise Agreements, between the County and its franchise companies, refuse services are once-a-week services. For County residential refuse collection services, refuse is picked up once a week in all service areas. However, County customers are offered different service level options in terms of container size and container type, depending on the service area. For example, in the more urban portions of the County (e.g., Cameron Park CSD and El Dorado Hills
2-4 Solid Waste Rate and Service Study

CSD), served by El Dorado Disposal Services, customers select a refuse cart (provided by the company serving the area), from the following sizes:
El Dorado Disposal Services, Cameron Park CSD – 64 or 96-gallon cart
El Dorado Disposal Services, El Dorado Hills CSD – 35, 64 or 96-gallon cart.
For the more rural County areas, and the City of Placerville, customers generally provide their own can(s), and decide the number of cans for refuse service, as follows:
El Dorado Disposal Services, City of Placerville – 32 or 45-gallon can(s)
American River Disposal Service, County Franchise Area – 32 or 45-gallon can(s)
Sierra Disposal Service, County Franchise Area – 32 or 45-gallon can(s)
South Tahoe Refuse Company, County Franchise Area – Unlimited can(s)
Tahoe-Truckee Sierra Disposal, County Franchise Area – 32-gallon can(s).
There are two collection areas with both can and cart service options available to the customers. Customers can choose between can service and cart service, as follows:
Amador Disposal Service, County Franchise Area – 32 or 45-gallon can(s) or 96-gallon cart
El Dorado Disposal Services, County Franchise Area – 32- or 45-gallon can(s), or 64 or 96-gallon cart.
b. Residential Curbside Recycling Services
Depending on the service area, there are three types of residential curbside recycling container options offered to County customers, including blue bag, blue bin, or cart. Blue bags are collected weekly, or bi-weekly, the larger 64- and 96-gallon carts are collected biweekly, and the blue bin is collected weekly.
In areas served by El Dorado Disposal Services, most customers are offered a biweekly cart option for curbside commingled recycling services (up to two, 64-, or 96-gallon carts provided by the company). However, in the City of Placerville, customers are offered blue bin, or customer provided, containers for recycling services. Recycling servers are as follows:
96-gallon cart, biweekly – Cameron Park CSD, El Dorado Hills CSD
64-gallon or 96-gallon carts, or blue bags, biweekly – El Dorado Disposal Services Unincorporated County area
Blue bin, or customer provided, containers, weekly – the City of Placerville.
In addition to El Dorado Disposal Services, there are three other County franchise areas with blue bag curbside recycling service, as follows:
Blue bags – Amador Disposal Service, Sierra Disposal Service, and Tahoe-Truckee Sierra Disposal County franchise areas.
In the County franchise areas served by American River Disposal Service and South Tahoe Refuse Company, curbside recycling service is not available. In these two areas, materials are sorted at the South Tahoe Refuse Transfer Station “dirty” MRF.
Residential curbside recycling service rates are included in the standard refuse collection services for most customers, except that in the County franchise area served by Tahoe-Truckee Sierra Disposal, there is a $0.26 additional charge for curbside recycling service (this additional charge is included in the rates presented in Table 2-1, above).
c. Residential Yard Waste Services
In the County, El Dorado Disposal Services is the only franchise company that provides residential yard waste services to its customers. El Dorado Disposal Services provides 96-gallon cart services, biweekly, for curbside yard waste services to most of its area customers, such as customers in the
2-5

2. Solid Waste Rate and Service Levels
Cameron Park CSD, El Dorado Hills CSD, and the Unincorporated County area.
Any County customer can take bags or containers of yard waste to the Waste Connections recycling center at 580 Truck Street between Tuesday and Saturday from 8:30 a.m. to 4:00 p.m., for free of charge. In the Unincorporated County area, El Dorado Disposal Services also provides yard waste service options, such as bags, or bundles. There is a $3.32 additional charge for the City of Placerville customers, and a $2.00 additional charge for the Unincorporated County area customers.
In the rest of the County franchise areas, the companies don’t provide residential yard waste service to their customers. In these service areas, instead of customers separating materials, materials are sorted at the South Tahoe Refuse Transfer Station dirty MRF. These County franchise areas, without yard waste service available, are as follows:
Amador Disposal Service, County Franchise Area
American River Disposal Service, County Franchise Area
Sierra Disposal Service, County Franchise Area
South Tahoe Refuse Company, County Franchise Area
Tahoe-Truckee Sierra Disposal, County Franchise Area.
In addition to the curbside yard waste services provided by El Dorado Disposal Services, the County also presently employs a yard waste burn option. County customers may burn tree trimmings, leaves, dry pine needles, and plants on their property during scheduled burn days and times. As a result, these customers may not require curbside yard waste services.
B. Commercial Solid Waste Collection
Similar to residential services, the six franchise companies provide County commercial solid waste collection services. Each company serves its own exclusive franchise area, as described for residential services above.
In Table 2-4, on the next page, we show El Dorado County commercial solid waste collection rates for the most common 1-, 2-, 3-, 4-, and 6-cubic yard, 1 time per week service levels, and 1-, 2-, 3-, 4-, and 6-cubic yard, 2 times per week service levels.
We included some equivalent rates in Table 2-4. For example, for Amador Disposal Service, we assumed 2 times per week service level rates were twice the 1 time per week service level rates, for the same cubic yard service level. For American River Disposal Service, Sierra Disposal Service, and South Tahoe Refuse Company, which are under the same parent company (i.e., South Tahoe Refuse Company), we used the 1-cubic yard, 1 time per week rates, as the base rates for calculating the other service level rates. For instance, the 2-cubic yard, 1 time per week rate, was twice the 1-cubic yard, 1 time per week rate, and the 2-cubic yard, 2 times per week rate, was four times the 1-cubic yard, 1 time per week rate, etc.
County mean commercial 1 time per week bin rates, per customer, per month, were as follows:
1-cubic yard : $38.79
2-cubic yard : $73.46
3-cubic yard : $116.35
4-cubic yard : $152.49
6-cubic yard : $215.50.
And County mean commercial 2 times per week bin rates, per customer, per month, were as follows:
1-cubic yard : $77.57
2-cubic yard : $185.72
2-6 Solid Waste Rate and Service Study

Table 2-4 Commercial Solid Waste Collection Rates for El Dorado County
Per Customer, per Month (As of January 2008)
Solid Waste Rate and Service Study El Dorado County
Service Level 1 time per week service No. Company/Area
1-yd 2-yd 3-yd 4-yd 6-yd A Waste Connections of California
1.0 Amador Disposal Service $54.21 $108.47 N/A N/A $162.71 2.0 El Dorado Disposal Services1 2.1 – Cameron Park 73.93 128.02 $191.19 $251.56 377.35 2.2 – City of Placerville 73.03 126.38 188.75 248.43 364.56 2.3 – El Dorado Hills 66.81 115.63 172.69 227.29 333.54 2.4 – Unincorporated County Area 76.82 133.01 198.65 261.37 392.07 B South Tahoe Refuse Company
3.0 American River Disposal Service* 14.16 28.32 42.48 56.64 84.96 4.0 Sierra Disposal Service* 20.21 40.42 60.63 80.84 121.26 5.0 South Tahoe Refuse Company* 28.53 57.06 85.59 114.12 171.18 C Tahoe-Truckee Sierra Disposal Company
6.0 Tahoe-Truckee Sierra Disposal N/A N/A 194.42 249.49 360.80 Mean of All County Areas $50.96 $92.16 $141.80 $186.22 $263.16 Number of Rates 8 8 8 8 9 Mean of Unincorporated County Franchise Areas $38.79 $73.46 $116.35 $152.49 $215.50 Number of Rates 5 5 5 5 6 Median $28.53 $57.06 $85.59 $114.12 $166.95 Minimum $14.16 $28.32 $42.48 $56.64 $84.96 Maximum $76.82 $133.01 $198.65 $261.37 $392.07 Difference Between Minimum and Maximum $62.66 $104.69 $156.17 $204.73 $307.11 Standard Deviation $26.18 $45.19 $74.79 $96.25 $128.81
2 times per week service No. Company/Area
1-yd 2-yd 3-yd 4-yd 6-yd A Waste Connections of California
1.0 Amador Disposal Service* $108.42 $216.94 N/A N/A $325.42 2.0 El Dorado Disposal Services1 2.1 – Cameron Park 147.86 256.03 $382.40 $503.13 754.69 2.2 – City of Placerville 146.05 252.75 377.49 496.87 735.33 2.3 – El Dorado Hills 133.63 240.57 345.39 454.59 667.07 2.4 – Unincorporated County Area 153.63 460.05 397.29 522.75 784.12 B South Tahoe Refuse Company
3.0 American River Disposal Service* 28.32 56.64 84.96 113.28 169.92 4.0 Sierra Disposal Service* 40.42 80.84 121.26 161.68 242.52 5.0 South Tahoe Refuse Company* 57.06 114.12 171.18 228.24 342.36 C Tahoe-Truckee Sierra Disposal Company
6.0 Tahoe-Truckee Sierra Disposal N/A N/A 367.12 457.11 706.52 Mean of All County Areas $101.92 $209.74 $280.89 $367.21 $525.33 Number of Rates 8 8 8 8 9 Mean of Unincorporated County Franchise Areas $77.57 $185.72 $228.36 $296.61 $428.48 Number of Rates 5 5 5 5 6 Median $57.06 $114.12 $171.18 $228.24 $333.89 Minimum $28.32 $56.64 $84.96 $113.28 $169.92 Maximum $153.63 $460.05 $397.29 $522.75 $784.12 Difference Between Minimum and Maximum $125.31 $403.41 $312.33 $409.47 $614.20 Standard Deviation $55.49 $178.20 $151.39 $192.03 $265.41
Note: *Equivalent rates. 1 The rates include a fuel surcharge.
2-7

2. Solid Waste Rate and Service Levels
3-cubic yard : $228.36
4-cubic yard : $296.61
6-cubic yard : $428.48.
Similar to County residential rates, commercial rates vary widely, by service level. For example, for 1 time per week service, 1-cubic yard rates ranged from $14.16 to $76.82, or by $62.66, per customer, per month; 2-cubic yard rates ranged from $28.32 to $133.01, or by $104.69, per customer, per month; 3-cubic yard rates ranged from $42.48 to $198.65, or by $156.17, per customer, per month; 4-cubic yard rates ranged from $56.64 to $261.37, or by $204.73, per customer, per month; and 6-cubic yard rates ranged from $84.96 to $392.07, or by $307.11, per customer, per month.
The commercial rates vary more as service levels increase. For example, the 6-cubic yard service level, 2 times per week, has the largest rate range compared to the other commercial service levels within the County. In contrast, the 1-cubic yard service level, 1 time per week, has the smallest rate range.
C. Industrial Solid Waste Collection
In Table 2-5, on the next page, we present El Dorado County industrial solid waste collection rates for two common 20-, and 30-cubic yard drop box service levels. In order to have a consistent rate structure for all County franchise companies, we didn’t include the additional per ton tipping fee charges in excess of certain tons (e.g., 2, 3.5, 5, or 7 tons) in the rates presented in Table 2-5, instead we noted selected details as footnotes.
County mean industrial drop box rates, per pick up, were as follows:
20-cubic yard drop box: $356.64
30-cubic yard drop box: $519.78.
Industrial rates vary by service level. For example, 20-cubic yard drop box rates ranged from $331.50 to $427.98 per pick up, or by $96.48. The 30-cubic yard drop box rates ranged from $430.16 to $638.15 per pick up, or by $207.99. The 30-cubic yard drop box rates have a relatively large range compared to the 20-cubic yard drop box rates.
El Dorado Disposal Services provides industrial service to its four collection area customers at relatively tightly grouped rates for both 20- and 30-cubic yard drop box services. For example, 20-cubic yard drop box rates ranged from $318.43 to $341.50, or by $23.07, and 30-cubic yard drop box rates ranged from $401.22 to $430.17, or by $28.95.
D. Transfer Stations and Landfills Transfer station and Materials Recovery Facilities,
and landfills are key elements in the County solid waste collection system. County customers are served by four (4) Materials Recovery Facilities (MRFs) and transfer stations (two in-County), as follows:
Western El Dorado Recovery Systems (WERS) MRF, located at Diamond Springs, California (El Dorado County)
Western Amador Recovery Facility (WARF), located at Ione, California (Amador County)
South Tahoe Refuse Transfer Station, located at South Lake Tahoe, California (El Dorado County)
Eastern Regional Transfer Station, located in Placer County.
In addition, there are three landfills, all out-of-County, used by the six El Dorado County haulers, as follows:
Forward Landfill – located at Manteca, California (San Joaquin County)
Kiefer Landfill – located at Sacramento, California (Sacramento County)
Lockwood Landfill – located at Sparks, Nevada (Washoe County).
2-8 Solid Waste Rate and Service Study

Table 2-5 Industrial Solid Waste Collection Rates for El Dorado County
Per pick up (As of January 2008)
Solid Waste Rate and Service Study El Dorado County
Service Level No. Company/Area
20-cubic yard drop box 30-cubic yard drop box
A Waste Connections of California
1.0 Amador Disposal Service1 $331.50 $488.81
2.0 – El Dorado Disposal Services8
2.1 – Cameron Park2 341.50 430.17
2.2 – City of Placerville3 320.82 404.01
2.3 – El Dorado Hills4 318.43 401.22
2.4 – Unincorporated County Area5 341.50 430.16
B South Tahoe Refuse Company
3.0 American River Disposal Service 332.70 515.30
4.0 Sierra Disposal Service6 427.98 638.15
5.0 South Tahoe Refuse Company7 349.50 526.50
C Tahoe-Truckee Sierra Disposal Company
6.0 Tahoe-Truckee Sierra Disposal N/A N/A
Mean of All County Areas $345.49 $479.29
Number of Rates 8 8
Mean of Unincorporated County Franchise Areas $356.64 $519.78
Number of Rates 5 5
Median $341.50 $515.30
Minimum $331.50 $430.16
Maximum $427.98 $638.15
Difference Between Minimum and Maximum $96.48 $207.99
Standard Deviation $40.54 $75.94 1 There is a $68.00 additional per ton charge, beyond 3.5 tons for 20-cubic yard drop box, and beyond 5 tons for 30-cubic yard drop box.
2 There is a $70.00 additional per ton charge, beyond 3.5 tons for 20-cubic yard drop box, and beyond 5 tons for 30-cubic yard drop box.
3 There is a $65.60 additional per ton charge, beyond 3.5 tons for 20-cubic yard drop box, and beyond 5 tons for 30-cubic yard drop box.
4 There is a $65.60 additional per ton charge, beyond 3.5 tons for 20-cubic yard drop box, and beyond 5 tons for 30-cubic yard drop box.
5 There is a $70.00 additional per ton charge, beyond 2 tons for 20-cubic and 30-cubic yard drop boxes.
6 There is a current WERS tonnage rate charge, beyond 5 tons for 20-cubic yard drop box, and beyond 7 tons for 30-cubic yard drop boxes.
7 The rates are for Tahoe Basin Containers, a non-County franchise company owned by STR.
8 The rates include a fuel surcharge.
2-9

2. Solid Waste Rate and Service Levels
Table 2-6 Transfer Stations and Tipping Fees used by El Dorado County
(As of January 2008)
Solid Waste Rate and Service Study El Dorado County
MRF/Transfer Station Tipping Fee Per Ton Location
South Tahoe Refuse Transfer Station* $78.40 South Lake Tahoe, California
Western Amador Recovery Facility 68.00 Ione, California
Western EL Dorado Recovery Systems MRF 70.88 Diamond Springs, California
Eastern Regional Transfer Station 75.50 Placer County, California
Mean $73.20
Number of Rates 4
Median $73.19
Minimum $68.00
Maximum $78.40
* Equivalent rate. The rate is for 8 yards.
These transfer facilities and landfills used by County franchise companies receive solid waste from the unincorporated areas and incorporated cities via the County’s franchised haulers. Solid waste is generated from a mix of residential, commercial, and industrial sources in the County.
Refuse collection services are non-mandatory for the unincorporated County areas, except for the South Tahoe Refuse County franchise area. County customers are not obligated to pay for refuse collection services. Many customers prefer to self-haul their refuse to a transfer station. Up to twenty (20) percent of total County refuse volume is self-hauled. However, refuse collection services are mandatory for Cameron Park CSD, El Dorado Hills CSD, and the City of South Lake Tahoe.
The County has recently been asked to consider some small scale waste management facilities in rural portions of the County. Sierra Disposal Service proposed to build a small volume transfer station and recycling facility within the Georgetown/Divide area to combat illegal dumping and provide opportunities for
disposal and recycling. The facilities would accept materials for disposal, as well as recycling.
The Materials Recovery Facilities (MRFs) are one of the County’s key elements in meeting the State’s fifty (50) percent, Assembly Bill (AB) 939 waste reduction goal. All waste is sorted at these facilities to recover recyclable materials. Recovered materials are cleaned and sold to market.
In Table 2-6, above, we provide a summary of the transfer stations/MRFs used by the County’s franchisees, as well as tipping fee information. Refuse is transferred to the Western El Dorado Recovery Systems MRF, which is owned and operated by El Dorado Disposal Services; the South Tahoe Refuse Transfer Station, which is owned and operated by South Tahoe Refuse Company; the Eastern Regional Transfer Station/MRF which is operated by Tahoe Truckee Sierra Disposal on Placer County owned land, as well as the Western Amador Recovery Facility, which is operated by Amador Disposal Service; for the purposes of recovering and recycling materials. The per ton tipping fee rates
2-10 Solid Waste Rate and Service Study

Table 2-7 Transfer Stations and Landfills for El Dorado County
(As of January 2008)
Solid Waste Rate and Service Study El Dorado County
No. Company Materials Recovery
Facility/Transfer Station(s) Landfill(s)
A Waste Connections of California
1.0 Amador Disposal Service
Western Amador Recovery Facility, Ione, CA
Western El Dorado Recovery Systems, Diamond Springs, CA
Keifer Landfill, Sacramento, California
Forward Landfill, Manteca, California
2.0 El Dorado Disposal Services Western El Dorado Recovery Systems, Diamond Springs, CA
Kiefer Landfill, Sacramento, California
Forward Landfill, Manteca, California
B South Tahoe Refuse Company
3.0 American River Disposal Service South Tahoe Refuse Transfer Station, South Lake Tahoe, CA Lockwood Landfill, Sparks, Nevada
4.0 Sierra Disposal Service Western El Dorado Recovery Systems, Diamond Springs, CA
Kiefer Landfill, Sacramento, California
Forward Landfill, Manteca, California
5.0 South Tahoe Refuse Company South Tahoe Refuse Transfer Station, South Lake Tahoe, CA Lockwood Landfill, Sparks, Nevada
C Tahoe-Truckee Sierra Disposal Company
6.0 Tahoe-Truckee Sierra Disposal Eastern Regional Transfer Station/MRF, Placer County, California Lockwood Landfill, Sparks, Nevada
charged to County customers range from $68.00 per ton to $78.40 per ton for compacted mixed solid waste. The current mean County tipping fee is $73.20 per ton.
In the County, franchise companies use different approaches to manage materials once collected. All companies transfer materials collected to a MRF/transfer station first. The County ultimately exports all solid waste out of the County for landfill disposal. In Table 2-7, above, we provide a summary of the waste management approaches, and processes, employed by each County franchise company.
All franchised companies use MRF/transfer stations to sort materials, and then transfer refuse to landfills for disposal. Western El Dorado
Recovery Systems consolidates and transfers refuse to Kiefer Landfill located at Sacramento, California; and Forward Landfill, located at Manteca, California. The Western Amador Recovery Facility consolidates and transfers refuse to Forward Landfill, located at Manteca, California. The South Tahoe Refuse Transfer Station/MRF and the Eastern Regional Transfer Station/MRF consolidate and transfer refuse to Lockwood Landfill, located at Sparks, Nevada.
American River Disposal Service and South Tahoe Refuse Company do not require customers to sort recyclables and yard waste, and instead sorts all of the materials at its Materials Recovery Facility (MRF), or “dirty MRF” in the City of South Lake Tahoe. The South Tahoe
2-11

2. Solid Waste Rate and Service Levels
Refuse Company has approached the County to discuss a franchise extension associated with undertaking new capital investments at the South Lake Tahoe MRF.
Waste Connections collects and processes recyclable and yard waste materials at its Western El Dorado Recovery Systems (WERS), a “dirty” Materials Recovery Facility (MRF), located at Diamond Springs. The WERS facility was not originally designed to handle its current material throughput requirements and without additional investment in the WERS facility, Waste Connections faces some potential future operational limitations with handling projected West County growth (e.g., tight self-haul drop off/turnaround areas, larger weekend traffic volumes on City streets, limited material storage areas, and small overall site footprint). Waste Connections also has recently requested from the County a fifteen-year franchise extension to recover the investment required to relocate its facilities.
E. Summary of Solid Waste Rate and Service Levels
1. Residential Solid Waste Rates
County residential solid waste collection rate structures vary depending on whether services are for a can system or a cart system. For the can system, in most service areas, the County has more linear rate structures, with relatively equal rate differences between the 1, 32-gallon can service level, and the 1, 45-gallon can service level, and between the 1, 45-gallon can service level and the 2, 32-gallon cans service level.
Within the companies offering can service, the relatively linear relationships (as measured by the increase in the rate, and gallons of service, with each can service level increase in the rate structure) are as follows:
In the area served by Amador Disposal Service, for a 20 percent rate increase,
customers receive 13 gallons more for their refuse service; and for a 23 percent rate increase, customers receive 19 gallons more for their refuse service
In the City of Placerville, served by El Dorado Disposal Services, for an 18 percent rate increase, customers receive 13 gallons more for their refuse service; and for a 33 percent rate increase, customers receive 19 gallons more for their refuse service
In the County Unincorporated area, served by El Dorado Disposal Services, for a 14 percent rate increase, customers receive 13 gallons more for their refuse service; and for a 33 percent rate increase, customers receive 19 gallons more for their refuse service
In the service area served by American River Disposal Service, for a 16 percent rate increase, customers receive 13 gallons more for their refuse service; and for a 16 percent rate increase, customers receive 19 gallons more for their refuse service
In the service area served by Sierra Disposal Service, for a 21 percent rate increase, customers receive 13 gallons more for their refuse service; and for an 18 percent rate increase, customers receive 19 gallons more for their refuse service
In the service area served by Tahoe-Truckee Sierra Disposal Company, for a 34 percent rate increase, customers receive 32 gallons more for their refuse service.
Although, not all these relationships are perfect linear ratios based on the increase in gallons, the County has relatively linear rate structures for its can service system, except that South Tahoe Refuse Company has a fixed rate for unlimited can service.
For the cart service system, the County has mixed rate structures for the 64-, and 96-gallon cart service levels offered by its franchise companies. (Only El Dorado Hills has the 35-gallon cart service level available.)
2-12 Solid Waste Rate and Service Study
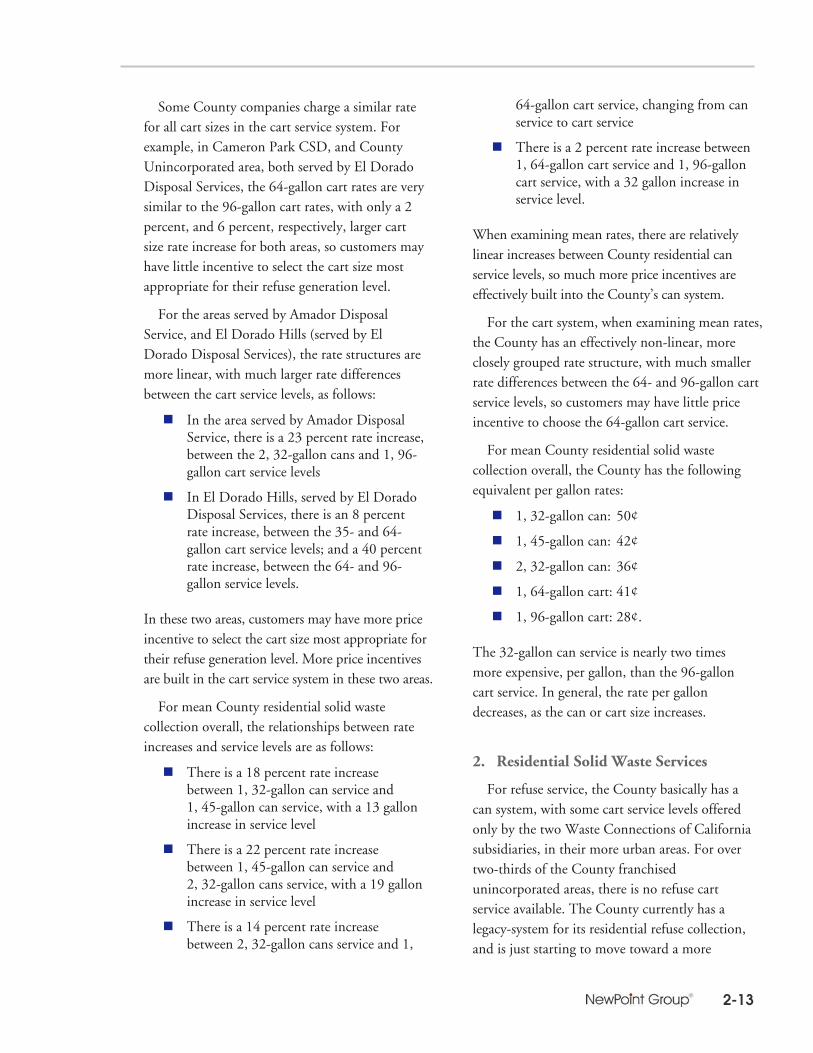
Some County companies charge a similar rate for all cart sizes in the cart service system. For example, in Cameron Park CSD, and County Unincorporated area, both served by El Dorado Disposal Services, the 64-gallon cart rates are very similar to the 96-gallon cart rates, with only a 2 percent, and 6 percent, respectively, larger cart size rate increase for both areas, so customers may have little incentive to select the cart size most appropriate for their refuse generation level.
For the areas served by Amador Disposal Service, and El Dorado Hills (served by El Dorado Disposal Services), the rate structures are more linear, with much larger rate differences between the cart service levels, as follows:
In the area served by Amador Disposal Service, there is a 23 percent rate increase, between the 2, 32-gallon cans and 1, 96- gallon cart service levels
In El Dorado Hills, served by El Dorado Disposal Services, there is an 8 percent rate increase, between the 35- and 64- gallon cart service levels; and a 40 percent rate increase, between the 64- and 96-gallon service levels.
In these two areas, customers may have more price incentive to select the cart size most appropriate for their refuse generation level. More price incentives are built in the cart service system in these two areas.
For mean County residential solid waste collection overall, the relationships between rate increases and service levels are as follows:
There is a 18 percent rate increase between 1, 32-gallon can service and 1, 45-gallon can service, with a 13 gallon increase in service level
There is a 22 percent rate increase between 1, 45-gallon can service and 2, 32-gallon cans service, with a 19 gallon increase in service level
There is a 14 percent rate increase between 2, 32-gallon cans service and 1,
64-gallon cart service, changing from can service to cart service
There is a 2 percent rate increase between 1, 64-gallon cart service and 1, 96-gallon cart service, with a 32 gallon increase in service level.
When examining mean rates, there are relatively linear increases between County residential can service levels, so much more price incentives are effectively built into the County’s can system.
For the cart system, when examining mean rates, the County has an effectively non-linear, more closely grouped rate structure, with much smaller rate differences between the 64- and 96-gallon cart service levels, so customers may have little price incentive to choose the 64-gallon cart service.
For mean County residential solid waste collection overall, the County has the following equivalent per gallon rates:
1, 32-gallon can: 50¢
1, 45-gallon can: 42¢
2, 32-gallon can: 36¢
1, 64-gallon cart: 41¢
1, 96-gallon cart: 28¢.
The 32-gallon can service is nearly two times more expensive, per gallon, than the 96-gallon cart service. In general, the rate per gallon decreases, as the can or cart size increases.
2. Residential Solid Waste Services
For refuse service, the County basically has a can system, with some cart service levels offered only by the two Waste Connections of California subsidiaries, in their more urban areas. For over two-thirds of the County franchised unincorporated areas, there is no refuse cart service available. The County currently has a legacy-system for its residential refuse collection, and is just starting to move toward a more
2-13

2. Solid Waste Rate and Service Levels
modern cart-based refuse collection system where it makes sense in the more urban areas.
For curbside recycling services, the County has some areas with a bag system, and some biweekly cart service offered only by El Dorado Disposal Services. Again, the County is just starting to move toward a more modern curbside cart-based recycling collection system where it makes sense in the more urban areas.
The County doesn’t have yard waste service, except for the areas served by El Dorado Disposal Services. In addition, the County employs a yard waste burn option. With the burn option available, many County customers may not need curbside yard waste service, however, for a more effective and efficient solid waste collection system, the County may need to move toward a curbside cart-based yard waste collection system for some of its outlying West Slope areas.
3. West Slope versus East Slope Residential Solid Waste Services and Rates
For County residential solid waste collection, the rate structures and service levels are different between the West Slope and Ease Slope service areas. In the West Slope service areas, there are can systems, and some cart systems, for residential refuse collection services; bag and some cart systems for residential curbside recycling collection services; and some cart service for residential curbside yard waste collection services. The rate structures are not uniform in the West Slope service areas, with both linear and more tightly grouped rate structures depending on if the services are for a can or cart system.
In the East Slope service areas, there is only a can system for residential refuse collection
services, with some bag recycling, and without any residential curbside yard waste collection service. The rate structures are relatively uniform in the East Slope service areas, with linear rate structures for the can service systems.
4. Commercial and Industrial Solid Waste Services
County commercial solid waste service rates have linear rate structures within each franchise company, across the service levels. However, across its franchise companies, there is no pattern for County commercial solid waste rates.
The County has very large commercial rate differences across the franchise companies for the same service level. For example, for the 1 cubic yard, 1 time per week service level, the rates vary from the lowest of $14.16, to the highest of $76.82. County commercial rate data are very heterogeneous, without normal distributions. Differences between the highest and lowest rates are even larger than the mean rates for each service level category. The County currently doesn’t have any uniform system for its commercial rates.
County industrial solid waste rates are much more uniform than commercial rates. Also, they are fairly linear in nature.
There is not a single landfill within the County to receive County solid waste generated from residential, commercial, and industrial services. The County currently exports all of its solid waste out of the County for landfill disposal, to three (3) counties (one in Nevada, and two in California), including Washoe (Nevada), Sacramento, and San Joaquin.
2-14 Solid Waste Rate and Service Study

Section 3 Solid Waste Rate and Service Levels
and Comparisons between the County and Selected Jurisdictions

3. Solid Waste Rate and Service Levels and Comparisons between the County and Selected Jurisdictions
This section includes analyses of El Dorado County solid waste collection systems in comparison to other surveyed jurisdictions. We worked with County staff to agree on the format and content of these comparative surveys. We identified a set of fourteen (14) jurisdictions to compare with El Dorado County.
Appendix A provides the fourteen comparative jurisdiction supporting data for the comparisons made in this section. Appendix A also identifies the characteristics of these comparative jurisdictions.
Based on our survey results, we provide summary statistics for the fourteen surveyed jurisdictions, for residential, commercial, and industrial sectors. For each sector, we calculate statistics, such as the average, median, minimum and maximum, and number of rates, for each service level category.
For our comparative analyses, we developed a set of matrices that show rate differences between the County and the comparative jurisdictions. We compared rates and service levels for each sector. For each sector, we compared various statistics, ueach service level category, by absolute difference, and by percent difference. Our analyses included comparisons between the County and the comparative jurisdcomparisons between each County area and the comparative jurisdictions, acomparisons between each County area and the County average.
nder
ictions, nd
The remainder of this section is organized as follows:
A. Residential Solid Waste Collection Comparisons 1. Comparative Jurisdictions 2. Comparisons between County and Surveyed Jurisdictions 3. Similar Rate Structure Jurisdiction Comparisons 4. Comparisons between Each County Area and Surveyed Jurisdictions 5. Comparisons within County
B. Commercial Solid Waste Collection Comparisons 1. Comparative Jurisdictions 2. Comparisons between County and Surveyed Jurisdictions 3. Comparisons between Each County Area and Surveyed Jurisdictions 4. Comparisons within County

3. Solid Waste Rate and Service Levels and Comparisons between the County and Selected Jurisdictions
C. Industrial Solid Waste Collection Comparisons 1. Comparative Jurisdictions 2. Comparisons between County and
Surveyed Jurisdictions 3. Comparisons between Each County Area
and Surveyed Jurisdictions 4. Comparisons within County
D. Tipping Fee Comparisons
E. Summary of Solid Waste Collection Comparisons 1. Residential Solid Waste Rate Comparisons 2. Residential Solid Waste Service
Level Comparisons 3. Commercial Solid Waste Comparisons 4. Industrial Solid Waste Comparisons 5. Residential Solid Waste Rates of
Neighboring Sacramento County.
A. Residential Solid Waste Collection Comparisons
1. Comparative Jurisdictions
For residential services, we surveyed fourteen (14) comparative jurisdictions, for their 20-, 32-, 64-, 96-gallon can and cart service levels, as shown in Exhibit A-2, Appendix A. Since many jurisdictions had various service areas, based on our survey results, we calculated a mean residential rate for each of the fourteen jurisdictions surveyed, for each rate category, including 1, 32-gallon can, 1, 32-gallon cart, 2, 32-gallon cans, 1, 64-gallon cart, 3, 32-gallon cans, and 1, 96-gallon cart service levels, and summarized these means, in Table 3-1, on the next page. We didn’t include the 20-gallon can/cart service level, because only a few jurisdictions provided this service level, and El Dorado County did not provide this service level.
Based on the fourteen jurisdiction means, for each of the six service levels, we calculated various statistics, such as the mean of all jurisdictions surveyed, median of jurisdiction means, minimum and maximum of jurisdiction means, as well as
mean without the highest and lowest rates, which eliminates those outliers that drive the overall mean.
Comparative jurisdiction mean residential solid waste collection rates, per customer, per month, were as follows:
1, 32-gallon can: $17.59
1, 32-gallon cart: $19.67
2, 32-gallon cans: $23.99
1, 64-gallon cart: $26.55
3, 32-gallon cans: $31.39
1, 96-gallon cart: $33.06.
Comparative jurisdiction mean residential solid waste collection rates, without the highest and lowest rates, per customer, per month, were as follows:
1, 32-gallon can: $17.38
1, 32-gallon cart: $19.83
2, 32-gallon cans: $23.67
1, 64-gallon cart: $26.69
3, 32-gallon cans: $30.61
1, 96-gallon cart: $32.60.
These two sets of comparative mean residential rates were almost identical to each other for each service level. Therefore the highest and lowest rates shouldn’t be concerns for our analyses.
Our data show that the median residential rates were close to the mean residential rates. This implies that our survey data have fairly normal distributions.
Jurisdictions employ different rate setting methodologies, and have different rate structures. Also, different franchised haulers have different operating and capital costs. Some counties have more linear rate structures, in which rates vary relatively widely. For example, in our residential rate survey, Monterey County, Sutter County, and Yuba County had more linear rate structures, with large incremental differences between service levels. Some
3-2 Solid Waste Rate and Service Study

Table 3-1 Residential Solid Waste Collection Rates for Comparative Jurisdictions
Per customer, per month (As of January 2008)
Solid Waste Rate and Service Study El Dorado County
Service Level No. Jurisdiction 1, 32-Gallon
Can 1, 32-Gallon
Cart 2, 32-Gallon
Cans 1, 64-Gallon
Cart 3, 32-Gallon
Cans 1, 96-Gallon
Cart
1 Amador County $18.53 $19.08 $24.84 $24.08 $31.15 $26.88
2 Butte County N/A 17.65 N/A 22.80 N/A 25.15
3 Calaveras County 13.49 N/A 18.19 21.17 22.85 21.97
4 Merced County 11.26 N/A 11.26 25.68 16.08 31.38
5 Monterey County 25.45 23.83 38.95 36.11 52.31 49.24
6 Nevada County 18.99 N/A 25.88 30.35 32.75 36.73
7 Placer County N/A 16.37 N/A 23.98 N/A 28.62
8 San Luis Obispo County 20.54 20.60 27.55 31.81 33.89 43.01
9 Shasta County N/A N/A N/A 19.70 N/A 22.79
10 Stanislaus County 14.15 14.53 21.46 15.51 31.44 21.46
11 Sutter County N/A 22.55 N/A 33.56 N/A 44.57
12 Tuolumne County 21.82 N/A 32.75 N/A 46.11 N/A
13 Yuba County N/A 22.72 N/A 33.82 N/A 44.92
14 Town of Truckee 14.11 N/A 15.00 N/A 15.89 N/A
Mean $17.59 $19.67 $23.99 $26.55 $31.39 $33.06
Number of Rates 9 8 9 12 9 12
Mean of Jurisdictions with Rate Structure Similar to Countya $16.61 $17.64 $22.12 $23.90 $28.77 $28.66
Number of Rates 8 5 8 9 8 9
Median $18.53 $19.84 $24.84 $24.88 $31.44 $30.00
Minimum $11.26 $14.53 $11.26 $15.51 $15.89 $21.46
Maximum $25.45 $23.83 $38.95 $36.11 $52.31 $49.24
Mean without Highest and Lowest Rates
$17.38 $19.83 $23.67 $26.69 $30.61 $32.60
Number of Rates 7 6 7 10 7 10
Mean of Unincorporated El Dorado County Franchise Areas
$16.08 – $23.07 $26.26 – $26.81
a This mean was calculated based on the 11 jurisdictions in Table 3-1 excluding Monterey County, Sutter County, and Yuba County.
counties have more tightened rate structures, in which rates vary relatively little. For example, in our residential rate survey, Amador County has this kind of rate structure, with tightened residential rates, such as $19.08 for 1, 32-gallon cart; $24.08 for 1, 64-gallon cart; and $26.88 for 1, 96-gallon
cart. El Dorado County also is a county with tightened rate structures.
Comparisons made among similar rate structure jurisdictions might produce more meaningful findings. Therefore, we excluded three (3) counties
3-3

3. Solid Waste Rate and Service Levels and Comparisons between the County and Selected Jurisdictions
with linear rate structures, including Monterey County, Sutter County, and Yuba County, from the fourteen surveyed jurisdictions, and developed another set of comparative jurisdictions mean residential solid waste collection rates of eleven (11) jurisdictions with similar rate structure to El Dorado County, which had a tightened rate structure. Mean residential solid waste collection rates of these eleven jurisdictions, with rate structures similar to El Dorado County, per customer, per month, were as follows:
1, 32-gallon can: $16.61
1, 32-gallon cart: $17.64
2, 32-gallon cans: $22.12
1, 64-gallon cart: $23.90
3, 32-gallon cans: $28.77
1, 96-gallon cart: $28.66.
2. Comparisons between County and Surveyed Jurisdictions
We compared residential solid waste collection rates between El Dorado County and the fourteen surveyed jurisdictions, for four (4) service levels, including:
1, 32-gallon can
2, 32-gallon cans
1, 64-gallon cart
1, 96-gallon cart.
We did not compare the County’s 45-gallon can rates against the other jurisdictions, because there was not sufficient data available. For the subset comparisons, we compared County mean versus comparative jurisdiction means; County mean versus comparative jurisdiction means without outliers; and County median versus comparative jurisdiction medians, respectively. These comparisons are included in Table 3-2, Table 3-3, and Table 3-4, on the next page.
In Table 3-2, we compared the County mean with the comparative jurisdiction means, for each of the four service levels, for residential services. County residential average rates were slightly below comparative jurisdiction average rates for the 2, 32-gallon cans, and 1, 64-gallon cart service levels, and well below comparative jurisdiction average rates for the 1, 32-gallon can, and 1, 96-gallon cart service levels, as follows:
For the 1, 32-gallon can service level, the County average rate was below the average of comparative jurisdiction rates, by 8.58 percent, or $1.51
For the 2, 32-gallon cans service level, the County average rate was slightly below the average of comparative jurisdiction rates, by 3.83 percent, or $0.92
For the 1, 64-gallon cart service level, the County average rate was slightly below the average of comparative jurisdiction rates, by 1.09 percent, or $0.29
For the 1, 96-gallon cart service level, the County average rate was dramatically below the average of comparative jurisdiction rates, by 18.91 percent, or $6.25.
Outliers, such as the highest and lowest rates, might drive different results. Therefore, we excluded the highest and lowest comparative jurisdiction rates, and compared the County mean rates against the mean of the rest of the comparative jurisdictions, for each of the four residential service levels. Table 3-3 shows similar results as before, which further confirms our previous comparisons. County residential average rates were still slightly below comparative jurisdiction average rates for the 2, 32-gallon cans, and 1, 64-gallon cart service levels, and well below jurisdiction average rates for the 1, 32-gallon can and 1, 96-gallon cart service levels.
In Table 3-4, we compared the County median with the comparative jurisdiction medians, for each of the four service levels, for residential services. County residential median rates were slightly above
3-4 Solid Waste Rate and Service Study

Table 3-2 Comparison between County and Comparative Jurisdictions, for County Mean versus Comparative Jurisdiction Means, for Residential Solid Waste Collection Rates
Per customer, per month (As of January 2008)
Solid Waste Rate and Service Study El Dorado County
Service Level 1, 32-Gallon Can 2, 32-Gallon Cans 1, 64-Gallon Cart 1, 96-Gallon Cart Description
County Jurisdictions County Jurisdictions County Jurisdictions County Jurisdictions
Mean $16.08 $17.59 $23.07 $23.99 $26.26 $26.55 $26.81 $33.06
Absolute Difference -$1.51 -$0.92 -$0.29 -$6.25
Percent Difference -8.58% -3.83% -1.09% -18.91%
Number of Rates 5 9 6 9 1 12 2 12
Table 3-3 Comparison between County and Comparative Jurisdictions, for County Mean versus Comparative Jurisdiction Means (Without Highest and Lowest Rates), for Residential Solid Waste Collection Rates
Per customer, per month (As of January 2008)
Solid Waste Rate and Service Study El Dorado County
Service Level 1, 32-Gallon Can 2, 32-Gallon Cans 1, 64-Gallon Cart 1, 96-Gallon Cart Description
County Jurisdictions County Jurisdictions County Jurisdictions County Jurisdictions
Mean $16.08 $17.38 $23.07 $23.67 $26.26 $26.69 $26.81 $32.60
Absolute Difference -$1.30 -$0.60 -$0.43 -$5.79
Percent Difference -7.48% -2.53% -1.61% -17.76%
Number of Rates 5 7 6 7 1 10 2 10
Table 3-4 Comparison between County and Comparative Jurisdictions, for County Median versus Comparative Jurisdiction Medians, for Residential Solid Waste Collection Rates
Per customer, per month (As of January 2008)
Solid Waste Rate and Service Study El Dorado County
Service Level
1, 32-Gallon Can 2, 32-Gallon Cans 1, 64-Gallon Cart 1, 96-Gallon Cart Description
County Jurisdictions County Jurisdictions County Jurisdictions County Jurisdictions
Median $16.21 $18.53 $22.78 $24.84 $26.26 $24.88 $26.81 $30.00
Absolute Difference -$2.32 -$2.06 $1.38 -$3.19
Percent Difference -12.52% -8.29% 5.55% -10.63%
Number of Rates 5 9 6 9 1 12 2 12
3-5

3. Solid Waste Rate and Service Levels and Comparisons between the County and Selected Jurisdictions
Table 3-5 Comparison between County and Comparative Jurisdictions, for County Mean versus Comparative Jurisdiction Means, for Similar Rate Structure Jurisdictions Residential Solid Waste Collection Rates
Per customer, per month (As of January 2008)
Solid Waste Rate and Service Study El Dorado County
Service Level 1, 32-Gallon Can 2, 32-Gallon Cans 1, 64-Gallon Cart 1, 96-Gallon Cart Description
County Jurisdictions County Jurisdictions County Jurisdictions County Jurisdictions
Mean $16.08 $16.61 $23.07 $22.12 $26.26 $23.90 $26.81 $28.66
Absolute Difference -$0.53 $0.95 $2.36 -$1.85
Percent Difference -3.19% 4.29% 9.87% -6.45%
Number of Rates 5 8 6 8 1 9 2 9
the jurisdiction median rate for the 1, 64-gallon cart service level, and well below jurisdiction median rates for the 1, 32-gallon can, 2, 32-gallon cans and 1, 96-gallon cart service levels.
Generally, County residential rates were below average compared to comparative jurisdictions, particularly for higher service level, such as 1, 96-gallon cart. This is likely because many of these other jurisdictions have specifically designed significantly higher rates for the larger cart sizes to discourage customers from using these service levels.
3. Similar Rate Structure Jurisdiction Comparisons
Perhaps a better rate comparison is provided in Table 3-5, above, where we compared County residential rates with the eleven jurisdictions that have rate structures more like the rate structures the County has.
For this subset comparison, we compared the County mean with the similar rate structure jurisdiction means, for each of the four service levels. We found County residential rates were above averages of comparative jurisdictions with
similar rate structures, for the 2, 32-gallon cans, and 1, 64-gallon cart service levels; however, for the 1, 32-gallon can, and 1, 96-gallon cart service levels, County rates were still below these jurisdictions, as follows:
For the 1, 32-gallon can service level, the County average rate was slightly below the average of similar rate structure comparative jurisdiction rates, by 3.19 percent, or $0.53
For the 2, 32-gallon cans service level, the County average rate was slightly above the average of similar rate structure comparative jurisdiction rates, by 4.29 percent, or $0.95
For the 1, 64-gallon cart service level, the County average rate was well above the average of similar rate structure comparative jurisdiction rates, by 9.87 percent, or $2.36
For the 1, 96-gallon cart service level, the County average rate was well below the average of similar rate structure comparative jurisdiction rates, by 6.45 percent, or $1.85.
3-6 Solid Waste Rate and Service Study

Even after we compared rate differences between the County and those comparative jurisdictions with more tightly grouped rate structures, we still found County residential rates, for the 96-gallon cart service level, were below average of comparative jurisdictions, and County rates for the other service levels were very comparable.
4. Comparisons between Each County Area and Surveyed Jurisdictions
In addition to our county versus county level comparisons, we compared each County area residential solid waste collection rate with the comparative jurisdiction rates. For the subset comparisons, we compared each County area rate with the comparative jurisdiction means, for all four service levels, as in the previous comparisons. These comparisons are shown in Table 3-6, on the next page.
In Table 3-6, we compared County residential rates with the comparative jurisdiction means, for each County area. Among the nine franchise areas, there were five companies/areas with residential rates below the comparative jurisdiction average rates across the four service levels, including:
Amador Disposal Service
El Dorado Disposal Services, Cameron Park Area
American River Disposal Service
South Tahoe Refuse Company
Tahoe-Truckee Sierra Disposal.
In the four areas served by El Dorado Disposal Services, residential rates generally were above the comparative jurisdiction average rates, for the can service levels, and below the comparative jurisdiction average rates, for the cart service levels, in general.
For the 64-gallon cart, and 96-gallon cart service level, all County company/area residential rates were below the comparative jurisdiction
average rates. This corresponds to what we found in the previous county level comparisons that the County average cart residential rates were below the comparative jurisdiction rates.
5. Comparisons within County
Previous comparisons show relationships between County rates and the other jurisdictions rates. In this subset of comparisons, we compared each County area rate with the County average rate, for four service levels, in Table 3-7, on page 3-9.
Table 3-7 shows whether the franchise area rate was below or above the County average. Among the nine franchise areas, there were three areas with residential rates below the County average rates, across the offered service levels, including:
Amador Disposal Service
El Dorado Disposal Services, Cameron Park Area
American River Disposal Service.
There were three areas with residential rates above the County average rates, across the offered service levels, including:
El Dorado Disposal Services, Unincorporated County Areas
Sierra Disposal Service
South Tahoe Refuse Company.
B. Commercial Solid Waste Collection Comparisons
1. Comparative Jurisdictions
For commercial services, we surveyed fourteen (14) comparative jurisdictions, for 2-yd (1 time per week), 2-yd (2 times per week), 3-yd (1 time per week), 3-yd (2 times per week), 4-yd (1 time per week), and 6-yd (1 time per week) service levels, as shown in Exhibit A-4, Appendix A. Since many jurisdictions had various service areas, based on our
3-7

3. Solid Waste Rate and Service Levels and Comparisons between the County and Selected Jurisdictions
Table 3-6 Comparison between County and Comparative Jurisdictions By Each Franchise Area for County Area Rates versus Comparative Jurisdiction Means for Residential Solid Waste Collection Rates
Per customer, per month (As of January 2008)
Solid Waste Rate and Service Study El Dorado County
Service Level No. Company/Area
1, 32-Gallon Can 2, 32-Gallon Cans 1, 64-Gallon Cart 1, 96-Gallon Cart
1.0 Amador Disposal Service $14.13 $20.90 N/A $25.69
Absolute Difference -$3.46 -$3.09 N/A -$7.37
Percent Difference -19.69% -12.87% N/A -22.29%
2.0 El Dorado Disposal Services
2.1 – Cameron Park N/A N/A $22.44 $22.79
Absolute Difference N/A N/A -$4.11 -$10.27
Percent Difference N/A N/A -15.47% -31.06%
2.2 – City of Placerville $15.50 $24.46 N/A N/A
Absolute Difference -$2.09 $0.47 N/A N/A
Percent Difference -11.90% 1.97% N/A N/A
2.3 – El Dorado Hills $20.99 N/A $22.61 $31.68
Absolute Difference $3.40 N/A -$3.94 -$1.38
Percent Difference 19.31% N/A -14.83% -4.17%
2.4 – Unincorporated County Area $18.20 $27.55 $26.26 $27.93
Absolute Difference $0.61 $3.56 -$0.29 -$5.13
Percent Difference 3.45% 14.86% -1.08% -15.52%
3.0 American River Disposal Service $13.46 $18.09 N/A N/A
Absolute Difference -$4.13 -$5.90 N/A N/A
Percent Difference -23.49% -24.58% N/A N/A
4.0 Sierra Disposal Service $18.42 $26.31 N/A N/A
Absolute Difference $0.83 $2.32 N/A N/A
Percent Difference 4.70% 9.69% N/A N/A
5.0 South Tahoe Refuse Company N/A $23.79 N/A N/A
Absolute Difference N/A -$0.20 N/A N/A
Percent Difference N/A -0.82% N/A N/A
6.0 Tahoe-Truckee Sierra Disposal $16.21 $21.76 N/A N/A
Absolute Difference -$1.38 -$2.23 N/A N/A
Percent Difference -7.86% -9.28% N/A N/A
Comparative Jurisdiction Mean $17.59 $23.99 $26.55 $33.06
3-8 Solid Waste Rate and Service Study

Table 3-7 Comparison within County, By Each Franchise Area, for County Area Rates versus County Means, for Residential Solid Waste Collection Rates
Per customer, per month (As of January 2008)
Solid Waste Rate and Service Study El Dorado County
Service Level No. Company/Area
1, 32-Gallon Can 2, 32-Gallon Cans 1, 64-Gallon Cart 1, 96-Gallon Cart
1.0 Amador Disposal Service $14.13 $20.90 N/A $25.69
Absolute Difference -$1.95 -$2.17 N/A -$1.12
Percent Difference -12.15% -9.39% N/A -4.18%
2.0 El Dorado Disposal Services
2.1 – Cameron Park N/A N/A $22.44 $22.79
Absolute Difference N/A N/A -$3.82 -$4.02
Percent Difference N/A N/A -14.55% -14.99%
2.2 – City of Placerville $15.50 $24.46 N/A N/A
Absolute Difference -$0.58 $1.39 N/A N/A
Percent Difference -3.63% 6.04% N/A N/A
2.3 – El Dorado Hills $20.99 N/A $22.61 $31.68
Absolute Difference $4.91 N/A -$3.65 $4.87
Percent Difference 30.50% N/A -13.90% 18.16%
2.4 – Other Unincorporated Areas $18.20 $27.55 $26.26 $27.93
Absolute Difference $2.12 $4.48 $0.00 $1.12
Percent Difference 13.16% 19.44% 0.00% 4.18%
3.0 American River Disposal Service $13.46 $18.09 N/A N/A
Absolute Difference -$2.62 -$4.98 N/A N/A
Percent Difference -16.31% -21.58% N/A N/A
4.0 Sierra Disposal Service $18.42 $26.31 N/A N/A
Absolute Difference $2.34 $3.24 N/A N/A
Percent Difference 14.52% 14.06% N/A N/A
5.0 South Tahoe Refuse Company N/A $23.79 N/A N/A
Absolute Difference N/A $0.72 N/A N/A
Percent Difference N/A 3.14% N/A N/A
6.0 Tahoe-Truckee Sierra Disposal $16.21 $21.76 N/A N/A
Absolute Difference $0.13 -$1.31 N/A N/A
Percent Difference 0.78% -5.66% N/A N/A
El Dorado County Mean $16.08 $23.07 $26.26 $26.81
3-9

3. Solid Waste Rate and Service Levels and Comparisons between the County and Selected Jurisdictions
Table 3-8 Commercial Solid Waste Collection Rates for Comparative Jurisdictions
Per customer, per month (As of January 2008)
Solid Waste Rate and Service Study El Dorado County
Service Level No. Jurisdiction 2-yd
1 per week 2-yd
2 per week 3-yd
1 per week 3-yd
2 per week 4-yd
1 per week 6-yd
1 per week
1 Amador County $126.06 $225.17 $187.77 $331.06 $248.63 $359.42
2 Butte County 70.00 117.95 82.11 158.55 99.64 136.08
3 Calaveras County 75.03 138.49 69.15 123.91 86.32 N/A
4 Merced County 64.16 109.81 85.14 152.82 109.81 159.17
5 Monterey County 150.26 307.80 210.23 415.57 289.16 415.71
6 Nevada County 226.32 387.28 290.87 496.37 371.92 462.33
7 Placer County 168.27 295.05 236.64 425.61 301.54 428.88
8 San Luis Obispo County 107.37 181.45 133.90 235.61 181.50 233.16
9 Shasta County 157.05 275.30 200.03 328.88 262.26 322.36
10 Stanislaus County 72.47 144.92 79.97 159.91 93.12 116.09
11 Sutter County 167.33 266.96 202.51 336.11 N/A 259.71
12 Tuolumne County 180.45 343.68 260.73 503.64 N/A N/A
13 Yuba County 168.62 269.02 204.08 338.71 245.41 261.72
14 Town of Truckee N/A N/A 196.74 371.73 252.61 365.42
Mean $133.34 $235.61 $174.28 $312.75 $211.83 $293.34
Number of Rates 13 13 14 14 12 12
Median $150.26 $266.96 $198.39 $333.58 $247.02 $292.04
Minimum $64.16 $109.81 $69.15 $123.91 $86.32 $116.09
Maximum $226.32 $387.28 $290.87 $503.64 $371.92 $462.33
Mean without Highest and Lowest Rates
$131.17 $233.25 $173.32 $312.58 $208.37 $294.16
Number of Rates 11 11 12 12 10 10
Mean of Unincorporated El Dorado County Franchise Areas
$73.46 $185.72 $116.35 $228.36 $152.49 $215.50
survey results, we calculated a mean commercial rate for each jurisdiction surveyed, under each of the rate categories. We summarized these means in Table 3-8, above.
Based on the fourteen jurisdiction means, for each of the six service levels, we calculated various statistics, such as the mean of all jurisdictions surveyed, median of jurisdiction means, minimum
and maximum of jurisdiction means, as well as means without the highest and lowest rates, which eliminates those outliers that drive the overall mean.
Comparative jurisdiction mean commercial solid waste collection rates, per customer, per month, were as follows:
2-cubic yard, 1 time per week: $133.34
2-cubic yard, 2 times per week: $235.61
3-10 Solid Waste Rate and Service Study

3-cubic yard, 1 time per week: $174.28
3-cubic yard, 2 times per week: $312.75
4-cubic yard, 1 time per week: $211.83
6-cubic yard, 1 time per week: $293.34.
Comparative jurisdiction mean commercial solid waste collection rates, without the highest and lowest rates, per customer, per month, were as follows:
2-cubic yard, 1 time per week: $131.17
2-cubic yard, 2 times per week: $233.25
3-cubic yard, 1 time per week: $173.32
3-cubic yard, 2 times per week: $312.58
4-cubic yard, 1 time per week: $208.37
6-cubic yard, 1 time per week: $294.16.
These two sets of mean commercial rates were almost identical to each other for each service level. Therefore the highest and lowest rates should not be concerns for our analyses.
2. Comparisons between County and Surveyed Jurisdictions
We compared commercial solid waste collection rates between the County, and the fourteen (14) surveyed jurisdictions for six (6) service levels, including:
2-cubic yard, 1 time per week
2-cubic yard, 2 times per week
3-cubic yard, 1 time per week
3-cubic yard, 2 times per week
4-cubic yard, 1 time per week
6-cubic yard, 1 time per week.
We did not compare the County’s 1-cubic yard (1 time per week), 1-cubic yard (2 times per week), 4-cubic yard (2 times per week), and 6-cubic yard (2 times per week) rates against the other jurisdictions, because the six service levels included
in our comparison were the most common service levels offered by the other jurisdictions. For the subset comparisons, we compared County mean versus comparative jurisdiction means, and County mean versus comparative jurisdiction means without outliers, respectively, as shown in Table 3-9 and Table 3-10, on the next page.
In Table 3-9, we compared the County mean with the comparative jurisdiction means, for commercial services. County commercial average rates were well below jurisdiction average rates, across all six service levels in the comparison, as follows:
For the 2-cubic yard, 1 per week, service level, the County average rate was dramatically below the average of other comparative jurisdiction rates, by 44.91 percent, or $59.88
For the 2-cubic yard, 2 times per week, service level, the County average rate was substantially below the average of other comparative jurisdiction rates, by 21.17 percent, or $49.89
For the 3-cubic yard, 1 time per week, service level, the County average rate was substantially below the average of other comparative jurisdiction rates, by 33.24 percent, or $57.93
For the 3-cubic yard, 2 times per week, service level, the County average rate was well below the average of other comparative jurisdiction rates, by 26.98 percent, or $84.39
For the 4-cubic yard, 1 time per week, service level, the County average rate was well below the average of other comparative jurisdiction rates, by 28.01 percent, or $59.34
For the 6-cubic yard, 1 time per week, service level, the County average rate was well below the average of other comparative jurisdiction rates, by 26.54 percent, or $77.84.
3-11

3. Solid Waste Rate and Service Levels and Comparisons between the County and Selected Jurisdictions
Table 3-9 Comparison between County and Comparative Jurisdictions, for County Mean versus Comparative Jurisdiction Means, for Commercial Solid Waste Collection Rates
Per customer, per month (As of January 2008)
Solid Waste Rate and Service Study El Dorado County
Service Level 2-yd 1 per week 2-yd 2 per week 3-yd 1 per week 3-yd 2 per week 4-yd 1 per week 6-yd 1 per week Description
County Jurisdictions County Jurisdictions County Jurisdictions County Jurisdictions County Jurisdictions County Jurisdictions
Mean $73.46 $133.34 $185.72 $235.61 $116.35 $174.28 $228.36 $312.75 $152.49 $211.83 $215.50 $293.34
Absolute Difference -$59.88 -$49.89 -$57.93 -$84.39 -$59.34 -$77.84
Percent Difference -44.91% -21.17% -33.24% -26.98% -28.01% -26.54%
Number of Rates 5 13 5 13 5 14 5 14 5 12 6 12
Table 3-10 Comparison between County and Comparative Jurisdictions, for County Mean versus Comparative Jurisdiction Means (Without Highest and Lowest Rates), for Commercial Solid Waste Collection Rates
Per customer, per month (As of January 2008)
Solid Waste Rate and Service Study El Dorado County
Service Level
2-yd 1 per week 2-yd 2 per week 3-yd 1 per week 3-yd 2 per week 4-yd 1 per week 6-yd 1 per week Description County Jurisdictions County Jurisdictions County Jurisdictions County Jurisdictions County Jurisdictions County Jurisdictions
Mean $73.46 $131.17 $185.72 $233.25 $116.35 $173.32 $228.36 $312.58 $152.49 $208.37 $215.50 $294.16
Absolute Difference -$57.71 -$47.53 -$56.97 -$84.22 -$55.88 -$78.66
Percent Difference -44.00% -20.38% -32.87% -26.94% -26.82% -26.74%
Number of Rates
5 11 5 11 5 12 5 12 5 10 6 10
Outliers, such as the highest and lowest rates, might drive different results. Therefore, we excluded the highest and lowest comparative jurisdiction rates, and compared the County mean against the mean of the rest of the comparative jurisdictions, for commercial
services, in Table 3-10 above. Results were similar to those in Table 3-9, which further confirmed our previous findings, that County commercial average rates were still well below jurisdiction average rates, across all six service levels in the comparison.
3-12 Solid Waste Rate and Service Study

Generally, County commercial rates were lower compared to the other comparative jurisdictions, for all six service levels in our comparisons, and particularly for the 2-cubic yard (1 time per week), and 3-cubic yard (1 time per week) service levels.
3. Comparisons between Each County Area and Surveyed Jurisdictions
We compared commercial solid waste collection rates of each County franchise area with the comparative jurisdiction rates. For this subset comparison, we compared each County area rate with the comparative jurisdiction mean rate, for all six service levels, as shown in Table 3-11, on the next page.
As shown in Table 3-11, there were four franchise areas with commercial rates below the comparative jurisdiction average rates across all the offered service levels, including:
Amador Disposal Service
American River Disposal Service
Sierra Disposal Service
South Tahoe Refuse Company.
One of these four franchise areas is served by Waste Connections of California, and the other three areas are served by South Tahoe Refuse Company. For the three areas served by South Tahoe Refuse Company, the commercial solid waste collection rates were dramatically below the other comparative jurisdictions, ranging from 42 percent to 79 percent less, depending on the company and service level.
In the four areas served by El Dorado Disposal Services, commercial rates were above the comparative jurisdiction average rates (2 percent to 29 percent), for most service levels, and below the average rates (0.3 percent to 13 percent), for the lower service levels, such as 2-cubic yard (1 time per week).
In the area served by Tahoe-Truckee Sierra Disposal, commercial rates were above the comparative jurisdiction average rates, ranging from 12 percent to 23 percent, more.
4. Comparisons within County
Previous comparisons show relationships between County rates and the other jurisdiction rates. In order to determine whether a particular franchise area’s rates were below or above the overall County average rates, we compared each franchise area rate with the County average rate, for six service levels, in Table 3-12, on page 3-15.
Areas served by Waste Connections and Tahoe-Truckee Sierra Disposal had commercial solid waste collection rates above the County average, with one exception, for the 6-cubic yard (1 time per week) rate of Amador Disposal Service. These six areas included:
Amador Disposal Service
El Dorado Disposal Services, Cameron Park Area
El Dorado Disposal Services, City of Placerville Area
El Dorado Disposal Services, El Dorado Hills Area
El Dorado Disposal Services, Unincorporated County Area
Tahoe-Truckee Sierra Disposal.
Areas served by three South Tahoe Refuse Company subsidiaries had commercial rates well below the County average, ranging from 21 percent to 70 percent below, as follows:
American River Disposal Service
Sierra Disposal Service
South Tahoe Refuse Company.
3-13

3. Solid Waste Rate and Service Levels and Comparisons between the County and Selected Jurisdictions
Table 3-11 Comparison between County and Comparative Jurisdictions, By Each Franchise Area, for County Area Rates versus Comparative Jurisdiction Means, for Commercial Solid Waste Collection Rates
Per customer, per month (As of January 2008)
Solid Waste Rate and Service Study El Dorado County
Service Level No. Company/Area 2-yd
1 per week2-yd
2 per week3-yd
1 per week3-yd
2 per week4-yd
1 per week 6-yd
1 per week
1.0 Amador Disposal Service $108.47 $216.94 N/A N/A N/A $162.71
Absolute Difference -$24.87 -$18.67 N/A N/A N/A -$130.63
Percent Difference -18.65% -7.92% N/A N/A N/A -44.53%
2.0 El Dorado Disposal Services
2.1 – Cameron Park $128.02 $256.03 $191.19 $382.40 $251.56 $377.35
Absolute Difference -$5.32 $20.42 $16.91 $69.65 $39.73 $84.01
Percent Difference -3.99% 8.67% 9.71% 22.27% 18.76% 28.64%
2.2 – City of Placerville $126.38 $252.75 $188.75 $377.49 $248.43 $364.56
Absolute Difference -$6.96 $17.14 $14.47 $64.74 $36.60 $71.22
Percent Difference -5.22% 7.28% 8.31% 20.70% 17.28% 24.28%
2.3 – El Dorado Hills $115.63 $240.57 $172.69 $345.39 $227.29 $333.54
Absolute Difference -$17.71 $4.96 -$1.59 $32.64 $15.46 $40.20
Percent Difference -13.28% 2.11% -0.91% 10.44% 7.30% 13.70%
2.4 – Unincorporated County Area $133.01 $460.05 $198.65 $397.29 $261.37 $392.07
Absolute Difference -$0.33 $224.44 $24.37 $84.54 $49.54 $98.73
Percent Difference -0.25% 95.26% 13.99% 27.03% 23.39% 33.66%
3.0 American River Disposal Service $28.32 $56.64 $42.48 $84.96 $56.64 $84.96
Absolute Difference -$105.02 -$178.97 -$131.80 -$227.79 -$155.19 -$208.38
Percent Difference -78.76% -75.96% -75.62% -72.83% -73.26% -71.04%
4.0 Sierra Disposal Service $40.42 $80.84 $60.63 $121.26 $80.84 $121.26
Absolute Difference -$92.92 -$154.77 -$113.65 -$191.49 -$130.99 -$172.08
Percent Difference -69.69% -65.69% -65.21% -61.23% -61.84% -58.66%
5.0 South Tahoe Refuse Company $57.06 $114.12 $85.59 $171.18 $114.12 $171.18
Absolute Difference -$76.28 -$121.49 -$88.69 -$141.57 -$97.71 -$122.16
Percent Difference -57.21% -51.56% -50.89% -45.27% -46.13% -41.64%
6.0 Tahoe-Truckee Sierra Disposal N/A N/A $194.42 $367.12 $249.49 $360.80
Absolute Difference N/A N/A $20.14 $54.37 $37.66 $67.46
Percent Difference N/A N/A 11.56% 17.39% 17.78% 23.00%
Comparative Jurisdiction Mean $133.34 $235.61 $174.28 $312.75 $211.83 $293.34
3-14 Solid Waste Rate and Service Study

Table 3-12 Comparison within County, By Each Franchise Area, for County Area Rates versus County Means, for Commercial Solid Waste Collection Rates
Per customer, per month (As of January 2008)
Solid Waste Rate and Service Study El Dorado County
Service Level No. Company/Area 2-yd
1 per week2-yd
2 per week3-yd
1 per week3-yd
2 per week 4-yd
1 per week6-yd
1 per week
1.0 Amador Disposal Service $108.47 $216.94 N/A N/A N/A $162.71
Absolute Difference $35.01 $31.22 N/A N/A N/A -$52.79
Percent Difference 47.67% 16.81% N/A N/A N/A -24.50%
2.0 El Dorado Disposal Services
2.1 – Cameron Park $128.02 $256.03 $191.19 $382.40 $251.56 $377.35
Absolute Difference $54.56 $70.31 $74.84 $154.04 $99.07 $161.85
Percent Difference 74.28% 37.86% 64.32% 67.45% 64.97% 75.11%
2.2 – City of Placerville $126.38 $252.75 $188.75 $377.49 $248.43 $364.56
Absolute Difference $52.92 $67.03 $72.40 $149.13 $95.94 $149.06
Percent Difference 72.05% 36.09% 62.22% 65.30% 62.91% 69.17%
2.3 – El Dorado Hills $115.63 $240.57 $172.69 $345.39 $227.29 $333.54
Absolute Difference $42.17 $54.85 $56.34 $117.03 $74.80 $118.04
Percent Difference 57.41% 29.54% 48.42% 51.25% 49.05% 54.78%
2.4 – Unincorporated County Area $133.01 $460.05 $198.65 $397.29 $261.37 $392.07
Absolute Difference $59.55 $274.33 $82.30 $168.93 $108.88 $176.57
Percent Difference 81.07% 147.71% 70.73% 73.97% 71.40% 81.94%
3.0 American River Disposal Service $28.32 $56.64 $42.48 $84.96 $56.64 $84.96
Absolute Difference -$45.14 -$129.08 -$73.87 -$143.40 -$95.85 -$130.54
Percent Difference -61.45% -69.50% -63.49% -62.80% -62.86% -60.57%
4.0 Sierra Disposal Service $40.42 $80.84 $60.63 $121.26 $80.84 $121.26
Absolute Difference -$33.04 -$104.88 -$55.72 -$107.10 -$71.65 -$94.24
Percent Difference -44.97% -56.47% -47.89% -46.90% -46.99% -43.73%
5.0 South Tahoe Refuse Company $57.06 $114.12 $85.59 $171.18 $114.12 $171.18
Absolute Difference -$16.40 -$71.60 -$30.76 -$57.18 -$38.37 -$44.32
Percent Difference -22.32% -38.55% -26.44% -25.04% -25.16% -20.56%
6.0 Tahoe-Truckee Sierra Disposal N/A N/A $194.42 $367.12 $249.49 $360.80
Absolute Difference N/A N/A $78.07 $138.76 $97.00 $145.30
Percent Difference N/A N/A 67.09% 60.76% 63.61% 67.43%
El Dorado County Mean $73.46 $185.72 $116.35 $228.36 $152.49 $215.50
3-15
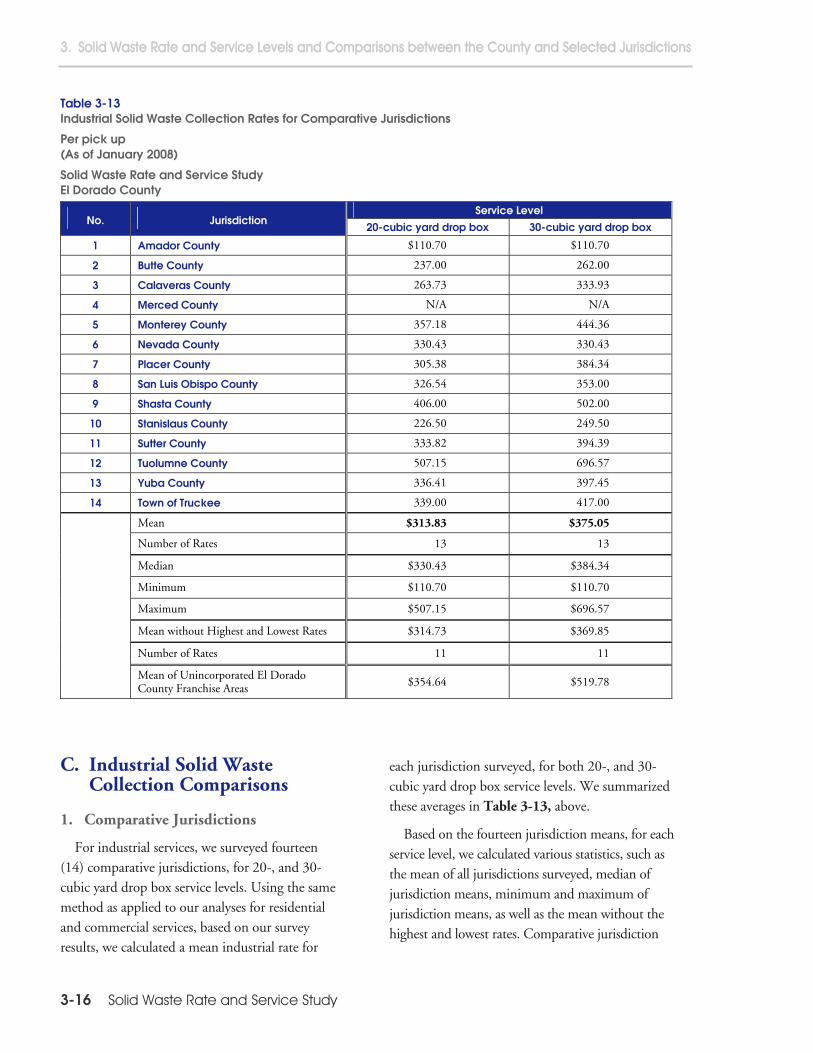
3. Solid Waste Rate and Service Levels and Comparisons between the County and Selected Jurisdictions
Table 3-13 Industrial Solid Waste Collection Rates for Comparative Jurisdictions
Per pick up (As of January 2008)
Solid Waste Rate and Service Study El Dorado County
Service Level No. Jurisdiction
20-cubic yard drop box 30-cubic yard drop box
1 Amador County $110.70 $110.70
2 Butte County 237.00 262.00
3 Calaveras County 263.73 333.93
4 Merced County N/A N/A
5 Monterey County 357.18 444.36
6 Nevada County 330.43 330.43
7 Placer County 305.38 384.34
8 San Luis Obispo County 326.54 353.00
9 Shasta County 406.00 502.00
10 Stanislaus County 226.50 249.50
11 Sutter County 333.82 394.39
12 Tuolumne County 507.15 696.57
13 Yuba County 336.41 397.45
14 Town of Truckee 339.00 417.00
Mean $313.83 $375.05
Number of Rates 13 13
Median $330.43 $384.34
Minimum $110.70 $110.70
Maximum $507.15 $696.57
Mean without Highest and Lowest Rates $314.73 $369.85
Number of Rates 11 11
Mean of Unincorporated El Dorado County Franchise Areas $354.64 $519.78
C. Industrial Solid Waste Collection Comparisons
1. Comparative Jurisdictions
For industrial services, we surveyed fourteen (14) comparative jurisdictions, for 20-, and 30-cubic yard drop box service levels. Using the same method as applied to our analyses for residential and commercial services, based on our survey results, we calculated a mean industrial rate for
each jurisdiction surveyed, for both 20-, and 30-cubic yard drop box service levels. We summarized these averages in Table 3-13, above.
Based on the fourteen jurisdiction means, for each service level, we calculated various statistics, such as the mean of all jurisdictions surveyed, median of jurisdiction means, minimum and maximum of jurisdiction means, as well as the mean without the highest and lowest rates. Comparative jurisdiction
3-16 Solid Waste Rate and Service Study
mean industrial solid waste collection rates, per pick up, were as follows:
20-cubic yard drop box: $313.83
30-cubic yard drop box: $375.05.
Comparative jurisdiction mean industrial solid waste collection rates, without the highest and lowest rates, per customer, per month, were as follows:
20-cubic yard drop box: $314.73
30-cubic yard drop box: $369.85.
These two sets of mean industrial rates were almost identical to each other for each service level. Therefore the highest and lowest rates should not be concerns for our analyses.
2. Comparisons between County and Surveyed Jurisdictions
We compared industrial solid waste collection rates between the County and the fourteen (14) surveyed jurisdictions for two (2) service levels, including:
20-cubic yard drop box
30-cubic yard drop box.
For this subset comparison, we compared the County mean with the comparative jurisdictions mean, and County mean versus comparative jurisdiction mean. These comparisons are shown in Table 3-14 and Table 3-15, on the next page.
In Table 3-14, we compared the County mean with the comparative jurisdiction means, for industrial services. County industrial average rates were above jurisdiction average rates for the 20-cubic yard drop box, and 30-cubic yard drop box service levels, as follows:
For the 20-cubic yard drop box service level, the County average rate was above the average of other comparative jurisdiction rates, by 13.64 percent, or $42.81
For the 30-cubic yard drop box service level, the County average rate was above the
average of other comparative jurisdiction rates, by 38.59 percent, or $144.73.
Outliers, such as the highest and lowest rates, might drive different results. Therefore, we excluded the highest and lowest comparative jurisdiction rates, and compared the County mean against the mean of the rest of the comparative jurisdictions, for industrial services. Similar to our results above, County industrial average rates were still above jurisdiction average rates for the 20-cubic yard drop box, and 30-cubic yard drop box service levels.
Generally, County industrial rates were higher compared to the other comparative jurisdictions, for the 20-cubic yard drop box, and 30-cubic yard drop box service levels.
3. Comparisons between Each County Area and Surveyed Jurisdictions
In addition to our county level comparisons, we compared each County area industrial solid waste collection rates with the comparative jurisdiction rates. For this subset comparison, we compared each franchise area rate with the comparative jurisdiction means, for the two service levels, as shown in Table 3-16, on page 3-19. Among the franchise areas, there was no data available for Tahoe-Truckee Sierra Disposal.
As shown in Table 3-16, all areas had industrial rates above the comparative jurisdiction average rates, for both service levels.
4. Comparisons within County
Previous comparisons reveal relationships between County rates and the other jurisdiction rates. To determine whether a particular franchise area’s rates were below or above the overall County average rates, in this subset of comparison, we compared each franchise area rate with the County average rate, for two service levels, in Table 3-17, on page 3-20.
3-17

3. Solid Waste Rate and Service Levels and Comparisons between the County and Selected Jurisdictions
Table 3-14 Comparison between County and Comparative Jurisdictions, for County Mean versus Comparative Jurisdiction Means, for Industrial Solid Waste Collection Rates
Per pick up (As of January 2008)
Solid Waste Rate and Service Study El Dorado County
Service Level 20-cubic yard drop box 30-cubic yard drop box Description
County Jurisdictions County Jurisdictions
Mean $356.64 $313.83 $519.78 $375.05
Absolute Difference $42.81 $144.73
Percent Difference 13.64% 38.59%
Number of Rates 5 13 5 13
Table 3-15 Comparison between County and Comparative Jurisdictions, for County Mean versus Comparative Jurisdiction Means (Without Highest and Lowest Rates), for Industrial Solid Waste Collection Rates
Per pick up (As of January 2008)
Solid Waste Rate and Service Study El Dorado County
Service Level
20-cubic yard drop box 30-cubic yard drop box Description County Jurisdictions County Jurisdictions
Mean $356.64 $314.73 $519.78 $369.85
Absolute Difference $41.91 $149.93
Percent Difference 13.32% 40.54%
Number of Rates 5 11 5 11
Table 3-17 shows whether the franchise area rate was below, or above, the County average. All areas, except for Sierra Disposal Service and STR’s 30-cubic yard service, had industrial rates below the County average rates, for both service levels. In the area served by Sierra Disposal Service, industrial rates were above the County average rates, for both service levels.
D. Tipping Fee Comparisons For transfer station and landfill tipping fees, we
surveyed fourteen (14) comparative jurisdictions, the same as for the comparative jurisdiction rate and service level surveys, as shown in Exhibit A-6, Appendix A. A summary of comparative jurisdiction tipping fees is provided in Table 3-18, on page 3-21. Comparative jurisdiction mean transfer station tipping fees, per ton, were $65.90, and median
3-18 Solid Waste Rate and Service Study

Table 3-16 Comparison between County and Comparative Jurisdictions, By Each Franchise Area, for County Area Rates versus Comparative Jurisdiction Means, for Industrial Solid Waste Collection Rates
Per pick up (As of January 2008)
Solid Waste Rate and Service Study El Dorado County
Service Level No. Company/Area
20-cubic yard drop box 30-cubic yard drop box
1.0 Amador Disposal Service $331.50 $488.81
Absolute Difference $17.67 $113.76
Percent Difference 5.63% 30.33%
2.0 El Dorado Disposal Services
2.1 – Cameron Park $341.50 $430.17
Absolute Difference $27.67 $55.12
Percent Difference 8.82% 14.70%
2.2 – City of Placerville $320.82 $404.01
Absolute Difference $6.99 $28.96
Percent Difference 2.23% 7.72%
2.3 – El Dorado Hills $318.43 $401.22
Absolute Difference $4.60 $26.17
Percent Difference 1.46% 6.98%
2.4 – Unincorporated County Area $341.50 $430.16
Absolute Difference $27.67 $55.11
Percent Difference 8.82% 14.69%
3.0 American River Disposal Service $332.70 $515.30
Absolute Difference $18.87 $140.25
Percent Difference 6.01% 37.39%
4.0 Sierra Disposal Service $427.98 $638.15
Absolute Difference $114.15 $263.10
Percent Difference 36.37% 70.15%
5.0 South Tahoe Refuse Company $349.50 $526.50
Absolute Difference $35.67 $151.45
Percent Difference 11.36% 40.38%
6.0 Tahoe-Truckee Sierra Disposal N/A N/A
Absolute Difference N/A N/A
Percent Difference N/A N/A
Comparative Jurisdiction Mean $313.83 $375.05
3-19

3. Solid Waste Rate and Service Levels and Comparisons between the County and Selected Jurisdictions
Table 3-17 Comparison within County By Each Franchise Area for County Area Rates versus County Means for Industrial Solid Waste Collection Rates
Per pick up (As of January 2008)
Solid Waste Rate and Service Study El Dorado County
Service Level No. Company/Area
20-cubic yard drop box 30-cubic yard drop box
1.0 Amador Disposal Service $331.50 $488.81
Absolute Difference -$25.14 -$30.97
Percent Difference -7.05% -5.96%
2.0 El Dorado Disposal Services
2.1 – Cameron Park $341.50 $430.17
Absolute Difference -$15.14 -$89.61
Percent Difference -4.24% -17.24%
2.2 – City of Placerville $320.82 $404.01
Absolute Difference -$35.82 -$115.77
Percent Difference -10.04% -22.27%
2.3 – El Dorado Hills $318.43 $401.22
Absolute Difference -$38.21 -$118.56
Percent Difference -10.71% -22.81%
2.4 – Unincorporated County Area $341.50 $430.16
Absolute Difference -$15.14 -$89.62
Percent Difference -4.24% -17.24%
3.0 American River Disposal Service $332.70 $515.30
Absolute Difference -$23.94 -$4.48
Percent Difference -6.71% -0.86%
4.0 Sierra Disposal Service $427.98 $638.15
Absolute Difference $71.34 $118.37
Percent Difference 20.00% 22.77%
5.0 South Tahoe Refuse Company $349.50 $526.50
Absolute Difference -$7.14 $6.72
Percent Difference -2.00% 1.29%
6.0 Tahoe Truckee Sierra Disposal N/A N/A
Absolute Difference N/A N/A
Percent Difference N/A N/A
El Dorado County Mean $356.64 $519.78
3-20 Solid Waste Rate and Service Study

Table 3-18 Transfer Station Tipping Fees for Comparative Jurisdictions
(As of January 2008)
Solid Waste Rate and Service Study El Dorado County
Transfer Station Description
Tipping Fee Per Ton
Mean $65.90
Number of Rates 19
Median $58.00
Minimum $28.00
Maximum $146.95
Table 3-19 Comparison between County and Comparative Jurisdictions for County Mean versus Comparative Jurisdiction Mean for Transfer Station Tipping Fees
(As of January 2008)
Solid Waste Rate and Service Study El Dorado County
Transfer Station Tipping Fee Per Ton
Description County Jurisdictions
Mean $73.20 $65.90
Absolute Difference $7.30
Percent Difference 11.08%
Number of Rates 4 19
transfer station tipping fees, per ton, were $58.00. Comparative jurisdiction transfer station tipping fees per ton ranged from $28.00 to $146.95.
We compared transfer station tipping fees between the County and the comparative jurisdictions, in Table 3-19, above. The average tipping fees of the transfer stations used by the County franchise companies was above the comparative jurisdiction average tipping fee by 11.08 percent, or $7.30 per ton.
E. Summary of Solid Waste Collection Comparisons
1. Residential Solid Waste Rate Comparisons
County residential rates were consistently fairly competitive, across all service levels, compared to comparative jurisdictions, which have similar solid waste collection systems, demographics, and/or geographic terrain characteristics to the County. County mean residential rates were slightly below the comparative jurisdiction mean rates, for the 2, 32-gallon cans, and 1, 64-gallon cart service levels; and well below the comparative jurisdiction mean rates, for the 1, 32-gallon can, and 1, 96-gallon service levels. Particularly for the largest cart service level, the 1, 96-gallon cart, the County residential rates were less than the comparative jurisdiction rates, by approximately 19 percent.
Rate variations between different service levels tend to be larger for the more linear rate structures, in which rates vary more widely. El Dorado County has a more tightly grouped residential rate structure, so it may not be unusual that County rates are lower than linear rate structure comparative jurisdictions. We compared the County residential rates with a set of eleven jurisdictions that had a similar rate structure to the County. All these jurisdictions had more tightly grouped rate structures, without large rate increments between service levels. We found that even compared to similar rate structure comparative jurisdictions, County mean residential rates were still low for the 1, 32-gallon can service level, by approximately 3 percent, and for the 1, 96-gallon cart service level, by approximately 6 percent. For the other County service levels, County rates were only slightly above averages.
We also assessed some reasons for differences between County rates and our comparative jurisdictions by examining whether residential
3-21

3. Solid Waste Rate and Service Levels and Comparisons between the County and Selected Jurisdictions
rate differences were specific to a given company. We found that residential rates were consistently low, for four of the six unincorporated County franchise areas, with the exception of El Dorado Disposal Services unincorporated County area, and Sierra Disposal Service, compared to the comparative jurisdictions, for both can and cart service levels. In the four areas served by El Dorado Disposal Services, rates were still below averages for the 64-, and 96-gallon cart service levels; but El Dorado Disposal Services rates were above averages for the 1, 32-gallon can, and 2, 32-gallon cans service levels, with the exception of the 1, 32-gallon can rate in the City of Placerville.
Based on our comparisons, we conclude that County residential rates were generally consistently competitive, across all service levels, both can and cart, and across all companies. The exception to this was for the can service rates offered by El Dorado Disposal Services, in El Dorado Hills CSD, and the Unincorporated County area, and Sierra Disposal Service.
2. Residential Solid Waste Service Level Comparisons
Among the comparative jurisdictions, for residential refuse service, many jurisdictions have already implemented a cart-based system (with three cart size options), and some jurisdictions continue also to provide can service. In contrast, the County basically still has a can-based system, with cart services offered by the two Waste Connections companies, in urban areas.
For residential curbside recycling service, most comparative jurisdictions have provided curbside cart-based recycling services. The County has some bag-systems for curbside recycling and some biweekly cart service offered only by El Dorado Disposal Services. In some areas, there is no curbside recycling service provided, instead material is sorted at a MRF.
For residential curbside yard waste service, many comparative jurisdictions have provided curbside cart-based yard waste service; and some provide bag, can, or bundle services. In the County, the curbside yard waste service is limited to the Western urban portion areas, served by El Dorado Disposal Services. The County doesn’t have curbside yard waste service for most of the County areas, instead employing a yard waste burn option. Where feasible and practical, a systematic, single stream, cart-based refuse service; cart-based curbside recycling, and cart-based yardwaste program should be considered in future planning for a County-wide waste management system.
3. Commercial Solid Waste Comparisons
We compared commercial rates between the County and the comparative jurisdictions, for the most common six service levels. We found that County mean commercial rates were consistently low, across all six service levels. For the three lowest volume service levels, including 2 cubic yard (1 time per week), 2 cubic yard (2 times per week), and 3 cubic yard (1 time per week); the County rates were substantially below averages by approximately 33 percent to 45 percent depending on the service level. For the three highest volume service levels, including 3 cubic yard (2 times per week), 4 cubic yard (1 time week), and 6 cubic yard (1 time per week); the County rates were still below averages by approximately 27 percent.
We assessed some reasons for differences between County rates and the comparative jurisdictions by examining whether commercial rate differences were specific to a given company. We found that South Tahoe Refuse Company’s three subsidiaries have below average commercial rates, or approximately less than half of jurisdiction averages, across all six service levels. For example, for the 2 cubic yard (1 time per week) service level, the rate differences range
3-22 Solid Waste Rate and Service Study

from 57 percent to 79 percent below averages; for the 6 cubic yard (1 time per week) service level, the rate differences range from 42 percent to 71 percent below averages. These rate differences become larger as the service levels decrease.
In the County area served by Amador Disposal Service, rates were also below averages, ranging from 8 percent to 45 percent below averages. In addition, we found that in the four areas served by El Dorado Disposal Services, and the County area served by Tahoe-Truckee Sierra Disposal, rates were above averages for most of the service levels. The rate differences generally become larger as the service levels increase.
We conclude that overall County commercial rates were consistently low across all service levels. However, this is not true for every franchise company. The commercial rates were not consistently low for all companies. Among the six franchise companies, four (Amador Disposal Service, South Tahoe Refuse companies (3)) have below average commercial rates, and the other two franchise companies (El Dorado Disposal Services and Tahoe-Truckee Sierra Disposal) have above average commercial rates.
4. Industrial Solid Waste Comparisons
Overall County industrial rates were above jurisdiction average rates for the 20 cubic yard drop box, and 30 cubic yard drop box, by approximately 14 percent, and 39 percent, respectively. For industrial service comparisons, we obtained the best data we could, because industrial service is not covered in the exclusive solid waste service franchise agreements in many jurisdictions, so many haulers don’t have an exclusive industrial service franchise agreement with jurisdiction authority. For example, Merced County issues drop box permits to allow haulers to provide drop box service anywhere in Merced County. As a result, industrial services might be
performed by many non-franchised haulers, and rates might be more comparable in nature.
5. Residential Solid Waste Rates of Neighboring Sacramento County
In this subsection, we provide residential solid waste rates and service levels, for the neighboring Sacramento County, which was not a formal “comparable” jurisdiction included in our rate and service level surveys. Sacramento County still has comparable disposal costs and landfill tipping fees, and pickup frequency, but it is a publicly owned and operated system.
Sacramento County currently has a weekly, three-can-based (e.g., 30-, 60-, and 90-gallon can) residential refuse service, in conjunction with alternating biweekly mixed recycling and yard waste services. The current Sacramento County residential solid waste rates are as follows:
1, 30-gallon can – $16.55 per month
1, 60-gallon can – $19.55 per month
1, 90-gallon can – $25.55 per month.
The County of Sacramento recently proposed to increase the residential rates in its unincorporated county areas to offset increased operating expenses, for fuel, equipment maintenance, and labor. The proposed $4.00 rate increases will be phased in gradually over a three-year period (2008 to 2010). At the end of the three-year period, by 2010, residential rates could be as follows, under Scenario One:
1, 30-gallon can – $20.55 per month
1, 60-gallon can – $23.55 per month
1, 90-gallon can – $29.55 per month.
And under Scenario Two, residential rates could be as follows:
1, 30-gallon can – $19.95 per month
1, 60-gallon can – $23.55 per month
1, 90-gallon can – $30.76 per month.
3-23

3. Solid Waste Rate and Service Levels and Comparisons between the County and Selected Jurisdictions
If the proposed rates are approved, one of these two proposed rate increase scenarios could be implemented. According to the Sacramento County Waste Management and Recycling Department, the rates after proposed increases would still be comparable, and less than other cities in the Sacramento area.
Average residential rates were $16.08, $23.07, and $26.81, respectively, for the three equivalent service levels, including 1, 32-gallon can, 2, 32-gallon cans, and 1, 96-gallon cart, in El Dorado County. Compared to its neighboring Sacramento County, which has alleged comparable residential rates, the El Dorado County rates were about the same as current Sacramento County rates, for
the 1, 32-gallon can and 1, 96-gallon cart service levels, and only the 2, 32-gallon cans County average rate is close to the Sacramento County rate after the proposed Sacramento increases. The findings here further confirm our previous residential comparison results.
* * * * *
Generally, El Dorado County has low rates for both residential and commercial solid waste services, compared to comparable jurisdictions. However, El Dorado County industrial service rates are above average compared to comparable jurisdictions.
3-24 Solid Waste Rate and Service Study

Section 4 Solid Waste Rate and Service Level
Comparisons between the County and Jurisdictions Meeting
AB 939 Diversion Levels

4. Solid Waste Rate and Service Level Comparisons between the County and Jurisdictions Meeting AB 939 Diversion Levels
In this section, we provide historical Assembly Bill 939 (AB 939) diversion levels for El Dorado County, as well as for a set of twelve (12) comparative jurisdictions. These twelve comparative jurisdictions have met the fifty (50) percent AB 939 diversion requirement. We also provide information for the residential solid waste rates and service levels, of these twelve comparable jurisdictions that exceeded the 50 percent AB 939 diversion requirement.
Among these twelve comparative jurisdictions, nine (9) of them overlap with the fourteen (14) jurisdictions used in our rate and service level comparisons (in Section 3). In addition to these nine jurisdictions, we identified three (3) additional jurisdictions that have also met the 50 percent AB 939 diversion requirement.
We calculated rate differences between County rates and rates of these comparable jurisdictions meeting the AB 939 goal. We examined to what degree these cjurisdictions use rate structure pricing incentives for customers to reduce refuse generation. We also identified rate and service level approaches these jurisdicto exceed the AB 939 goal.
omparative
tions use
The remainder of this section is organized as follows:
A. Historical Assembly Bill 939 Diversion Levels 1. El Dorado County AB 939 Diversion Levels 2. Comparative Jurisdiction AB 939 Diversion Levels
B. Residential Solid Waste Collection Comparisons 1. Comparative Jurisdictions 2. Comparisons between County and Surveyed Jurisdictions 3. Similar Rate Structure Jurisdiction Comparisons 4. Comparisons between Each County Area and Surveyed Jurisdictions
C. Summary of Residential Rate and Service Level Comparisons.
A. Historical Assembly Bill 939 Diversion Levels
1. El Dorado County AB 939 Diversion Levels
Historical County AB 939 diversion levels, from 2000 to 2006, are shown in Table 4-1, on the next page. Among the three reporting jurisdictions in the County, in 2006, two of

4. Solid Waste Rate and Service Level Comparisons between the County and Jurisdictions Meeting AB 939 Diversion Levels
Table 4-1 Historical Diversion Rates for El Dorado County
(2000 to 2006)
Solid Waste Rate and Service Study El Dorado County
Diversion Rate (%) County Jurisdiction
2000 2001 2002 2003 2004 2005 2006*
El Dorado El Dorado-Unincorporated 41 38 32 56 54 50 53a
City of Placerville 50 58 64 44 63 70 80
City of South Lake Tahoe 42 48 32 41 54 46 42
* Numbers shown in bold exceed the 50 percent AB 939 diversion goal in 2006. Source: California Integrated Waste Management Board, Countrywide, Regionwide, and Statewide Jurisdiction Diversion Progress Report.
a The County has an additional five (5) percent biomass diversion credit for unincorporated El Dorado County.
them achieved the diversion requirement in 2006, with reported CIWMB diversion rates above the 50 percent AB 939 diversion goal, as follows:
El Dorado-Unincorporated – 53 percent
City of Placerville – 80 percent.
The City of South Lake Tahoe diversion rate was 42 percent in 2006, which was 8 percent below the AB 939 diversion goal set by the State.
Figure 4-1, on the next page, graphically shows historic County, seven-year diversion level trends for the three jurisdictions within the County. During this seven-year period, the County has worked to improve its diversion levels. In 2006, two County areas increased their diversion rates, compared to their 2005 rates, by three percent, and ten percent, respectively, for El Dorado-Unincorporated area, and the City of Placerville. However, in 2006, the diversion rate for the City of South Lake Tahoe declined to 42 percent, or eight percent below the 50 percent AB 939 goal.
Faced with several challenging solid waste management issues, such as geographic variability; urban and rural population mixes; and diverse climate conditions, the County has continuously tried to improve AB 939 diversion
levels. The County would like a County-wide system capable of moving beyond the current AB 939 goal in light of recent State proposals to increase the diversion requirements.
2. Comparative Jurisdiction AB 939 Diversion Levels
We identified a set of twelve (12) comparative jurisdictions that have met the 50 percent AB 939 diversion requirement in 2006. Among these twelve jurisdictions, nine (9) of them overlap with the fourteen (14) jurisdictions used in our rate and service level comparisons (in Section 3). In addition to these nine jurisdictions, we identified three other jurisdictions, including Solano County, Napa County, and Sonoma County, which have also met the 50 percent AB 939 diversion requirement.
A list of these twelve comparative jurisdictions is provided in Appendix B. Some of these California jurisdictions have some similar solid waste collection system characteristics as the County, such as similar populations, similar urban and rural mixes, split regional haulers, similar climates, or same service providers. Others are adjacent or neighboring counties.
4-2 Solid Waste Rate and Service Study

Figure 4-1 Historical Diversion Rates for El Dorado County
(2000 to 2006)
Solid Waste Rate and Service Study El Dorado County
In Table 4-2, on the next page, we show the
historical AB 939 diversion rates, of the comparative jurisdictions exceeding the 50 percent AB 939 goal, as well as El Dorado County. These diversion rates are for the unincorporated areas within the comparative jurisdictions. All these jurisdictions, including El Dorado County, met the AB 939 diversion requirement in 2006. During the seven-year period, we found up-slope trends for the diversion levels of these jurisdictions. The mean diversion rates of these twelve jurisdictions, from 2000 to 2006, were as follows:
2000 Diversion Rate – 47 percent
2001 Diversion Rate – 52 percent
2002 Diversion Rate – 53 percent
2003 Diversion Rate – 52 percent
2004 Diversion Rate – 64 percent
2005 Diversion Rate – 60 percent
2006 Diversion Rate – 62 percent.
We compared historical AB 939 diversion rates, from 2000 to 2006, between the County and the comparative jurisdictions. Figure 4-2, on page 4-5, presents the comparison in the form of a histogram chart. Over the seven-year period, although the County diversion rates were above the 50 percent AB 939 diversion goal in the second half period, County diversion rates were below the average of the twelve comparative jurisdictions, except for year 2003, when the County diversion rate exceeded the jurisdiction mean by 4 percent.
4-3
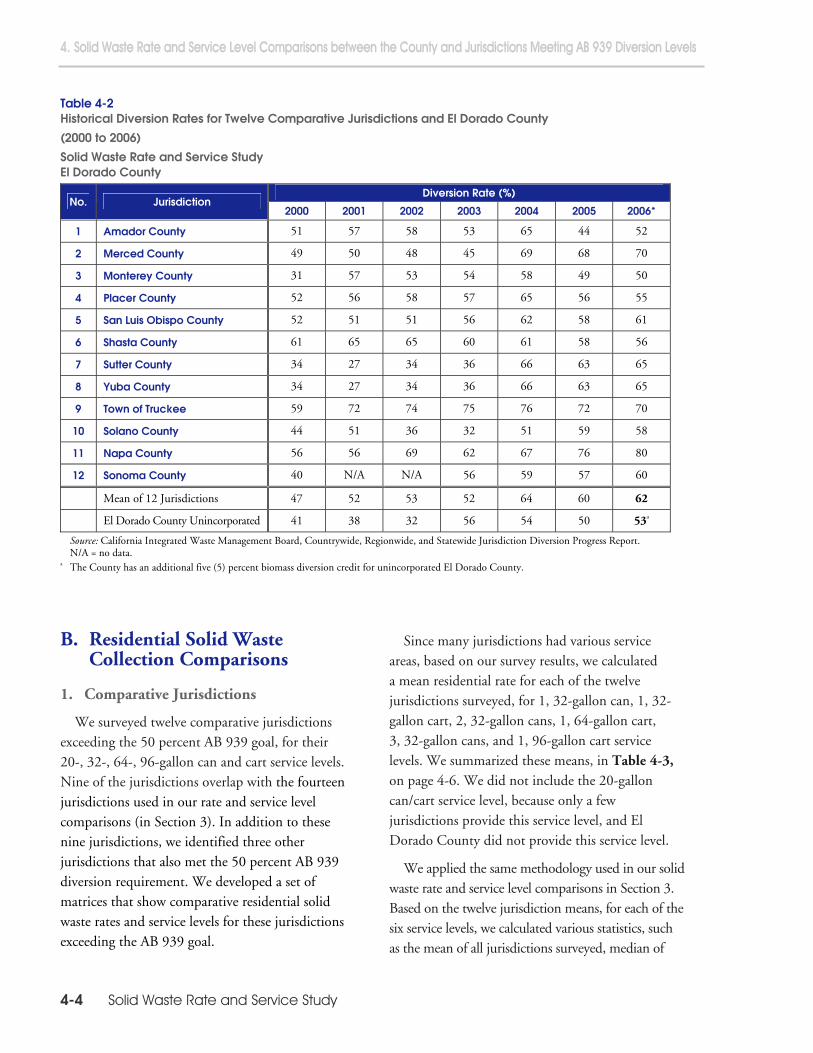
4. Solid Waste Rate and Service Level Comparisons between the County and Jurisdictions Meeting AB 939 Diversion Levels
Table 4-2 Historical Diversion Rates for Twelve Comparative Jurisdictions and El Dorado County
(2000 to 2006)
Solid Waste Rate and Service Study El Dorado County
Diversion Rate (%) No. Jurisdiction
2000 2001 2002 2003 2004 2005 2006*
1 Amador County 51 57 58 53 65 44 52
2 Merced County 49 50 48 45 69 68 70
3 Monterey County 31 57 53 54 58 49 50
4 Placer County 52 56 58 57 65 56 55
5 San Luis Obispo County 52 51 51 56 62 58 61
6 Shasta County 61 65 65 60 61 58 56
7 Sutter County 34 27 34 36 66 63 65
8 Yuba County 34 27 34 36 66 63 65
9 Town of Truckee 59 72 74 75 76 72 70
10 Solano County 44 51 36 32 51 59 58
11 Napa County 56 56 69 62 67 76 80
12 Sonoma County 40 N/A N/A 56 59 57 60
Mean of 12 Jurisdictions 47 52 53 52 64 60 62
El Dorado County Unincorporated 41 38 32 56 54 50 53a
Source: California Integrated Waste Management Board, Countrywide, Regionwide, and Statewide Jurisdiction Diversion Progress Report. N/A = no data.
a The County has an additional five (5) percent biomass diversion credit for unincorporated El Dorado County.
B. Residential Solid Waste Collection Comparisons
1. Comparative Jurisdictions
We surveyed twelve comparative jurisdictions exceeding the 50 percent AB 939 goal, for their 20-, 32-, 64-, 96-gallon can and cart service levels. Nine of the jurisdictions overlap with the fourteen jurisdictions used in our rate and service level comparisons (in Section 3). In addition to these nine jurisdictions, we identified three other jurisdictions that also met the 50 percent AB 939 diversion requirement. We developed a set of matrices that show comparative residential solid waste rates and service levels for these jurisdictions exceeding the AB 939 goal.
Since many jurisdictions had various service areas, based on our survey results, we calculated a mean residential rate for each of the twelve jurisdictions surveyed, for 1, 32-gallon can, 1, 32-gallon cart, 2, 32-gallon cans, 1, 64-gallon cart, 3, 32-gallon cans, and 1, 96-gallon cart service levels. We summarized these means, in Table 4-3, on page 4-6. We did not include the 20-gallon can/cart service level, because only a few jurisdictions provide this service level, and El Dorado County did not provide this service level.
We applied the same methodology used in our solid waste rate and service level comparisons in Section 3. Based on the twelve jurisdiction means, for each of the six service levels, we calculated various statistics, such as the mean of all jurisdictions surveyed, median of
4-4 Solid Waste Rate and Service Study

Figure 4-2 Historical Diversion Rates for Twelve Comparative Jurisdictions and El Dorado County
(2000 to 2006)
Solid Waste Rate and Service Study El Dorado County
jurisdiction means, minimum and maximum of jurisdiction means, as well as mean without the highest and lowest rates, which eliminates those outliers that might drive the overall mean. Comparative jurisdiction mean residential solid waste collection rates, per customer, per month, were as follows:
1, 32-gallon can: $19.24
1, 32-gallon cart: $20.45
2, 32-gallon cans: $23.82
1, 64-gallon cart: $29.27
3, 32-gallon cans: $29.87
1, 96-gallon cart: $36.78.
Comparative jurisdiction mean residential solid waste collection rates, without the highest and lowest rates, per customer, per month, were as follows:
1, 32-gallon can: $19.23
1, 32-gallon cart: $20.57
2, 32-gallon cans: $23.18
1, 64-gallon cart: $29.20
3, 32-gallon cans: $27.04
1, 96-gallon cart: $36.34.
These two sets of mean residential rates were almost identical to each other for each service level. Therefore the highest and lowest rates should not be concerns for our analyses. Comparisons based on these two sets of means would produce similar results.
4-5

4. Solid Waste Rate and Service Level Comparisons between the County and Jurisdictions Meeting AB 939 Diversion Levels
Table 4-3 Residential Solid Waste Collection Rates for Comparative Jurisdictions With Diversion Rates Above 50 Percent (in 2006)
Per customer, per month (As of January 2008)
Solid Waste Rate and Service Study El Dorado County
Service Level No. Jurisdiction 1, 32-Gallon
Can 1, 32-Gallon
Cart 2, 32-Gallon
Cans 1, 64-Gallon
Cart 3, 32-Gallon
Cans 1, 96-Gallon
Cart
Diversion Rate (%)
2006
1 Amador County $18.53 $19.08 $24.84 $24.08 $31.15 $26.88 52
2 Merced County 11.26 N/A 11.26 25.68 16.08 31.38 70
3 Monterey County 25.45 23.83 38.95 36.11 52.31 49.24 50
4 Placer County N/A 16.37 N/A 23.98 N/A 28.62 55
5 San Luis Obispo County 20.54 20.60 27.55 31.81 33.89 43.01 61
6 Shasta County N/A N/A N/A 19.70 N/A 22.79 56
7 Sutter County N/A 22.55 N/A 33.56 N/A 44.57 65
8 Yuba County N/A 22.72 N/A 33.82 N/A 44.92 65
9 Town of Truckee 14.11 N/A 15.00 N/A 15.89 N/A 70
10 Solano County 17.49 N/A 25.32 N/A N/A 29.24 58
11 Napa County N/A 16.40 N/A 24.60 N/A 29.24 80
12 Sonoma County 27.31 22.07 N/A 39.35 N/A 54.67 60
Mean $19.24 $20.45 $23.82 $29.27 $29.87 $36.78
Number of Rates 7 8 6 10 5 11
Mean of Jurisdictions with Rate Structure Similar to Countya $16.39 $18.11 $20.79 $24.97 $24.25 $30.16
Number of Rates 5 4 5 6 4 7
Median $18.53 $21.33 $25.08 $28.74 $31.15 $31.38
Minimum $11.26 $16.37 $11.26 $19.70 $15.89 $22.79
Maximum $27.31 $23.83 $38.95 $39.35 $52.31 $54.67
Mean without Highest and Lowest Rates $19.23 $20.57 $23.18 $29.20 $27.04 $36.34
Number of Rates 5 6 4 8 3 9
Mean of Unincorporated El Dorado County Franchise Area $16.08 – $23.07 $26.26 – $26.81 53b
a This mean is calculated based on the jurisdictions listed in this table, excluding the four counties of Monterey, Sutter, Yuba, and Sonoma.
b The County has an additional five (5) percent biomass diversion credit for unincorporated El Dorado County.
Comparative jurisdiction median residential solid waste collection rates, per customer, per month, were as follows:
1, 32-gallon can: $18.53
1, 32-gallon cart: $21.33
2, 32-gallon cans: $25.08
1, 64-gallon cart: $28.74
3, 32-gallon cans: $31.15
1, 96-gallon cart: $31.38.
4-6 Solid Waste Rate and Service Study

Our data show that the median residential rates were very close to the mean residential rates, which implies our survey data have a normal distribution.
Jurisdictions employ different rate setting methodologies, and have different rate structures. Some counties have more linear rate structures, in which rates vary relatively widely. For example, in our residential rate survey, Monterey County, Sutter County, Yuba County, and Sonoma County have such rate structures, with large incremental differences between service levels.
Some counties have more tightly grouped rate structures, in which rates vary relatively little. For example, in our residential rate survey, Amador County has such a rate structure, with tightly grouped residential rates, such as $19.08 for 1, 32-gallon cart; $24.08 for 1, 64-gallon cart; and $26.88 for 1, 96-gallon cart. El Dorado County also is a county with relatively tightly grouped rates.
Comparisons made among similar rate structure jurisdictions might produce more meaningful findings. Therefore, we excluded four (4) counties with linear rate structures, including Monterey County, Sutter County, Yuba County, and Sonoma County, from the twelve comparative jurisdictions, and developed another set of comparative jurisdictions mean residential solid waste collection rates of eight (8) jurisdictions, with similar rate structure to El Dorado County. Mean residential solid waste collection rates of eight jurisdictions with rate structure similar to El Dorado County, per customer, per month, were as follows:
1, 32-gallon can: $16.39
1, 32-gallon cart: $18.11
2, 32-gallon cans: $20.79
1, 64-gallon cart: $24.97
3, 32-gallon cans: $24.25
1, 96-gallon cart: $30.16.
2. Comparisons between County and Surveyed Jurisdictions
We compared residential solid waste collection rates between the County and the twelve comparative jurisdictions, for four (4) service levels, including:
1, 32-gallon can
2, 32-gallon cans
1, 64-gallon cart
1, 96-gallon cart.
We did not compare the County’s 45-gallon can rates against the other jurisdictions, because there was not sufficient data available. For the subset comparisons, we compared County mean versus comparative jurisdiction means, and County mean versus comparative jurisdiction means without outliers, as shown in Table 4-4 and Table 4-5, on the next page.
In Table 4-4, we compared the County mean with the comparative jurisdiction means, for each of the four service levels, for residential services. County residential average rates were below jurisdiction average rates for all four service levels, as follows:
For the 1, 32-gallon can service level, the County average rate was substantially below the average of comparative jurisdiction rates, by 16.42 percent, or $3.16
For the 2, 32-gallon cans service level, the County average rate was slightly below the average of comparative jurisdiction rates, by 3.15 percent, or $0.75
For the 1, 64-gallon cart service level, the County average rate was substantially below the average of comparative jurisdiction rates, by 10.28 percent, or $3.01
For the 1, 96-gallon cart service level, the County average rate was dramatically below the average of other comparative jurisdiction rates, by 27.11 percent, or $9.97.
4-7

4. Solid Waste Rate and Service Level Comparisons between the County and Jurisdictions Meeting AB 939 Diversion Levels
Table 4-4 Comparison between County and Comparative Jurisdictions With Diversion Rates Above 50 Percent (in 2006)
County Mean versus Comparative Jurisdiction Means for Residential Solid Waste Collection Rates
Per customer, per month (As of January 2008)
Solid Waste Rate and Service Study El Dorado County
Service Level 1, 32-Gallon Can 2, 32-Gallon Cans 1, 64-Gallon Cart 1, 96-Gallon Cart Description
County Jurisdictions County Jurisdictions County Jurisdictions County Jurisdictions
Mean $16.08 $19.24 $23.07 $23.82 $26.26 $29.27 $26.81 $36.78
Absolute Difference -$3.16 -$0.75 -$3.01 -$9.97
Percent Difference -16.42% -3.15% -10.28% -27.11%
Number of Rates 5 7 6 6 1 10 2 11
Table 4-5 Comparison between County and Comparative Jurisdictions With Diversion Rates Above 50 Percent (in 2006)
County Mean versus Comparative Jurisdiction Means (Without Highest and Lowest Rates) for Residential Solid Waste Collection Rates
Per customer, per month (As of January 2008)
Solid Waste Rate and Service Study El Dorado County
Service Level
1, 32-Gallon Can 2, 32-Gallon Cans 1, 64-Gallon Cart 1, 96-Gallon Cart Description
County Jurisdictions County Jurisdictions County Jurisdictions County Jurisdictions
Mean $16.08 $19.23 $23.07 $23.18 $26.26 $29.20 $26.81 $36.34
Absolute Difference -$3.15 -$0.11 -$2.94 -$9.53
Percent Difference -16.38% -0.47% -10.07% -26.22%
Number of Rates 5 5 6 4 1 8 2 9
4-8 Solid Waste Rate and Service Study

Table 4-6 Comparison between County and Comparative Jurisdictions With Diversion Rates Above 50 Percent (in 2006)
County Mean versus Comparative Jurisdiction Means for Similar Rate Structure Jurisdictions for Residential Solid Waste Collection Rates
Per customer, per month (As of January 2008)
Solid Waste Rate and Service Study El Dorado County
Service Level 1, 32-Gallon Can 2, 32-Gallon Cans 1, 64-Gallon Cart 1, 96-Gallon Cart Description
County Jurisdictions County Jurisdictions County Jurisdictions County Jurisdictions
Mean $16.08 $16.39 $23.07 $20.79 $26.26 $24.97 $26.81 $30.16
Absolute Difference -$0.31 $2.28 $1.29 -$3.35
Percent Difference -1.89% 10.97% 5.17% -11.11%
Number of Rates 5 5 6 5 1 6 2 7
Outliers, such as the highest and lowest rates, might drive results different. Therefore, we excluded the highest and lowest comparative jurisdiction rates, and compared the County mean against mean of the rest of the comparative jurisdictions, for each of the four service levels, for residential services, in Table 4-5, above. Except for the 2, 32-gallon cans service level, results were similar to those in Table 4-4, which further confirmed our previous comparisons. County residential average rates were still below jurisdiction average rates for all four service levels.
Generally, County residential rates were below average compared to comparative jurisdictions that have met the 50 percent AB 939 diversion requirement, particularly for higher service level, such as 96-gallon cart. This is likely because many of these jurisdictions have significantly higher rates, especially for the larger cart sizes, to discourage customers from using these service levels. These jurisdictions are the examples using rate structure pricing incentives for customers to reduce refuse generation.
3. Similar Rate Structure Jurisdiction Comparisons
Perhaps a better rate comparison is provided in Table 4-6, above, where we compared County residential rates with the eight jurisdictions that have more tightly grouped rate structures, more like the rate structure the County has.
For this subset comparison, we compared the County mean with the similar rate structure jurisdiction means, for each of the four service levels. We found County residential average rates were above comparative jurisdiction average rates for the two service levels, and below jurisdiction average rates for the other two service levels, as follows:
For the 1, 32-gallon can service level, the County average rate was slightly below the average of similar rate structure comparative jurisdiction rates, by 1.89 percent, or $0.31
For the 2, 32-gallon cans service level, the County average rate was above the average of similar rate structure comparative jurisdiction rates, by 10.97 percent, or $2.28
4-9
4. Solid Waste Rate and Service Level Comparisons between the County and Jurisdictions Meeting AB 939 Diversion Levels
For the 1, 64-gallon cart service level, the County average rate was above the average of similar rate structure comparative jurisdiction rates, by 5.17 percent, or $1.29
For the 1, 96-gallon cart service level, the County average rate was well below the average of similar rate structure comparative jurisdiction rates, by 11.11 percent, or $3.35.
Even after we compared rate differences between the County and the comparative jurisdictions with more similar, tightly grouped rate structures, we still found County residential rates, for the 1, 32-gallon can, and 1, 96-gallon cart service level, were below average of comparative jurisdictions.
4. Comparisons between Each County Area and Surveyed Jurisdictions
In addition to our El Dorado County versus comparative jurisdiction level comparisons, we compared each County area residential solid waste collection rates with the comparative jurisdiction rates. In Table 4-7, on the next page, we compared County residential rates with the comparative jurisdiction means, for each County area. Among the nine areas, there were five areas with residential rates below the comparative jurisdiction average rates, across the offered can and cart service levels, including:
Amador Disposal Service
El Dorado Disposal Services, Cameron Park
American River Disposal Service
South Tahoe Refuse Company
Tahoe-Truckee Sierra Disposal.
For the collection areas served by El Dorado Disposal Services, the residential rates were below the comparative jurisdiction average rates for the cart service levels. For the can service levels, the results were mixed.
One consistency should be mentioned is that, for both 64- and 96-gallon cart service levels, all County company/area residential rates were well below the comparative jurisdiction average rates, ranging from 10 percent to 38 percent, which corresponds to what we found in the previous county level comparisons that the County average 64- and 96-gallon cart residential rates were substantially below the comparative jurisdiction rates.
C. Summary of Residential Rate and Service Level Comparisons
Generally, compared to the jurisdictions meeting the 50 percent AB 939 diversion requirement, County overall residential rates are below the comparative jurisdiction average rates. Even compared to the similar rate structure jurisdictions meeting the 50 percent AB 939 diversion requirement, overall County residential rates are still below the average rates for the 1, 32-gallon can, and 1, 96-gallon cart service levels.
More specifically, County residential rates are well below the comparative jurisdiction average rate, for both can and cart service levels, in most of County areas, served by five franchise companies, including follows:
Amador Disposal Service
El Dorado Disposal Services, Cameron Park
American River Disposal Service
South Tahoe Refuse Company
Tahoe-Truckee Disposal.
In the four collection areas served by El Dorado Disposal Services, residential rates are below the comparative jurisdiction average rates for the two cart service levels.
4-10 Solid Waste Rate and Service Study

Table 4-7 Comparison between County and Comparative Jurisdictions With Diversion Rates Above 50 Percent (in 2006) By Each Franchised Area of County
Area Rates versus Comparative Jurisdiction Means for Residential Solid Waste Collection Rates
Per customer, per month (As of January 2008)
Solid Waste Rate and Service Study El Dorado County
Service Level No. Company/Area
1, 32-Gallon Can 2, 32-Gallon Cans 1, 64-Gallon Cart 1, 96-Gallon Cart
1.0 Amador Disposal Service $14.13 $20.90 N/A $25.69
Absolute Difference -$5.11 -$2.92 N/A -$11.09
Percent Difference -26.57% -12.26% N/A -30.15%
2.0 El Dorado Disposal Services
2.1 – Cameron Park N/A N/A $22.44 $22.79
Absolute Difference N/A N/A -$6.83 -$13.99
Percent Difference N/A N/A -23.33% -38.03%
2.2 – City of Placerville $15.50 $24.46 N/A N/A
Absolute Difference -$3.74 $0.64 N/A N/A
Percent Difference -19.45% 2.69% N/A N/A
2.3 – El Dorado Hills $20.99 N/A $22.61 $31.68
Absolute Difference $1.75 N/A -$6.66 -$5.10
Percent Difference 9.08% N/A -22.75% -13.86%
2.4 – Unincorporated County Areas $18.20 $27.55 $26.26 $27.93
Absolute Difference -$1.04 $3.73 -$3.01 -$8.85
Percent Difference -5.42% 15.66% -10.28% -24.06%
3.0 American River Disposal Service $13.46 $18.09 N/A N/A
Absolute Difference -$5.78 -$5.73 N/A N/A
Percent Difference -30.05% -24.05% N/A N/A
4.0 Sierra Disposal Service $18.42 $26.31 N/A N/A
Absolute Difference -$0.82 $2.49 N/A N/A
Percent Difference -4.28% 10.46% N/A N/A
5.0 South Tahoe Refuse Company N/A $23.79 N/A N/A
Absolute Difference N/A -$0.03 N/A N/A
Percent Difference N/A -0.12% N/A N/A
6.0 Tahoe-Truckee Sierra Disposal $16.21 $21.76 N/A N/A
Absolute Difference -$3.03 -$2.06 N/A N/A
Percent Difference -15.76% -8.65% N/A N/A
Comparative Jurisdiction Mean $19.24 $23.82 $29.27 $36.78
4-11

4. Solid Waste Rate and Service Level Comparisons between the County and Jurisdictions Meeting AB 939 Diversion Levels
The County basically has a more tightly grouped rate structure, with relatively little price incentives built in the rate structures. Especially for cart service levels offered in the El Dorado Disposal Services service areas, rates do not increase linearly as service levels increase, so customers may select an inappropriate cart size for their refuse generation level.
In the area served by South Tahoe Refuse Company, for residential solid waste service, there is a fixed, flat rate structure ($23.79 for unlimited residential can service). This “all-you-care-to-dispose” service doesn’t provide a price incentive to reduce waste generation levels. In 2006, the City of South Lake Tahoe’s diversion level was 42, or 8 percent below the AB 939 minimum diversion requirement. The historical diversion levels of the City of South Lake Tahoe were also consistently low compared to the other areas in the County, and only exceeded the 50 percent AB 939 goal in 2004.
Solid waste disposal involves environmental costs associated with siting and operation of landfills. Recycling is one means of reducing these environmental costs. To encourage reducing refuse generation and increase recycling, and thus reduce materials deposited at landfills, shifting from fixed, or more tightly grouped prices to more linear, unit/volume-based prices for residential solid waste collection services, is one way to help increase diversion levels. Also it is important to consider a range of solid waste management options in addition to price incentives.
Employing some linear, systematic pricing rate structures, when coupled with other solid waste management tools, such as aggressive recycling programs, can help increase diversion levels. Some price incentive rate structures could be implemented in conjunction with new recycling programs (e.g., a cart-based curbside recycling system), waste reduction education campaigns, composting programs, and other diversion strategies to help divert waste from the disposal stream.
4-12 Solid Waste Rate and Service Study

Section 5 Solid Waste Franchise Fees
and Comparisons
5. Solid Waste Franchise Fees and Comparisons
This section describes County solid waste collection franchise fees, as identified in the County solid waste services franchise agreements. We obtained, from the County, these solid waste services franchise agreements, for each of the six franchise companies.
We surveyed franchise fees paid by comparative jurisdictions in California, as requested by County staff. We provided franchise fee information for two sets of comparative jurisdictions, including a set of fourteen (14) comparative jurisdictions, which were the same as those used in our solid waste rate and service level surveys; and a set of fifty (50) comparative jurisdictions, which were in our own database of franchise fees for California jurisdictions.
Based on our comparative franchise fee survey results, included in Exhibit 5-1 and Exhibit 5-2, we developed summary statistics for the surveyed comparative jurisdictions. We also provided franchise fee comparisons between the County and the comparative jurisdictions.
The remainder of this section is organized as follows: A. El Dorado County Current Franchise Fees B. Comparative Jurisdiction Franchise Fees C. Franchise Fee Comparisons.
A. El Dorado County Franchise Fees Franchise fees are paid by solid waste franchise companies to the county or city governing
the areas they serve. The franchise fee requirement is typically identified in a franchise agreement that a jurisdiction entered into with its solid waste collection company.
Franchise fees are usually expressed as a percentage of the gross revenues earned by the hauling company providing solid waste services, including collecting, transporting, handling, and disposing of solid waste generated in the franchise area, though franchise fees also may be a fixed dollar amount in some cases. A few jurisdictions assess a franchise fee tied to the diversion levels of its haulers, in order to encourage franchise holders to increase their diversion levels.
The County has awarded exclusive franchise agreements to six (6) franchise cwhich are assigned specific geographic territories within the County. The County franchise agreements, with its six franchise companies, specify that the County can establish an amount equal to “a percentage of the gross revenues derived by Grantee from operations pursuant to this Franchise Agreement.”
ompanies,
1 The County currently requires
1 Source: El Dorado County Solid Waste Services Franchise Agreements.

5. Solid Waste Franchise Fees and Comparisons
Table 5-1 El Dorado County Franchise Fee Summary For Six Solid Waste Collection Franchise Companies
(As of January 2008)
Solid Waste Rate and Service Study El Dorado County
Company Franchise Area Franchise Fee (Percent of Gross Revenues)
Waste Connections of California
Amador Disposal Service West Slope 5.00%
El Dorado Disposal Services
– El Dorado County West Slope 5.00%
– City of Placerville West Slope 5.00%
– El Dorado Hills Community Services District West Slope 5.00%
South Tahoe Refuse Company
American River Disposal Service East Slope 5.00%
Sierra Disposal Service West Slope 5.00%
South Tahoe Refuse Company East Slope 5.00%
Tahoe-Truckee Sierra Disposal Company
Tahoe-Truckee Sierra Disposal East Slope 5.00%
Mean 5.00%
Number of Rates 8
Median 5.00%
Source: El Dorado County Solid Waste Services Franchise Agreements.
its franchise companies to remit franchise fees for five (5) percent of gross revenues (same for all six franchisees), as identified in the County solid waste services franchise agreements – “The Franchise Fee is initially set at five percent (5%) of Contractor’s Gross Revenues, and from time to time may be adjusted by Resolution of the Board of Supervisors.”1
County franchise fee requirements are summarized in Table 5-1, above. These franchise fees are paid quarterly to the County within forty-five (45) days following the end of each quarter. The County uses these funds to help develop solid waste management programs and comply with State waste reduction requirements.
The County mean franchise fee is five (5) percent of its franchisees’ gross revenues. The County median franchise fee is also five (5) percent of its franchisees’ gross revenues. Since franchise fees are exactly the same for all County’s franchisees, County minimum and maximum franchise fees are both five (5) percent, with no difference between them.
B. Comparative Jurisdiction Franchise Fees
We surveyed a set of fourteen (14) comparative jurisdictions for their solid waste collection franchise fee levels, between December 2007 and January
5-2 Solid Waste Rate and Service Study

2008. These fourteen jurisdictions are the same ones we surveyed for our comparable rates and service levels in Section 3. We also provided franchise fee information for an additional set of fifty (50) comparative jurisdictions. Most of the 50 jurisdictions are cities or towns, and a few are counties. The 50 jurisdiction information was contained in our own database of franchise fee information for California jurisdictions. Exhibit 5-1 and Exhibit 5-2, starting on the next page, provide our comparative jurisdiction franchise fee survey results.
In some comparative counties, there are more than one solid waste franchise agreement with different franchise fee requirements. For example, in Nevada County, the franchise fee for Waste Management is five (5) percent, and the franchise fee for other haulers is four (4) percent. In Placer County, the franchise fee for Tahoe Truckee is eight (8) percent, and the franchise fee in the Western area is five (5) percent. Monterey County also has two franchise agreements for the County’s unincorporated areas, both requiring ten (10) percent.
In our comparative jurisdiction franchise fee surveys, most of the comparative jurisdictions have a franchise fee based on a certain percentage of hauler’s gross revenues. However, Calaveras County has a $200.00 per vehicle permit fee, and a $50.00 per backup vehicle permit fee.
In some jurisdictions, franchise fees are only applied to specific services. For example, the City of Elk Grove requires a floating franchise fee (8 percent to 35 percent), based on haulers’ diversion levels, for commercial services. The City of Folsom requires an eight (8) percent franchise fee for construction and demolition waste services.
For the fourteen comparative jurisdictions, comparative jurisdiction franchise fees ranged from 1.50 percent to 23.00 percent. The comparative (14) jurisdiction mean franchise fee was 6.94 percent, and the comparative (14) jurisdiction median franchise fee was 5.00 percent.
Among the surveyed comparative jurisdictions, Tuolumne County had the lowest franchise fee of 1.50 percent, and Shasta County had the highest franchise fee of 23.00 percent. After eliminating the lowest and highest franchise fees, the comparative (14) jurisdiction mean franchise fee was 6.18 percent.
For the fifty comparative jurisdictions, comparative jurisdiction franchise fees ranged from 4.00 percent to 16.00 percent. The comparative (50) jurisdiction mean franchise fee was 9.61 percent, and the comparative (50) jurisdiction median franchise fee was 10.00 percent.
Among the surveyed comparative jurisdictions, the City of San Mateo had the lowest franchise fee of 4.00 percent, and both the City of Pasadena and the City of Pleasant Hill had the highest franchise fee of 16.00 percent. After eliminating the lowest and highest franchise fees, the comparative (50) jurisdiction mean franchise fee was 9.45 percent.
Summary statistics, for El Dorado County, the fourteen comparative jurisdictions, and the fifty comparative jurisdictions, are summarized in Table 5-2, on page 5-7. Generally, El Dorado County assessed lower franchise fees than the other comparative jurisdictions. The El Dorado County median franchise fee is the same as the fourteen comparative jurisdiction median, but it is only one-half of the fifty comparative jurisdiction median.
5-3

5. Solid Waste Franchise Fees and Comparisons
Exhibit 5-1 Franchise Fees for Fourteen (14) Comparative Jurisdictions
(As of January 2008)
Solid Waste Rate and Service Study El Dorado County
Number Jurisdiction Franchise Fee (Percent of Gross Revenues)
1 Amador County 2.00%
2 Butte Countya 2.00%
3 Calaveras Countyb Varies
4 Merced County 7.50%
5 Monterey Countyc
Western Franchise Agreement 10.00%
Northeastern Franchise Agreement 10.00%
6 Nevada County
Waste Management 5.00%
Other Haulers 4.00%
7 Placer County
Tahoe Truckee 8.00%
Western Area 5.00%
8 San Luis Obispo County 10.00%
9 Shasta County 23.00%
10 Stanislaus County 8.00%
11 Sutter County 5.00%
12 Tuolumne County 1.50%
13 Yuba County 5.00%
14 Town of Truckee 5.00%
Mean 6.94%
Number of Rates 16
Median 5.00%
Minimum 1.50%
Maximum 23.00%
Mean without Highest and Lowest Rates 6.18%
Number of Rates 14
Notes: a The franchise fee is only applied to the revenue generated in the City of Chico area.
b The permit fee is collected at a fee of $200.00 per vehicle, and a fee of $50.00 per backup vehicle.
c There are two solid waste franchise agreements for the County's unincorporated areas.
5-4 Solid Waste Rate and Service Study

Exhibit 5-2 Franchise Fees for Fifty (50) Comparative Jurisdictions
(As of January 2008)
Solid Waste Rate and Service Study El Dorado County Page 1 of 2
Number Jurisdiction Franchise Fee (Percent of Gross Revenues) Effective Year
1 City of San Mateo 4.0% 2007
2 City of Lodi 4.8% 2007
3 Unincorporated Contra Costa County (Allied, RSS) 5.0% 2007
4 Unincorporated areas served by CCCSWA (Allied) 5.0% 2007
5 City of Clayton 5.0% 2007
6 City of Pittsburg 5.0% 2006
7 City of Concord 5.3% 2007
8 City of Piedmont 5.5% 2007
9 City of Menlo Park 5.8% 2007
10 City of Danville 6.0% 2007
11 City of Citrus Heights 7.0% 2007
12 Town of Paradise 7.0% 2007
13 City of Red Bluff 7.0% 2007
14 City of Elk Grove a 8.0% 2007
15 City of Folsom b 8.0% 2006
16 City of Tracy 8.5% 2007
17 City of Lancaster 8.1% 2007
18 Town of Atherton 10.0% 2005
19 City of Oakland 10.0% 2006
20 City of Martinez 10.0% 2005
21 City of Moraga 10.0% 2007
22 City of Walnut Creek 10.0% 2007
23 City of Lafayette 10.0% 2007
24 City of Alameda 10.0% 2005
25 City of Albany 10.0% 2005
26 City of Fremont 10.0% 2005
27 City of Livermore 10.0% 2005
28 City of Los Altos 10.0% 2003
29 City of San Leandro 10.0% 2005
30 City of San Ramon 10.0% 2006
31 City of San Luis Obispo 10.0% 2007
32 Town of San Anselmo 10.0% 2006
33 County of Los Angeles 10.0% 2006
5-5

5. Solid Waste Franchise Fees and Comparisons
Exhibit 5-2 Franchise Fees for Fifty (50) Comparative Jurisdictions
(As of January 2008)
Solid Waste Rate and Service Study El Dorado County (continued) Page 2 of 2
Number Jurisdiction Franchise Fee (Percent of Gross Revenues) Effective Year
34 City of Poway 10.0% 2006
35 City of Los Angeles 10.0% 2003
36 City of West Hollywood 10.0% 2002
37 City of Vallejo 11.0% 2008
38 City of Salinas 12.0% 2004
39 City of Milpitas 12.0% 2007
40 City of Antioch 12.0% 2007
41 City of Costa Mesa 12.0% 2006
42 City of Orinda 12.2% 2007
43 City of Hayward 12.5% 2005
44 County of Santa Clara 12.5% 2008
45 City of Redwood City 13.0% 2007
46 City of Dublin 13.6% 2005
47 City of Sausalito 15.0% 2006
48 City of Margan Hill 15.5% 2005
49 City of Pasadena 16.0% 2006
50 City of Pleasant Hill 16.0% 2007
Mean 9.61%
Number of Rates 50
Median 10.00%
Minimum 4.00%
Maximum 16.00%
Mean without Highest and Lowest Rates 9.45%
Number of Rates 47 a The City has a floating franchise fee (8% ~ 35%) based on haulers' diversion rates. This franchise fee requirement is only applied to commercial services. b Only for construction and demolition waste services, the City has a 8.00 percent permit fee quarterly, plus a penalty fee if the recycling rates are
less than 50 percent.
5-6 Solid Waste Rate and Service Study
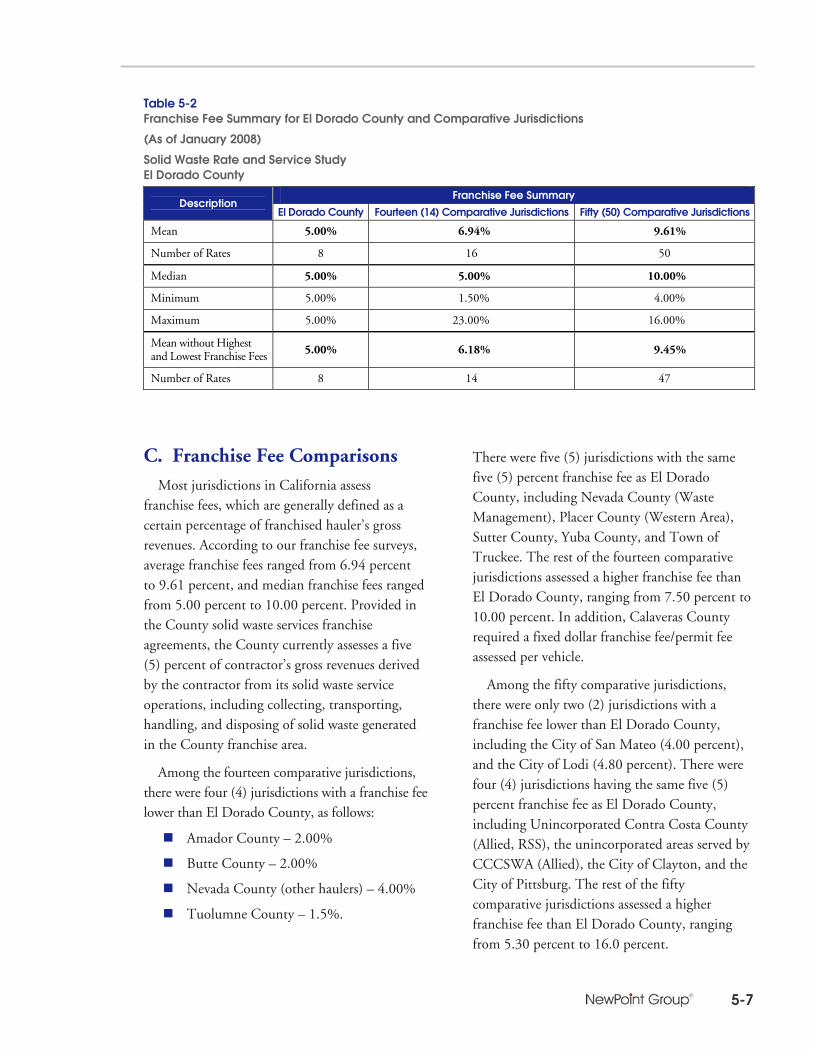
Table 5-2 Franchise Fee Summary for El Dorado County and Comparative Jurisdictions
(As of January 2008)
Solid Waste Rate and Service Study El Dorado County
Franchise Fee Summary Description
El Dorado County Fourteen (14) Comparative Jurisdictions Fifty (50) Comparative Jurisdictions
Mean 5.00% 6.94% 9.61%
Number of Rates 8 16 50
Median 5.00% 5.00% 10.00%
Minimum 5.00% 1.50% 4.00%
Maximum 5.00% 23.00% 16.00%
Mean without Highest and Lowest Franchise Fees 5.00% 6.18% 9.45%
Number of Rates 8 14 47
C. Franchise Fee Comparisons Most jurisdictions in California assess
franchise fees, which are generally defined as a certain percentage of franchised hauler’s gross revenues. According to our franchise fee surveys, average franchise fees ranged from 6.94 percent to 9.61 percent, and median franchise fees ranged from 5.00 percent to 10.00 percent. Provided in the County solid waste services franchise agreements, the County currently assesses a five (5) percent of contractor’s gross revenues derived by the contractor from its solid waste service operations, including collecting, transporting, handling, and disposing of solid waste generated in the County franchise area.
Among the fourteen comparative jurisdictions, there were four (4) jurisdictions with a franchise fee lower than El Dorado County, as follows:
Amador County – 2.00%
Butte County – 2.00%
Nevada County (other haulers) – 4.00%
Tuolumne County – 1.5%.
There were five (5) jurisdictions with the same five (5) percent franchise fee as El Dorado County, including Nevada County (Waste Management), Placer County (Western Area), Sutter County, Yuba County, and Town of Truckee. The rest of the fourteen comparative jurisdictions assessed a higher franchise fee than El Dorado County, ranging from 7.50 percent to 10.00 percent. In addition, Calaveras County required a fixed dollar franchise fee/permit fee assessed per vehicle.
Among the fifty comparative jurisdictions, there were only two (2) jurisdictions with a franchise fee lower than El Dorado County, including the City of San Mateo (4.00 percent), and the City of Lodi (4.80 percent). There were four (4) jurisdictions having the same five (5) percent franchise fee as El Dorado County, including Unincorporated Contra Costa County (Allied, RSS), the unincorporated areas served by CCCSWA (Allied), the City of Clayton, and the City of Pittsburg. The rest of the fifty comparative jurisdictions assessed a higher franchise fee than El Dorado County, ranging from 5.30 percent to 16.0 percent.
5-7

5. Solid Waste Franchise Fees and Comparisons
Table 5-3 Comparison between County and Surveyed Jurisdictions, for County Mean versus Comparative Jurisdiction Means, for Franchise Fees
(As of January 2008)
Solid Waste Rate and Service Study El Dorado County
Comparison 1 Comparison 2 Description
County Fourteen (14) Jurisdictions County Fifty (50) Jurisdictions
Mean 5.00% 6.94% 5.00% 9.61%
Absolute Difference -1.94% -4.61%
Percent Difference -27.95% -47.97%
Number of Rates 8 16 8 50
Table 5-4 Comparison between County and Surveyed Jurisdictions, for County Mean versus Comparative Jurisdiction Means, (Without Highest and Lowest Rates) for Franchise Fees
(As of January 2008)
Solid Waste Rate and Service Study El Dorado County
Comparison 1 Comparison 2 Description
County Fourteen (14) Jurisdictions County Fifty (50) Jurisdictions
Mean 5.00% 6.18% 5.00% 9.45%
Absolute Difference -1.18% -4.45%
Percent Difference -19.09% -47.09%
Number of Rates 8 14 8 47
In Table 5-3 and Table 5-4, above, we compare franchise fees between the County and the comparative jurisdictions, for County mean versus comparative jurisdiction means. Each comparison included two sub-comparisons: one was the comparison between the County and the fourteen comparative jurisdictions, which were used in our solid waste rate and service level comparisons; the other who the comparison between the County and the fifty comparative jurisdictions.
In Table 5-3, we compared the County mean with the comparative jurisdiction means, for franchise fees. County franchise fees were well
below comparative jurisdiction average fees for both sub-comparisons, as follows:
In comparison to the fourteen comparative jurisdictions, the County average franchise fee was substantially below the average of comparative jurisdiction fees, by 27.95 percent, or by 1.94 percentage points
In comparison to the fifty comparative jurisdictions, the County average franchise fee was dramatically below the average of comparative jurisdiction fees, by 47.97 percent (nearly only half of the comparative jurisdiction average), or by 4.61 percentage points.
5-8 Solid Waste Rate and Service Study

In Table 5-4, we compared the County mean with the comparative jurisdiction means, without the highest and lowest franchise fees. County franchise fees were still well below comparative jurisdiction average fees for both sub-comparisons. Compared to the comparative jurisdictions, the County average franchise fee was substantially below the average of comparative jurisdiction fees, by 19.09 percent, and 47.09 percent, respectively, for the fourteen comparative jurisdictions, and the fifty comparative jurisdictions. After eliminating these low and high fees, which might drive different results, the County average franchise fee was still well below comparative jurisdiction averages, which further confirmed our previous findings.
The County assesses a five (5) percent franchise fee on its franchisees’ solid waste operations pursuant the County solid waste services franchise agreements, and it is the same for each of the six franchise companies. In comparison to the comparative jurisdictions we surveyed, the County requires its franchise companies to remit a lower than average franchise fee at five percent of gross revenues.
The County’s relatively low franchise fees help keep their residential refuse rates comparable. On the other hand, the County has latitude to raise their franchise fees in the future to help fund County solid waste improvements.
5-9

5. Solid Waste Franchise Fees and Comparisons
[This page intentionally left blank.]
5-10 Solid Waste Rate and Service Study

Section 6 Solid Waste Services Profitability Level
and Waste Management Industry Standard Comparisons Between the
County and Selected Jurisdictions

6. Solid Waste Services Profitability Level and Waste Management Industry Standard Comparisons Between the County and Selected Jurisdictions
This section details our analyses for both regional (Northern California) solid waste services profitability levels and waste management industry standards (Nation-wide). For regional solid waste services profitability level analyses, we described both County profitability levels for the companies serving County areas, and the comparative jurisdiction profitability levels. We surveyed a total of twenty-two (22) comparative jurisdictions. Fourteen of these twenty-two jurisdictions are the same as those used in our solid waste rate and service level comparisons in Section 3. We also provide profitability levels for some additional jurisdictions.
For waste management industry standards, we collected waste management company profitability data. We provide both publicly held waste management company and privately held waste management company return data.
The County has changed its rate setting methods over time such that for some areas it does not specifically provide an operating ratio (OR) to its franchised hauler. Therefore, we present profitability data in this chapter for information purposes only and without comparing these data to returns for County franchised haulers.
The remainder of this section is organized as follows: A. Regional Solid Waste Services Profitability Levels B. Waste Management Industry Profitability Standards C. Overview of Industry Productivity and Efficiency Standards D. Discussion of El Dorado County Collection Company Operating Efficiencies.
A. Regional Solid Waste Services Profitability Levels The most common method that California jurisdictions use to determine franchise
waste management company profitability is the operating ratio method. A jurisdiction typically provides its solid waste franchised hauler with an operating ratio return on allowable operating costs. This operating ratio method is most commonly used for the waste management industry, which requires a large percentage of revenues to maintain collection, recycling, and disposal operations. The operating ratio is defined as:

6. Solid Waste Services Profitability Level and Waste Management Industry Standard Comparisons Between the County and Selected Jurisdictions
Operating ratio (OR) = Allowable costs /
(Allowable costs + Allowable profits).
This ratio shows the efficiency of a company’s management by comparing operating expenses to net sales. A smaller operating ratio represents a higher profitability level allowed for a company. An OR of 90 percent equals a profit of eleven (11) percent on allowable costs. An OR less than 90 percent equals a profit rate of more than eleven percent. Conversely, an OR more than 90 percent equals a profit rate of less than eleven percent.
Though rare, some jurisdictions also use other return methods, such as return on equity, return on assets, or weighted-average cost of capital. In addition, some jurisdictions don’t specifically regulate the profitability levels of their franchised haulers.
These different return methods present different indicators of profitability for a company, and use industry norms and key business ratios. The operating ratio return on allowable operating costs measures a company’s efficiency of operation. It reveals the operating cost spent per dollar of sales. Return on equity measures a company’s efficiency at generating profits from the capital invested by the shareholders. Return on assets measures a company’s efficiency at generating profits from its total assets. Weighted average cost of capital presents the minimum return that a company must earn using existing assets.
1. Historical El Dorado County Operating Ratios
The County has historically employed an operating ratio return on allowable operating costs method, which allows a regulated profit margin on solid waste collection, recycling, and transfer station operations for its franchise companies. The former County Solid Waste Rate Setting Policies and Procedures Manual for West
Slope Areas specified that “for collection operations, the initial target OR was set at 90 percent,” and “for the transfer station/MRF operations they were established as a sliding –scale regulated margin (percentage of operating costs), ranging from 0 percent to 20 percent (equal to an OR range of 100 percent to 80 percent, respectively), depending upon recycling recovery results.”
The County Solid Waste Rate Setting Policies and Procedures Manual for East Slope Areas specifies “a sliding-scale Operating Ratio (OR) of 87 percent to 94.3 percent depending upon recycling recovery results” for collection and recycling, transfer station operations.
In Table 6-1, on the next page, we provide historical El Dorado County operating ratios for El Dorado Disposal Services, Western El Dorado Recovery Systems, and South Tahoe Refuse Company. We do not know the operating ratios for the rest of the companies.
El Dorado Disposal Services had a 90 percent allowable operating ratio, while South Tahoe Refuse Company has an incentive-based, sliding-scale allowable operating ratio, which ties the profitability levels to the diversion outcomes. In addition, the allowable operating ratio for Western El Dorado Recovery Systems MRF was also an incentive-based, sliding-scale ratio depending on the Company’s recycling recovery results.
2. Comparative Jurisdiction Operating Ratios
We surveyed a total of twenty-two (22) comparative jurisdictions for their profitability levels, between December 2007, and January 2008. Fourteen (14) of the jurisdictions are the same as those used in our comparative jurisdiction rate and service level surveys in Section 3. We also provide profitability levels for some additional northern California cities, such as the City of Vallejo, the
6-2 Solid Waste Rate and Service Study

Table 6-1 Historical El Dorado County Operating Ratios
Solid Waste Rate and Service Study El Dorado County
Company Franchised Area Operating Ratio
Waste Connections of California
Amador Disposal Service West Slope N/A a
El Dorado Disposal Services West Slope 90.00% 1
Western El Dorado Recovery Systems West Slope 80.00% to 100.00% b, 1
South Tahoe Refuse Company
American River Disposal Service East Slope N/A a
Sierra Disposal Service West Slope N/A a
South Tahoe Refuse Company East Slope 87.00% to 94.30% c, 2
Tahoe-Truckee Sierra Disposal Company
Tahoe-Truckee Sierra Disposal East Slope N/A d
a The franchise agreement specifies that the County provide ADS with a reasonable financial return.
b The Operating Ratio depends on the diversion levels of the Company, and ranges from 80 to 100 percent.
c The Operating Ratio depends on the diversion levels of the Company, and ranges from 87.00 to 94.30 percent.
d The franchise agreement specifies that a profit is allowed determined by the OR method, and the exact OR is determined by the Board.
N/A: not available.
Source:
1 Former El Dorado County Solid Waste Rate Setting Policies and Procedures Manual for West Slope Areas.
2 El Dorado County Solid Waste Rate Setting Policies and Procedures Manual for East Slope Areas.
City of Concord, the City of Martinez, the City of Vacaville, etc. Profitability levels of these neighboring comparative jurisdictions outside the County provide our regional profitability levels for solid waste franchise companies.
Table 6-2, on the next page, shows our comparative jurisdiction profitability level survey results. Of the total twenty-two surveyed jurisdictions, there were twelve (12) jurisdictions using an operating ratio; and there were seven (7) jurisdictions not specifically regulating profitability levels. Profitability information was not available for the rest of the three (3) jurisdictions.
All operating ratios are provided on an earnings before interest and tax (EBIT) basis, except for Amador County (on an earnings before tax (EBT) basis). Most comparative jurisdictions allow profits
on interest. In contrast, interest expenses are not allowed for profit considerations in the County, for both West Slope Areas and East Slope Areas. We find that interest is an important allowable cost consideration because interest is large for heavily leveraged companies or those that have financed recent capital investments with debt.
Some of the operating ratios represent the midpoint of a targeted OR range. For example, for Amador County, the OR represents the midpoint of a targeted OR range of 85 to 90 percent. For Contra Costa County, the OR represents the midpoint of a targeted OR range of 88 to 92 percent. For the City of Concord, the OR represents the midpoint of a targeted OR range of 88 to 92 percent. These jurisdictions allow their franchise companies a range of profitability to encourage operating efficiencies.
6-3

6. Solid Waste Services Profitability Level and Waste Management Industry Standard Comparisons Between the County and Selected Jurisdictions
Table 6-2 Comparative Jurisdiction Operating Ratios
(As of January 2008)
Solid Waste Rate and Service Study El Dorado County
No. Jurisdiction Operating Ratio*
1 Amador Countya 87.50%
2 Napa Countyb 89.00%
3 Contra Costa Countyc 90.00%
4 Stanislaus County 90.00%
5 Sutter County 90.00%
6 Tuolumne County 90.00%
7 Yuba County 90.00%
8 San Luis Obispo Countyd 91.00%
9 City of Vallejo 90.00%
10 City of Concordc 90.00%
11 City of Martinez 90.00%
12 City of Vacaville 90.00%
13 Butte County Not specifically regulated
14 Calaveras County Not specifically regulated
15 Merced County Not specifically regulated
16 Nevada County Not specifically regulated
17 Placer County Not specifically regulated
18 City of Elk Grove Not specifically regulated
19 City of Folsom Not specifically regulated
20 Shasta County N/A
21 Monterey County N/A
22 Town of Truckee N/A
Mean 89.79%
Number of Rates 12
Median 90.00%
Minimum 87.50%
Maximum 91.00%
Difference Between Minimum and Maximum 3.50%
Notes: * All ORs are provided on an earnings before interest and tax
(EBIT) basis, except for Amador County.
a The OR represents the midpoint of a targeted OR range of 85 to 90 percent.
b Data as of 2006.
c The OR represents the midpoint of a targeted OR range of 88 to 92 percent.
d There are multiple franchise agreements. The OR depends on the franchise agreement term, the longer the term, the higher the OR, and the shorter the term, the lower the OR. The OR represents the midpoint of a targeted OR range of 90 to 92 percent.
N/A: not available.
In addition, San Luis Obispo County has multiple franchise agreements. The OR depends on the franchise agreement term. The longer the term, the higher the operating ratio; and the shorter the term, the lower the operating ratio. These operating ratios range from 90 percent to 92 percent.
For the surveyed comparative jurisdictions, operating ratios ranged from 87.50 percent to 91.00 percent. Comparative jurisdiction mean operating ratio was 89.79 percent, and comparative jurisdiction median operating ratio was 90.00 percent. Among the surveyed jurisdictions, Amador County allows the lowest operating ratio at 87.50 percent; and San Luis Obispo County allows the highest operating ratio at 91.00 percent.
B. Waste Management Industry Profitability Standards
For waste management industry profitability standards, we drew on our database of returns for publicly held and privately held companies. Sources for this database include company 10-k reports, data from companies that assemble and consolidate private company tax return results, and information from our work for other jurisdictions. We have compiled over ten years of this historical benchmarking data. The historical industry standard operating ratio return is 90 percent.
We compared recent OR data available for publicly and privately held waste management companies. Because available financial data are for combined collection, transportation, and disposal operations, the corresponding operating ratios are lower than businesses providing exclusively waste collection services (i.e., without disposal). Operating ratios for collection operations alone are generally higher than for disposal operations alone because disposal companies require greater profitability returns due to the significant environmental and regulatory risks of operating landfills.
6-4 Solid Waste Rate and Service Study

Table 6-3 Publicly Held Waste Management Companies Operating Ratiosa (1997 to 2007)
Solid Waste Rate and Service Study El Dorado County
Year Weighted-Average
Operating Ratio Average
Operating Ratio
1997 94.96% 88.00%
1998 94.68% 89.87%
1999 93.02% 87.47%
2000 86.24% 83.30%
2001 86.23% 84.96%
2002 82.15% 82.47%
2003 84.66% 84.88%
2004 85.60% 88.75%
2005 85.83% 85.84%
2006 84.63% 85.84%
2007 83.49% 85.87%
Mean 87.41% 86.11%
Median 85.83% 85.84%
Minimum 82.15% 82.47%
Maximum 94.96% 89.87% a On an earnings before interest and tax (EBIT) basis. Source: Published company 10-k reports.
1. Publicly Held Waste Management Company Operating Ratios
We reviewed financial information for nine (9) large publicly held waste management companies between 1997 and 2007. The nine companies included:
1. Allied Waste Industries 2. Browning Ferris Industries 3. Casella Waste Systems 4. Republic Services 5. Superior 6. Waste Connections 7. Waste Management 8. Waste Industries 9. WCA Waste Corp.
These panel data are from published company 10-k reports. The data set contains financial information on the nine companies observed over a eleven year period.
There were actually eighteen (18) publicly held waste management companies between 1993 and 2000. There has been significant recent acquisition and merger activity in the waste management industry, so some of these companies are now part of other companies. As an example, Waste Management acquired USA Waste, Philip, and Sanifill. Likewise, Allied Waste Industries acquired Laidlaw, and Browning Ferris Industries. We believe however that using historic data for all of these companies represents the best available information for publicly held companies for the period of 1997 to 2007.
Table 6-3, left, summarizes weighted average operating ratios and average operating ratios, both on an earnings before interest and tax (EBIT) basis, for publicly held waste management companies, from 1997 to 2007. The mean weighted average operating ratio, between 1997 and 2007, was 87.41 percent, while the mean average operating ratio during the same period was 86.11 percent. The median weighted average operating ratio, between 1997 and 2007, was 85.83 percent, and the median average operating ratio during the same period was 85.84 percent.
Similarly, Figure 6-1 and Figure 6-2, on the next page, graphically show historic eleven-year operating ratio trends for publicly held waste management companies. During this eleven-year period, there was a downward trend for the weighted-average operating ratio, while the trend for the average operating ratio was inconsistent. However the overall trend of the operating ratio for publicly held companies was below the targeted 90 percent OR.
6-5

6. Solid Waste Services Profitability Level and Waste Management Industry Standard Comparisons Between the County and Selected Jurisdictions
Figure 6-1 Publicly Held Waste Management Companies Weighted-Average Operating Ratioa (1997 to 2007)
Solid Waste Rate and Service Study El Dorado County
a On an earnings before interest and tax (EBIT) basis. Source: Published company 10-k reports.
Figure 6-2 Publicly Held Waste Management Companies Average Operating Ratioa (1997 to 2007)
Solid Waste Rate and Service Study El Dorado County
a On an earnings before interest and tax (EBIT) basis. Source: Published company 10-k reports.
6-6 Solid Waste Rate and Service Study

Table 6-4 Privately Held Waste Management Companies Operating Ratios a (2001 to 2007)
Solid Waste Rate and Service Study El Dorado County
Weighted Average Operating Ratio Year Total Number of Companies
$1 to $3M $3 to $5M $5 to $10M $10 to $25M
2001 to 2002 162 96.70% 91.10% 94.10% 92.00%
2002 to 2003 66 95.90% 97.00% 97.70% 88.80%
2003 to 2004 94 96.70% 96.20% 97.70% 94.70%
2004 to 2005 96 95.20% 96.20% 95.40% 90.30%
2005 to 2006 109 92.70% 94.20% 94.20% 96.30%
2006 to 2007 142 92.70% 97.20% 94.70% 93.80%
Operating Ratio Mean 94.65%
Operating Ratio Median 94.95%
Operating Ratio Range 88.80% to 97.70% a For SIC Code 4953, Refuse Systems, on an earnings before interest and tax (EBIT) basis.
Source: Robert Morris & Associates Annual Statement Studies.
2. Privately Held Waste Management Company Operating Ratios
We reviewed industry data published by Robert Morris & Associates (RMA). RMA publishes its “Annual Statement Studies” for an array of industries, including privately held waste management companies. RMA data are for companies doing business as refuse systems (SIC Code 4953). These are systems “primarily engaged in the collection and disposal of refuse by processing or destruction or in the operation of incinerators, waste treatment plants, landfills, or other sites for disposal of such materials.” These data “do not include companies primarily engaged in collecting and transporting refuse without disposal.”
As shown in Table 6-4, on page 6-8, the weighted-average operating ratios, on an EBIT basis, of over 66 companies surveyed in each of the six years from 2001 to 2007, ranged from 88.80 to 97.70 percent. The data were sorted by company sales, as follows:
$1 million to $3 million
$3 million to $5 million
$5 million to $10 million
$10 million to $25 million.
The mean operating ratio, between 2001 and 2007, was 94.65 percent, and the median operating ratio during the same period was 94.95 percent.
Figure 6-3, on the next page, graphically illustrates historic six-year period operating ratios for privately held waste management companies. The operating ratios varied by company size, and also varied by year. The historic operating ratio trend was not obvious. However the overall operating ratio for privately held companies was above the targeted 90 percent. Combined with publicly held waste management company operating ratio, the industry operating ratio return is approximately 90 percent.
6-7

6. Solid Waste Services Profitability Level and Waste Management Industry Standard Comparisons Between the County and Selected Jurisdictions
Figure 6-3 Privately Held Waste Management Companies Weighted Average Operating Ratioa (2001 to 2007)
Solid Waste Rate and Service Study El Dorado County
a On an earnings before interest and tax (EBIT) basis. Source: Robert Morris & Associates Annual Statement Studies.
C. Overview of Industry Productivity and Efficiency Standards
Productivity and efficiency data for the waste management industry is highly varied and depends on the characteristics of each waste management system. In this section we discuss industry norms for various productivity and efficiency measures. Based on our site visits, interviews of company management, and assessment of data provided by the six (6) companies, we also provide a general assessment of the relative productivity and efficiencies of each company. The remainder of this section is organized as follows:
1. Collection Measures 2. Customer Service Measures 3. Direct Labor Measures 4. Vehicle Measures 5. Cost Measures 6. Other Measures.
1. Collection Measures
Collection productivity is often measured based on the number of households picked up per day. For a typical “automated” route, the number of households picked up, per day, ranges from 700 up to as much as 1,500. Automated routes generally require a one-person crew. Automated trucks include an articulated arm that the driver uses to pick up the cart.
Automated routes have application in more urban areas with wide two-way streets, and limited overhanging trees. Automated routes are most often used in conjunction with a cart-based system.
For a “manual” route, the number of households picked up per day is significantly less than for an automated route, or between 200 and 450 per day. Typically, two, and sometimes three driver/helpers service a manual route.
In many cases, a company will install a tipper on the truck to minimize manual lifting of containers
6-8 Solid Waste Rate and Service Study

(called semi-automated service). This improves collection efficiencies and minimizes worker injuries.
2. Customer Service Measures
Table 6-5, right, summarizes how refuse collection services were rated by fourteen jurisdictions. Many jurisdictions rate refuse collection surveys highly. On average, 90 percent of residents surveyed rated refuse collection services as satisfactory, or better.
By franchise agreement, the County can require that its haulers conduct a customer satisfaction survey. The County has not recently conducted a customer satisfaction survey for refuse collection services.
Typical complaint levels are measured by the number of complaints per customer, per year (either 100, 1,000, or 10,000 customer). These complaint levels average between 2 and 10 percent of the total number of customers, per year. Rather than specific count of complaints, what may be a more important measure is the time required to resolve a complaint.
3. Direct Labor Measures
Waste management industry wage rates are generally as follows:
Driver - $15 to $27 per hour
Helper - $12 to $15 per hour
Sorter - $8 to $14 per hour.
Wages are usually higher for union workers than for non-union workers. Employee overtime generally ranges between 5 and 10 percent of total wages.
4. Vehicle Measures
Collection trucks generally have between 20 and 40 cubic yards of capacity, and carry between 6 and 12 tons of compacted material. The total number of collection vehicles required for a
Table 6-5 Recent Comparative Customer Satisfaction Survey Results For Selected California Jurisdictions
Jurisdiction Rating of Refuse
Collection Services
1. City of Berkeley 77 percent rated favorably
2. City of Burbank In top two services rated
3. City of Carlsbad 89 percent rated as excellent or good
4. City of Claremont 92 percent satisfaction
5. City of Concord 2008: 87 percent satisfaction (highest rated City service)
6. City of Monterey 93 percent rated as average or better
7. City of Newport Beach 2008: 92 percent rated refuse collection very satisfied or satisfied
8. City of Palo Alto 2003: 94 percent rated as excellent or good
9. City of Sacramento Among the top three highest rated services
10. City of San Diego 2002: 96 percent satisfaction rating for residential trash, 94 percent for curbside recycling
11. City of Santa Monica 78 percent rated as excellent or good
12. City of Sunnyvale 97 percent rated as average or better, 88 percent above average
13. City of San Jose 96 percent satisfaction level with garbage and recycling
14. City of Temecula Among top three of ten services rated
Average of eleven (11) cities with numeric rating of satisfactory or better
90.01
jurisdiction generally are a function of the total number of customers, and the number of customers a truck can serve per day. New automated trucks cost up to $275,000 per truck.
1 Based on the most current data available for each City. As shown
in Table 6-5, customer satisfaction ratings were not uniform. Some cities rate customer satisfaction using “average and above” data and others rate customer satisfaction using “good and above” data.
6-9

6. Solid Waste Services Profitability Level and Waste Management Industry Standard Comparisons Between the County and Selected Jurisdictions
Vehicle fleet age varies depending on the company maintenance capabilities and practices. For collection truck fleets that are heavily used, a seven to ten-year replacement cycle is common, with frontloader and sideloader trucks replaced earlier than roll off trucks and rear loader trucks.
A company will generally carry at least ten (10) percent of its fleet as spares. The company uses spares when a truck breaks down in the field or is in the shop for maintenance.
5. Cost Measures
Total system costs per ton range anywhere from $100 per ton, up to $400 per ton, with many systems in the $150 to $250 per ton range. We provide the County with following percent of total cost averages for comparison purposes:
Disposal costs – 25% to 35%
Direct labor costs – 20% to 25%
Operations and maintenance costs – 10% to 15%
General and administrative costs – 10% to 15%, public company average 11%
Management fees – 2 %.
6. Other Measures
Workers compensation can be assessed based on a company’s experience mod, or mod rate. The mod rate is based on the company’s prior accident and workers compensation claim history (i.e., the number and size of claims filed by injured workers). The average industry mod rate is equal to 100 percent. A good mod rate is below 100 percent. A lower mod rate reduces the worker’s compensation premium that a company must pay.
D. Discussion of El Dorado County Collection Company Operating Efficiencies
1. Amador Disposal Service (ADS)
ADS uses a combination of one (1) satellite truck (6 cubic yard load), six (6) rear loader trucks (25 cubic yard loads), and a roll off truck (on-call) to serve 8.5 routes.2 The average fleet age is eleven (11) years.
ADS uses one (1) driver per truck. ADS drivers exit the truck and tip the containers or carts using a cart tipper. Drivers must exit the truck at every stop.
All routes within ADS service areas are considered rural or hard-to-serve rural. Service in these areas is non-mandatory. Due to the geographic range covered by its routes, ADS can only serve between 160 and 270 customers per route, per day. ADS routes are not well-suited for automated trucks, or cart-based service, which could increase efficiencies.
ADS employees are non-union. Average wage rates are well within the norms for the industry. ADS overtime rates currently are slightly above industry averages due to the need for ADS to extend the average time per route, for some routes, beyond an 8 hour day.
ADS provides customers with blue bags for recyclable collection. ADS collects blue bags within the refuse container. Blue bags are separated from the refuse stream at the Western Amador Recovery Facility (WARF), in Ione, California. The WARF forwards blue bags to the Smurfit-Stone facility in Sacramento, California for processing.
2 Routes are serviced primarily on Monday (with some Tuesday
routes). ADS shares labor/trucks with Waste Connections areas served in neighboring Amador and Calaveras counties, creating some economies of scale for the unincorporated County service area.
6-10 Solid Waste Rate and Service Study

In ADS areas, there is a relatively limited amount of recyclable materials collected through the residential blue bag program (22 tons out of 2,579 tons collected, or less than one percent). Additionally, 37 tons of commercial recyclables and 25 tons of industrial materials are diverted. No yardwaste is collected curbside.
Conclusion: ADS cannot materially increase its collection operating efficiencies given the constraints of its rural and hard-to-serve service areas.
2. El Dorado Disposal Service (EDDS)
EDDS uses a combination of satellite trucks (for rural, hard-to-serve areas) and manual-automated trucks (for rural areas) to serve fourteen (14) residential, ten (10) commercial, and seven (7) roll-off routes. The average fleet age is three years for residential trucks, six years for commercial trucks, and seven years for roll-off trucks, so the trucks are relatively new. EDDS uses one (1) driver per truck.
In contrast to ADS-served areas, EDDS provides every other week recycling and yardwaste services. Where ADS-served areas require only one truck and one route because all materials are collected together (i.e., blue bag within the can), EDDS serviced areas require two trucks and two routes because refuse is collected on a separate route from the every other week yardwaste/curbside recyclable route.
All routes within EDDS service areas are considered either rural or hard-to-serve rural. Service in these areas is non-mandatory.
For its hard-to-serve areas, EDDS can only serve between 80 and 250 customers, per route, per day, for refuse (and fewer for the yardwaste/curbside recycling routes). EDDS uses the small two-ton satellite trucks for these hard-to-serve routes.
For rural routes (i.e., not necessarily hard-to-serve areas, such as Diamond Springs, Shingle Springs, and Rescue) the number of customers ranges from 625 to 735, per route, per day, for refuse collection (and fewer for yardwaste/ curbside recycling routes).3 For these rural routes, EDDS uses specially designed manual-automated trucks which allow the driver to either exit the truck and manually tip a container, or use an articulated arm to automatically pickup a cart.4 This combination technology is necessary to efficiently serve routes with both container and cart options. For these rural areas, the numbers of customers served per route, per day, using this combination manual-automation collection method approaches the lower end of the industry range for automated collection.
EDDS collection efficiencies are constrained by several factors, including:
A large number of roads/driveways not maintained by the County (which EDDS will not travel on due to the weight of its trucks)
County limitations on “group” areas (where customers in an area all place their containers together)5
A significant number of non-subscription customers, as the service is not mandatory.6
EDDS employees are non-union. Average wage rates are on within the norms for the industry. EDDS overtime rates currently are slightly above industry averages due to the need for EDDS to extend the average time per route, for some routes, beyond an 8 hour day.
3 For more urban areas of the County with mandatory collection
(El Dorado Hills), EDDS can serve up to 850 customers per route. 4 The current fleet of manual-automated trucks cost
approximately $260,000 per truck. 5 These areas are often a source of illegal dumping. 6 The exact level of non-mandatory service is unknown in the
County. EDDS indicated that the number of non-subscription customers is significant and could approach those recently measured by the City of Placerville (at approximately 40 percent).
6-11

6. Solid Waste Services Profitability Level and Waste Management Industry Standard Comparisons Between the County and Selected Jurisdictions
EDDS provides customers with the choice of a company provided cart or company provided blue bags for recyclable collection. EDDS combines blue bags and source separated materials at the Western El Dorado Recovery Systems (WERS) MRF, in Diamond Springs, California. The WERS transfers this source-separated curbside recyclable material to the Pacific Rim facility in Benicia, California for processing.
In EDDS areas, there are a relatively significant quantity of recyclables and yardwaste materials collected through the source separated residential curbside recycling and yardwaste streams, and also from the refuse processed by the WERS dirty MRF (8,100 tons out of 16,260 tons collected, or about 50 percent). EDDS diversion efforts for the County waste stream are sufficient at this time.
Conclusion: EDDS cannot materially increase its collection operating efficiencies in the hard-to-serve areas. EDDS has adapted by using manual-automated trucks to maximize efficiencies for collecting cans and carts in its rural service areas. EDDS has sufficiently met current AB 939 diversion goals for the unincorporated County areas.
3. American River Disposal Service (ARDS)
ARDS serves a very small portion of unincorporated County. Areas served are mostly campgrounds and summer cabins. One large client is Sierra at Tahoe.
ARDS uses one (1) or two (2) routes to serve its residential and commercial customers. ARDS uses one person per truck. ARD has 1.2 FTE drivers (serviced by STR drivers). ARD uses fork trucks (6 cubic yard, 4 by 4 trucks). ARDS serves up to 79 customers per residential route, per day on manual routes.
ARDS efficiencies are affected by:
Customers spread over a large service area (Wednesday only collection in the fall, winter, and spring; and Monday/ Wednesday collection in the summer)
Winter driving conditions with heavy snow over containers and icy, snow-covered roads
Bear bins that increase time on routes
Narrow, windy roads leading to campgrounds require trucks to drive very slowly and make access difficult
ARDS hauls material to the STR transfer station/MRF, approximately 38 miles one way.
ARDS employees are non-union. Average wage rates are well within norms for the industry. ARDS employees receive little overtime.
Conclusion: ARDS cannot materially increase its collection operating efficiencies given the constraints of its rural, seasonal, and hard-to-serve service areas.
4. Sierra Disposal Service (SDS)
SDS serves unincorporated County residential routes with manual service. SDS uses eight (8) routes to serve its residential and commercial customers. SDS uses a combination of front loaders, rear loaders, and fork trucks (6 cubic yard, 4 by 4 trucks).
SDS serves up to 78 customers per route, per day, on its hard-to-serve routes. For the rural (not necessarily hard-to-serve) routes, SDS serves, on average, up to 600 customers per route, per day.
SDS employs 7 full-time drivers, a supervisor who drives to cover vacation days for other drivers, and two full-time “swampers” (manually pickup residential refuse cans). SDS uses one person per truck.
6-12 Solid Waste Rate and Service Study

SDS adds a new truck whenever it can afford to, which has only been every six years. The average age of a truck in the SDS fleet is 12 years old. SDS efficiencies are affected by:
Rural collection area with customers spread over a large area
Large distances between customers with narrow roads and steep terrain
One hour drive each way to the transfer station, approximately 40 miles.
SDS employees are non-union. Average wage rates are well within the norms for the industry. SDS employees receive little overtime.
Conclusion: SDS cannot materially increase its collection operating efficiencies in its hard-to-serve service areas. With some degree of automation/cart-based service in the rural routes, SDS might be able to marginally increase its efficiencies.
5. South Tahoe Refuse (STR)
STR serves unincorporated County residential routes with manual service. SDS uses portions of eleven of its (11) routes to serve its unincorporated County residential and commercial customers.7 STR uses a combination of front loaders and fork trucks (6 cubic yard, 4 by 4 trucks).8 STR serves, on average, between 500 and 600 customers per route, per day.
To serve all of its areas (of which unincorporated County is a small portion of), STR has 10 primary drivers, 6 part-time drivers who also "swamp" (manually dump residential garbage cans) and 9 full-time "swampers." STR uses two or three persons per truck.
7 STR recently decreased the total number of required routes
and associated trucks by one. 8 Primarily during winter months, fork trucks are used by STR to
collect materials at the curb. Fork trucks then empty material into front loaders which are traveling along the route.
STR adds a new truck every one to two years so that the entire fleet will not need to be replaced at one time; the average age of a truck in the STR fleet is seven years old. STR efficiencies are affected by:
Seasonal, second homeowner, customer base
Winter driving conditions with ice and snow on the roads
Bear bins that increase time on routes
Fluctuations in refuse tonnage (approximately doubles in the summer)
Summer tourism traffic that increases collection times.
STR employees are non-union. Average wage rates are well within norms for the industry. STR employees receive little overtime.
To increase diversion levels, STR is starting construction on a Resource Recovery Facility that will allow it to start a residential green waste route and provide a dedicated facility to receive clean green waste loads from yard and tree service contractors.
Conclusion: STR cannot materially increase its collection operating efficiencies given the range of conditions present in its service areas.
6. Tahoe Truckee Disposal Service (TTDS)
TTDS serves El Dorado County areas with manual service. TTDS serves between approximately 175 and 300 households, per route, per day. TTDS uses a combination of specially fabricated one-ton, 4x4 pickup trucks and frontloaders. Pickup trucks are well-suited to serve areas with narrow streets, overhanging trees, single lane roads, and difficult winter conditions.
Laborers physically tip material into 6-cubic yard bins specially mounted to the pickup trucks. When full, TTDS transfers the material from the
6-13

6. Solid Waste Services Profitability Level and Waste Management Industry Standard Comparisons Between the County and Selected Jurisdictions
pickup truck to a 40 cubic yard frontloader. The frontloader transports material to the Eastern Regional Transfer Station/Materials Recovery Facility (MRF), and makes no more than one trip, per route, per day.
The number of TTDS pickups per day also is limited by the fact that many customers have bear bins, specially designed locked metal boxes designed to restrict access by bears and other wild animals. Drivers must open and check each bear bin regardless of whether the customer has setout material.
We have the following findings related to TTDS efficiencies:
TTDS’s manual pickup truck/frontloader method is an efficient way to service the hard-to-serve El Dorado County areas. TTDS routes are not well-suited for automation, or cart-based service, but rather the combined pickup truck/frontloader service model
TTDS truck maintenance and operations are efficient and cost-effective. Pickup trucks are relatively new, while frontloaders are, on average, more than ten (10) years old. The TTDS fleet is about 50 percent compliant with California Air Resources Board (CARB) air quality standards. TTDS has a truck maintenance management schedule
that has trucks come in for regular maintenance every 150 hours
TTDS non-union labor rates are consistent with those in the industry. Drivers work a 40 hour week and do not use much overtime
TTDS travel distances from remote areas of El Dorado County are up to 25 miles one way from their route to the Eastern Regional MRF
To stabilize cash flow and keep customers from frequently starting and stopping their service (as service is not mandatory), TTDS uses a system of “can averaging.” TTDS uses an on-truck computer system to record information such as whether the customer setout material, the number of containers setout, and whether a blue bag was used. TTDS uses a system of can credits (i.e., 13 credits per quarter). TTDS will carry a customer’s can credits for up to six (6) months, allowing a customer to optimize its variable setout requirements over time. This can credit system works for the large number of second home owners who may not live in their homes throughout the year and may occupy their home only on weekends.
Conclusion: TTDS cannot materially increase its collection operating efficiencies given the constraints of the rural and hard-to-serve service areas.
6-14 Solid Waste Rate and Service Study

Section 7 Franchise Agreement Valuations
for County Solid Waste Services

7. Franchise Agreement Valuations for County Solid Waste Services
We valued El Dorado County solid waste services franchise agreements and present our results in this section. Among the County solid waste services franchise agreements, for the upcoming expiration, one franchise expires in late 2009, some franchises expire in 2012, and other franchises expire in 2014.
Some County franchise companies have requested franchise agreement extensions. The County is undertaking this study in advance of these franchise expirations so that the County will have adequate information to plan future system alternatives. The County would like to understand the value of its franchises to the respective franchise solid waste collection companies.
We obtained, from the County, recent financial statements, rate review documents, and other revenue and cost information for each of the six franchise companies. In our valuations, we estimated the value of the franchise agreements over a maximum fifteen (15) year time horizon.
For each of the six franchise companies, we projected a stream of estimated profitability cash flows. We used discounted profitability cash flow analyses to ethe net present value of the estimated cash flows for the current term, a five year franchise term, a ten year franchise term, and a fifteen year franchise term. We compared County franchises over the same discounting time periods in order to have consistent franchise term comparisons.
stimate
The remainder of this section is organized as follows:
A. Overview of El Dorado County Solid Waste Services Franchise Agreements B. Valuations of Solid Waste Services Franchise Agreement Terms C. Franchise Agreement Valuation Summary.
A. Overview of El Dorado County Solid Waste Services Franchise Agreements
1. Solid Waste Services Franchisees
Solid waste collection franchise areas were first established within portions of the County during the 1950’s. In 1971, the County established seven (7) distinct garbage collection areas by County Ordinance. These franchise areas remain in effect today.1
1 Source: El Dorado County Environmental Management Department.
7. Franchise Agreement Valuations for County Solid Waste Services
Currently the County has entered into exclusive franchise agreements with six solid waste collection companies to provide solid waste collection, transfer, and recycling services for County franchise areas. In addition to the County franchises, the City of Placerville, Cameron Park Community Services District, El Dorado Hills Community Services District, and the City of South Lake Tahoe are under separate, non-County franchises.
The County West Slope areas are served by three companies, including Amador Disposal Service and El Dorado Disposal Services (both subsidiaries of Waste Connection of California), and Sierra Disposal Service (a subsidiary of South Tahoe Refuse Company). The County East Slope areas are also served by three companies, including American River Disposal Service, and South Tahoe Refuse Company (both subsidiaries of South Tahoe Refuse Company), and Tahoe-Truckee Sierra Disposal Company.
El Dorado Disposal Services, serving the majority of the West Slope of the County, has separate franchise agreements to serve the Western unincorporated area of El Dorado County, the City of Placerville, and the El Dorado Hills Community Services District.
County residential refuse service is non-mandatory in majority of County unincorporated areas. While pursuant to County Ordinance No. 4525, Section 8.42.200, refuse service for residents of Cameron Park Community Services District and South Tahoe Refuse Company County franchise area is mandatory; pursuant to County Ordinance No. 2007-01, service within El Dorado Hills Community Services District is mandatory. The City of South Lake Tahoe also requires mandatory subscription to residential solid waste collection services.
Western El Dorado Recovery Systems (WERS), a company with common ownership to El Dorado Disposal Services, provides transfer station/ Materials Recovery Facility (MRF) operations for various customers in the West Slope of the County.
The WERS MRF is located at Diamond Springs, California, an unincorporated area on the West Slope of the County. This facility is the only significant solid waste infrastructure on the West Slope of the County. The MRF serves approximately 75 percent of the County residents and businesses. 2 Nearly all the waste throughput at the MRF operated by WERS is from the El Dorado County jurisdictions. WERS also operates an on-site, certified recycling redemption, household hazardous waste, and electronic waste center.
Current WERS facilities are at the end of their operational life due to their original short-term designation. Without additional capital investment, these facilities likely are not capable of handling the growing demands in the County. El Dorado Disposal Services is planning to relocate its WERS facilities to a location west of Missouri Flat Road. To allow time to recover its multi-million dollar investment, El Dorado Disposal Services has requested a fifteen-year franchise agreement extension (2012 to 2027). 3
South Tahoe Refuse Transfer Station/MRF, operated by South Tahoe Refuse Company, provides transfer station/MRF operations for customers in the surrounding Lake Tahoe Area on the East Slope of the County. The South Tahoe Refuse Transfer Station/MRF also includes a buy-back center and a free household hazardous waste program for the customers on the East Slope. South Tahoe Refuse Company is now constructing a Resource Recovery Facility, which will provide a dedicated facility to receive clean green waste and inert materials.
2 Source: Waste Connections of California, Inc Franchise
Agreement Extension Letter dated January 16, 2008. 3 Ibid.
7-2 Solid Waste Rate and Service Study

Table 7-1 Franchise Agreement Terms Summary
(As of January 2008)
Solid Waste Rate and Service Study El Dorado County
Company Franchise Effective Date
Initial Term
Initial Franchise End Date
Extended Term
Extended Franchise End Date
Optional Extension
Term
Final Franchise End Date
Waste Connections of California Amador Disposal Service June 25, 2002 10 years June 30, 2012 – – N/Ag N/Ag
El Dorado Disposal Servicesa
– El Dorado Countyb Oct. 1, 2004 8 yearsc Dec. 31, 2012 – – 2 yearsd Dec. 31, 2014
– City of Placervillee Mar. 8, 1994 20 years Dec. 31, 2013 – – N/Ag N/Ag
– El Dorado Hills Community Services Districtf Dec. 8, 1994 21 years July 1, 2015 – – N/Ag N/Ag
South Tahoe Refuse Company
American River Disposal Service Aug. 22, 2000 4 years Dec. 31, 2004 5 years Dec. 31, 2009 5 yearsh Dec. 31, 2014
Sierra Disposal Service Aug. 22, 2000 4 years Dec. 31, 2004 5 years Dec. 31, 2009 5 yearsh Dec. 31, 2014
South Tahoe Refuse Company Jan. 24, 1995 10 years Dec. 31, 2004 5 years Dec. 31, 2009 5 yearsh Dec. 31, 2014
Tahoe-Truckee Sierra Disposal Company
Tahoe-Truckee Sierra Disposal i Feb., 2005 5 years Dec. 31, 2009 – – 5 yearsh Dec. 31, 2014a El Dorado Disposal Services was a subsidiary of USA Waste of California, Inc. (Waste Management, Inc.), and was acquired by Waste
Connections of California, Inc. in June 2006. b Franchise Agreement assigned from USA Waste of California, Inc. to Waste Connections of California, Inc. on June 6, 2006.
c Subject to the Board of Supervisors' approval of performance and a 50 percent recycling rate, on, or before December 31, 2006, this franchise
term may be extended for up to an additional five year period. d The County can grant up to two, one year extensions.
e Under separate non-County franchise. Franchise agreement assigned from USA Waste of California, Inc. to Waste Connections of California,
Inc. on June 5, 2006. f Under separate non-County franchise. Franchise agreement assigned from USA Waste of California, Inc. to Waste Connections of California,
Inc. in June 2006. g N/A: not available.
h These optional terms are at the request of the haulers.
i Tahoe-Truckee Sierra Disposal has not yet formally requested a franchise extension to 2014.
Source: El Dorado County Solid Waste Services Franchise Agreements.
2. Solid Waste Franchise Terms Summary
We provide a summary of El Dorado County solid waste services franchise agreement terms, in Table 7-1, above. Detailed information provided in the table includes franchise effective dates, initial terms, extended terms, optional terms, and final franchise end dates. The initial County franchise terms vary widely by franchise agreement, from 4 years to 10 years. The near-term expirations of current County solid waste
services franchise agreements also vary. One franchise expires in late 2009, some franchises expire in 2012, and other franchises expire in 2014. In addition, some of the agreements include two options to extend an additional one, or five year period, upon satisfying the 50 percent AB 939 diversion goal.
Each of the six franchise companies has a County solid waste services franchise. There also are separate non-County franchises, for the City
7-3

7. Franchise Agreement Valuations for County Solid Waste Services
of Placerville, Cameron Park Community Services District, El Dorado Hills Community Services District, and the City of South Lake Tahoe. In our franchise agreement valuation analyses, we only focus on the County franchises, and not the non-County franchises.
Solid waste services franchise agreements with El Dorado Disposal Services, which was a subsidiary of USA Waste of California (Waste Management), were assigned to Waste Connections of California in June, 2006, after Waste Connections of California acquired El Dorado Disposal Services from USA Waste of California.
The County franchise agreement with El Dorado Disposal Services, which is the Company with common ownership to Western El Dorado Recovery Systems, expires in December, 2012. El Dorado Disposal Service has recently requested from the County a fifteen-year extension for its franchise agreement for El Dorado County, and they have argued that this is necessary in order to recover their proposed investment in a new WERS facility (west of Missouri Flat Road).
The three County franchise agreements with the South Tahoe Refuse companies already expired on December 31, 2004, and were extended for a five year term for each of them. These three STR companies have requested franchise extensions to 2014.
The County franchise agreement with Amador Disposal Service expires on June 30, 2012, and the County franchise agreement with Tahoe-Truckee Sierra Disposal expires on December 31, 2009. Both of these agreements do not have an optional extension provided.
The County is undertaking this study in advance of these franchise expirations so that the
County will have adequate information to help plan future system alternatives. The County would like to try to understand the value of its franchises to the respective solid waste collection companies.
B. Valuations of Solid Waste Services Franchise Agreement Terms
1. Franchise Agreement Valuation Methodology
For the solid waste services franchise valuations, we estimated future profitability cash flows. We used a discounted profitability cash flow approach to value County solid waste services franchise agreements to the respective franchise solid waste collection companies. To allow each franchise the same opportunity to accumulate profits, we projected and discounted the profits of these County franchise agreements over the same discounting periods, so that the comparisons of the net present values for each of the franchise agreements are based on the same time frames.
Discounted cash flow analysis applies the concept of the time value of profits. Cash flows were discounted at a six (6) percent rate (risk free), and a twelve (12) percent rate (with risk premium). The discount rates were applied as a proxy for the opportunity cost of capital, or an estimate for the weighted average cost of capital for a hauler company. Perhaps the mostly widely used technique for analyzing a potential investment opportunity or project is the net present value of cash flow approach.
7-4 Solid Waste Rate and Service Study

Table 7-2 Historical Allowable Profitability Level Summary for El Dorado Countyc
Solid Waste Rate and Service Study El Dorado County
Company Franchised Area Historical Allowable Operating Ratios
Waste Connections of California
Amador Disposal Servicea West Slope N/A
El Dorado Disposal Servicesa West Slope 90.00%
Western El Dorado Recovery Systems West Slope 80.00% to 100%*
South Tahoe Refuse Company
American River Disposal Serviceb East Slope N/A
Sierra Disposal Servicea West Slope N/A
South Tahoe Refuse Companyb East Slope 87.00% to 94.30%*
Tahoe-Truckee Sierra Disposal Company
Tahoe-Truckee Sierra Disposalb East Slope N/A
* The Operating Ratio depends on the diversion levels of the Company.
Source: a Former El Dorado County Solid Waste Rate Setting Policies and Procedures Manual for West Slope Areas
b El Dorado County Solid Waste Rate Setting Policies and Procedures Manual for East Slope Areas
c These are all legacy regulated return data, and they are generally not currently used for rate-setting purposes.
2. Allowable Profitability Levels
A smaller Operating Ratio represents a higher profitability level allowed for the company. In the County, the Operating Ratios were historically set differently, for the different County areas, according to the West Slope and East Slope County Solid Waste Rate Setting Policies and Procedures Manuals.
In Table 7-2, above, we provide a historical allowable profitability level summary for each franchise company, as well as for the WERS MRF. For example, in the West Slope service areas, the allowable Operating Ratio was 90 percent, and in the East Slope service areas, the allowable Operating Ratio was 87 percent to 94.3 percent, a sliding-scale Operating Ratio, depending upon the recycling recovery results of the company. And for the Western El Dorado Recovery Systems Materials Recovery Facility, the allowable
Operating Ratio was 80 percent to 100 percent, also depending upon the recycling recovery results of the MRF.
For consistency, in the allowable profitability projections, we used an Operating Ratio of 90 percent for all companies. However, some companies might achieve a higher profitability level than what we projected based on a smaller Operating Ratio (less than 90 percent) allowed by the County. At the time of this writing, we had no profitability level information for Tahoe-Truckee Sierra Disposal, and Amador Disposal Service.
3. Profitability Cash Flow Projections
We obtained, from the County, the most recent available financial statements, rate applications, and/or rate review documents, and other revenue/cost information for each of the six franchise companies. Most documents contained
7-5

7. Franchise Agreement Valuations for County Solid Waste Services
financial information for fiscal years 2005, 2006, and/or 2007.
We used an average of the actual fiscal year profits obtained from each company’s financial statement(s), rate application(s), and/or rate review document(s), as the basis for our profitability projections over a maximum fifteen year time horizon. We applied a 2.7 percent revenue growth rate for all of our profitability projections. This growth rate assumption was a conservative scenario. The companies’ future profits could be larger than our profit cash flow estimations, so our projections here tend to be minimum growth scenarios.
For our profitability projections of the County franchise companies, we projected financial profits based on company financial statement income, and allowable profits based on an allowable Operating Ratio (OR). The financial profit projections estimate profits that can be achieved based upon the historical company financial statement income. Financial profits were the actual profits achieved by the company over the fiscal years. The allowable profit projection estimates were the regulated profits that could be achieved based on an allowable Operating Ratio for the company, which is the theoretical maximum profit level allowed by the County. Allowable profits are the maximum theoretical profitability levels, regulated by the County under the franchise agreement, the company could achieve through the solid waste services provided to the County. In most cases, a company’s financial profitability should be less than, or equal to the allowable profitability levels. This can be because there may be non-allowable costs included in the company’s financial profitability. Financial profits could be either positive or negative, and the allowable profits should be positive.
For both the financial profitability projections, and allowable profitability projections, we estimated the net present values of the franchise
agreement over a fifteen (15) year time horizon, for each of the franchise companies. Detailed calculations are shown in Appendix C. In the exhibits, “actual” represents the profits that we obtained from the company documents; and “projected” presents the profits that we estimated based on certain assumptions, such as profit growth rate, or based on reasonable assumed OR factors. In our financial statement profitability projections, the “actual” profits were obtained from each company’s Financial Statement(s) for the available fiscal year(s).
In our allowable profitability projections, the “actual” profits were the “Provision for Profit” obtained from the Company’s Rate Review Final Report(s), and/or the Company’s Rate Application(s), for the available fiscal year(s), if the company submitted these documents to us. For the rest of the companies that didn’t have Rate Applications, and/or Rate Review documents, we used the Total Expenses on the company financial statements as our data source. We then applied a consistent Operating Ratio of 90 percent on Total Expenses to calculate allowable “actual” profits.
Some franchise companies provided services under County franchises, non-County franchises, as well as under federal contracts. Some companies also served other states (e.g., Nevada). For example, El Dorado Disposal Services provided services to four areas in California, which include the Western unincorporated portion of El Dorado County, the City of Placerville, Cameron Park Community Services District, and El Dorado Hills Community Services District. Since we only focused on County franchises in our analyses, we assumed a profit proportion generated under the El Dorado Disposal Services County franchise. Using the Company provided tonnage data for our assumption, we assumed that the profit generated from this company’s County franchise was 53 percent of the total, for the Fiscal Year 2007.
7-6 Solid Waste Rate and Service Study

Then we used this assumed profit proportion to derive the profits generated from the Company’s County-franchise, for both financial profitability projections and allowable profitability projections. We used this same profit allocation for Western El Dorado Recovery Systems.
The three subsidiaries of South Tahoe Refuse Company had revenues generated from solid waste services under both County franchises and Federal Forestry Contracts. In addition, South Tahoe Refuse Company served customers under two state franchises, including both California and Nevada, as well as held a non-County franchise with the City of South Lake Tahoe. We used information from the three companies’ Financial Statement Schedules of Operating Revenues, and calculated portions for the profits generated from the El Dorado County franchise only. We multiplied the “actual” profits by the respective ratios for both financial profitability projections and allowable profitability projections.
4. Discounted Projected Profitability Cash Flows
For the projected fifteen-year profitability cash flows, we used discounted profitability cash flow analyses to estimate these net present values of the estimated cash flows, separately for each year in the assumed franchise terms, including the current term, a five year franchise term, a ten year franchise term, and a fifteen year franchise term, for each of the six franchise companies, as well as Western El Dorado Recovery Systems. We applied discounted profitability cash flow analyses to both financial profitability projections and allowable profitability projections.
These assumed franchise terms were arbitrary, and are not provided for by the County franchise agreements. We discounted these profitability cash flows, for the assumed four (current, five, ten, and
fifteen years) franchise terms, to provide the County a general idea of the approximate value of its franchise agreements for the different time periods.
We discounted this cash flow stream to net present values using reasonable discount factors of 6.00 percent and 12.00 percent (e.g., estimates for the company’s current borrowing rate/cost of capital or 12 percent for an additional risk premium). To calculate what the net present values of these four assumed franchise terms would be, and to compare to what extend these franchise terms values are different to the different companies, we discounted all profitability cash flows over a same time period, for each of the six franchise companies. All current terms start from year 2008, which is the initial discounting time period t0 (present time), and future terms were from year 2009 (t1) through year 2022 (t14). Thus, we have consistency in terms of the discounting time periods for all of the companies.
For the valuations, since each franchise agreement expires at different times, the years left on the current terms of these agreements are not all the same. For example, the current term, for Amador Disposal Service, is fiscal years 2008, 2009, 2010, 2011, and 2012. The company has approximately five years left on its franchise agreement. The current term, for El Dorado Disposal Services, is fiscal years 2008, 2009, 2010, 2011, and 2012. This company also has approximately five years left on its franchise agreement. For these two companies, the current terms are the same as the five year franchise terms. The current terms, for American River Disposal Service, Sierra Disposal Service, and South Tahoe Refuse Company, are fiscal years 2008, and 2009. These three companies have approximately two years left on their franchise agreements. However, these three companies have requested a franchise extension to 2014 from the County.
7-7

7. Franchise Agreement Valuations for County Solid Waste Services
Table 7-3 Summary of the Net Present Value of Projected Profits over the Current Franchise Agreement Terms and Hypothetical Franchise Termsa for Six Solid Waste Collection Franchise Companies Based on a 6 Percent Discount Rate and a 2.7 Percent Growth Rate
Solid Waste Rate and Service Study El Dorado County
Assumed Franchise Term (In Years)a Net Present Valuesb
Current Term* 5 Year Term* 10 Year Term* 15 Year Term* No. Company Financial
ProfitabilityAllowable Profitability
Financial Profitability
Allowable Profitability
Financial Profitability
Allowable Profitability
Financial Profitability
Allowable Profitability
1 Tahoe-Truckee Sierra Disposalc $26,032 $55,561 $62,120 $132,583 $115,153 $245,774 $160,430 $342,409
2 American River Disposal Servicec, e $70,015 $40,321 $167,074 $96,216 $309,710 $178,358 $431,484 $248,486
3 Amador Disposal Serviced, e $425,588 $316,676 $425,588 $316,676 $788,928 $587,034 $1,099,123 $817,847
4 Sierra Disposal Servicec ($99,630) $397,027 ($220,455) $947,407 ($364,122) $1,756,241 ($457,747) $2,446,770
5 South Tahoe Refuse Companyc $313,633 $410,735 $748,407 $980,119 $1,387,349 $1,816,880 $1,932,835 $2,531,252
6 El Dorado Disposal Servicesd $2,474,024 $2,887,420 $2,474,024 $2,887,420 $4,586,183 $5,352,510 $6,389,407 $7,457,042
Western El Dorado Recovery Systemsd, e $5,250,679 $2,325,234 $5,250,679 $2,325,234 $9,733,366 $4,310,366 $13,560,391 $6,005,142
Note: Represents only the unincorporated County areas franchised by the County and does not include Cameron Park, El Dorado Hills, or any cities in the County.
* All terms start from Year 2008. a The assumed franchise periods are arbitrary, and are not provided for the franchise agreements.
b The net present values were calculated using a 6.00 percent discount factor.
c The current term is for Fiscal Years 2008 and 2009. The company only has approximately two years left on its franchise agreement.
d The current term is for Fiscal Years 2008, 2009, 2010, 2011, and 2012. The company has approximately five years left on its franchise agreement.
e The projected allowable profits are lower than the projected financial statement profits for all assumed franchise periods, for the Company.
C. Franchise Agreement Valuation Summary
Discounted net present values for the four assumed franchise agreement terms, including the current term, a five year term, a ten year term, and a fifteen year term, are summarized, in Table 7-3, above, and Table 7-4, on the next page, for each of the franchise companies. Based on our two scenario projections (either 6 or 12 percent discount rate depending on), each franchise term had a range for its net present value, representing our financial profitability projections and allowable profitability projections.
For most of the franchise companies, the lowest estimated valuation numbers were the net present values of projected financial profits, and the highest estimated valuation numbers were the net present values of projected allowable profits. However, for Amador Disposal Service, American River Disposal Service, and Western El Dorado Recovery Systems, the projected financial profits were larger than the projected allowable profits, which is probably because the allowable profits we used were estimated using the best substitution – the Company Financial Statement Total Expenses, rather than the Total Allowable Operating Expenses, actually included in rate review documents, which were not available to us.
7-8 Solid Waste Rate and Service Study

Table 7-4 Summary of the Net Present Value of Projected Profits over the Current Franchise Agreement Terms and Hypothetical Franchise Termsa for Six Solid Waste Collection Franchise Companies Based on a 12 Percent Discount Rate and a 2.7 Percent Growth Rate
Solid Waste Rate and Service Study El Dorado County
Assumed Franchise Term (In Years)a Net Present Valuesb
Current Term* 5 Year Term* 10 Year Term* 15 Year Term* No. Company Financial
ProfitabilityAllowable Profitability
Financial Profitability
Allowable Profitability
Financial Profitability
Allowable Profitability
Financial Profitability
Allowable Profitability
1 Tahoe-Truckee Sierra Disposalc $25,346 $54,096 $56,005 $119,533 $92,312 $197,024 $115,849 $247,259
2 American River Disposal Servicec, e $68,169 $39,258 $150,629 $86,745 $248,278 $142,980 $311,582 $179,436
3 Amador Disposal Serviced, e $383,698 $285,506 $383,698 $285,506 $632,441 $470,594 $793,696 $590,582
4 Sierra Disposal Servicec ($97,075) $386,560 ($199,930) $854,154 ($298,865) $1,407,884 ($347,823) $1,766,856
5 South Tahoe Refuse Companyc $305,365 $399,907 $674,742 $883,646 $1,112,163 $1,456,495 $1,395,734 $1,827,861
6 El Dorado Disposal Servicesd $2,230,506 $2,603,212 $2,230,506 $2,603,212 $3,676,497 $4,290,820 $4,613,903 $5,384,861
Western El Dorado Recovery Systemsd, e $4,733,857 $2,096,362 $4,733,857 $2,096,362 $7,802,718 $3,455,389 $9,792,196 $4,336,419
Note: Represents only the unincorporated County areas franchised by the County and does not include Cameron Park, El Dorado Hills, or any cities in the County.
* All terms start from Year 2008. a The assumed franchise periods are arbitrary, and are not provided for the franchise agreements.
b The net present values were calculated using a 12.00 percent discount factor.
c The current term is for Fiscal Years 2008 and 2009. The company only has approximately two years left on its franchise agreement.
d The current term is for Fiscal Years 2008, 2009, 2010, 2011, and 2012. The company has approximately five years left on its franchise agreement.
e The projected allowable profits are lower than the projected financial statement profits for all assumed franchise periods, for the Company.
Net present values of both projected financial profits, and allowable profits, varied substantially by company. For example, for a ten year franchise term, net present values of the projected financial profits ranged from -$364,122 to $9,733,366 (at a 6 percent discount rate). Sierra Disposal Service experienced three-year negative profits for the Fiscal Years 2005, 2006, and 2007, according to the Company’s Financial Statements, so the net present values of its financial profitability levels are negative in the valuation, but the company could have positive net present values for its franchise agreement terms based
on the allowable profitability calculation. Net present values for the projected allowable profits ranged from $178,358 to $5,352,510 for a ten year franchise term, assuming both discount factors.
Net present values of both projected financial profits and allowable profits increased as the franchise terms increased. A longer term definitely provides a company more time to accumulate its profits as long as it generates positive profits.
For the assumed franchise terms, including a five-year term, a ten-year term, and a fifteen-year
7-9

7. Franchise Agreement Valuations for County Solid Waste Services
term, we compared the net present values for the different franchise agreements. The current terms, which are different for the different franchise companies, are not directly comparable.
For the financial profitability levels, among the franchise companies, Western El Dorado Recovery Systems had the greatest financial profitability levels, and El Dorado Disposal Services had the second most profitable levels, for all assumed franchise terms.
For the allowable profitability levels, among the franchise companies, El Dorado Disposal Services had the greatest allowable profitability levels, and Western El Dorado Recovery Systems had the second largest profitability level, for all assumed franchise terms.
The net present values of the projected allowable profitability levels are likely the more accurate and meaningful indications for franchise term values. The allowable profitability levels are theoretical
maximum profits the company could achieve under franchises with specifically regulated profitability. The financial profitability levels are profits the company actually made, depending on efficiency and effectiveness of the company’s operations.
The franchise agreement valuations, including both profitability projections and discounting profitability cash flows, were based on high level plausible assumptions. However, these valuations may not represent the actual profitability levels these franchise companies will achieve over the respective time horizons, due to uncertainty of various factors that will happen in the future, such as changes in assumptions, franchise regulations, and market conditions.
We caution that these franchise agreement values are only to be used as high level estimates for County planning purposes. Theses estimates do not represent actual market values of the franchise agreements if they were sold to other parties.
7-10 Solid Waste Rate and Service Study

Section 8 Franchise Agreement Options
for County Solid Waste Services
8. Franchise Agreement Options for County Solid Waste Services
The County’s solid waste management franchises are nearing the end of their current franchise terms. Table 8-1, on the next page, summarizes franchise end dates for the seven (7) County franchises. Without optional extensions, these seven (7) franchises have between one and one-half year and 4.5 years remaining on their current terms. Also, four (4) of the seven (7) franchises have 1.5 years remaining on their current terms.
The County faces a critical near-term decision, with each of the seven (7) franchisees, as to whether or not to extend these franchises. The end of a franchise term represents a suitable time for the County to consider new services for several reasons:
Franchisees generally have sufficient experience, providing services to the County, to identify potential new services, or changes to existing services
The County and franchisees may agree that new, or different, services are needed to increase diversion levels to meet Assembly Bill 939 (AB 939) requirements
A franchise extension can provide sufficient time for a franchisee to reasonably amortize the costs of new purchases. A franchisee generally will not make major purchases, at the end of a franchise term, due to the limited timeframe to reasonably amortize these capital outlays
County operating conditions may have changed over the life of the prior franchise term
Industry norms, or best practices, may have changed over the life of the initial franchise term.
Many jurisdictions will enter into franchise negotiations with their current franchisee. As shown in Exhibit 8-1, on page 8-3, a variety of outcomes result from these extension negotiations, with terms based on the specific needs of each jurisdiction. Exhibit 8-1 identifies terms agreed to by 18 jurisdictions that recently negotiated franchise extensions (representing 21 franchise negotiations). The average franchise extension length from this selected survey was nine (9) years.
This section provides the County with information to use in evaluating whether to extend its franchises. The remainder of this section is organized as follows:
A. County Franchise Extension Requests B. Selected Factors to Consider with Franchise Extensions C. Evaluation of Franchise Options D. Recommendations for Franchise Extension Negotiations.
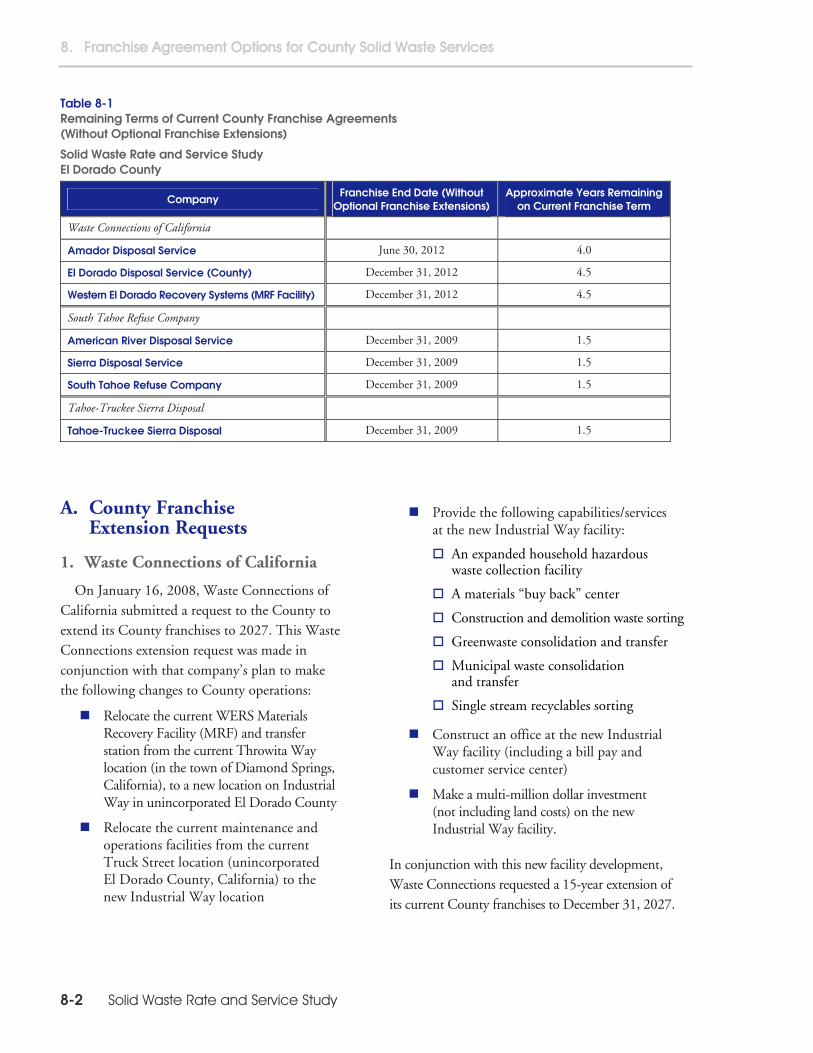
8. Franchise Agreement Options for County Solid Waste Services
Table 8-1 Remaining Terms of Current County Franchise Agreements (Without Optional Franchise Extensions)
Solid Waste Rate and Service Study El Dorado County
Company Franchise End Date (Without
Optional Franchise Extensions) Approximate Years Remaining
on Current Franchise Term
Waste Connections of California
Amador Disposal Service June 30, 2012 4.0
El Dorado Disposal Service (County) December 31, 2012 4.5
Western El Dorado Recovery Systems (MRF Facility) December 31, 2012 4.5
South Tahoe Refuse Company
American River Disposal Service December 31, 2009 1.5
Sierra Disposal Service December 31, 2009 1.5
South Tahoe Refuse Company December 31, 2009 1.5
Tahoe-Truckee Sierra Disposal
Tahoe-Truckee Sierra Disposal December 31, 2009 1.5
A. County Franchise Extension Requests
1. Waste Connections of California
On January 16, 2008, Waste Connections of California submitted a request to the County to extend its County franchises to 2027. This Waste Connections extension request was made in conjunction with that company’s plan to make the following changes to County operations:
Relocate the current WERS Materials Recovery Facility (MRF) and transfer station from the current Throwita Way location (in the town of Diamond Springs, California), to a new location on Industrial Way in unincorporated El Dorado County
Relocate the current maintenance and operations facilities from the current Truck Street location (unincorporated El Dorado County, California) to the new Industrial Way location
Provide the following capabilities/services at the new Industrial Way facility:
An expanded household hazardous waste collection facility
A materials “buy back” center
Construction and demolition waste sorting
Greenwaste consolidation and transfer
Municipal waste consolidation and transfer
Single stream recyclables sorting
Construct an office at the new Industrial Way facility (including a bill pay and customer service center)
Make a multi-million dollar investment (not including land costs) on the new Industrial Way facility.
In conjunction with this new facility development, Waste Connections requested a 15-year extension of its current County franchises to December 31, 2027.
8-2 Solid Waste Rate and Service Study

Exhibit 8-1 Terms of Franchise Extensions for Selected Other Jurisdictions
Solid Waste Rate and Service Study El Dorado County Page 1 of 3
No. Jurisdiction Population Year
Extension Granted
Term of Extension
(yrs.)
Year Franchise
Ends (Ended)Terms of Extension Franchised Hauler
1 County of Placer*
100,000 2008 7 2009 Implement a universal waste collection program (i.e., household batteries, mercury thermometers, fluorescent lamps, computers, cell phones, television); provide annual household hazardous waste collection events; forego cost of living adjustments in fiscal year 2007/2008 and fiscal year 2014/2015
Auburn Placer Disposal Service
2 Castro Valley Sanitary District
16,000 2008 10 2009 Provide new collection trucks, carts, and new recycling services; upgrade commercial collection services, guarantee disposal at local company-owned landfill for 10 years; implement large rate increases phased in over three years
Waste Management of Alameda County
3 City of Red Bluffa
15,000 2007 6 2007 Add liability and insurance requirements to contract; expand recycling program; change annual rate adjustment formula; provide environmental compliance; add liquidated damages; provide free clean up event programs; change franchise fees; provide courtesy collection services; add school recycling; add new requirements for multi-family recycling
Waste Connections
4 City of Concord
115,000 2004 10 (+ 5 year option)
2011 Require relocation of maintenance facility by a certain date; set future franchise fee amounts; provide additional City drop boxes; provide City parks waste disposal at no charge; provide new programs if not meeting AB 939 goals; provide customer service enhancements (e.g., website, online bill pay); change interim year rate formula; cap interim year rate changes at 5 percent
Concord Disposal Service
5 City of Martinez
37,000 2004 2 2012 Reduce cost of new single stream recycling program by extending the term (equipment depreciated over longer term)
Allied Waste Industries, dba Pleasant Hill Bayshore Disposal (PHBD)
6 City of Milpitas
62,700 2004 10 2017 Waive the cost of the street sweeping program for up to 3 years (an approximately $225,000 annual cost to the General Fund)
Allied Waste Industries, dba Browning Ferris Industries (BFI)
a In process, pending final agreement language.
8-3

8. Franchise Agreement Options for County Solid Waste Services
Table 8-1 Terms of Franchise Extensions for Selected Other Jurisdictions
Solid Waste Rate and Service Study El Dorado County (continued) Page 2 of 3
No. Jurisdiction Population Year
Extension Granted
Term of Extension
(yrs.)
Year Franchise
Ends (Ended)Terms of Extension Franchised Hauler
7 Central Contra Costa Solid Waste Authority
Unknown 2004 10 2015 Implement single stream recycling; add minimum diversion tonnage goals; provide food waste pickup with yard waste; add website; specify compensation levels for years 1 and 2 of the contract; require company guarantee of recycling revenues
Valley Waste Management
8 Central Contra Costa Solid Waste Authority
Unknown 2004 10 2015 Establish pre-set tipping fees over the life of the contract. Specify compensation amount for years 1 and 2 of the contract
Allied Waste Industries
9 City of Santa Clarita
177,000 2003 7 2006 Implement immediate rate reduction of $3.49 per month (held for two years); provide new 90-gallon greenwaste/ commingled recycling bins, and plastic bag recycling; increase administrative fees; provide educational brochure to multi-family customers; increase frequency of newsletters; discount school district rates; develop new Materials Recovery Facility (MRF)
Blue Barrell Disposal (residential)/ Burtec (commercial)
10 City of Albany
17,000 2003 5 or 10 Unknown Provide free collection at city parks ($36,000/yr.), provide green waste bins, increase franchise fees
Waste Management of Alameda County
11 City of Pleasant Hill
32,500 2003 9 2015 Restructure franchise agreement entirely, set up rate setting process, fix residential rates for one year
Allied Waste Industries, dba Pleasant Hill Bayshore Disposal (PHBD)
12 City of Richmond
101,700 2003 22 2025 Increase franchise fee from 2.5 to 5.0 percent of gross revenues. Allow City residents free use of landfill
Republic Waste Services
13 City of Seaside
32,000 2003 5 2015 After basic cart service, allow customer to adjust cart size at no additional charge (available in 32 gallon, 64 gallon, and 96 gallon sizes). Provide optional yard waste service for $4.50 per month. Allow commercial rate increase of 5.7 percent. Provide bi-monthly neighborhood clean up of six (6) 30 cubic yard debris boxes per event (City to pay disposal costs only). Allow City the option to increase citywide clean ups from existing two (2) per year to four (4) per year (at $0.50 per customer, per month, additional cost)
Carmel Marina Waste Management
8-4 Solid Waste Rate and Service Study

Table 8-1 Terms of Franchise Extensions for Selected Other Jurisdictions
Solid Waste Rate and Service Study El Dorado County (continued) Page 3 of 3
No. Jurisdiction Population Year
Extension Granted
Term of Extension
(yrs.)
Year Franchise
Ends (Ended)Terms of Extension Franchised Hauler
14 City of Stockton
243,000 2003 15 (+5 year option)
2018 Create 10 percent senior rate discount (at age 65, or 6,000 customers); provide free stickers for extra waste pickup, seasonal leaf collection, enhanced neighborhood cleanup with free bins and boxes for target areas; collect televisions, computer monitors, appliances curbside; agree to a best effort requirement to meet 50 percent diversion; place a cap on rate increases; limit interim year adjustments to 50 percent of the CPI and subject to City approval
Stockton Scavenger/ Sunrise Sanitation
15 City of Sunnyvale
131,760 2003 7 2018 Change depreciation schedule to 10 years for rolling stock and containers (from 7 years and 5 years, respectively)
Bay Counties Waste Services
16 Pebble Beach Community Services District
4,500 2003 5 2015 Increase rates by 3.5 percent compared to requested 5.1 percent increase, and implement single stream recycling
Carmel Marina Waste Management
17 Santa Clara County
105,200 2003 N/A 2007 No specific new provisions Los Altos Garbage
18 City of Manhattan Beach
34,000 1998 3 2002 Freeze rate adjustments for 1998 and 1999, with a rate adjustment resuming in 2000. Add a specialized collection vehicle, one that is smaller and quieter, in the downtown area
Waste Management
19 City of Barstow
23,000 1996 5 2012 Waive a $2.51 increase that was necessary to fund recycling, freeze rates for two years
Desert Disposal Service
20 City of Sunnyvale
131,760 1992 3 2004 Change to OR-based rate setting, purchase new trucks
Bay Counties Waste Services
21 City of Sunnyvaleb
131,760 1991 10 2001 Reduce rates by 16 percent Bay Counties Waste Services
b Franchise re-bid. All of the other examples in this table were negotiations with franchise holders and were not re-bid.
8-5

8. Franchise Agreement Options for County Solid Waste Services
2. South Tahoe Refuse
South Tahoe Refuse has previously requested a franchise extension from the Tahoe Basin JPA. South Tahoe Refuse is currently in the early stages of developing a multi-million dollar Resource Recovery Facility (similar to a MRF) that will focus on long-term green waste recycling adjacent to its current MRF. South Tahoe Refuse is using California Pollution Control Financing Authority (CPCFA) bonds to finance this facility.
3. Tahoe Truckee Sierra Disposal
Tahoe Truckee Sierra Disposal has not requested a franchise extension from the County at this time.
B. Selected Factors to Consider With Franchise Extensions
In this subsection, we discuss the following six (6) factors that the County should consider when evaluating franchise extensions:
Overall system management plan
Rate competitiveness
Service quality
Willingness to implement new programs or services
Capabilities to serve County with unique requirements
Franchise term.
1. Overall System Management Plan
The County should take an overall solid waste management system approach when evaluating whether to extend its franchises. The County should align its future solid waste management system goals, with the goals embodied in its franchise agreements. To do otherwise, the County cannot ensure that its franchisees will provide the services the County requires. The County should not
extend its individual franchises until the County can clearly identify and communicate its overall solid waste management system goals.
2. Rate Competitiveness
In Sections 2 and 3, we show that current unincorporated County rates compare favorably with the unincorporated areas of fourteen (14) comparative jurisdictions. With the exception of certain industrial rates, unincorporated County rates rank among the lowest in our comparative rate surveys. The County should be motivated to maintain these competitive rates and benchmarks.
3. Service Quality
While the County’s franchised companies have not recently conducted customer satisfaction surveys (which generally are performed only upon request from the County), we reviewed their most recent available customer complaint logs. We found that a relatively small percentage of residential customers (i.e., less than 0.1 percent each month) reported complaints with their service, as follows:
Amador Disposal Service - 20 complaints over an eight-month period in 2007 (average of 2.5 per month, or 0.1 percent of the 2,005 residential accounts served, per month)
El Dorado Disposal Service - 109 complaints over the twelve-month period in 2007 (average of 9 per month, or less than 0.1 percent of the 13,671 residential accounts served, per month)1
Three South Tahoe Refuse companies - 7 complaints over an approximately twelve-month period through March, 2008 (average of 0.6 per month, or significantly less than 0.1 percent of the 10,815 residential customers served, per month).
1 During this same time frame, El Dorado Disposal Services recorded
a relatively equal number (106) of customer complements.
8-6 Solid Waste Rate and Service Study

County staff also has indicated, based on their interactions with County customers, that the current franchised haulers are providing reasonably adequate service. While our understanding of service quality is somewhat limited to customer complaints and anecdotal evidence, it appears that the current franchisees provide quality services. The County should be interested in maintaining these high quality services.
4. Willingness to Implement New Programs or Services
In the future, the County likely will need to partner with its franchisees to implement new programs or services (e.g., those that increase diversion levels or enhance service effectiveness and efficiency). The County should carefully assess the future willingness of a franchisee to implement needed new programs or services, particularly in response to changing environmental laws and regulations.
In our opinion, the relationship between the County and franchisee should be thought of as a “win-win” long-term partnership, where the two parties have clear and open communications and implementation follow through. In exchange for agreeing to implement new programs and services, the franchisee must be able to recover its costs, and a reasonable profit, associated with these new programs or services.
5. Capabilities to Serve County with Unique Requirements
The County’s franchisee must be capable of serving a current solid waste management system that is currently complicated by:
Different service levels and rates throughout the County
Geographic range and varied terrain
Non-mandatory collection service
Projected population growth
Significant self-haul component
Urban/rural population mix
Use of out-of-County disposal facilities for all County waste
West Slope MRF/transfer station limitations (age, traffic cueing, and throughput)
Winter weather service constraints.
6. Franchise Term
Jurisdictions typically provide solid waste management franchise terms of between five (5) and fifteen (15) years, with an average, from our internal survey data, of approximately nine (9) years. In recent years, jurisdictions have tended toward shorter initial franchise terms, with optional extensions.
The County should provide a sufficient franchise term for the franchisee to reasonably recover (i.e., amortize) necessary capital expenditures. For this reason alone, we would not recommend a franchise term less than seven (7) years. Also shorter-term franchises require (1) more frequent re-bidding, (2) transition costs (to new franchisee and County), and (3) equipment replacement costs.
Another component of a franchise agreement is the “optional extension” term, or an extension beyond the primary franchise term. The County has utilized optional extensions in its prior franchise agreements. This optional extension is typically one (1) to five (5) years, and should be only the County’s option.
In some cases, the franchise agreement specifies that a franchisee can request this optional extension. In other cases, the jurisdiction must approve the extension. More often, optional extensions are made subject to jurisdictional approval and based on franchisee performance.
8-7

8. Franchise Agreement Options for County Solid Waste Services
C. Evaluation of Franchise Options In this subsection, we assess four (4) options
available to the County related to franchise agreements, with its franchised solid waste companies:
1. Franchise Extension in Conjunction with New Services
2. Franchise Extension in Conjunction with County Option to Purchase Contractor Facilities
3. No Franchise Extension and Use Competitive Bid Process
4. No Franchise Extension and County Provides Refuse Collection Services.
The County requested that we examine these four options. Exhibit 8-2, on the next page, summarizes the pros and cons of each option.
1. Franchise Extension in Conjunction with New Services
The County could negotiate new services as a condition of granting a franchise extension. Offsetting the benefits of a franchise extension with new services is a common practice used by many California jurisdictions, particularly when service quality is satisfactory and rates are competitive (see Exhibit 6-1). In general, this is a good option for the County to consider with franchisees that are providing quality services at reasonable rates.
Obviously, County franchisees do not want to risk losing the franchise. County’s franchisees likely will be motivated to negotiate some level of new services, or other “offsets” (e.g., changes to franchise agreement terms and conditions), in conjunction with a franchise extension. Examples of new services the County could negotiate include:
Customer service enhancements (website, newsletter, online billing)
Collection at County facilities, at no charge to the County
Development of new facilities (e.g., MRF/transfer station)
New on-call pickup services
New residential and commercial recycling and yard waste programs and new specialized programs such as household hazardous waste.
For this option, the County would need to identify new services it determines are most important and prioritize these for discussion. The County should draft a structured discussion document that describes the new services, quantifies the cost of the services, and addresses the potential rate impacts of the services. The County should then engage in discussions with the franchisees to determine their willingness to implement these new services, and capture their opinions regarding these new services.
The franchisee could agree to provide a new service for “free,” or by internalizing the costs of the new service with no change in rates. Depending on the rate setting methodology, the County may want to explicitly protect the County ratepayer against future rate increases associated with costs of these new “free” services.
The County and franchisee should address how the costs of these new “free” services would be treated over time. For County areas with a formal rate setting methodology (i.e., not CPI-based), costs of the new service could be treated as either:
A pass through cost, where the franchisee does not earn any profit on the cost but the cost is captured in the rate base. This cost does not increase the profit to the franchisee
A non-allowable cost, where the franchise is not allowed to capture the cost in the rate base. This cost is truly “free” to the ratepayer.
8-8 Solid Waste Rate and Service Study
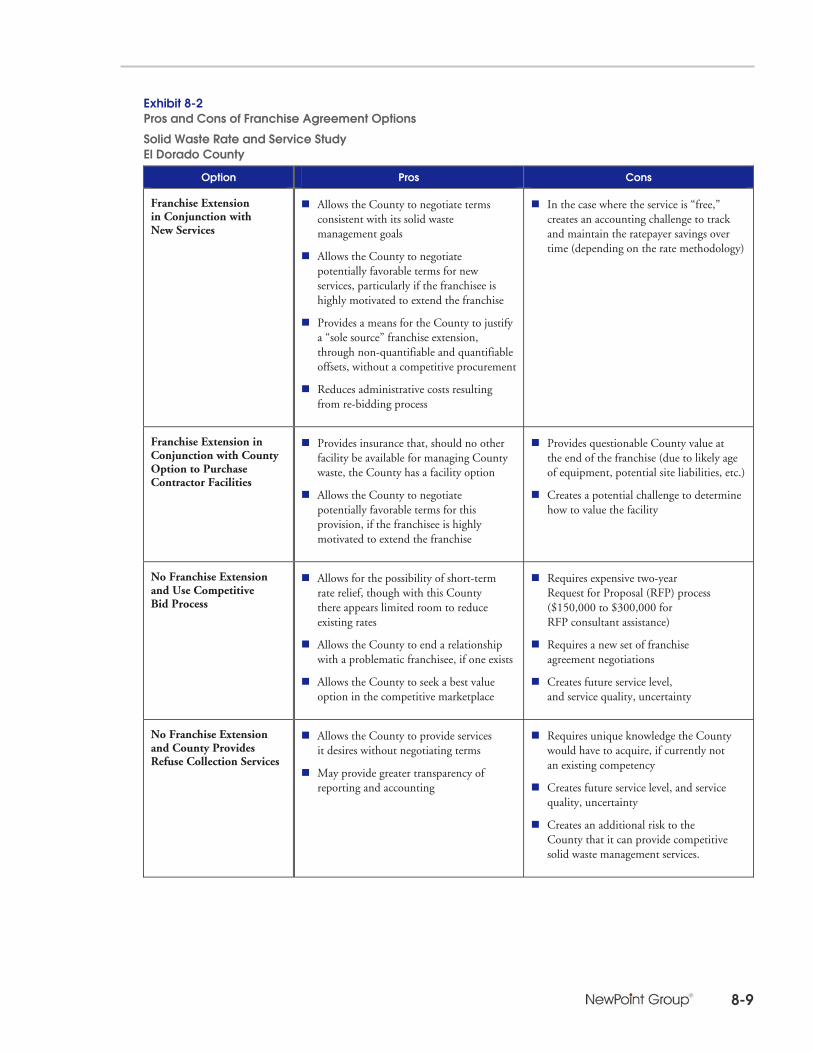
Exhibit 8-2 Pros and Cons of Franchise Agreement Options
Solid Waste Rate and Service Study El Dorado County
Option Pros Cons
Franchise Extension in Conjunction with New Services
Allows the County to negotiate terms consistent with its solid waste management goals
Allows the County to negotiate potentially favorable terms for new services, particularly if the franchisee is highly motivated to extend the franchise
Provides a means for the County to justify a “sole source” franchise extension, through non-quantifiable and quantifiable offsets, without a competitive procurement
Reduces administrative costs resulting from re-bidding process
In the case where the service is “free,” creates an accounting challenge to track and maintain the ratepayer savings over time (depending on the rate methodology)
Franchise Extension in Conjunction with County Option to Purchase Contractor Facilities
Provides insurance that, should no other facility be available for managing County waste, the County has a facility option
Allows the County to negotiate potentially favorable terms for this provision, if the franchisee is highly motivated to extend the franchise
Provides questionable County value at the end of the franchise (due to likely age of equipment, potential site liabilities, etc.)
Creates a potential challenge to determine how to value the facility
No Franchise Extension and Use Competitive Bid Process
Allows for the possibility of short-term rate relief, though with this County there appears limited room to reduce existing rates
Allows the County to end a relationship with a problematic franchisee, if one exists
Allows the County to seek a best value option in the competitive marketplace
Requires expensive two-year Request for Proposal (RFP) process ($150,000 to $300,000 for RFP consultant assistance)
Requires a new set of franchise agreement negotiations
Creates future service level, and service quality, uncertainty
No Franchise Extension and County Provides Refuse Collection Services
Allows the County to provide services it desires without negotiating terms
May provide greater transparency of reporting and accounting
Requires unique knowledge the County would have to acquire, if currently not an existing competency
Creates future service level, and service quality, uncertainty
Creates an additional risk to the County that it can provide competitive solid waste management services.
8-9

8. Franchise Agreement Options for County Solid Waste Services
Some new services may directly benefit the County (e.g., new diversion related services) and other new services may directly benefit the ratepayer (e.g., new on-call pickup services). The County should recognize this important benefit distinction when evaluating the offsetting impacts of new “free” services.
2. Franchise Extension in Conjunction with County Option to Purchase Contractor Facilities
The County could negotiate a new franchise extension in conjunction with the County’s option to purchase a facility from the franchisee, either when the franchise agreement terminates, or the Contractor sells the business. For example, for this option the County could negotiate the right to either:
Assume the remaining debt service which the Contractor used to finance the facility
Buy the facility for the book value of the assets
Buy the facility based on an independent property valuation
Buy the facility for some nominal pre-determined transaction amount.
There is some value to this purchase option as it is difficult to cite a new facility in California. Also, the County does not want to be caught without a facility to use, given the timeframes required either to transition to a new franchisee, or to construct a new facility.
Offsetting this potential facility value is the greater likelihood that over time the County may not want ownership of the facility due to factors such as the age of equipment, and potential site cleanup liabilities. In some cases, these facilities can become more of a liability than an asset. When offsetting a franchise extension using a buyout provision alone, the County should be mindful of this undesirable ownership perspective.
Some jurisdictions attempt to assert that the facility is, in effect, owned by the ratepayers as they have paid for the facility through rates charged. We disagree with this characterization, as the franchisee bears all of the risks involved in developing, permitting, owning, and financing the facility (e.g., repaying the debt service). We believe that the County should think of the facility as just another tool to provide the County service (like a truck or a debris box). We believe that the County is hiring the franchisee to provide its service for a fee, irrespective of how the franchisee elects to provide that service.
The County could consider a more compelling facility ownership option. The County, as part of a regional Joint Powers Authority (JPA) could site, construct, and own its own facility. In that case, the County could then hire a contractor to operate the facility. The County, in conjunction with several other neighboring jurisdictions (e.g., City of Placerville and El Dorado Community Services District) could guarantee a larger waste flow as a way to support financing the debt and thus could benefit from some economies of scale in the facility design. Such a JPA could have greater management control over waste diversion efforts and different programs. An example of such a JPA-owned facility in a neighboring community is the Western Placer Waste Management Authority’s Materials Recovery Facility.
3. No Franchise Extension and Use Competitive Bid Process
The County could elect to put the franchise out to competitive bid. This option is typically used by a jurisdiction when it cannot come to terms with a franchisee after negotiations, or the franchisee is simply not meeting the jurisdiction’s expectations.
A competitive bid process requires the minimum of approximately two (2) years to effectively complete. The County must develop a
8-10 Solid Waste Rate and Service Study

comprehensive bid package, conduct the procurement, analyze the bids, award a contract, negotiate the franchise terms, and allow the new franchisee sufficient lead time to order equipment and plan operations.
A re-bid can provide some rate relief for a jurisdiction with high rates. However, we question to what extent the County could improve upon its already competitive rates, particularly when a new franchisee likely will have to build a transfer station/MRF facility, and transport material for disposal out-of-County.
The potential for short-term rate relief also should not be a singular motivation to re-bid a franchise. When rates are forced down through competitive bidding, a franchisee often will sell or assign the franchise to another entity once they discover that they cannot make a sufficient profit. Where a franchisee does continue to provide service at minimal profit levels, they will be less willing to work with the jurisdiction to add new services or programs.
Jurisdictions also have learned that a single-year low bid result is less meaningful unless the jurisdiction establishes a long-term rate setting process and methodology. A franchisee might “buy the franchise” if it recognizes that it can increase rates over time.
Where a jurisdiction does elect to re-bid a franchise, there are significant costs. For example, consultant costs to help complete a Request for Proposal (RFP) process for a new franchisee can range from $150,000 to $300,000, depending on the size and complexity of the procurement. Should the County select a new vendor, there may be some increased costs associated with transitioning to the new company (e.g., purchasing new equipment). Also, service quality can be negatively affected if the new vendor is unfamiliar with the County’s service areas.
4. No Franchise Extension and County Provides Refuse Collection Services
In this option the County would not extend the franchise and would instead perform its own refuse collection services. This option is generally reserved for a jurisdiction that has internal capabilities/knowledge to perform the service, or has some history of experience with refuse collection services.
We show general differences between public and private sector refuse collection providers in Table 8-2, on the next page. The County should be aware of these relative differences when deciding to perform refuse collection.
Public sector refuse collection providers can have competitive rates. For example, the County of Sacramento and the City of Sacramento residential rates are comparable to those found in our Section 2 comparative rate survey. However, rates charged by a public sector provider often have “hidden” general fund subsidies which reduce the rates charged by the public sector entity.
Public sector refuse collection providers also provide the following other potential benefits:
Control of diversion programs
Local customer service focus and area knowledge
Increased local employment opportunities.
Most jurisdictions in California have privatized refuse collection services. Of 37 Northern and Central California counties we examined, 35 used private refuse collection services for unincorporated county services, and only two provided their own refuse collection service (most notably Sacramento County).2
2 This survey did not include cities in California. There are a
number of city run refuse collection providers, including for example the cities of Folsom, Roseville, and Sacramento.
8-11

8. Franchise Agreement Options for County Solid Waste Services
Table 8-2 Differences Between Public and Private Sector Refuse Collection Providers
Solid Waste Rate and Service Study El Dorado County
Description Public Private
Profit levels Not for profit Regulated profit (average of approximately 90 percent operating ratio, or 11.1 percent return on allowable expenses)
Franchisee fees None, could be administrative fees. “In lieu” franchise fees are a Proposition 218 (Right to Vote on Taxes) issue and are not allowed
Paid to County (average of approximately 10 percent of gross revenues)
Cost of service Not necessarily fully reflected in rates charged, due to general fund accounting and potential for general fund subsidies
Fully reflected in rates charged, however often cross-subsidies exist between residential and commercial sectors
The County would need to carefully consider whether it can adequately provide:
Billing/remittance processing
Customer service
Labor management
Maintenance shop repairs
MRF/transfer facilities
Trucks, equipment, and carts.
In general, County provision of refuse collection services would expose this County to a host of unnecessary ownership and operation risks.
D. Recommendations for Franchise Extension Negotiations
As shown in Exhibit 8-3, on the following page, each of the four options has different process requirements and impacts on rates, service quality, service levels, and system costs. At this early stage, without initiating discussions with the franchisees, some of these factors are somewhat unknown. From this exhibit, we can however say that compared to the other options, the first option, has a greater likelihood of a positive outcome and this option likely is the least risky for the County.
We would recommend the County take the following steps with its franchisees:
Prior to negotiating franchise extensions with any of its franchisees, the County should first develop a County solid waste management system plan that clearly identifies:
Diversion plans
Franchise boundaries
Mandatory collection provisions (including self-haul, burn option, etc.)
Materials recovery facilities, transfer stations, and disposal facilities (locations)
Rate setting process and methodologies
Rate structure and rate objectives (e.g., regionalization)
Service levels
Waste flows.
Based on the competitive County rates, the overall service quality, and the fact that the franchisees are moving toward more diversion efforts in their proposed facilities, we recommend that the County entertain structured negotiations with each franchisee to assess the willingness of that franchisee to enhance its services to meet County solid waste management planning goals.
8-12 Solid Waste Rate and Service Study

Table 8-3 Overview Assessment of Franchise Agreement Options
Solid Waste Rate and Service Study El Dorado County
Option Process
RequirementsRatepayer
Impacts Quality of
Service Impacts Service Level
Impacts System Cost
Impacts
Franchise Extension in Conjunction with New Services
+
(comparatively moderate)
+ Status Quo + Status Quo
Franchise Extension in Conjunction with County Option to Purchase Contractor Facilities
+
(comparatively minimal)
Status Quo Status Quo Status Quo Status Quo
No Franchise Extension and Use Competitive Bid Process
–
(comparatively extensive)
+ or –
Unknown, likely not a long-term reduction
based on currently competitive rates
+ or –
Short-term service disruptions
Unknown, long-term, but based on
customer service logs likely not significantly
better than existing service quality
+
Likely can better align
new franchisee’s service levels with
County goals
Unknown
No Franchise Extension and County Provides Refuse Collection Services
–
(comparatively extensive)
+ or –
Unknown, likely not a long-term reduction
based on currently competitive rates, and if County provided service
rate is fully reflective of cost of service
+ or –
Short-term service disruptions
Unknown, long-term, but based on customer service logs likely not
significantly better than existing service quality
+
Likely can better align County
service levels with County goals
Unknown
The County should make this franchise extension discussion process transparent by thoroughly documenting each negotiated term or condition. The County should identify whether each negotiated term or condition is a County benefit, ratepayer benefit, franchisee benefit, or a combination benefit. The County should prepare a record of its negotiations with the franchisee and document results in a report.
The County may want to consider not only new services, but new franchise terms and conditions (e.g., rate setting process and methodology, annual adjustments, annual rate caps, rate freezes, etc.)
The County should structure future franchises with a base term of nine (9) years,
with three (3), two-year extensions (each with required approval by the County only). In total, this would represent a maximum potential 15-year term (including the three (3), two-year extensions)
Should the County not come to agreeable terms with any one of its current franchisees, only then do we recommend that the County consider a new formal competitive bid process
As the County does not currently have internal knowledge, or capabilities, to perform its own refuse collection operations, we recommend at this time that the County not contemplate refuse collection operations and continue to utilize a private sector franchisee for refuse collection.
8-13
8. Franchise Agreement Options for County Solid Waste Services
[This page intentionally left blank.]
8-14 Solid Waste Rate and Service Study
Section 9 Recommendations for
County Solid Waste Management, Rates, and Service Levels

9. Recommendations for County Solid Waste Management, Rates, and Service Levels
The County is presently faced with a number of complex, and interrelated, substantive solid waste planning and rate setting issues. These issues will affect the County’s future ability to manage its overall solid waste system.
Historically, the County’s waste management system has worked fairly well, particularly when the County was more rural in nature. Now, the County has grown, and in the future the County will become more urban. However, the County will always retain a rural nature due to its foothill and mountain geography.
The County is presently at a crossroads. The County is bridged between a legacy waste management system that has well served a primarily rural County population, and the need for an updated, or more refined, waste management system to meet the demands of an ever evolving urban/rural population mix, and ever more stringent environmental requirements.
This section of our report provides the County our overall recommendations for the Solid Waste Rate and Service Study. The section is organized as follows:
A. Key Solid Waste Management Disparities and Recommendations B. Solid Waste Rate, Rate Structure, and Service Level Disparities and Recommendations C. Solid Waste Rate Setting Disparities and Recommendations.
A. Key Solid Waste Management Disparities and Recommendations
The County faces several dilemmas concerning its short-term, and long-term, solid waste management program. In the short-term, there are the macro waste management issues of County franchises and authorities and mandatory refuse collection for residential services. In the long-term, there are the macro waste management issues of regulated yard waste burning, and the lack of any County solid waste disposal facilities or waste management facilities.
1. County Franchises and Authorities
There is considerable County complexity in administering its franchises for the three parent companies, and the six subsidiary companies, that currently serve the County. There

9. Recommendations for County Solid Waste Management, Rates, and Service Levels
is upcoming expiration of the County’s solid waste service franchise agreements. One franchise expires in late 2009, some franchises expire in 2012, and finally other franchises expire in 2014.
There are County waste management operational constraints with Western El Dorado Recovery Systems (WERS) Transfer Station/ ”Dirty” MRF (i.e., self-haul congestion and operating at permitted capacity).
El Dorado Disposal Services is in the process of developing a new multi-million “clean” Transfer Station and Materials Recovery Facility in unincorporated El Dorado County. This project is currently only at the CEQA study level, and it is still uncertain if the MRF will be developed here due to local “not in my backyard” (NIMBY) issues. El Dorado Disposal Services has submitted their plan to site, and build, this new facility, in conjunction with their request for a fifteen-year franchise extension.
South Tahoe Refuse Company is in the process of developing a new multi-million Resource Recovery Facility adjacent to its existing Transfer Station/MRF in downtown South Lake Tahoe. This new project will focus on green waste and inert recycling. This MRF project has broken ground, with construction actually started.
El Dorado County is a member of the South Lake Tahoe Basin Waste Management Authority (JPA). This JPA is basically an advisory board to the three different government jurisdictions on the East Slope (City of South Lake Tahoe, El Dorado County, and Douglas County, Nevada).
El Dorado County has a Solid Waste Advisory Committee (El Dorado County Solid Waste Advisory Committee (EDSWAC). The Committee is composed of CSD, City, and County members, and their role to the County is advisory only.
There are large “self-haul” volumes in the County. This is partially a reflection of the largely non-mandatory collection situation in the County. Though not known precisely because of the absence of weigh scales throughout much of the County, potentially more than approximately twenty (20) percent of unincorporated County (based on waste tons) in the County could be self-haul.
Given the above complex waste management situation, we recommend that the County carefully negotiate any future franchise extension requests. The County needs to capture additional services and benefits from their refuse haulers in return for any franchise extensions.
There will always be the need to implement new, and additional, waste management programs to increase Assembly Bill 939 (AB 939) diversion levels. A broad range of appropriate diversion discussion items should be part of every new franchise extension request negotiation.
In light of AB 939 State recycling mandates, the County needs to move towards some type of residential recycling program for each of its six residential collection franchise areas. This recycling initiative could be as simple as initially requiring a minimal bag curbside residential recycling program, as part of either any new franchise extension agreement, or any new rate setting agreement. The County also could enhance curbside recycling services by piloting, or phasing in, new full three-cart collection systems, cart-based recycling collection, or cart-based yardwaste collection, in portions of, or all of, a franchisee’s service area.
Specifically, we recommend that the County implement a bag curbside residential recycling program for the service areas of American River Disposal Service and South Tahoe Refuse Service. We recognize that many recyclables are likely currently captured at the respective “dirty” MRFs, but we believe that at least having a bag
9-2 Solid Waste Rate and Service Study
curbside recycling program will help diversion rates (particularly if it is placed outside of the refuse container). In the words of one hauler, “a bag curbside recycling program can help instill a recycling ethic for the children”. The County also should examine whether these two areas might benefit from piloting or phasing in some cart-based curbside recycling in some portions of these two service areas.
We also recommend that formalized franchise areas be established for County areas currently not franchised in the southeast, and southwest, parts of the County. Currently, a non-franchised County hauler (Amador County Environmental Services) is serving some parts of the southeast County.
2. “Non-Mandatory” Residential Refuse Collection
Currently, there is some confusion for some County franchise companies on the East Slope of the County, concerning mandatory residential refuse collection. It would be expected that there would be confusion on this issue given the following situation.
It is our understanding that generally County-wide, in unincorporated areas, residential refuse collection is considered a non-mandatory service. However, for some cities, and Community Service Districts (CSD), within the County (such as the City of South Lake Tahoe, El Dorado Hills CSD, and Cameron Park CSD) residential refuse collection services are mandatory services. On the other hand, for other cities within the County, such as the City of Placerville, residential refuse collection is still non-mandatory, though mandatory residential refuse collection is currently being discussed by the City of Placerville.
The County exception to all of the above descriptions concerning mandatory collection is County Ordinance Number 4525 (Effective July
25, 2000) that created a mandatory collection area for unincorporated areas in the South Lake Tahoe Basin, within El Dorado County, for residential areas served by the franchise area of South Tahoe Refuse Company. The Ordinance provides that if a garbage subscriber fails to pay for mandatory garbage collection service, and a garbage bill has been outstanding for 90 days, or more, a property lien may be placed which constitutes a special assessment on the residence property taxes.
It is not clear if some unincorporated parts of Tahoe-Truckee Sierra Disposal service area are currently being treated as mandatory collection areas, whether or not it is codified, or even enforced. Generally all unincorporated service areas on the East Slope of the Sierra that fall within the pristine “Tahoe Basin” area may defacto be considered areas of mandatory residential refuse collection, again, regardless of whether the requirement is codified, or enforced.
The County needs to now clarify and expand its mandatory residential collection situation with both its franchise haulers, and with other relevant public regulatory entities, on the East Slope of the Sierra. Because of the special environmental status of the Tahoe Basin, we recommend that the County now require, and begin to strictly enforce, mandatory residential refuse collection for unincorporated County areas on the entire East Slope of the County.
This recommendation will require some political will to execute. The County will need to work out numerous details of how to operationally implement and enforce East Slope mandatory collection. Implementation challenges include dealing with issues of a very high proportion of seasonal residents, residential billing methods, snowy winter collection conditions, bears and bear bins, enforcement details, and illegal dumping.
9-3

9. Recommendations for County Solid Waste Management, Rates, and Service Levels
Regardless of the implementation challenges, we believe this recommendation is the right thing to do at this time. We also believe that the County’s East Slope franchise haulers will support this recommendation.
We believe that over the long term, mandatory collection will ultimately be necessary throughout the County. Tahoe Basin wide implementation, along with strict enforcement, of mandatory residential collection for the East Slope service areas will be a first step toward achieving long-term mandatory residential refuse collection County-wide.
We recommend the County undertake a formal study of the feasibility and impact of eliminating non-mandatory collection for the West Slope of the County. This study would include addressing issues of self-haul and illegal dumping; the impact of this policy on the need for new transfer stations in some rural parts of the County; and the potential interaction with the yard waste burning option. This study also would examine the impact, for non-mandatory service areas, of converting those customers that subscribe to service to a cart-based system (three cart or cart-based recycling).
3. Regulated Yard Waste Burning and Yard Waste Collection
There is a County Ordinance allowing regulated yard waste burning during certain hours, on certain days, during certain parts of the year. This Ordinance is particularly popular in the more rural portions of the unincorporated County. Long-term, we do not believe that this County-wide ordinance will be sustainable with the increasing stringent air quality regulations from the State of California.
There are exceptions to this County-wide yardwaste burning ordinance, as there is no yard waste burning allowed in the Tahoe Basin. It is
our understanding that Cameron Park CSD only allows two weeks of burning in the spring, and two weeks in the fall. Some current members of the EDSWAC would like to see all burning banned for the County with the exception of large acreage parcels.
The County needs to develop long-term alternatives to yard waste burning for all unincorporated areas. This will require either viable yard waste service for all County residents, or alternatives such as yard waste separation at “dirty” materials recovery facilities, and special pine needle collection programs.
Currently, only El Dorado Disposal Services provides yard waste services. Amador Disposal Services, Sierra Disposal Services, American River Disposal Services, South Tahoe Refuse Company, and Tahoe-Truckee Sierra Disposal all do not provide yard waste services. South Tahoe Refuse Company is in the process of building a new MRF that will focus on yard waste, along with other inert and green waste materials.
Again, it will take considerable political will to deal with the yard waste burning issue in the County. The issue has already been largely addressed in the Tahoe Basin area, and long-term, it will spread to the rest of the County.
We recommend that the County undertake a formal study of the feasibility and impact of eliminating the yard waste burning option for the West Slope of the County. This study would include addressing issues of self-haul and illegal dumping; the impact of this policy on the need for new transfer stations in some rural parts of the County; and the potential initiative interaction with the non-mandatory collection situation.
9-4 Solid Waste Rate and Service Study

4. Disposal Facilities and Waste Management Facilities
There is County use of four (4) transfer stations/MRFs (two in-County and two out-of-County), and three (3) out-of-County, landfill disposal facilities. There is a lack of any available in-County landfill disposal facilities.
This situation necessitates the 100 percent reliance on out-of-County (including out-of-State) landfill disposal facilities. Currently, County residential refuse ultimately ends up in three (3) other different counties (Sacramento County, San Joaquin County, and Washoe County (Nevada)).
There is difficulty with sitting any new landfills in the County, or using existing, in-County landfills (e.g., Union Mine Landfill). We recommend that the County conduct some long range special planning studies to help address County waste management facility issues.
These special planning analyses could include a study of long-term County landfill strategies and options. This study scope could include the feasibility of: (1) long-term sitting a new landfill in the County, (2) truck long haul of solid waste out-of-State, (3) rail haul of solid waste out-of-County or State, and (4) other disposal options.
In neighboring Sacramento County, the City of Sacramento is currently exploring a high technology gasification plant that would potentially vaporize its City refuse. Sacramento City currently trucks all their residential refuse to the same Nevada landfill (Lockwood) as used by East Slope County haulers.
El Dorado County also does not own or operate any major, or even minor, waste management facilities or locations. We recommend that El Dorado County start to have some direct involvement in terms of ownership and/or control of its waste management facilities, beyond just what is provided by its franchise haulers. For
example, there may be the need to site some new small rural transfer stations in the West Slope areas. This is a potential area where we recommend that the County could take some control.
Another example is there may be the need to ultimately direct (County control) all West Slope materials through a new West Slope transfer station/ MRF. There may be the future need to develop a new institutional framework, such as a Joint Powers Authority (JPA), for management of West Slope waste, including El Dorado County and potentially Cameron Park Community Services District, El Dorado Hills Community Services District, and/or the City of Placerville. We recommend that the County study this issue of West Slope solid waste flow control.
A final example, if El Dorado Disposal Services is unsuccessful in sitting its newest proposed transfer station/MRF in the unincorporated County, we recommend the County explore options to have El Dorado Disposal Services locate its new MRF on appropriate County-owned property. County benefits from ownership include long-term facility and operations stability, one-time payment for facility and equipment costs, low cost land, and potentially beneficial facility operating contracts. Neighboring Placer County currently owns the landfill location where Tahoe-Truckee Sierra Disposal has invested in a substantial transfer station/MRF project. Tahoe-Truckee Sierra Disposal runs this facility for Placer County.
* * * * *
All of the above key County solid waste management issues may want to ultimately be integrated into a comprehensive County solid waste management plan. This document could be a “living” evolving document used to guide the County in its waste management planning efforts, both short-term and long-term.
9-5

9. Recommendations for County Solid Waste Management, Rates, and Service Levels
B. Solid Waste Rate, Rate Structure, and Service Level Disparities and Recommendations
For residential refuse service, the unincorporated County (i.e., areas other than Cameron Park and El Dorado Hills) has a can system for about two-thirds of the customers. There is some cart service offered only by Amador Disposal Services and El Dorado Disposal Services in the more urban areas.
For curbside recycling services, the County essentially uses a bag system, with some biweekly cart service offered by El Dorado Disposal Services. Again, the County does not have yard waste services except for areas served by El Dorado Disposal Services.
This disparity in residential refuse service levels is largely a function of the urban versus rural disparity in the County’s population dispersion, and all the physical operating characteristics implied from this geographic disparity.
There is relatively non-dense, geographic dispersion of County residents with a diverse mix of both urban and rural customers. There are a significant number of hard-to-serve County areas that require unique and specialized equipment (i.e., extra one ton 4x4 trucks). Hard- to-serve characteristics include rural and narrow roads, snow in the winter, and bears and bear bins. Some County haulers are constrained by having to serve customers on non-County maintained roads. Many parts of the County experience harsh winter weather which will always play a challenging role in the delivery of residential solid waste collection services.
All of these diverse and challenging operating characteristics realistically argue for a diverse and appropriate mix of cart-based, and can-based, residential refuse collection systems. A can-based residential refuse collection system may be entirely appropriate in the hard-to-serve rural
portions of the County unincorporated service areas, both now, and in the foreseeable future. This does not mean that the County should remain status quo with its operations and service levels, but rather the County should work with its franchisees to implement thoughtful and incremental service level changes.
A three-cart system may be impractical for the rural and hard-to-serve areas of the County. Some incremental and tactical placement of cart-based services may, however, be possible in areas that are less rural and easier to serve. For all areas of the County (other than EDDS), a substantial rate increase would be required to add a second truck and driver to implement separate yard waste and curbside recycling routes.
There is large variation in residential refuse, curbside recycling, and yard waste collection service levels throughout the County. Much of this variation is entirely justified. Along with this variation in service levels, there is non-uniformity of rates and rate structures throughout the County.
Some unincorporated County areas with lower rates benefit from legacy rate setting practices, different services and service levels, and potentially from larger commercial offsets than other areas (e.g., American River Disposal Service). Some unincorporated County area rates may be larger than others just based on that company’s success with submitting rate applications to the County and “pushing through” rate increases. A regionalized rate structure is unlikely for this County in the foreseeable future.
It is important also to recognize that some areas may simply cost more to serve than other areas. For example, in certain County areas, the company has to manually serve the area with specially retrofitted trucks (with limited storage capacity) that transfer material collected throughout the route to a second larger truck waiting nearby.
9-6 Solid Waste Rate and Service Study

Below we summarize rates, rate structure, and service level disparities for each of the six (6) County franchise haulers, and present our conclusions, as follows:
1. Amador Disposal Service (ADS) 2. El Dorado Disposal Service (EDDS) 3. American River Disposal Service (ARDS) 4. Sierra Disposal Service (SDS) 5. South Tahoe Refuse (STR) 6. Tahoe Truckee Sierra Disposal (TTSD).
1. Amador Disposal Service (ADS)
ADS residents currently select a 32-, 45- or 2, 32 gallon can option, with over 50 percent of these customers being in the 32-gallon service category. While carts are offered, only approximately thirteen (13) percent of ADS area customers have subscribed to a 96-gallon cart service.
There is very little diversion through the ADS blue bag program and there currently is no curbside yard waste service. With the remote nature of the ADS service area (e.g., rural, hard-to-serve areas), a three-cart system currently is impractical and may not generate much additional diversion for the County.
Conclusions: For some areas, ADS could be modified to a three-cart system at this time, and no structural changes to their rates or rate structure are likely necessary. Some regional public (free) yard waste and/or recycling collection drop boxes could be used to help generate more ADS diversion.
2. El Dorado Disposal Service (EDDS)
EDDS residential rates are higher than unincorporated County averages in part because EDDS areas are the only unincorporated County areas that, in addition to refuse collection, include a formal second route (i.e., a second truck
and driver) that provides every other week curbside recycling and yard waste services.
Approximately two-thirds of EDDS unincorporated County residential customers are on a three-cart system, and overall diversion for this residential waste stream is high (approaching 50 percent). EDDS could attempt to move the remaining one-third of EDDS unincorporated County residential customers currently on a can-based system, to a cart-based system.
There is little separation between the EDDS 64-gallon and 96-gallon cart rates ($1.67 per customer, per month). The County and EDDS may want to, over time, consider increasing the separation between these two cart rates so that there is some price incentive for customers to reduce refuse generation.
Conclusions: EDDS is effectively operating a three-cart system for sixty-six (66) percent of its residential service area. EDDS could convert its remaining one-third of customers to a cart system and it could create better pricing incentives to generate less residential refuse by revising its residential rate structure.
3. American River Disposal Service (ARDS)
All ARDS residents select a 32-, 45- or 2, 32 gallon can option, with nearly 60 percent of ARDS customers in the 32-gallon service area. This suggests that larger carts likely are not necessary here.
Many of the limited number of ARDS residents are seasonal (summer cabins without winter service), making a three-cart system impractical for the very small number of customers. Also materials are sorted at the STR “dirty” MRF, minimizing the incremental diversion benefit of single stream, cart-based, curbside recycling.
9-7

9. Recommendations for County Solid Waste Management, Rates, and Service Levels
Conclusions: ARDS should not be modified to a three-cart system at this time and no structural changes to their rates or rate structure are likely necessary. To provide a curbside recycling option, ARDS could provide a blue recycling bag outside the can. Some regional public (free) yard waste and/or recycling collection drop boxes also could be used to help generate more ARDS diversion.
4. Sierra Disposal Service (SDS)
SDS has relatively uniform residential rate differences between its 32-gallon, 45-gallon, and 2, 32-gallon can sizes, suggesting customers currently are motivated to select the appropriate can size for their service levels, and there is some pricing incentives to generate less residential refuse.
SDS has provided customers with a free blue bag, which has resulted in relatively limited diversion to-date.
SDS rates are higher than average across each residential service level. SDS rates have essentially been adjusted nearly annually since approximately the year 2000 (with a recent approximately eleven (11) percent increase in 2007). This has not necessarily been the case for the other unincorporated County franchise areas.
Conclusions: SDS could possibly benefit from a three-cart system and tiered residential rate structure for only some of its less remote areas.
5. South Tahoe Refuse (STR)
As STR areas are provided unlimited residential can service, and its customers are partially serviced with satellite trucks, a three-cart system is likely operationally impractical. Customers with “bear bins” also could not effectively use a three-cart system. A three-cart system also would require a single stream MRF sort line and
this would require an operational change to the current STR “dirty” MRF.
At $23.79 per customer, per month, the unlimited STR residential rate is effectively competitive with the average unincorporated County 2, 32-gallon rate and the 1, 96 gallon rate. This STR rate, however, does not provide any incentives for customers to reduce residential waste generation.
STR should implement a residential blue bag recycling program for its service areas, with bags separated from the refuse container. In conjunction with this potential initiative, STR could consider a tiered residential rate structure, with rates charged based on the number of cans setout. This new system would result in additional costs to track setouts, account for setouts, and administer the system. It may not be justified it to make this change at this time given STR’s relatively small role in the County waste management system.
STR commercial bin rates are significantly below unincorporated County averages due to legacy rate setting practices. However, unlike other County areas (with up to 50 percent commercial business) only ten (10) percent of STR customers are commercial customers.
Conclusions: STR should not be modified to a three-cart system, but STR should consider a separate curbside blue bag program, and could consider replacing the unlimited can rate with a tiered residential rate structure.
6. Tahoe Truckee Sierra Disposal (TTSD)
A total of nearly seventy-five (75) percent of all TTSD residents select the 32-gallon can option. Some of these customers use “bear bins” which would not accommodate large carts, and which would largely negate some benefits of a wheeled toter. A cart-based system (with the options of 64-gallon
9-8 Solid Waste Rate and Service Study

and 96-gallon carts) is unrealistic for TTSD areas. Also, TTSD materials are currently sorted on a “dirty” MRF line at the Eastern Regional MRF, limiting the potential diversion benefits of single stream recycling. With a $5.55 difference in the 32-gallon and 2, 32-gallon cart sizes, and a separate customer-provide blue bag service (outside the refuse can), there are sufficient TTSD incentives to encourage customers to generate less refuse.
Conclusions: TTSD should not be modified to a three-cart system. Some regional public (free) yard waste and/or recycling collection drop boxes could be used to help generate additional TTSD diversion.
C. Solid Waste Rate Setting Disparities and Recommendations
The County has a highly disparate rate setting process for all its franchise haulers. The rate setting process has piecemeal evolved due to
legacy rate setting policies, procedures, practices, and County personnel shortages.
Exhibit 9-1, on the next page summarizes these highly variable and disparate County rate setting processes. Because of this large variability and inconsistency in County rate setting, it has caused disparities in rate setting for the County’s franchise haulers.
Below we list rate setting policies and practices contained in historical Rate Setting Manuals (no longer in use), County Franchise Agreements, and practically used in recent rate years, for each of the six (6) County Franchise Haulers, and present our recommendations, as follows:
1. Amador Disposal Service (ADS) 2. El Dorado Disposal Service (EDDS) 3. American River Disposal Service (ARDS) 4. Sierra Disposal Service (SDS) 5. South Tahoe Refuse (STR) 6. Tahoe Truckee Sierra Disposal (TTSD).
9-9

9. Recommendations for County Solid Waste Management, Rates, and Service Levels
Exhibit 9-1 El Dorado County Rate Setting Policies and Practices Contained in County Franchise Agreements and Used in Recent Rate Years Page 1 of 3
Company Historical Rate Setting
Methodology1Franchise Agreement
Compensation Provisions Recent Rate Setting Practices/Outcomes
Amador Disposal Service (ADS)
N/A 1. Rate set no less than every two (2) years
2. Rate increases allowed for increases in landfill disposal costs or MRF costs
3. Rate increases allowed for justifiable unforeseen circumstances
4. Rate applications required
5. Rates are set to reimburse for operating costs, pass-through costs, and allowed profit
6. Specific non-allowable costs are identified
7. A “reasonable” profit is allowed2
2006 – Request for 3.7 percent CPI increase and for a separate 3.24 percent fuel surcharge increase (Board approved)
2007 – Request for 3.9 percent CPI increase and a separate 0.02 percent fuel surcharge decrease (not approved because submitted late)
2008 – Request for two year 7.3 percent CPI increase and unknown fuel surcharge increase (revised and in process, total requested increase approximately 15 percent)
El Dorado Disposal Service (EDDS)
Solid Waste Rate Setting Policies and Procedures Manual for EDDS and the Western El Dorado Recovery System MRF (dated February 1997), including allowable costs, pass through costs, non-allowable costs, and an OR of 90 percent (collection/recycling) and 80 to 100 percent at the WERS transfer station/MRF (depending on recycling recovery)
1. As of 2004, County was in the process of conducting a rate review by an independent rate review consultant
2. Following results of the rate review, rates (exclusive of franchise fees) adjusted upward/downward annually based on Consumer Price Index, All Items, for the State of California
3. Contractor also may request an additional adjustment for extraordinary circumstances (with supporting documentation) once per operating year. Fuel is specified as a extraordinary cost item
4. Rate changes effective July 1 of each year3
2006 – Request for 3.7 percent CPI increase and for a separate 3.78 percent fuel increase (Board approved)
2007 – Request for 3.9 percent CPI increase and for a separate small 0.03 percent fuel surcharge decrease (Board approved)
2008 – Request for 3.3 percent CPI increase and for a separate unknown fuel surcharge increase (hearing date set, in process)
1 No longer in use by the County and franchised haulers. 2 Section 19 of the Franchise Agreement between ADS and the County, dated June 25, 2002. 3 Section 22 of the Franchise Agreement between EDDS and the County, dated August 23, 2004.
9-10 Solid Waste Rate and Service Study

Exhibit 9-1 El Dorado County Rate Setting Policies and Practices Contained in County Franchise Agreements and Used in Recent Rate Years (continued) Page 2 of 3
Company Historical Rate Setting
Methodology1Franchise Agreement
Compensation Provisions Recent Rate Setting Practices/Outcomes
American River Disposal Service (ARDS)
N/A 1. Rate set no less than every two (2) years
2. Rate increases allowed for increases in landfill disposal costs or MRF costs
3. Rate increases allowed for justifiable unforeseen circumstances
4. Rate applications required
5. Rates are set to reimburse for operating costs, pass-through costs, and allowed profit
6. Specific non-allowable costs are identified
7. A “reasonable” profit is allowed4
2006 – Request for 3.7 percent CPI increase (Board approved)
2007 – No request for CPI, because only contemplated every two years.
Sierra Disposal Service (SDS)
N/A 1. Rate set no less than every two (2) years
2. Rate increases allowed for increases in landfill disposal costs or MRF costs
3. Rate increases allowed for justifiable unforeseen circumstances
4. Rate applications required
5. Rates are set to reimburse for operating costs, pass-through costs, and allowed profit
6. Specific non-allowable costs are identified
7. A “reasonable” profit is allowed5
FY 2000 – 5.7 percent increase
FY 2001 – 0.0 percent increase
FY 2002 – 3.2 percent increase
FY 2003 – 2.4 percent increase
FY 2004 – 2.3 percent increase
FY 2005 – 2.6 percent increase
FY 2006 – 3.7 percent increase
FY 2007 – Based on a detailed rate review conducted by R3 Consultants, R3 recommended a 10.74% increase. R3 used an OR of 90 percent. This increase was approved by the Board.
4 Section 19 of the Franchise Agreement between ARDS and the County, dated August 22, 2000. 5 Section 19 of the Franchise Agreement between SDS and the County, dated August 22, 2000.
9-11

9. Recommendations for County Solid Waste Management, Rates, and Service Levels
Exhibit 9-1 El Dorado County Rate Setting Policies and Practices Contained in County Franchise Agreements and Used in Recent Rate Years (continued) Page 3 of 3
Company Historical Rate Setting
Methodology1Franchise Agreement
Compensation Provisions Recent Rate Setting Practices/Outcomes
South Tahoe Refuse (STR)
Solid Waste Rate Setting Policies and Procedures Manual for STR (dated August 1996), including allowable costs, pass through costs, non-allowable costs, and an OR of between 87 to 94.3 percent (depending on recycling recovery)
1. Rate set no less than every two (2) years
2. Rate increases allowed for increases in landfill disposal costs
3. Rate increases allowed for justifiable unforeseen circumstances
4. Rate applications required
5. Rates are set to reimburse for operating costs, pass-through costs, and allowed profit
6. Specific non-allowable costs are identified
7. A profit is allowed determined by the OR method, and ranges from 87 to 94.3 depending on recycling recovery
8. The entire method and approach for determining the OR and allowable profit is subject to re- determination beyond July 1, 19996
FY 2005 – 9.0 percent increase on January 1, 2005, to provide STR with a COLA (3.0 percent) and for construction of the Resource Recovery Facility (6.0 percent).
FY 2006 – Based on a detailed rate review conducted by R3 Consultants, R3 recommended a 0.77% reduction (independent of a separately approved 9.0 percent increase on January 1, 2006, to provide STR with a COLA (3.0 percent) and for construction of the Resource Recovery Facility (6.0 percent)). R3 used an OR of 87 percent. R3 made recommendations for changes to the rate setting process, including clarification of revenue and expense adjustment factors and disallowed expenses.
FY 2007 – Based on a detailed rate review conducted by R3 Consultants, R3 recommended a 0% increase (independent of a separately approved 9.0 percent increase on January 1, 2007 to provide STR with a COLA (3.0 percent) and for construction of the Resource Recovery Facility (6.0 percent)). R3 used an OR of 87 percent.
FY 2008 – Requested a 5.33 percent increase (pending, in May 2008 modified this request to reflect a 2.87 percent increase).
Tahoe Truckee Disposal Services (TTDS)
At one time, TTSD rates were tied to Placer County’s rate setting methodology
1. Rate set no less than every two (2) years
2. Rate applications required
3. Rates are set to reimburse for operating costs, pass-through costs, and allowed profit
4. Specific non-allowable costs are identified
5. A profit is allowed determined by the OR method, and the exact OR is determined by the Board7
2006 – Request for 3.7 percent CPI increase (Board approved)
2007 – Request for use of Placer County rate setting methodology for El Dorado County areas served by TTDS.
6 Section 19 of the Franchise Agreement between STR and the County, dated January 24, 1995. 7 Section 19 of the Franchise Agreement between TTDS and the County, dated April 4, 1995.
9-12 Solid Waste Rate and Service Study

1. Amador Disposal Service (ADS)
Historical Rate Setting Methodology – N/A.
Franchise Agreement Compensation Provisions – Language mentioned on rate setting timing; allowable costs for rate increases; extraordinary circumstances; and specific non-allowable costs. However, no specific language identified on the operating ratio method.
Recent Rate Setting Practices/Outcomes – Rate applications for CPI increase and fuel surcharge increase submitted for 2006 (approved), 2007 (denied), and 2008 (in process).
Recommendations: ADS rate setting methodology should be based on accounting for ADS allowable costs, pass through costs, and non-allowable costs every four years, and ADS allowable profitability should be determined by using an industry standard allowable ninety (90) percent operating ratio.
2. El Dorado Disposal Service (EDDS)
Historical Rate Setting Methodology – Specific language identified on allowable costs, pass through costs, non-allowable costs, and an operating ratio.
Franchise Agreement Compensation Provisions – Following 2004 Rate Review results, rates adjusted based on Consumer Price Index, All Items, for the State of California; and fuel specified as an extraordinary cost item. Language mentioned on rate changes. However, no specific language identified on the operating ratio method.
Recent Rate Setting Practices/Outcomes – Rate applications for CPI increase and fuel surcharge increase submitted for 2006 (approved), 2007 (approved), and 2008 (in process).
Recommendations: EDDS rate setting methodology should be based on accounting for EDDS allowable costs,
pass through costs, and non-allowable costs every four years, and EDDS allowable profitability should be determined by using an industry standard allowable ninety (90) percent operating ratio.
3. American River Disposal Service (ARDS)
Historical Rate Setting Methodology – N/A.
Franchise Agreement Compensation Provisions – Language mentioned on rate setting timing; allowable costs for rate increases; extraordinary circumstances; and specific non-allowable costs. However, no specific language identified on the operating ratio method.
Recent Rate Setting Practices/Outcomes – Rate application for CPI increase submitted for 2006 (approved). No rate application submitted for 2007.
Recommendations: ARDS rate setting methodology should be based on accounting for ARDS allowable costs, pass through costs, and non-allowable costs every four years, and ARDS allowable profitability should be determined by using an industry standard allowable ninety (90) percent operating ratio.
4. Sierra Disposal Service (SDS)
Historical Rate Setting Methodology – N/A.
Franchise Agreement Compensation Provisions – Language mentioned on rate setting timing; allowable costs for rate increases; extraordinary circumstances; and specific non-allowable costs. However, no specific language identified on the operating ratio method.
Recent Rate Setting Practices/Outcomes – Rate increases allowed for FY 2000 through FY 2006, and Rate Review conducted for FY 2007 using an OR of 90 percent, and a 10.74 percent rate increase recommended (approved).
9-13

9. Recommendations for County Solid Waste Management, Rates, and Service Levels
Recommendations: SDS rate setting methodology should be based on accounting for SDS allowable costs, pass through costs, and non-allowable costs every four years, and SDS allowable profitability should be determined by using an industry standard allowable ninety (90) percent operating ratio.
5. South Tahoe Refuse (STR)
Historical Rate Setting Methodology – Specific language identified on allowable costs, pass through costs, non-allowable costs, and an operating ratio.
Franchise Agreement Compensation Provisions – Language mentioned on rate setting timing; allowable costs for rate increases; extraordinary circumstances; specific non-allowable costs, and allowable profit determined by the operating ratio method (subject to re-determination beyond July 1, 1999).
Recent Rate Setting Practices/Outcomes – Rate increase allowed based on COLA and construction of the Resource Recovery Facility for FY 2005, 2006, and 2007. Also, Rate Reviews conducted for FY 2006 and FY 2007, using an OR of 87 percent, and changes to the rate setting process also recommended. Rate application for FY 2008 submitted (pending).
Recommendations: STR rate setting methodology should be based on accounting for STR allowable costs, pass through costs, and non-allowable costs every four years, and STR allowable profitability should be determined by using an industry standard allowable ninety (90) percent operating ratio.
6. Tahoe Truckee Sierra Disposal (TTSD)
Historical Rate Setting Methodology – At one time, TTSD rates were tied to Placer County’s rate setting methodology.
Franchise Agreement Compensation Provisions – Language mentioned on rate setting timing; specific non-allowable costs; and allowable profit determined by the operating ratio method.
Recent Rate Setting Practices/Outcomes – Rate application for CPI increase submitted for 2006 (approved). A rate setting methodology request for the County franchise area submitted in 2007.
Recommendations: TTDS rate setting methodology should be based on accounting for TTDS allowable costs, pass through costs, and non-allowable costs every four years, and TTDS allowable profitability should be determined by using an industry standard allowable ninety (90) percent operating ratio.
* * * * *
We recommend that the County develop one common rate setting methodology that would be used for all six of its franchise haulers. We recommend that the County develop this methodology, and that the County consistently implement and enforce the methodology.
The recommended common rate setting methodology would be based on accounting for franchise hauler allowable costs, pass through costs, and non-allowable costs every four years. The recommended rate setting methodology would use an industry standard allowable ninety (90) percent operating ratio to determine franchise hauler profitability.
Franchise hauler rates would be reviewed and rebased every four (4) years through a base year rate review process. Through the rate rebase process, solid waste rates could either go up or down. There would be no use of balancing, or “true up,” accounts in this rate setting methodology.
9-14 Solid Waste Rate and Service Study

This rate setting methodology recommendation will not be popular with some of the County’s franchise haulers who may currently be receiving essentially an automatic annual CPI increase for their solid waste rates. For some other County franchise haulers who have not received regular rate increases, or our confused by the lack of consistency in the current County rate setting process, they may welcome a more structured rate setting process. For example, some County franchise haulers have succeeded in obtaining special fuel surcharges from the County, and others have not.
For each of the three years between the base years, the franchise haulers would be allowed a predetermined percentage of the CPI, to increase their rates. This percentage of CPI would be applied to the haulers costs or current rates. Also for each of the interim three years, the franchise haulers would be allowed to submit a hardship special rate increase, justifying the need for a special rate increase based on approved conditions.
At the time of initial implementation of the new common rate setting methodology, each franchise hauler’s rate structure should be reviewed, and if necessary refined. Some haulers, like STR, should move from the unlimited can service rate to a tiered residential rate structure. Other haulers, like SDS, should move toward a tiered residential rate structure for some of its less remote areas. Some haulers, like EDDS can create better pricing incentives by revising its residential rate structure.
This new common recommended rate setting methodology could be made a requirement in a future hauler franchise agreement as part of any proposed franchise extension negotiation. This new recommended rate setting methodology could also possibly be made a requirement for any further rate increase application, depending on the details of each hauler’s franchise agreement.
9-15

9. Recommendations for County Solid Waste Management, Rates, and Service Levels
[This page intentionally left blank.]
9-16 Solid Waste Rate and Service Study

Appendix A Comparative Jurisdiction
Solid Waste Rate and Service Level Surveys

Appendix A Comparative Jurisdiction Solid Waste Rate and Service Level Surveys
Appendix A includes the comparative jurisdiction solid waste rate and service surveys. We surveyed residential, commercial, and industrial rates of fourteen (14) comparative jurisdictions. A list of these comparative jurisdictions is shown in Exhibit A-1, on page A-3.
We worked with County staff to agree on the format and content of the comparative surveys. We selected these fourteen comparative jurisdictions based on targeted criteria, such as population, geographic size, unincorporated population, surrounding jurisdictions, and county median income. Thirteen (13) of the fourteen surveyed comparative jurisdictions were a county, and one (1) was a town.
We obtained supporting data, information, and documentation for current rates and service levels from the fourteen comparative jurisdictions, by using a variety of methods, including contacting county/town offices, contacting franchise companies, and reviewing website information. We collected data for the full range of residential, commercial, and industrial services and rates.
Exhibits A-2 through A-5, below, include detailed survey data of residential, commercial, and industrial solid waste rates for the fourteen comparative jurisdictions. Almost all jurisdictions had more than one service area, and several had many service areas. For example, in our residential solid waste collection survey, Calaveras County had nine (9) service areas, Merced County had seven (7) service areas, Monterey County had six (6) service areas, San Luis Obispo County had thirteen (13) service areas, and Stanislaus had four (4) service areas.
In total, we surveyed 552 individual area rates in the comparative jurisdiction surveys. For comparative jurisdiction residential rate and service survey, we surveyed 199 individual area rates, as follows:
1, 20-gallon can – 1 rates
1, 20-gallon cart – 7 rates
1, 32-gallon can – 33 rates
1, 32-gallon cart – 21 rates
2, 32-gallon cans – 33 rates
1, 64-gallon cart – 35 rates
3, 32-gallon cans – 32 rates
1, 96-gallon cart – 37 rates.

A. Comparative Jurisdiction Solid Waste Rate and Service Level Surveys
For comparative jurisdiction commercial rate and service survey, we surveyed 242 individual area rates, as follows:
2-cubic yard 1 time per week – 49 rates
2-cubic yard 2 times per week – 44 rates
3-cubic yard 1 time per week – 43 rates
3-cubic yard 2 times per week – 38 rates
4-cubic yard 1 time per week – 38 rates
6-cubic yard 1 time per week – 30 rates.
For comparative jurisdiction industrial rate and service survey, we surveyed 82 individual area rates, as follows:
20-cubic yard drop box – 42 rates
30-cubic yard drop box – 42 rates.
For comparative jurisdiction per ton tipping fee survey, we surveyed 29 individual area rates, as follows:
Transfer station tipping fee – 19 rates
Landfill tipping fee – 10 rates.
For residential services, we surveyed 20-, 32-, 64-, and 96-gallon, for both can and cart service levels, as shown in Exhibit A-2, below. For residential curbside recycling and yard waste services, we surveyed service levels, such as container sizes, container types, and collection frequencies, as shown in Exhibit A-3, below. For commercial services, we surveyed the most common 2 cubic yard (1 time per week), 2 cubic yard (2 times per week), 3 cubic yard (1 time per week), 3 cubic yard (2 times per week), 4 cubic yard (1 time per week), and 6 cubic yard (1 time per week) service levels, as shown in Exhibit A-4, below. For industrial services, we surveyed 20 cubic yard, and 30 cubic yard drop box service levels, as shown in Exhibit A-5, below.
Residential, commercial, and industrial rates surveyed are on a per customer, per month basis. Some of the rates were equivalent rates, and in almost all cases, residential refuse rates included recycling and yard waste services, except for the areas, in which no such service was provided.
A-2 Solid Waste Rate and Service Study

Exhibit A-1 Characteristics of Comparative Jurisdictions
(As of January 2008)
Solid Waste Rate and Service Study El Dorado County
No. Jurisdiction Characteristics Service Provider(s)
1 Amador County Adjacent county Amador Disposal (Waste Connections), Aces Waste Services
2 Butte County Similar population Norcal
3 Calaveras County Similar geography Waste Connections, SEI Solid Waste
4 Merced County Similar population Waste Management, Gilton Solid Waste Management
5 Monterey County Similar urban/rural mix Waste Management
6 Nevada County Similar population Waste Management
7 Placer County Similar population,
adjacent county Auburn Placer Disposal Service, Tahoe-Truckee Sierra Disposal
8 San Luis Obispo County Similar urban/rural mix,
split regional haulers
Mid State Solid Waste and Recycling, Mission Country Disposal, Morro Bay Garbage, Paso Robles Waste Disposal, San Luis
Garbage, San Miguel Garbage, South County Sanitary Service
9 Shasta County Similar climate Anderson-Cottonwood Disposal Services
10 Stanislaus County Split regional haulers Bertolotti Disposal, Gilton Solid Waste Management, Modesto Disposal Service (Waste Mgt.), Turlock Scavenger
11 Sutter County Neighboring Norcal (Yuba-Sutter Waste Disposal)
12 Tuolumne County Neighboring Cal Sierra/Waste Management, Burns Refuse, Moore Bros
13 Yuba County Neighboring Norcal (Yuba-Sutter Waste Disposal)
14 Town of Truckee Same service provider Tahoe-Truckee Sierra Disposal
A-3

A. Comparative Jurisdiction Solid Waste Rate and Service Level Surveys
Exhibit A-2 Residential Solid Waste Collection Rates for Comparative Jurisdictions
Per customer, per month (As of January 2008)
Solid Waste Rate and Service Study El Dorado County Page 1 of 2
Service Level
No. Jurisdiction Company 1, 20-Gallon
Can
1, 20-Gallon
Cart
1, 32-Gallon
Can
1, 32-Gallon
Cart
2, 32-Gallon
Cans
1, 64-Gallon
Cart
3, 32-Gallon
Cans
1, 96-Gallon
Cart
Amador County
Franchise Area 1 Amador Disposal/Waste Connections N/A N/A $18.53 N/A $24.84 N/A $31.15 N/A
Franchise Area 2 Aces Waste Services N/A N/A N/A $14.85 N/A $18.15 N/A $22.25
Franchise Area 3 Aces Waste Services N/A N/A N/A 23.30 N/A 30.00 N/A 31.50
1
Average (3 areas) N/A N/A $18.53 $19.08 $24.84 $24.08 $31.15 $26.88
Butte County
Service Area 1 Norcal N/A N/A N/A $14.89 N/A $21.34 N/A $25.79
Service Area 2 Norcal N/A N/A N/A 16.66 N/A 21.82 N/A 23.16
Service Area 3 Norcal N/A N/A N/A 21.40 N/A 25.23 N/A 26.50
2
Average (3 areas) N/A N/A N/A $17.65 N/A $22.80 N/A $25.15
Calaveras Countya
Permit Area A-1* Waste Connections N/A N/A $13.38 N/A $19.28 $21.05 $24.57 $21.93
Permit Area A-2* Waste Connections N/A N/A 9.17 N/A 12.64 13.68 15.75 14.20
Permit Area B-1* Waste Connections N/A N/A 17.26 N/A 21.85 23.60 25.89 24.48
Permit Area B-2* Waste Connections N/A N/A 20.43 N/A 24.57 26.33 29.85 27.27
Permit Area D&E (Area 1) SEI Solid Waste N/A N/A 11.29 N/A 15.22 N/A 19.15 N/A
Permit Area D&E (Area 2) SEI Solid Waste N/A N/A 12.45 N/A 17.42 N/A 22.37 N/A
Permit Area D&E (Area 3) SEI Solid Waste N/A N/A 14.50 N/A 20.32 N/A 26.14 N/A
Permit Area D&E (Area 4) SEI Solid Waste N/A N/A 11.66 N/A 16.49 N/A 21.32 N/A
Permit Area D&E (Area 5) SEI Solid Waste N/A N/A 11.29 N/A 15.95 N/A 20.61 N/A
3
Average (9 areas) N/A N/A $13.49 N/A $18.19 $21.17 $22.85 $21.97
Merced County
Franchise Service Area 1 Waste Management N/A N/A N/A N/A N/A $26.08 N/A $38.18
Franchise Service Area 2 Waste Management N/A N/A N/A N/A N/A 25.04 N/A 36.42
Franchise Service Area 3 Waste Management N/A N/A N/A N/A N/A 24.52 N/A 35.53
Franchise Service Area 4 Waste Management N/A N/A N/A N/A N/A 26.08 N/A 38.18
Franchise Service Area 5 Waste Management N/A N/A N/A N/A N/A 26.69 N/A 39.22
Franchise Service Area 6* Gilton Solid Waste Management N/A N/A $11.26 N/A $11.26 N/A $16.08 16.08
Franchise Service Area 7* Gilton Solid Waste Management N/A N/A 11.26 N/A 11.26 N/A 16.08 16.08
4
Average (7 areas) N/A N/A $11.26 N/A $11.26 $25.68 $16.08 $31.38
Monterey County
Northeastern Waste Management N/A $15.14 N/A $17.81 N/A $24.02 N/A $35.61
Western (Carmel Valley)* Waste Management N/A 25.96 $27.77 30.54 $41.45 44.16 $54.45 57.78
Western (Carmel Unincorp.)* Waste Management N/A 23.80 25.78 27.99 39.36 41.62 53.04 55.19
Western (Castroville/Moss Landing)* Waste Management N/A 16.25 24.03 19.12 36.41 31.50 48.86 43.81
Western (Hwy 68/River Road)* Waste Management N/A 19.85 24.43 23.35 38.11 37.04 51.73 50.66
Western (Unincorp. King City Area)* Waste Management N/A 20.52 25.26 24.15 39.41 38.30 53.49 52.38
5
Average (6 areas) N/A $20.25 $25.45 $23.83 $38.95 $36.11 $52.31 $49.24
Nevada County
Unincorp. County Area Waste Management $15.09 N/A $18.99 N/A $25.88 $30.35 $32.75 $36.73
6
Average (1 area) $15.09 N/A $18.99 N/A $25.88 $30.35 $32.75 $36.73
A-4 Solid Waste Rate and Service Study

Exhibit A-2 Residential Solid Waste Collection Rates for Comparative Jurisdictions
Per customer, per month (As of January 2008)
Solid Waste Rate and Service Study El Dorado County (continued) Page 2 of 2
Service Level
No. Jurisdiction Company 1, 20-Gallon
Can
1, 20-Gallon
Cart
1, 32-Gallon
Can
1, 32-Gallon
Cart
2, 32-Gallon
Cans
1, 64-Gallon
Cart
3, 32-Gallon
Cans
1, 96-Gallon
Cart
Placer County
Unincorp. County Area* Auburn Placer Disposal Service N/A N/A N/A $16.37 N/A $23.98 N/A $28.62
7
Average (1 area) N/A N/A N/A $16.37 N/A $23.98 N/A $28.62
San Luis Obispo County
Unincorp. Area 1 South County Sanitary Services N/A N/A N/A $15.59 N/A $25.76 N/A $35.93
Unincorp. Area 2 South County Sanitary Services N/A N/A N/A 12.07 N/A 18.85 N/A 25.61
Unincorp. Outside Los Osos CSD Mission Country Disposal N/A N/A $16.64 N/A $20.76 N/A $25.06 N/A
San Simeon Area Mission Country Disposal N/A N/A 15.40 N/A 25.43 N/A 35.48 N/A
Rural Morro Bay Mission Country Disposal N/A N/A 9.20 N/A 13.78 N/A 13.78 N/A
Unincorp. Urban Paso Robles Paso Robles Waste Disposal N/A N/A N/A 27.75 N/A 40.55 N/A 53.35
Unincorp. Rural Paso Robles Paso Robles Waste Disposal N/A N/A N/A 28.75 N/A 41.80 N/A 54.85
Urban Mid-State Solid Waste and Recycling N/A N/A N/A 27.85 N/A 40.70 N/A 53.55
Rural Mid-State Solid Waste and Recycling N/A N/A 28.85 N/A 41.95 N/A 55.05 N/A
Urban San Miguel Garbage N/A N/A 20.35 N/A 27.25 N/A 27,25 N/A
Rural San Miguel Garbage N/A N/A 37.55 N/A 37.55 N/A 37.55 N/A
Unincorp. Area 1* San Luis Garbage N/A $7.25 N/A 11.58 N/A 23.17 N/A 34.74
Unincorp. Area 2 San Luis Garbage N/A N/A 15.81 N/A 26.12 N/A 36.44 N/A
8
Average (13 areas) N/A $7.25 $20.54 $20.60 $27.55 $31.81 $33.89 $43.01
Shasta County
Unincorp. County Area Anderson-Cottonwood Disposal Services N/A N/A N/A N/A N/A $19.70 N/A $22.79
9
Average (1 area) N/A N/A N/A N/A N/A $19.70 N/A $22.79
Stanislaus County
Franchise Area 1* Bertolotti Disposal N/A N/A $14.70 N/A $21.42 $14.70 $31.38 $21.42
Franchise Area 2* Gilton Solid Waste Management N/A N/A 12.05 $14.53 20.83 16.25 30.49 20.83
Franchise Area 3* Modesto Disposal Service N/A N/A 14.89 N/A 22.22 16.14 32.58 22.22
Franchise Area 4* Turlock Scavenger N/A N/A 14.94 N/A 21.36 14.94 31.29 21.36
10
Average (4 areas) N/A N/A $14.15 $14.53 $21.46 $15.51 $31.44 $21.46
Sutter County
Unincorp. County Area Norcal (Yuba-Sutter Waste Disposal) N/A N/A N/A $22.55 N/A $33.56 N/A $44.57
11
Average (1 area) N/A N/A N/A $22.55 N/A $33.56 N/A $44.57
Tuolumne County
Area 1 and 2 Cal Sierra/Waste Management N/A N/A $18.95 N/A $28.41 N/A $39.22 N/A
Area 3 Burns Refuse N/A N/A 23.20 N/A 35.20 N/A 48.60 N/A
Area 4 Moore Bros N/A N/A 23.30 N/A 34.65 N/A 50.50 N/A
12
Average (3 areas) N/A N/A $21.82 N/A $32.75 N/A $46.11 N/A
Yuba County
Unincorp. County Area Norcal (Yuba-Sutter Waste Disposal) N/A N/A N/A $22.72 N/A $33.82 N/A $44.92
13
Average (1 area) N/A N/A N/A $22.72 N/A $33.82 N/A $44.92
Town of Truckeeb
Town of Truckee* Tahoe-Truckee Sierra Disposal N/A N/A $14.11 N/A $15.00 N/A $15.89 N/A
14
Average (1 area) N/A N/A $14.11 N/A $15.00 N/A $15.89 N/A
Notes: * Represents equivalent rates. a
Rate does not include the cost of disposal. b
The rate is for 1 can, 1 time per week, based on a rate of $169.29 per year on the property tax bill. The equivalent rate for one extra can is $0.89, or $2.67 for 3 months of service.
A-5

A. Comparative Jurisdiction Solid Waste Rate and Service Level Surveys
Exhibit A-3 Residential Curbside Recycling and Yard Waste Services for Comparative Jurisdictions
(As of January 2008)
Solid Waste Rate and Service Study El Dorado County Page 1 of 2
Service Type No. Jurisdiction Company
Recycling cart size (gallons) Yard Waste cart size (gallons)
1 Amador County
– Franchise Service Area 1 Amador Disposal/ Waste Connections
Blue bag, or 32-gallon cart 96-gallon cart
– Franchise Service Area 2, 3 Aces Waste Services
2 orange bags (30-gallon), or 32-gallon cart, biweekly 96-gallon cart, biweekly
Butte County
– Service Area 1 Norcal 64-gallon cart 96-gallon cart
– Service Area 2 Norcal 64-gallon cart, biweekly 96-gallon cart, biweekly
2
– Service Area 3 Norcal 64-gallon cart, biweekly 96-gallon cart, biweekly
Calaveras County
– Permit Area A, B-1, B-2 Waste Connections 32, 64, or 90-gallon cart, biweekly
32, 64, or 90-gallon cart, biweekly
3
– Permit Area D&E SEI Solid Waste 32, 64, or 96-gallon cart, biweekly
Bag, biweekly (at $3.05 per bag)
Merced County
– Franchise Service Area 1, 2, 3, 4, 5 Waste Management 96-gallon cart 96-gallon cart
4
– Franchise Service Area 6, 7 Gilton Solid Waste Management N/A N/A
Monterey County
– Northeastern Waste Management 64 or 96-gallon cart 64 or 96-gallon cart
5
– Western Waste Management N/A N/A
6 Nevada County Waste Management Two 14-gallon bins 64- or 96-gallon cart
7 Placer County Auburn Placer
Disposal Service Blue bag Not provided in the unincorporated area
A-6 Solid Waste Rate and Service Study

Exhibit A-3 Residential Curbside Recycling and Yard Waste Services for Comparative Jurisdictions
(As of January 2008)
Solid Waste Rate and Service Study El Dorado County (continued) Page 2 of 2
Service Type No. Jurisdiction Company
Recycling cart size (gallons) Yard Waste cart size (gallons)
San Luis Obispo County
– Unincorp. Area 1a South County Sanitary Services
64-gallon cart 96-gallon cart
– Unincorp. Area 2 South County Sanitary Services
Unavailable Unavailable
– San Simeon Area Mission Country Disposal 96-gallon cart Unavailable
– Unincorp. Urban Paso Robles Paso Robles Waste Disposal
96-gallon cart 96-gallon cart
– Unincorp. Rural Paso Robles Paso Robles Waste Disposal 96-gallon cart Unavailable
– Urban Mid-State Solid Waste and Recycling 64-gallon cart 96-gallon cart
– Rural Mid-State Solid Waste and Recycling 96-gallon cart, biweekly Unavailable
– Unincorp. Area 1 San Luis Garbage 64-gallon cart 96-gallon cart
8
– Unincorp. Area 2 San Luis Garbage 64-gallon cart 96-gallon cart
9 Shasta County Anderson-Cottonwood
Disposal Services 64-gallon cart One bundle or can (less than 50 lbs.)
Stanislaus County 10
– Franchise Area 1, 2, 3, 4
Bertolotti Disposal, Gilton Solid Waste Management, Modesto Disposal Service,
Turlock Scavenger
30, 60, or 90-gallon cart Unavailable
11 Sutter County Norcal (Yuba-Sutter
Waste Disposal) 64 or 96-gallon cart 96-gallon cart
12 Tuolumne County Cal Sierra/
Waste Management, Burns Refuse, Moore Bros
Blue bag (32-gallon), unlimited
Not provided
13 Yuba County Norcal (Yuba-Sutter
Waste Disposal) 64 or 96-gallon cart 96-gallon cart
14 Town of Truckee Tahoe-Truckee Sierra Disposal Blue bag (32-gallon) N/A
a Weekly recycling and yard waste services are provided in certain areas only. In some rural areas, no yard waste services are provided.
A-7

A. Comparative Jurisdiction Solid Waste Rate and Service Level Surveys
Exhibit A-4 Commercial Solid Waste Collection Rates for Comparative Jurisdictions
Per customer, per month (As of January 2008)
Solid Waste Rate and Service Study El Dorado County Page 1 of 2
Service Level No. Jurisdiction Company 2-yd
1 per week 2-yd
2 per week 3-yd
1 per week 3-yd
2 per week 4-yd
1 per week 6-yd
1 per week
Amador County
Franchise Area 1 Amador Disposal/Waste Connections $122.07 $245.94 $177.70 $355.41 $233.85 $350.47
Franchise Area 2 Aces Waste Services 102.20 204.40 153.35 306.70 204.20 306.35
Franchise Area 3 Aces Waste Services 153.90 N/A 232.25 N/A 307.85 421.45
1
Average (3 areas) $126.06 $225.17 $187.77 $331.06 $248.63 $359.42
Butte County
City of Chicoa Norcal $70.00 $117.95 $82.11 $158.55 $99.64 $136.08
2
Average (1 area) $70.00 $117.95 $82.11 $158.55 $99.64 $136.08
Calaveras Countyb
Permit Area A Waste Connections $51.59 $103.24 $61.95 $123.91 $82.72 N/A
Permit Area B-1 Waste Connections 49.11 N/A 62.52 N/A 85.94 N/A
Permit Area B-2 Waste Connections 74.07 N/A 82.98 N/A 90.29 N/A
Permit Area D&E (Area 1) SEI Solid Waste 74.77 128.61 N/A N/A N/A N/A
Permit Area D&E (Area 2) SEI Solid Waste 96.40 165.84 N/A N/A N/A N/A
Permit Area D&E (Area 3) SEI Solid Waste 106.25 182.76 N/A N/A N/A N/A
Permit Area D&E (Area 4) SEI Solid Waste 75.24 125.23 N/A N/A N/A N/A
Permit Area D&E (Area 5) SEI Solid Waste 72.79 125.23 N/A N/A N/A N/A
3
Average (8 areas) $75.03 $138.49 $69.15 $123.91 $86.32 N/A
Merced County
Franchise Service Area 1 Waste Management $65.73 $112.50 $87.22 $156.74 $112.50 $163.06
Franchise Service Area 2 Waste Management 61.78 105.73 81.97 146.07 105.73 153.25
Franchise Service Area 3 Waste Management 59.18 101.28 78.52 141.11 101.28 146.80
Franchise Service Area 4 Waste Management 65.73 112.50 87.22 156.74 112.50 163.06
Franchise Service Area 5 Waste Management 67.96 116.32 90.18 162.07 116.32 168.60
Franchise Service Area 6 Gilton Solid Waste Management 64.38 110.18 85.42 153.51 110.18 159.70
Franchise Service Area 7 Gilton Solid Waste Management 64.38 110.18 85.42 153.51 110.18 159.70
4
Average (7 areas) $64.16 $109.81 $85.14 $152.82 $109.81 $159.17
Monterey County
Northeastern Waste Management $146.37 $278.10 $246.56 $468.47 $308.27 $505.64
Western (Carmel Valley) Waste Management 161.99 324.44 230.18 404.79 305.16 404.56
Western (Castroville/Moss Landing) Waste Management 119.08 220.46 202.26 373.46 254.04 336.94
Western (Big Sur) Waste Management 204.11 408.18 N/A N/A N/A N/A
Western (Unincorp. King City Area) Waste Management 119.77 N/A 161.91 N/A N/A N/A
5
Average (5 areas) $150.26 $307.80 $210.23 $415.57 $289.16 $415.71
Nevada Countyc
Unincorp. County Area Waste Management $226.32 $387.28 $290.87 $496.37 $371.92 $462.33
6
Average (1 area) $226.32 $387.28 $290.87 $496.37 $371.92 $462.33
Placer County
Unincorp. County Area Auburn Placer Disposal Service $168.27 $295.05 $236.64 $425.61 $301.54 $428.88
7
Average (1 area) $168.27 $295.05 $236.64 $425.61 $301.54 $428.88
A-8 Solid Waste Rate and Service Study

Exhibit A-4 Commercial Solid Waste Collection Rates for Comparative Jurisdictions
Per customer, per month (As of January 2008)
Solid Waste Rate and Service Study El Dorado County (continued) Page 2 of 2
Service Level No. Jurisdiction Company 2-yd
1 per week 2-yd
2 per week 3-yd
1 per week 3-yd
2 per week 4-yd
1 per week 6-yd
1 per week
San Luis Obispo County
Unincorp. Area 1 South County Sanitary Services $97.83 $160.57 $116.28 $217.77 $167.95 N/A
Unincorp. Area 2 South County Sanitary Services 74.81 122.79 88.91 166.52 128.43 N/A
Unincorp. Outside Los Osos CSD Mission Country Disposal 86.69 131.27 110.46 178.80 152.09 N/A
San Simeon Area Mission Country Disposal 143.97 185.38 188.94 305.92 235.82 N/A
Rural Morro Bay Mission Country Disposal 70.56 106.57 92.05 128.06 N/A N/A
Unincorp. Urban Paso Robles Paso Robles Waste Disposal 121.95 228.60 151.25 285.05 180.95 N/A
Unincorp. Rural Paso Robles Paso Robles Waste Disposal 150.80 286.60 178.60 341.75 233.20 N/A
Urban Mid-State Solid Waste and Recycling 122.40 229.40 151.80 286.05 181.55 $232.05
Rural Mid-State Solid Waste and Recycling 151.35 287.65 179.25 342.95 234.05 300.45
Urban San Miguel Garbage 93.90 165.85 125.60 212.50 187.95 251.30
Rural San Miguel Garbage 106.75 N/A 138.15 N/A 213.50 263.55
Unincorp. Area 1 San Luis Garbage 90.94 136.40 108.54 171.60 126.12 161.32
Unincorp. Area 2 San Luis Garbage 83.90 136.36 110.91 190.31 136.36 190.31
8
Average (13 areas) $107.37 $181.45 $133.90 $235.61 $181.50 $233.16
Shasta Countyd
Unincorp. County Area Anderson-Cottonwood Disposal Services $157.05 $275.30 $200.03 $328.88 $262.26 $322.36
9
Average (1 area) $157.05 $275.30 $200.03 $328.88 $262.26 $322.36
Stanislaus County
Franchise Area 1 Bertolotti Disposal $72.17 $144.33 $84.77 $169.54 $105.09 $145.71
Franchise Area 2 Gilton Solid Waste Management 69.00 138.00 72.54 145.06 80.14 96.90
Franchise Area 3 Modesto Disposal Service 73.62 147.20 82.92 165.80 91.06 98.19
Franchise Area 4 Turlock Scavenger 75.08 150.13 79.63 159.25 96.17 123.57
10
Average (4 areas) $72.47 $144.92 $79.97 $159.91 $93.12 $116.09
Sutter County
Unincorp. County Area Norcal (Yuba-Sutter Waste Disposal) $167.33 $266.96 $202.51 $336.11 N/A $259.71
11
Average (1 area) $167.33 $266.96 $202.51 $336.11 N/A $259.71
Tuolumne County
Area 1 and 2 Cal Sierra/Waste Management $175.06 $333.40 $254.25 $491.67 N/A N/A
Area 3 Burns Refuse 184.40 350.10 267.20 515.60 N/A N/A
Area 4 Moore Bros 181.90 347.55 N/A N/A N/A N/A
12
Average (3 areas) $180.45 $343.68 $260.73 $503.64 N/A N/A
Yuba County
Unincorp. County Area Norcal (Yuba-Sutter Waste Disposal) $168.62 $269.02 $204.08 $338.71 $245.41 $261.72
13
Average (1 area) $168.62 $269.02 $204.08 $338.71 $245.41 $261.72
Town of Truckee
Town of Truckee Tahoe-Truckee Sierra Disposal N/A N/A $196.74 $371.73 $252.61 $365.42
14
Average (1 area) N/A N/A $196.74 $371.73 $252.61 $365.42
Notes: a There is an additional fuel charge which varies every month.
b Rate does not include the cost of disposal.
c All rates include rental fee and gate fee.
d Rates include container rental fee.
A-9

A. Comparative Jurisdiction Solid Waste Rate and Service Level Surveys
Exhibit A-5 Industrial Solid Waste Collection Rates for Comparative Jurisdictions
Per customer, per month (As of January 2008)
Solid Waste Rate and Service Study El Dorado County Page 1 of 2
Service Level No. Jurisdiction Company 20 cubic yard
drop box 30 cubic yard
drop box
Amador County
Franchise Area 1 Amador Disposal/Waste Connections $110.70 $110.70
Franchise Area 2, 3 Aces Waste Services N/A N/A
1
Average (3 areas) $110.70 $110.70
Butte County
City of Chicoa Norcal $237.00 $262.00
2
Average (1 area) $237.00 $262.00
Calaveras Countyb
Permit Area A Waste Connections $289.04 $388.50
Permit Area B-1 Waste Connections 311.84 411.29
Permit Area B-2 Waste Connections 311.84 411.29
Permit Area D&E (Area 1) SEI Solid Waste 231.90 282.04
Permit Area D&E (Area 2) SEI Solid Waste 250.70 307.11
Permit Area D&E (Area 3) SEI Solid Waste 250.70 307.11
Permit Area D&E (Area 4) SEI Solid Waste 231.90 282.04
Permit Area D&E (Area 5) SEI Solid Waste 231.90 282.04
3
Average (8 areas) $263.73 $333.93
Merced Countyc
N/A N/A N/A N/A
4
Average N/A N/A
Monterey County
Northeasternd Waste Management $330.60 $378.16
Western (Carmel Valley 1) Waste Management 253.84 333.49
Western (Carmel Valley 2) Waste Management 264.48 344.11
Western (Castroville/Moss Landing) Waste Management 258.19 339.29
Western (Big Sur 1) Waste Management 507.89 592.01
Western (Big Sur 2) Waste Management 541.12 671.99
Western (Unincorp. King City Area 1) Waste Management 320.77 426.71
Western (Unincorp. King City Area 2) Waste Management 380.53 469.08
5
Average (8 areas) $357.18 $444.36
Nevada County
Unincorp. County Areae Waste Management $330.43 $330.43
6
Average (1 area) $330.43 $330.43
Placer County
Unincorp. County Area Auburn Placer Disposal Service $305.38 $384.34
7
Average (1 area) $305.38 $384.34
A-10 Solid Waste Rate and Service Study

Exhibit A-5 Industrial Solid Waste Collection Rates for Comparative Jurisdictions
Per customer, per month (As of January 2008)
Solid Waste Rate and Service Study El Dorado County (continued) Page 2 of 2
Service Level No. Jurisdiction Company 20 cubic yard
drop box 30 cubic yard
drop box
San Luis Obispo Countyf South Rural SLO San Luis Garbage $261.00 $286.00 City of San Luis Obispo San Luis Garbage 266.00 292.00
North rural SLO San Luis Garbage 286.00 312.00 Pismo & Shell Beach San Luis Garbage 286.00 312.00
Arroyo Grande & Grover Beach San Luis Garbage 286.00 312.00 Oceano San Luis Garbage 305.00 339.00 Los Osos & Baywood San Luis Garbage 312.00 339.00
Avila Beach San Luis Garbage 312.00 339.00 Morro Bay San Luis Garbage 319.00 344.00 Nipomo/AG Mesa San Luis Garbage 319.00 344.00
Cayucos San Luis Garbage 365.00 390.00
Cambia & Harmony San Luis Garbage 454.00 480.00 San Simeon San Luis Garbage 474.00 500.00
8
Average (13 areas) $326.54 $353.00
Shasta County Unincorp. County Area Anderson-Cottonwood Disposal Services $406.00 $502.00
9
Average (1 area) $406.00 $502.00
Stanislaus County Franchise Area 1g Bertolotti Disposal $225.00 $248.00
Franchise Area 2g Gilton Solid Waste Management 231.00 254.00 Franchise Area 3g Modesto Disposal Service 225.00 248.00
Franchise Area 4g Turlock Scavenger 225.00 248.00
10
Average (4 areas) $226.50 $249.50
Sutter County Unincorp. County Areah Norcal (Yuba-Sutter Waste Disposal) $333.82 $394.39
11
Average (1 area) $333.82 $394.39
Tuolumne County Area 1 and 2 Cal Sierra/Waste Management $507.15 $696.57 Area 3 Burns Refuse N/A N/A
12
Average (2 areas) $507.15 $696.57
Yuba County Unincorp. County Area Norcal (Yuba-Sutter Waste Disposal) $336.41 $397.45
13
Average (1 area) $336.41 $397.45
Town of Truckee Town of Truckee Tahoe-Truckee Sierra Disposal $339.00 $417.00
14
Average (1 area) $339.00 $417.00
Notes: a For the City of Chico. This is the rate for a 7-day rental, and there is an additional fuel charge which varies every month.
b Rate does not include the cost of disposal.
c The industrial services are performed by many non-franchised haulers.
d We included the 20 - 29 CY rate as an equivalent rate for the 20 CY category, and the 30 - 39 CY rate as an equivalent rate for the 30 CY category.
e The rate is for a 20 to 40 yard bin. The base rate is $190.43. There is an additional per ton charge. We assumed an average load of two tons of refuse at $70.00 per ton.
f Rates include first 3 days free rental, $5.00 per day rental fee after that, and for up to 4 tons. The extra per ton charge beyond 4 tons is $49.00 per ton.
g The base rate is $125.00 for a 20-cubic yard drop box, and $148.00 for a 30-cubic yard drop box. We assumed an average load of two tons of refuse at current County tipping fees.
h Rates are for a 5-day service.
A-11

A. Comparative Jurisdiction Solid Waste Rate and Service Level Surveys
Average comparative jurisdiction solid waste rates are summarized in Table 3-1, Table 3-8, and Table 3-13, respectively, for residential, commercial, and industrial services, in Section 3. For the fourteen jurisdictions surveyed, average residential solid waste collection rates were $17.59, $ 23.99, and $31.39, respectively, for 1, 32-gallon can, 2, 32-gallon cans, and 3, 32-gallon cans service levels; and $19.67, $26.55, and $33.06, respectively, for 32-, 64-, and 96-gallon cart service levels.
Average commercial solid waste collection rates were $133.34, $174.28, $211.83 and $293.34, respectively, for the 2-yd (1 per week), 3-yd (1 per week), 4-yd (1 per week), and 6-yd (1 per week) service levels; and $235.61, and $312.75, respectively, for the 2-yd (2 per week), and 3-yd (2 per week) service levels.
Average industrial solid waste collection average rates were $313.83, and $375.05, respectively, for 20 cubic yard, and 30 cubic yard, drop box service levels.
Exhibit A-6, on the next page, summarizes the comparative jurisdiction transfer station and landfill survey results. We surveyed a set of fourteen comparative jurisdictions, the same as our previous solid waste rate and service level surveys. In Exhibit A-6, we show facilities used by each of the surveyed comparative jurisdictions, as well as tipping fees per ton charged for regular refuse transferred into the facilities.
We distinguished tipping fees into two categories, transfer station and landfill. For the fourteen comparative jurisdictions, tipping fees for transfer stations ranged from $28.00 per ton to $146.95 per ton, with an absolute difference of $118.95; and tipping fees for landfills ranged from $30.00 per ton to $64.00 per ton, with an absolute difference of $34.00. Comparative jurisdiction mean tipping fees were $65.90 per ton, and $42.13 per ton, respectively, for transfer station, and landfill gate fees.
A-12 Solid Waste Rate and Service Study

Exhibit A-6 Transfer Station and Landfill Tipping Fees per Ton for Comparative Jurisdictions
(As of January 2008)
Solid Waste Rate and Service Study El Dorado County
Transfer Station Landfill No. Jurisdiction Facility Name
Tipping Fee Per Ton
1 Amador County Ione Buena Vista Transfer Station $68.00 – Pine Grove Transfer Station 79.45 – 2 Butte County Neal Roads Landfill – $32.00
3 Calaveras County Rock Creek Landfilla – 64.00
4 Merced County Highway 59 Landfill, Billy Wright Landfill – 33.41
Gilton Resource Recovery and Transfer Facility 53.00 – 5 Monterey County Monterey Peninsula Landfill and Recycling Facility 43.00 – Sun Street Transfer Station 58.00 – Jolon Road Transfer Station 58.00 – 6 Nevada County McCourtney Road Transfer Station and Recycling Center 70.00 – 7 Placer County Western Regional Sanitary Materials Recovery Facility 69.75 – Eastern Regional Materials Recovery Facility 75.50 – 8 San Luis Obispo County Cold Canyon Landfill – 48.00
Nipomo Transfer Station 58.00 – Chicago Grade Landfill – 45.00
Paso Robles Landfill – 46.85
9 Shasta County City of Redding Transfer Station 62.00 – West Central Landfill – 37.50
10 Stanislaus County Fink Road Landfill – 30.00
Stanislaus Resource Recovery Facility (WTE) 28.00 – Bertolotti Transfer Station 50.00 – Gilton Resource Recovery and Transfer Facility 53.00 –
11 Sutter County Ostrom Road Landfill – 42.25
Yuba-Sutter Disposal, Inc. Transfer Station 54.50 – 12 Tuolumne County Cal Sierra Transfer Station 94.95 – Groveland Transfer Station 146.95 –
13 Yuba County Ostrom Road Landfill – 42.25
Yuba-Sutter Disposal, Inc. Transfer Station 54.50 – 14 Town of Truckee Eastern Regional Materials Recovery Facility 75.50 – Mean $65.90 $42.13
Number of Rates 19 10
Median $58.00 $42.25
Minimum $28.00 $30.00
Maximum $146.95 $64.00 a There is no charge for Calaveras County property owners, up to 2 cubic yards per load. This rate is an equivalent rate, equal to the rate for 8-cubic yards of refuse.
A-13

A. Comparative Jurisdiction Solid Waste Rate and Service Level Surveys
[This page intentionally left blank.]
A-14 Solid Waste Rate and Service Study

Appendix B Solid Waste Rate
and Service Levels for Jurisdictions Meeting AB 939 Diversion Levels
Appendix B Solid Waste Rate and Service Levels for Jurisdictions Meeting AB 939 Diversion Levels
We identified twelve (12) comparative jurisdictions meeting Assembly Bill 939 (AB 939) diversion levels. Nine of them overlap with the fourteen (14) jurisdictions used in our rate and service level surveys, in Appendix A. The additional three (3) jurisdictions we identified are Solano County, Napa County, and Sonoma County. These twelve jurisdictions exceeded the fifty (50) percent goal in 2006.
A list of the twelve jurisdictions is provided in Exhibit B-2, on page B-3, with information for solid waste system characteristics, and service providers. We also provide a California 58 county map, in Exhibit B-1, on the next page.
Residential rates and service levels of these comparative jurisdictions are shown in Exhibit B-3, and Exhibit B-4, starting on page B-4. We surveyed comparative jurisdiction residential rates, for 20-, 32-, 64-, and 96-gallon, for both can and cart, service levels. For residential curbside recycling and yard waste services, we surveyed service levels, such as container sizes, container types, and collection frequencies. The rates surveyed are on a per customer, per month basis. Some of the rates were equivalent rates, and in almost all cases, residential refuse rates included recycling and yard waste services, except for the areas, in which no such service was provided.
Average residential solid waste rates, for comparative jurisdictions meeting the AB 939 diversion levels, are summarized in Section 4. For the twelve comparable jurisdictions exceeded the AB 939 goal, average residential solid waste rates were $19.24, $23.82, and $29.87, respectively, for 1, 32-gallon can, 2, 32-gallon cans, and 3, 32-gallon cans service levels; and $20.45, $29.27, and $36.78, respectively, for 32-, 64-, and 96-gallon cart service levels.

B. Solid Waste Rate and Service Levels for Jurisdictions Meeting AB 939 Diversion Levels
Exhibit B-1 California County Map
Solid Waste Rate and Service Study El Dorado County
Surveyed jurisdictions meeting AB 939 goals.
B-2 Solid Waste Rate and Service Study

Exhibit B-2 Comparative Jurisdictions With Unincorporated Area Diversion Rates Above Fifty Percent
(As of January 2008)
Solid Waste Rate and Service Study El Dorado County
No. Jurisdiction Characteristics Service Provider(s)
1 Amador County Adjacent county Amador Disposal (Waste Connections), Aces Waste Services
2 Merced County Similar population Waste Management, Gilton Solid Waste Management
3 Monterey County Similar urban/rural mix Waste Management
4 Placer County Similar population,
Adjacent county Auburn Placer Disposal Service, Tahoe-Truckee Sierra Disposal
5 San Luis Obispo County Similar urban/rural mix,
Split regional haulers
Mid State Solid Waste and Recycling, Mission Country Disposal, Morro Bay Garbage, Paso Robles Waste Disposal, San Luis Garbage, San Miguel Garbage, South County Sanitary Service
6 Shasta County Similar climate Anderson-Cottonwood Disposal Services
7 Sutter County Neighboring Norcal (Yuba-Sutter Waste Disposal)
8 Yuba County Neighboring Norcal (Yuba-Sutter Waste Disposal)
9 Town of Truckee Same service provider Tahoe-Truckee Sierra Disposal
10 Solano County Northern California Solano Garbage Company
11 Napa County Similar population Napa Recycling and Waste Services
12 Sonoma County Multiple haulers Larry's Sanitary Service, Industrial Carting, Empire Waste Management, Cloverdale Disposal, Consolidated West Sonoma County Disposal
B-3

B. Solid Waste Rate and Service Levels for Jurisdictions Meeting AB 939 Diversion Levels
Exhibit B-3 Residential Solid Waste Collection Rates for Comparative Jurisdictions With Unincorporated Area Diversion Rates above Fifty Percent
Per customer, per month (As of January 2008)
Solid Waste Rate and Service Study El Dorado County Page 1 of 3
Service Level No. Jurisdiction Company 1, 20-Gallon
Can 1, 20-Gallon
Cart 1, 32-Gallon
Can 1, 32-Gallon
Cart 2, 32-Gallon
Cans 1, 64-Gallon
Cart 3, 32-Gallon
Cans 1, 96-Gallon
Cart
1 Amador County
Franchise Area 1 Amador Disposal/ Waste Connections N/A N/A $18.53 N/A $24.84 N/A $31.15 N/A
Franchise Area 2 Aces Waste Services N/A N/A N/A $14.85 N/A $18.15 N/A $22.25
Franchise Area 3 Aces Waste Services N/A N/A N/A 23.30 N/A 30.00 N/A 31.50
Mean (3 areas) N/A N/A $18.53 $19.08 $24.84 $24.08 $31.15 $26.88
2 Merced County
Franchise Service Area 1 Waste Management N/A N/A N/A N/A N/A $26.08 N/A $38.18
Franchise Service Area 2 Waste Management N/A N/A N/A N/A N/A 25.04 N/A 36.42
Franchise Service Area 3 Waste Management N/A N/A N/A N/A N/A 24.52 N/A 35.53
Franchise Service Area 4 Waste Management N/A N/A N/A N/A N/A 26.08 N/A 38.18
Franchise Service Area 5 Waste Management N/A N/A N/A N/A N/A 26.69 N/A 39.22
Franchise Service Area 6* Gilton Solid Waste Management
N/A N/A $11.26 N/A $11.26 N/A $16.08 16.08
Franchise Service Area 7* Gilton Solid Waste Management
N/A N/A 11.26 N/A 11.26 N/A 16.08 16.08
Mean (7 areas) N/A N/A $11.26 N/A $11.26 $25.68 $16.08 $31.38
3 Monterey County
Northeastern Waste Management N/A $15.14 N/A $17.81 N/A $24.02 N/A $35.61
Western (Carmel Valley)* Waste Management N/A 25.96 $27.77 30.54 $41.45 44.16 $54.45 57.78
Western (Carmel Unincorp.)* Waste Management N/A 23.80 25.78 27.99 39.36 41.62 53.04 55.19
Western (Castroville/ Moss Landing)* Waste Management N/A 16.25 24.03 19.12 36.41 31.50 48.86 43.81
Western (Hwy 68/River Road)* Waste Management N/A 19.85 24.43 23.35 38.11 37.04 51.73 50.66
Western (Unincorp. King City Area)* Waste Management N/A 20.52 25.26 24.15 39.41 38.30 53.49 52.38
Mean (6 areas) N/A $20.25 $25.45 $23.83 $38.95 $36.11 $52.31 $49.24
4 Placer County
Unincorp. County Area* Auburn Placer Disposal Service N/A N/A N/A $16.37 N/A $23.98 N/A $28.62
Mean (1 area) N/A N/A N/A $16.37 N/A $23.98 N/A $28.62
B-4 Solid Waste Rate and Service Study

Exhibit B-3 Residential Solid Waste Collection Rates for Comparative Jurisdictions With Unincorporated Area Diversion Rates above Fifty Percent
Per customer, per month (As of January 2008)
Solid Waste Rate and Service Study El Dorado County (continued) Page 2 of 3
Service Level No. Jurisdiction Company 1, 20-Gallon
Can 1, 20-Gallon
Cart 1, 32-Gallon
Can 1, 32-Gallon
Cart 2, 32-Gallon
Cans 1, 64-Gallon
Cart 3, 32-Gallon
Cans 1, 96-Gallon
Cart
5 San Luis Obispo County
Unincorp. Area 1 South County Sanitary Services
N/A N/A N/A $15.59 N/A $25.76 N/A $35.93
Unincorp. Area 2 South County Sanitary Services
N/A N/A N/A 12.07 N/A 18.85 N/A 25.61
Unincorp. Outside Los Osos CSD
Mission Country Disposal N/A N/A $16.64 N/A $20.76 N/A $25.06 N/A
San Simeon Area Mission Country Disposal N/A N/A 15.40 N/A 25.43 N/A 35.48 N/A
Rural Morro Bay Mission Country Disposal N/A N/A 9.20 N/A 13.78 N/A 13.78 N/A
Unincorp. Urban Paso Robles
Paso Robles Waste Disposal N/A N/A N/A 27.75 N/A 40.55 N/A 53.35
Unincorp. Rural Paso Robles
Paso Robles Waste Disposal N/A N/A N/A 28.75 N/A 41.80 N/A 54.85
Urban Mid-State Solid Waste and Recycling N/A N/A N/A 27.85 N/A 40.70 N/A 53.55
Rural Mid-State Solid Waste and Recycling N/A N/A 28.85 N/A 41.95 N/A 55.05 N/A
Urban San Miguel Garbage N/A N/A 20.35 N/A 27.25 N/A 27,25 N/A
Rural San Miguel Garbage N/A N/A 37.55 N/A 37.55 N/A 37.55 N/A
Unincorp. Area 1* San Luis Garbage N/A $7.25 N/A 11.58 N/A 23.17 N/A 34.74
Unincorp. Area 2 San Luis Garbage N/A N/A 15.81 N/A 26.12 N/A 36.44 N/A
Mean (13 areas) N/A $7.25 $20.54 $20.60 $27.55 $31.81 $33.89 $43.01
6 Shasta County
Unincorp. County Area Anderson-Cottonwood Disposal Services
N/A N/A N/A N/A N/A $19.70 N/A $22.79
Mean (1 area) N/A N/A N/A N/A N/A $19.70 N/A $22.79
7 Sutter County
Unincorp. County Area Norcal (Yuba-Sutter Waste Disposal) N/A N/A N/A $22.55 N/A $33.56 N/A $44.57
Mean (1 area) N/A N/A N/A $22.55 N/A $33.56 N/A $44.57
8 Yuba County
Unincorp. County Area Norcal (Yuba-Sutter Waste Disposal) N/A N/A N/A $22.72 N/A $33.82 N/A $44.92
Mean (1 area) N/A N/A N/A $22.72 N/A $33.82 N/A $44.92
B-5
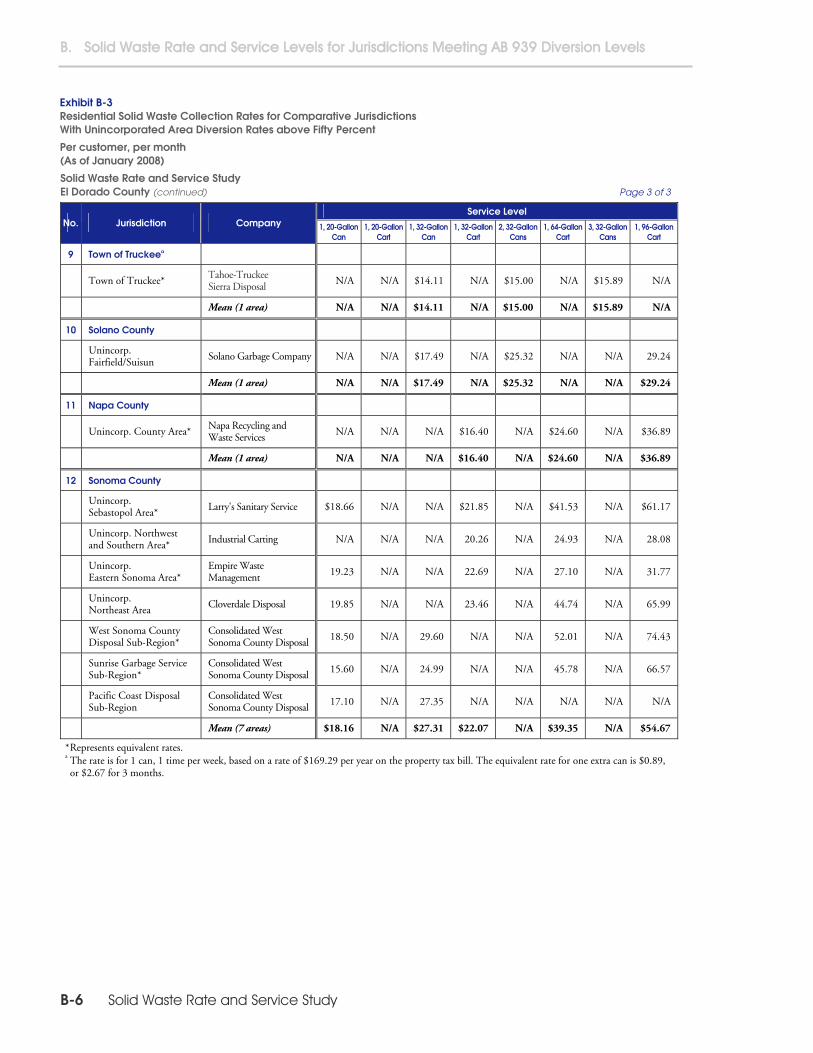
B. Solid Waste Rate and Service Levels for Jurisdictions Meeting AB 939 Diversion Levels
Exhibit B-3 Residential Solid Waste Collection Rates for Comparative Jurisdictions With Unincorporated Area Diversion Rates above Fifty Percent
Per customer, per month (As of January 2008)
Solid Waste Rate and Service Study El Dorado County (continued) Page 3 of 3
Service Level No. Jurisdiction Company 1, 20-Gallon
Can 1, 20-Gallon
Cart 1, 32-Gallon
Can 1, 32-Gallon
Cart 2, 32-Gallon
Cans 1, 64-Gallon
Cart 3, 32-Gallon
Cans 1, 96-Gallon
Cart
9 Town of Truckeea
Town of Truckee* Tahoe-Truckee Sierra Disposal N/A N/A $14.11 N/A $15.00 N/A $15.89 N/A
Mean (1 area) N/A N/A $14.11 N/A $15.00 N/A $15.89 N/A
10 Solano County
Unincorp. Fairfield/Suisun Solano Garbage Company N/A N/A $17.49 N/A $25.32 N/A N/A 29.24
Mean (1 area) N/A N/A $17.49 N/A $25.32 N/A N/A $29.24
11 Napa County
Unincorp. County Area* Napa Recycling and Waste Services N/A N/A N/A $16.40 N/A $24.60 N/A $36.89
Mean (1 area) N/A N/A N/A $16.40 N/A $24.60 N/A $36.89
12 Sonoma County
Unincorp. Sebastopol Area* Larry's Sanitary Service $18.66 N/A N/A $21.85 N/A $41.53 N/A $61.17
Unincorp. Northwest and Southern Area* Industrial Carting N/A N/A N/A 20.26 N/A 24.93 N/A 28.08
Unincorp. Eastern Sonoma Area*
Empire Waste Management 19.23 N/A N/A 22.69 N/A 27.10 N/A 31.77
Unincorp. Northeast Area Cloverdale Disposal 19.85 N/A N/A 23.46 N/A 44.74 N/A 65.99
West Sonoma County Disposal Sub-Region*
Consolidated West Sonoma County Disposal 18.50 N/A 29.60 N/A N/A 52.01 N/A 74.43
Sunrise Garbage Service Sub-Region*
Consolidated West Sonoma County Disposal 15.60 N/A 24.99 N/A N/A 45.78 N/A 66.57
Pacific Coast Disposal Sub-Region
Consolidated West Sonoma County Disposal 17.10 N/A 27.35 N/A N/A N/A N/A N/A
Mean (7 areas) $18.16 N/A $27.31 $22.07 N/A $39.35 N/A $54.67
* Represents equivalent rates. a The rate is for 1 can, 1 time per week, based on a rate of $169.29 per year on the property tax bill. The equivalent rate for one extra can is $0.89, or $2.67 for 3 months.
B-6 Solid Waste Rate and Service Study

Exhibit B-4 Residential Curbside Recycling and Yard Waste Services for Comparative Jurisdictions With Unincorporated Area Diversion Rates above Fifty Percent
(As of January 2008)
Solid Waste Rate and Service Study El Dorado County
Service Type No. Jurisdiction Company Recycling cart size
(gallons) Yard Waste cart size
(gallons)
1 Amador County
Franchise Area 1 Amador Disposal/Waste Connections Blue bag, or 32-gallon cart 96-gallon cart
Franchise Area 2, 3 Aces Waste Services 2 orange bags (30-gallon), or 32-gallon cart, biweekly
96-gallon cart, biweekly
2 Merced County
Franchise Service Area 1, 2, 3, 4, 5
Waste Management 96-gallon cart 96-gallon cart
Franchise Service Area 6, 7 Gilton Solid Waste Management N/A N/A
3 Monterey County
Northeastern Waste Management 64 or 96-gallon cart 64 or 96-gallon cart
Western Waste Management N/A N/A
4 Placer County Auburn Placer Disposal Service Blue bag Not provided in the unincorporated area
5 San Luis Obispo County
Unincorp. Area 1a South County Sanitary Services 64-gallon cart 96-gallon cart
Unincorp. Area 2 South County Sanitary Services Unavailable Unavailable
San Simeon Area Mission Country Disposal 96-gallon cart Unavailable
Unincorp. Urban Paso Robles Paso Robles Waste Disposal 96-gallon cart 96-gallon cart
Unincorp. Rural Paso Robles Paso Robles Waste Disposal 96-gallon cart Unavailable
Urban Mid-State Solid Waste and Recycling 64-gallon cart 96-gallon cart
Rural Mid-State Solid Waste and Recycling 96-gallon cart, biweekly Unavailable
Unincorp. Area 1 San Luis Garbage 64-gallon cart 96-gallon cart
Unincorp. Area 2 San Luis Garbage 64-gallon cart 96-gallon cart
6 Shasta County Anderson-Cottonwood Disposal Services
64-gallon cart One bundle or can (less than 50 lbs.)
7 Sutter County Norcal (Yuba-Sutter Waste Disposal) 64 or 96-gallon cart 96-gallon cart
8 Yuba County Norcal (Yuba-Sutter Waste Disposal) 64 or 96-gallon cart 96-gallon cart
9 Town of Truckee Tahoe-Truckee Sierra Disposal Blue bag (32-gallon) N/A
10 Solano County Solano Garbage Company 65-gallon cart 95-gallon cart
11 Napa County Napa Recycling and Waste Services 95-gallon cart 95-gallon cart
12 Sonoma County
Larry's Sanitary Service, Industrial Carting, Empire Waste Management, Cloverdale Disposal, Consolidated West Sonoma County Disposal
90-gallon cart 90-gallon cart
a Weekly recycling and yard waste services are provided in certain areas only. In some rural areas, no yard waste services are provided.
B-7
B. Solid Waste Rate and Service Levels for Jurisdictions Meeting AB 939 Diversion Levels
[This page intentionally left blank.]
B-8 Solid Waste Rate and Service Study

Appendix C Profitability Projections and
Discounted Profitability Cash Flow Analyses for Franchise Companies
Appendix C Profitability Projections and Discounted Profitability Cash Flow Analyses for Franchise Companies
Exhibits C-1 through C-7, below, provide the County solid waste services franchise agreement valuation models, based on profitability projections, and discounted profitability cash flow analyses, discussed in Section 7, for each of the companies, including
Tahoe-Truckee Sierra Disposal
American River Disposal Service
Amador Disposal Service
Sierra Disposal Service
South Tahoe Refuse Company
El Dorado Disposal Services
Western El Dorado Recovery Systems.
Each model reflected the following two scenario profitability projections:
Financial profitability projection
Allowable profitability projection.
We obtained from the County recent financial statement(s), rate application(s), and/or rate review document(s), for each of the franchise companies. We worked with the County and companies to identify reasonable assumptions for related factors used in the models.
We estimated fifteen-year time period cash flows for both a financial profitability projection and an allowable profitability projection. We discounted projected profitability cash flows to derive the net present values of different franchise terms, for each of the County franchises.
Net present values of the County franchises, are summarized in Table 7-3 and Table 7-4, in Section 7. We valued four different franchise terms, including the current term, a five year term, a ten year term, and a fifteen year term. For example, for a ten year franchise term (at a 6 percent discount factor), net present values range from -$364,122 to $9,733,366 in the financial profitability projection; and range f$178,358 to $5,352,510 in the allowable profitability projection.
rom

C. Profitability Projections and Discounted Profitability Cash Flow Analyses for Franchise Companies
Exhibit C-1 Solid Waste Services Franchise Agreement Valuations Tahoe-Truckee Sierra Disposal
Solid Waste Rate and Service Study El Dorado County
Financial Statement Profita Allowable Profitb
Actualsc, d Projected Actualsc, d Projected
Net Present Value Net Present Value
Franchise Period
Year
Profit Profit Growth Rateg
t 6% 12% Profit Profit Growth
Rategt 6% 12%
1/1/2006–12/31/2006 $9,068 $27,054
1/1/2007–12/31/2007 $16,681 $27,902
1 1/1/2008–12/31/2008 $13,222e 2.70% 0 $13,222 $13,222 $28,220f 2.70% 0 $28,220 $28,220
2 1/1/2009–12/31/2009 $13,579 2.70% 1 $26,032 $25,346 $28,982 2.70% 1 $55,561 $54,096
3 1/1/2010–12/31/2010 $13,946 2.70% 2 $38,444 $36,463 $29,764 2.70% 2 $82,051 $77,824
4 1/1/2011–12/31/2011 $14,322 2.70% 3 $50,469 $46,657 $30,568 2.70% 3 $107,717 $99,582
5 1/1/2012–12/31/2012 $14,709 2.70% 4 $62,120 $56,005 $31,393 2.70% 4 $132,583 $119,533
6 1/1/2013–12/31/2013 $15,106 2.70% 5 $73,408 $64,577 $32,241 2.70% 5 $156,675 $137,827
7 1/1/2014–12/31/2014 $15,514 2.70% 6 $84,344 $72,436 $33,111 2.70% 6 $180,018 $154,603
8 1/1/2015–12/31/2015 $15,933 2.70% 7 $94,940 $79,643 $34,005 2.70% 7 $202,633 $169,985
9 1/1/2016–12/31/2016 $16,363 2.70% 8 $105,206 $86,252 $34,924 2.70% 8 $224,545 $184,090
10 1/1/2017–12/31/2017 $16,805 2.70% 9 $115,153 $92,312 $35,866 2.70% 9 $245,774 $197,024
11 1/1/2018–12/31/2018 $17,258 2.70% 10 $124,790 $97,869 $36,835 2.70% 10 $266,342 $208,884
12 1/1/2019–12/31/2019 $17,724 2.70% 11 $134,127 $102,964 $37,829 2.70% 11 $286,270 $219,759
13 1/1/2020–12/31/2020 $18,203 2.70% 12 $143,173 $107,636 $38,851 2.70% 12 $305,578 $229,731
14 1/1/2021–12/31/2021 $18,694 2.70% 13 $151,938 $111,921 $39,900 2.70% 13 $324,285 $238,875
15 1/1/2022–12/31/2022 $19,199 2.70% 14 $160,430 $115,849 $40,977 2.70% 14 $342,409 $247,259
Projected profit range for 15 year period based on a 6 percent discount rate
$160,430 – $342,409
Projected profit range for 15 year period based on a 12 percent discount rate
$115,849 – $247,259
a The estimated profit can be achieved based on the Company Financial Statement income.
b The estimated profit can be achieved based on an allowable Operating Ratio (OR) for the Company. For this projection for the Company, we used an OR of 90 percent.
c We assumed the profit proportion for the Company's County franchise was only 1.5% of the total in year 2006 and 2007, based on the company provided information.
Source: d Tahoe Truckee Disposal Company, Inc. and Placer County Eastern Regional Sanitary Landfill, Inc. Combined Statements of Income and Retained Earnings for the Years Ended December, 2007 and 2006.
e The $12,874 estimated profit was determined by averaging the prior two year profits.
f The $27,478 estimated profit was determined by averaging the prior two year profits.
g The growth rate was based on the average historical annual County population growth rate.
C-2 Solid Waste Rate and Service Study

Exhibit C-2 Solid Waste Services Franchise Agreement Valuations American River Disposal Service
Solid Waste Rate and Service Study El Dorado County
Financial Statement Profitc Allowable Profitd
Actuale Projected Actuale Projected Net Present Value Net Present Value
Franchise Period Year
Profit Profit Growth Rateh t 6% 12%
Profit Profit Growth Rateh t 6% 12%
7/1/2004–6/30/2005 $58,945 $14,685
7/1/2005–6/30/2006 $72,709 $16,878
7/1/2006–6/30/2007 ($27,776) $28,259
1 7/1/2007–6/30/2008 $35,561f 2.70% 0 $35,561 $35,561 $20,479g 2.70% 0 $20,479 $20,479
2 7/1/2008–6/30/2009a $36,521 2.70% 1 $70,015 $68,169 $21,032 2.70% 1 $40,321 $39,258
3 7/1/2009–6/30/2010 $37,507 2.70% 2 $103,396 $98,070 $21,600 2.70% 2 $59,545 $56,477
4 7/1/2010–6/30/2011 $38,520 2.70% 3 $135,738 $125,488 $22,183 2.70% 3 $78,170 $72,267
5 7/1/2011–6/30/2012 $39,560 2.70% 4 $167,074 $150,629 $22,782 2.70% 4 $96,216 $86,745
6 7/1/2012–6/30/2013 $40,628 2.70% 5 $197,433 $173,682 $23,397 2.70% 5 $113,699 $100,021
7 7/1/2013–6/30/2014 $41,725 2.70% 6 $226,848 $194,821 $24,029 2.70% 6 $130,639 $112,195
8 7/1/2014–6/30/2015 $42,852 2.70% 7 $255,347 $214,205 $24,678 2.70% 7 $147,051 $123,358
9 7/1/2015–6/30/2016 $44,009 2.70% 8 $282,958 $231,980 $25,344 2.70% 8 $162,952 $133,594
10 7/1/2016–6/30/2017 $45,197 2.70% 9 $309,710 $248,278 $26,028 2.70% 9 $178,358 $142,980
11 7/1/2017–6/30/2018 $46,417 2.70% 10 $335,629 $263,223 $26,731 2.70% 10 $193,285 $151,587
12 7/1/2018–6/30/2019 $47,670 2.70% 11 $360,741 $276,927 $27,453 2.70% 11 $207,747 $159,479
13 7/1/2019–6/30/2020 $48,958 2.70% 12 $385,072 $289,493 $28,194 2.70% 12 $221,758 $166,716
14 7/1/2020–6/30/2021 $50,279 2.70% 13 $408,645 $301,016 $28,955 2.70% 13 $235,334 $173,352
15 7/1/2021–6/30/2022b $51,637 2.70% 14 $431,484 $311,582 $29,737 2.70% 14 $248,486 $179,436
Projected profit range for 15 year period based on a 6 percent discount rate $431,484 – $248,486
Projected profit range for 15 year period based on a 12 percent discount rate $311,582 – $179,436
a The current franchise end date was December 31, 2009. For simplicity and calculation purposes, we used Fiscal Year 2009 (June 30, 2009) as the end date here.
b For a 15 year franchise period, the franchise end date was December 31, 2022. For simplicity and calculation purposes, we used Fiscal Year 2022 (June 30, 2022) as the end date here.
c The estimated profit that can be achieved based on the Company Financial Statement income.
d The estimated profit that can be achieved based on an allowable Operating Ratio (OR) for the Company. For this projection for the Company, we used an OR of 90 percent.
Source: e South Tahoe Refuse Company, Inc. Financial Statements June 30, 2006 and 2005, d/b/a/ American River Disposal Service Statements of Income and Retained Earnings for Years Ended June 30, 2006 and 2005 (page 31), d/b/a/ American River Disposal Service Schedules of Operating Revenues for Years Ended June 30, 2006 and 2005 (page 32). South Tahoe Refuse Company, Inc. Financial Statements June 30, 2007 and 2006, d/b/a/ American River Disposal Service Statements of Income and Retained Earnings for Years Ended June 30, 2007 and 2006 (page 34), d/b/a/ American River Disposal Service Schedules of Operating Revenues for Years Ended June 30, 2007 and 2006 (page 35).
f The $35,561 estimated profit was determined by applying the 2.7% growth rate to the prior three year average profits.
g The $20,479 estimated profit was determined by applying the 2.7% growth rate to the prior three year average profits.
h The growth rate was based on the average historical annual County population growth rate.
C-3

C. Profitability Projections and Discounted Profitability Cash Flow Analyses for Franchise Companies
Exhibit C-3 Solid Waste Services Franchise Agreement Valuations Amador Disposal Service
Solid Waste Rate and Service Study El Dorado County
Financial Statement Profita Allowable Profitb
Actualc,d Projected Actualc,d Projected
Net Present Value Net Present Value
Franchise Period
Year
Profit Profit Growth Ratee
t 6% 12% Profit Profit Growth
Rateet 6% 12%
1 7/1/2007–6/30/2008 $90,585 0 $90,585 $90,585 $67,403 0 $67,403 $67,403
2 7/1/2008–6/30/2009 $93,031 2.70% 1 $178,350 $173,648 $69,223 2.70% 1 $132,708 $129,210
3 7/1/2009–6/30/2010 $95,543 2.70% 2 $263,382 $249,814 $71,092 2.70% 2 $195,980 $185,884
4 7/1/2010–6/30/2011 $98,122 2.70% 3 $345,768 $319,656 $73,012 2.70% 3 $257,283 $237,853
5 7/1/2011–6/30/2012 $100,722 2.70% 4 $425,588 $383,698 $74,983 2.70% 4 $316,676 $285,506
6 7/1/2012–6/30/2013 $103,492 2.70% 5 $502,924 $442,422 $77,008 2.70% 5 $374,221 $329,202
7 7/1/2013–6/30/2014 $106,287 2.70% 6 $577,852 $496,270 $79,087 2.70% 6 $429,974 $369,270
8 7/1/2014–6/30/2015 $109,156 2.70% 7 $650,447 $545,647 $81,222 2.70% 7 $483,992 $406,011
9 7/1/2015–6/30/2016 $112,104 2.70% 8 $720,782 $590,924 $83,415 2.70% 8 $536,327 $439,701
10 7/1/2016–6/30/2017 $115,130 2.70% 9 $788,928 $632,441 $85,667 2.70% 9 $587,034 $470,594
11 7/1/2017–6/30/2018 $118,239 2.70% 10 $854,952 $670,511 $87,981 2.70% 10 $636,162 $498,921
12 7/1/2018–6/30/2019 $121,431 2.70% 11 $918,921 $705,420 $90,356 2.70% 11 $683,760 $524,896
13 7/1/2019–6/30/2020 $124,710 2.70% 12 $980,898 $737,430 $92,796 2.70% 12 $729,877 $548,714
14 7/1/2020–6/30/2021 $128,077 2.70% 13 $1,040,945 $766,782 $95,301 2.70% 13 $774,558 $570,555
15 7/1/2021–6/30/2022 $131,535 2.70% 14 $1,099,123 $793,696 $97,874 2.70% 14 $817,847 $590,582
Projected profit range for 15 year period based on a 6 percent discount rate
$1,099,123 – $817,847
Projected profit range for 15 year period based on a 12 percent discount rate
$793,696 – $590,582
a The estimated profit that can be achieved based on the Company Financial Statement income.
b The estimated profit that can be achieved based on an allowable Operating Ratio (OR) for the Company. For this projection for the Company, we used an OR of 90 percent.
c Company provided projection for Fiscal Year 2008 based upon Fiscal Year 2007 results.
Source: d Amador Disposal Service, Inc., El Dorado County Collection Operations Schedule of Revenues and Expenses, Projection for the Year Ended June 30, 2008.
e The growth rate was based on the average historical annual County population growth rate.
C-4 Solid Waste Rate and Service Study

Exhibit C-4 Solid Waste Services Franchise Agreement Valuations Sierra Disposal Service
Solid Waste Rate and Service Study El Dorado County
Financial Statement Profitc Allowable Profitd
Actuale Projected Actualf Projected Net Present Value Net Present Value
Franchise Period
Year Profit Profit Growth
Rateit 6% 12%
Profit Profit Growth Ratei
t 6% 12%
7/1/2004–6/30/2005 ($83,196) $189,602
7/1/2005–6/30/2006 ($14,511) $192,189
7/1/2006–6/30/2007 ($62,458) $207,261
1 7/1/2007–6/30/2008 ($51,947)g 2.70% 0 ($51,947) ($51,947) $201,652h 2.70% 0 $201,652 $201,652
2 7/1/2008–6/30/2009a ($50,544) 2.70% 1 ($99,630) ($97,075) $207,097 2.70% 1 $397,027 $386,560
3 7/1/2009–6/30/2010 ($49,179) 2.70% 2 ($143,399) ($136,281) $212,688 2.70% 2 $586,319 $556,114
4 7/1/2010–6/30/2011 ($47,851) 2.70% 3 ($183,576) ($170,340) $218,431 2.70% 3 $769,717 $711,589
5 7/1/2011–6/30/2012 ($46,559) 2.70% 4 ($220,455) ($199,930) $224,329 2.70% 4 $947,407 $854,154
6 7/1/2012–6/30/2013 ($45,302) 2.70% 5 ($254,308) ($225,635) $230,386 2.70% 5 $1,119,564 $984,881
7 7/1/2013–6/30/2014 ($44,079) 2.70% 6 ($285,382) ($247,967) $236,606 2.70% 6 $1,286,362 $1,104,753
8 7/1/2014–6/30/2015 ($42,889) 2.70% 7 ($313,906) ($267,368) $242,994 2.70% 7 $1,447,967 $1,214,671
9 7/1/2015–6/30/2016 ($41,731) 2.70% 8 ($340,088) ($284,223) $249,555 2.70% 8 $1,604,541 $1,315,462
10 7/1/2016–6/30/2017 ($40,604) 2.70% 9 ($364,122) ($298,865) $256,293 2.70% 9 $1,756,241 $1,407,884
11 7/1/2017–6/30/2018 ($39,508) 2.70% 10 ($386,183) ($311,586) $263,213 2.70% 10 $1,903,218 $1,492,632
12 7/1/2018–6/30/2019 ($38,441) 2.70% 11 ($406,433) ($322,636) $270,320 2.70% 11 $2,045,619 $1,570,342
13 7/1/2019–6/30/2020 ($37,403) 2.70% 12 ($425,022) ($332,237) $277,618 2.70% 12 $2,183,587 $1,641,600
14 7/1/2020–6/30/2021 ($36,393) 2.70% 13 ($442,084) ($340,577) $285,114 2.70% 13 $2,317,259 $1,706,941
15 7/1/2021–6/30/2022b ($35,411) 2.70% 14 ($457,747) ($347,823) $292,812 2.70% 14 $2,446,770 $1,766,856
Projected profit range for 15 year period based on a 6 percent discount rate
($457,747) – $2,446,770
Projected profit range for 15 year period based on a 12 percent discount rate
($347,823) – $1,766,856
a The current franchise end date was December 31, 2009. For simplicity and calculation purposes, we used Fiscal Year 2009 (June 30, 2009) as the end date here.
b For a 15 year franchise period, the franchise end date was December 31, 2022. For simplicity and calculation purposes, we used Fiscal Year 2022 (June 30, 2022) as the end date here.
c The estimated profit that can be achieved based on the Company Financial Statement income.
d The estimated profit that can be achieved based on an allowable Operating Ratio (OR) for the Company. For this projection for the Company, we used an OR of 90 percent.
Source: e South Tahoe Refuse Company, Inc. Financial Statements June 30, 2006 and 2005, d/b/a/ Sierra Disposal Service Statements of Operation and Accumulated Deficit for Years Ended June 30, 2006 and 2005 (page 37), d/b/a/ Sierra Disposal Service Schedules of Operating Revenues for Years Ended June 30, 2006 and 2005 (page 38). South Tahoe Refuse Company, Inc. Financial Statements June 30, 2007 and 2006, d/b/a/ Sierra Disposal Service Statements of Operation and Accumulated Deficit for Years Ended June 30, 2007 and 2006 (page 40), d/b/a/ Sierra Disposal Service Schedules of Operating Revenues for Years Ended June 30, 2007 and 2006 (page 41).
f Sierra Disposal Service Rate Review Final Report for Fiscal Year 2007, Exhibit 2.
g The -$51,947 estimated profit was determined by applying the 2.7% growth rate on the prior three year average profits.
h The $201,652 estimated profit was determined by applying the 2.7% growth rate on the prior three year average profits.
i The growth rate was based on the average historical annual County population growth rate.
C-5

C. Profitability Projections and Discounted Profitability Cash Flow Analyses for Franchise Companies
Exhibit C-5 Solid Waste Services Franchise Agreement Valuations South Tahoe Refuse Company
Solid Waste Rate and Service Study El Dorado County
Financial Statement Profitc Allowable Profitd
Actuale Projected Actualf Projected Net Present Value Net Present Value
Franchise Period
Year Profit Profit Growth
Rateit 6% 12%
Profit Profit Growth Ratei
t 6% 12%
7/1/2004–6/30/2005 $148,983 –
7/1/2005–6/30/2006 $168,469 $201,344
7/1/2006–6/30/2007 $147,872 $204,917 1 7/1/2007–6/30/2008 $159,296g 2.70% 0 $159,296 $159,296 $208,615h 2.70% 0 $208,615 $208,615
2 7/1/2008–6/30/2009a $163,597 2.70% 1 $313,633 $305,365 $214,247 2.70% 1 $410,735 $399,907
3 7/1/2009–6/30/2010 $168,014 2.70% 2 $463,164 $439,304 $220,032 2.70% 2 $606,563 $575,315
4 7/1/2010–6/30/2011 $172,550 2.70% 3 $608,041 $562,122 $225,973 2.70% 3 $796,294 $736,158
5 7/1/2011–6/30/2012 $177,209 2.70% 4 $748,407 $674,742 $232,074 2.70% 4 $980,119 $883,646
6 7/1/2012–6/30/2013 $181,994 2.70% 5 $884,404 $778,010 $238,340 2.70% 5 $1,158,220 $1,018,886
7 7/1/2013–6/30/2014 $186,908 2.70% 6 $1,016,166 $872,703 $244,775 2.70% 6 $1,330,777 $1,142,897
8 7/1/2014–6/30/2015 $191,954 2.70% 7 $1,143,827 $959,534 $251,384 2.70% 7 $1,497,962 $1,256,611
9 7/1/2015–6/30/2016 $197,137 2.70% 8 $1,267,513 $1,039,154 $258,172 2.70% 8 $1,659,942 $1,360,882
10 7/1/2016–6/30/2017 $202,460 2.70% 9 $1,387,349 $1,112,163 $265,142 2.70% 9 $1,816,880 $1,456,495
11 7/1/2017–6/30/2018 $207,926 2.70% 10 $1,503,454 $1,179,110 $272,301 2.70% 10 $1,968,931 $1,544,169
12 7/1/2018–6/30/2019 $213,540 2.70% 11 $1,615,944 $1,240,497 $279,653 2.70% 11 $2,116,249 $1,624,562
13 7/1/2019–6/30/2020 $219,306 2.70% 12 $1,724,932 $1,296,788 $287,204 2.70% 12 $2,258,981 $1,698,281
14 7/1/2020–6/30/2021 $225,227 2.70% 13 $1,830,527 $1,348,404 $294,958 2.70% 13 $2,397,269 $1,765,877
15 7/1/2021–6/30/2022b $231,308 2.70% 14 $1,932,835 $1,395,734 $302,922 2.70% 14 $2,531,252 $1,827,861
Projected profit range for 15 year period based on a 6 percent discount rate $1,932,835 – $2,531,252
Projected profit range for 15 year period based on a 12 percent discount rate
$1,395,734 – $1,827,861
a The current franchise end date was December 31, 2009. For simplicity and calculation purposes, we used Fiscal Year 2009 (June 30, 2009) as the end date here.
b For a 15 year franchise period, the franchise end date was December 31, 2022. For simplicity and calculation purposes, we used Fiscal Year 2022 (June 30, 2022) as the end date here.
c The estimated profit that can be achieved based on the Company Financial Statement income.
d The estimated profit that can be achieved based on an allowable Operating Ratio (OR) for the Company. For this projection for the Company, we used an OR of 90 percent.
Source: e South Tahoe Refuse Company, Inc. Financial Statements June 30, 2006 and 2005, d/b/a/ South Tahoe Refuse Company Statements of Income and Retained Earnings for Years Ended June 30, 2006 and 2005 (page 25), d/b/a/ South Tahoe Refuse Company Schedules of Operating Revenues for Years Ended June 30, 2006 and 2005 (page 26). South Tahoe Refuse Company, Inc. Financial Statements June 30, 2007 and 2006, d/b/a/ South Tahoe Refuse Company Statements of Income and Retained Earnings for Years Ended June 30, 2007 and 2006 (page 28), d/b/a/ South Tahoe Refuse Company Schedules of Operating Revenues for Years Ended June 30, 2007 and 2006 (page 29).
f South Tahoe Refuse Rate Review Final Report for Fiscal Year 2007, Exhibit 1: Revenue Requirement Calculation (page 22).
g The $159,296 estimated profit was determined by applying the 2.7% growth rate on the prior three year average profits.
h The $208,615 estimated profit was determined by applying the 2.7% growth rate on the prior three year average profits.
i The growth rate was based on the average historical annual County population growth rate.
C-6 Solid Waste Rate and Service Study

Exhibit C-6 Solid Waste Services Franchise Agreement Valuations El Dorado Disposal Services
Solid Waste Rate and Service Study El Dorado County
Financial Statement Profita Allowable Profitb
Actualc,e Projected Actualc,d Projected
Net Present Value Net Present Value
Franchise Period
Year
Profit Profit Growth Ratee
t 6% 12% Profit Profit Growth
Ratee
t 6% 12%
1/1/2007–12/31/2007 $512,743 $598,420
1 1/1/2008–12/31/2008 $526,587 2.70% 0 $526,587 $526,587 $614,577 2.70% 0 $614,577 $614,577
2 1/1/2009–12/31/2009 $540,805 2.70% 1 $1,036,781 $1,009,449 $631,171 2.70% 1 $1,210,021 $1,178,122
3 1/1/2010–12/31/2010 $555,407 2.70% 2 $1,531,091 $1,452,216 $648,212 2.70% 2 $1,786,928 $1,694,873
4 1/1/2011–12/31/2011 $570,403 2.70% 3 $2,010,012 $1,858,217 $665,714 2.70% 3 $2,345,874 $2,168,716
5 1/1/2012–12/31/2012 $585,804 2.70% 4 $2,474,024 $2,230,506 $683,688 2.70% 4 $2,887,420 $2,603,212
6 1/1/2013–12/31/2013 $601,620 2.70% 5 $2,923,589 $2,571,882 $702,148 2.70% 5 $3,412,105 $3,001,629
7 1/1/2014–12/31/2014 $617,864 2.70% 6 $3,359,159 $2,884,911 $721,106 2.70% 6 $3,920,457 $3,366,964
8 1/1/2015–12/31/2015 $634,547 2.70% 7 $3,781,169 $3,171,948 $740,576 2.70% 7 $4,412,982 $3,701,963
9 1/1/2016–12/31/2016 $651,679 2.70% 8 $4,190,040 $3,435,150 $760,571 2.70% 8 $4,890,174 $4,009,145
10 1/1/2017–12/31/2017 $669,275 2.70% 9 $4,586,183 $3,676,497 $781,107 2.70% 9 $5,352,510 $4,290,820
11 1/1/2018–12/31/2018 $687,345 2.70% 10 $4,969,993 $3,897,804 $802,197 2.70% 10 $5,800,452 $4,549,106
12 1/1/2019–12/31/2019 $705,903 2.70% 11 $5,341,854 $4,100,734 $823,856 2.70% 11 $6,234,449 $4,785,945
13 1/1/2020–12/31/2020 $724,963 2.70% 12 $5,702,138 $4,286,814 $846,100 2.70% 12 $6,654,935 $5,003,118
14 1/1/2021–12/31/2021 $744,537 2.70% 13 $6,051,206 $4,457,443 $868,945 2.70% 13 $7,062,330 $5,202,257
15 1/1/2022–12/31/2022 $764,639 2.70% 14 $6,389,407 $4,613,903 $892,406 2.70% 14 $7,457,042 $5,384,861
Projected profit range for 15 year period based on a 6 percent discount rate
$6,389,407 – $7,457,042
Projected profit range for 15 year period based on a 12 percent discount rate
$4,613,903 – $5,384,861
a The estimated profit that can be achieved based on the Company Financial Statement income.
b The estimated profit that can be achieved based on an allowable Operating Ratio (OR) for the Company. For this projection for the Company, we used an OR of 90 percent.
c El Dorado Disposal Services provides services to four areas in California, which include the western unincorporated portion of El Dorado County, Cameron Park Community Services District, the City of Placerville and the El Dorado Hills Community Services District. We assumed the profit proportion for the Company's County franchise was 53 percent of the total in year 2007 by using the company provided tonnage data as the basis for the assumption.
Source: d El Dorado Disposal Services, Inc. Financial Statement for Year Ending December 31, 2007.
e The growth rate was based on the average historical annual County population growth rate.
C-7

C. Profitability Projections and Discounted Profitability Cash Flow Analyses for Franchise Companies
Exhibit C-7 Solid Waste Services Franchise Agreement Valuations Western El Dorado Recovery Systems
Solid Waste Rate and Service Study El Dorado County
Financial Statement Profita Allowable Profitb
Actualc,d Projected Actualc,d Projected Net Present Value Net Present Value
Franchise Period
Year Profit Profit Growth
Rateet 6% 12%
Profit Profit Growth Ratee
t 6% 12%
1/1/2007–12/31/2007 $1,088,207 $481,906
1 1/1/2008–12/31/2008 $1,117,589 2.70% 0 $1,117,589 $1,117,589 $494,918 2.70% 0 $494,918 $494,918
2 1/1/2009–12/31/2009 $1,147,764 2.70% 1 $2,200,385 $2,142,378 $508,281 2.70% 1 $974,428 $948,740
3 1/1/2010–12/31/2010 $1,178,753 2.70% 2 $3,249,471 $3,082,073 $522,004 2.70% 2 $1,439,010 $1,364,878
4 1/1/2011–12/31/2011 $1,210,580 2.70% 3 $4,265,897 $3,943,739 $536,098 2.70% 3 $1,889,128 $1,746,463
5 1/1/2012–12/31/2012 $1,243,265 2.70% 4 $5,250,679 $4,733,857 $550,573 2.70% 4 $2,325,234 $2,096,362
6 1/1/2013–12/31/2013 $1,276,833 2.70% 5 $6,204,803 $5,458,366 $565,438 2.70% 5 $2,747,762 $2,417,207
7 1/1/2014–12/31/2014 $1,311,308 2.70% 6 $7,129,224 $6,122,716 $580,705 2.70% 6 $3,157,136 $2,711,410
8 1/1/2015–12/31/2015 $1,346,713 2.70% 7 $8,024,865 $6,731,900 $596,384 2.70% 7 $3,553,766 $2,981,184
9 1/1/2016–12/31/2016 $1,383,074 2.70% 8 $8,892,623 $7,290,501 $612,487 2.70% 8 $3,938,048 $3,048,313
10 1/1/2017–12/31/2017 $1,420,417 2.70% 9 $9,733,366 $7,802,718 $629,024 2.70% 9 $4,310,366 $3,455,389
11 1/1/2018–12/31/2018 $1,458,769 2.70% 10 $10,547,935 $8,272,402 $646,008 2.70% 10 $4,671,093 $3,663,387
12 1/1/2019–12/31/2019 $1,498,155 2.70% 11 $11,337,144 $8,703,086 $663,450 2.70% 11 $5,020,590 $3,854,113
13 1/1/2020–12/31/2020 $1,538,606 2.70% 12 $12,101,784 $9,098,008 $681,363 2.70% 12 $5,359,207 $4,029,001
14 1/1/2021–12/31/2021 $1,580,148 2.70% 13 $12,842,619 $9,460,137 $699,760 2.70% 13 $5,687,281 $4,189,368
15 1/1/2022–12/31/2022 $1,622,812 2.70% 14 $13,560,391 $9,792,196 $718,653 2.70% 14 $6,005,142 $4,336,419
Projected profit range for 15 year period based on a 6 percent discount rate
$13,560,391 – $6,005,142
Projected profit range for 15 year period based on a 12 percent discount rate
$9,792,196 – $4,336,419
a The estimated profit that can be achieved based on the Company Financial Statement income.
b The estimated profit that can be achieved based on an allowable Operating Ratio (OR) for the Company. For this projection for the Company, we used an OR of 90 percent.
c Same as El Dorado Disposal Services valuation, we assumed a 53 percent profit proportion for WERS's County franchise profits in year 2007.
Source: d Western El Dorado Recovery Systems, Inc. Financial Statement for Year Ending December 31, 2007.
e The growth rate was based on the average historical annual County population growth rate.
C-8 Solid Waste Rate and Service Study

Prouldy serving our clients for thirteen years
1995 ~ 2008