
Automatic Particle Counting in Greases: STLE2015 Presentation by Rich Wurzbach

C 2005 HORIBA, Ltd. All rights reserved.
Solid Particle Counting SystemSPCS
Cambridge Particle Conference22nd May 2006

C 2005 HORIBA, Ltd. All rights reserved.
PMP : Solid Particle Number Counting
! With the increasing interest in the health effects of particulate emissions and continuing reduction of levels of emission, the PMP (Particulate Measurement Program) was initiated to makea complete review the principles and methods of particulate measurement
! Following the phases of literature study, review of candidate systems and a program of testing/validation, two methods wereselected to be used in a global correlation exercise– Filter based gravimetric measurement from diluted exhaust as current
legislation, with improvements along the lines specified by EPA for 2007HDD (heated sampling, particle size classification etc)
– Counting the number of solid particles emitted from the vehicle
! Draft requirements and regulations were issued for instrument developers and testing authorities / laboratories

C 2005 HORIBA, Ltd. All rights reserved.
Solid Particle Number Counting
0
0.02
0.04
0.06
0.08
0.1
0.12
0.14
0.16
0.18
0.2
0.001 0.010 0.100 1.000 10.000Diameter (µµµµm)
Nor
mal
ized
Con
cent
ratio
n,
dC/C
tota
l/d
logD
p
Mass Weighting Number Weighting
NucleiMode
AccumulationMode
CoarseMode
Volatile particles formed in dilution process
Reference: Kittelson D. B., J. Aerosol Sci., 28: 575-580, 1998
Measuring range on SPCS
(23 nm ~ 2.5 to 10 µm)
C 2005 HORIBA, Ltd. All rights reserved.
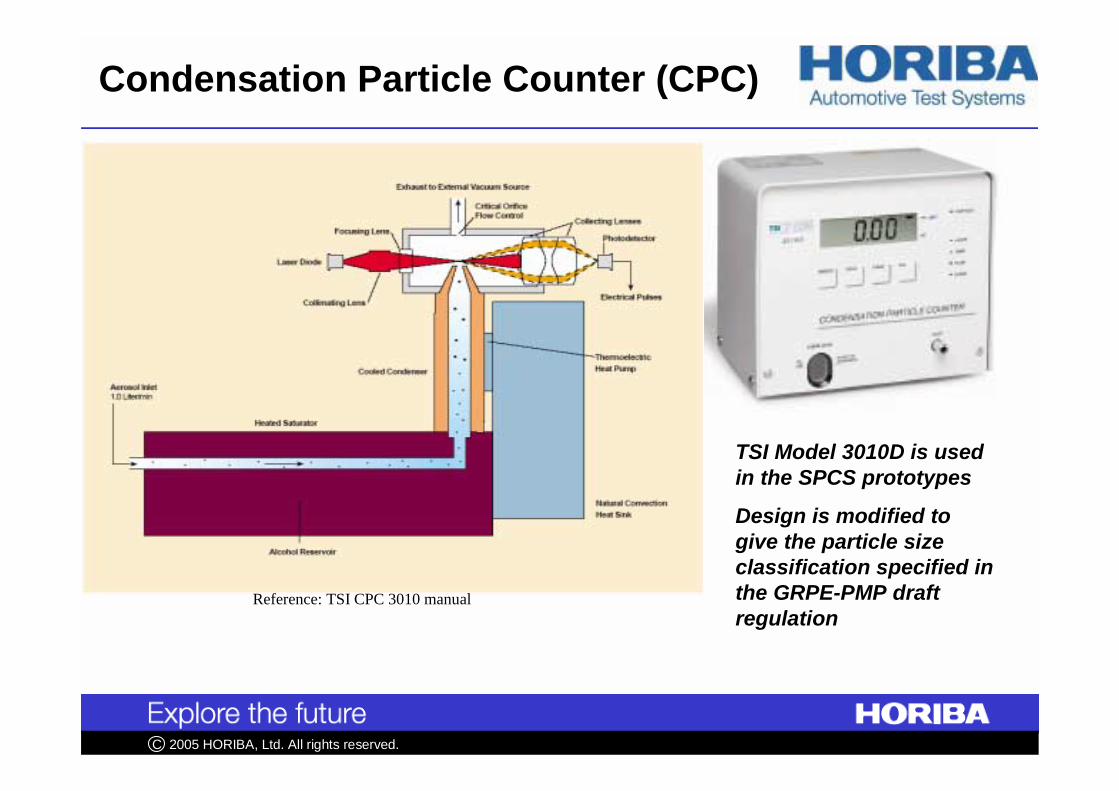
Condensation Particle Counter (CPC)
Reference: TSI CPC 3010 manual
TSI Model 3010D is used in the SPCS prototypes
Design is modified to give the particle size classification specified in the GRPE-PMP draft regulation
C 2005 HORIBA, Ltd. All rights reserved.
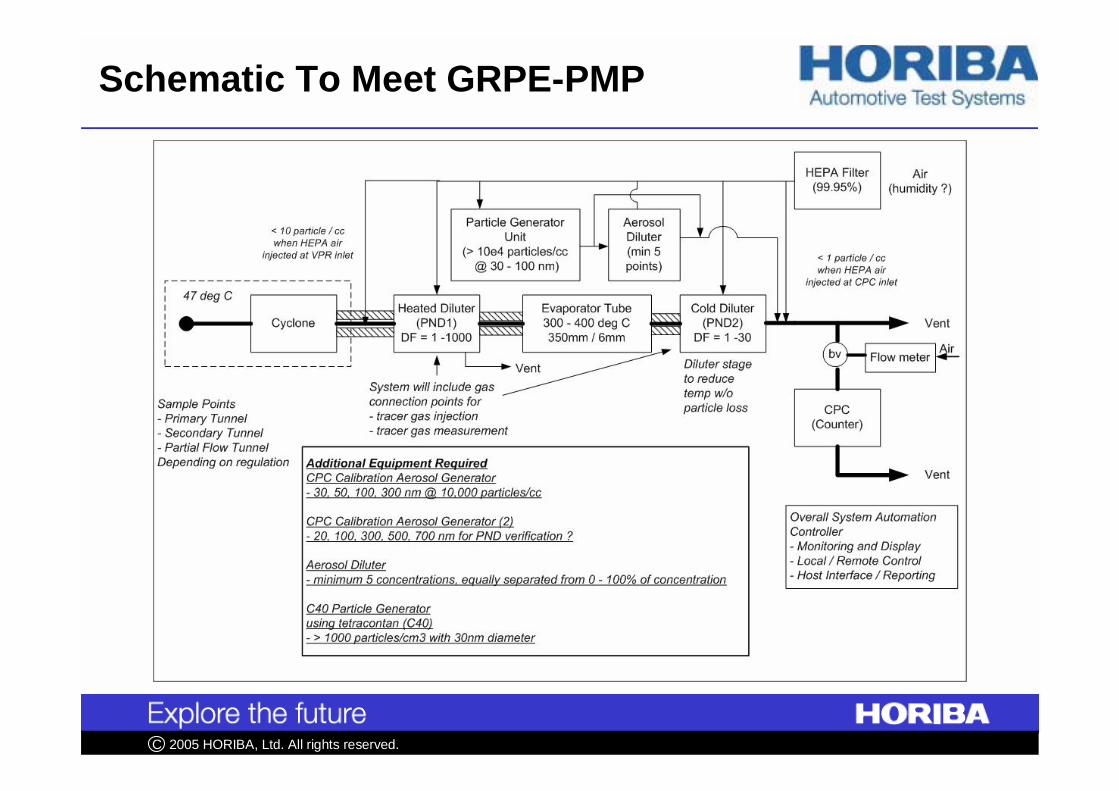
Schematic To Meet GRPE-PMP
C 2005 HORIBA, Ltd. All rights reserved.
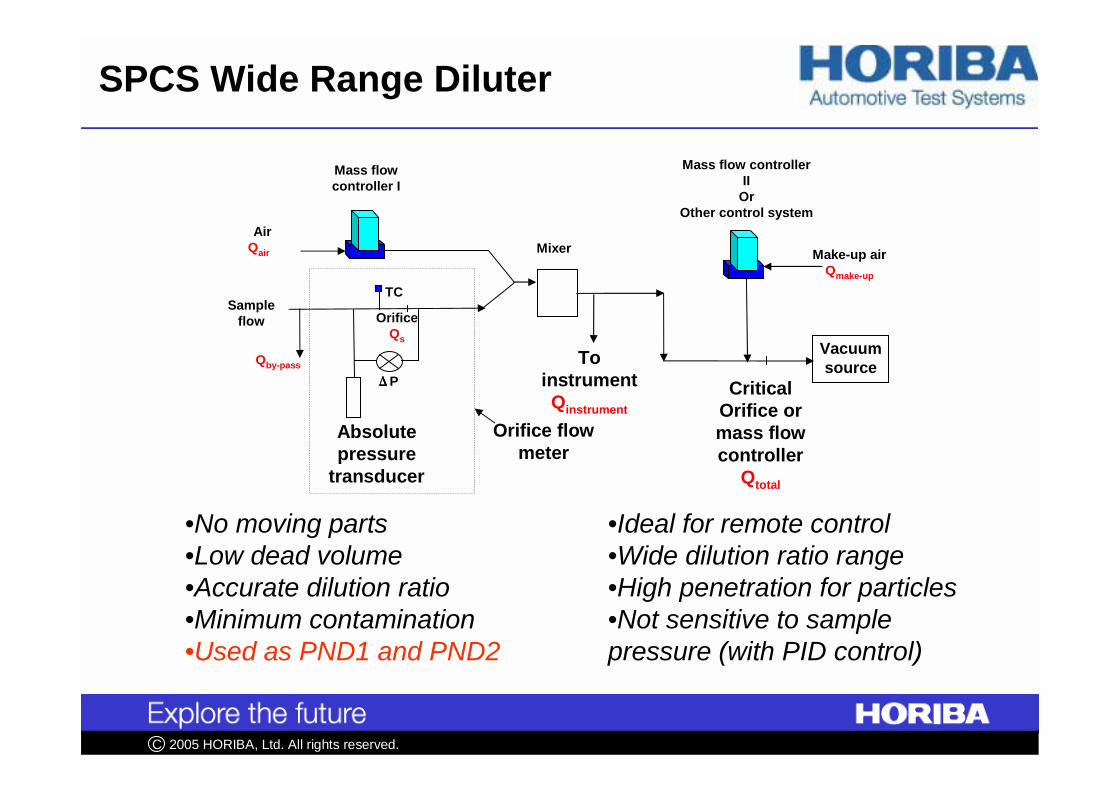
SPCS Wide Range Diluter
Qby-pass
Mixer
Absolute pressure
transducer
Sample flow
Make-up airQmake-up
ΔΔΔΔP
Orifice Qs
Critical Orifice or mass flow controller
Qtotal
TC
Vacuum source
AirQair
Mass flow controller I
Mass flow controller II
Or Other control system
To instrumentQinstrument
Orifice flow meter
•No moving parts•Low dead volume•Accurate dilution ratio•Minimum contamination•Used as PND1 and PND2
•Ideal for remote control•Wide dilution ratio range•High penetration for particles•Not sensitive to sample pressure (with PID control)

C 2005 HORIBA, Ltd. All rights reserved.
Prototype System Appearance
Front Back

C 2005 HORIBA, Ltd. All rights reserved.
Fully Automated Control on Prototype
• Control and data acquisition with NI Fieldpoint process I/O and Labviewsoftware
• Automated operations including check functions
• Configurable data log
• Data log rate up to 5 Hz
• Real-time dilution ratios
• Easy to operate

C 2005 HORIBA, Ltd. All rights reserved.
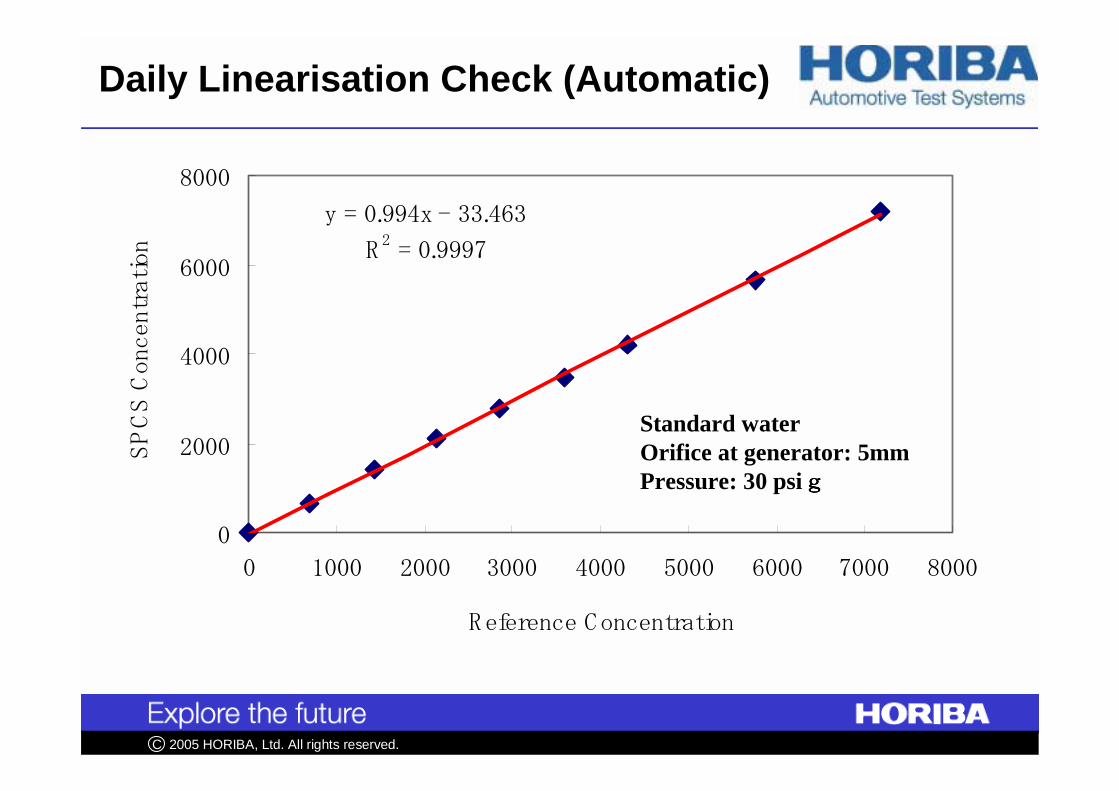
Key Requirements For SPCS(PMP specifications)! Daily linearity check, using particle generator and
particle gas divider (R2 > 0.95)! Confirmation of the dilution ratios (+/- 10%)
– Using gas tracer method and actual single size particles! Removal of particles from volatile HCs (> 90 %)
– Using tetracontan (C40) vaporiser into Evaporation Tube! Low losses of solid particles (< 10 %)
– Using particle generator and single particle size selection to confirm the solid particle penetration through the system at various sizes
C 2005 HORIBA, Ltd. All rights reserved.
Daily Linearisation Check (Automatic)
y = 0.994x - 33.463
R2 = 0.9997
0
2000
4000
6000
8000
0 1000 2000 3000 4000 5000 6000 7000 8000
Reference Concentration
SPCS Concentration
Standard waterOrifice at generator: 5mmPressure: 30 psigggg
C 2005 HORIBA, Ltd. All rights reserved.
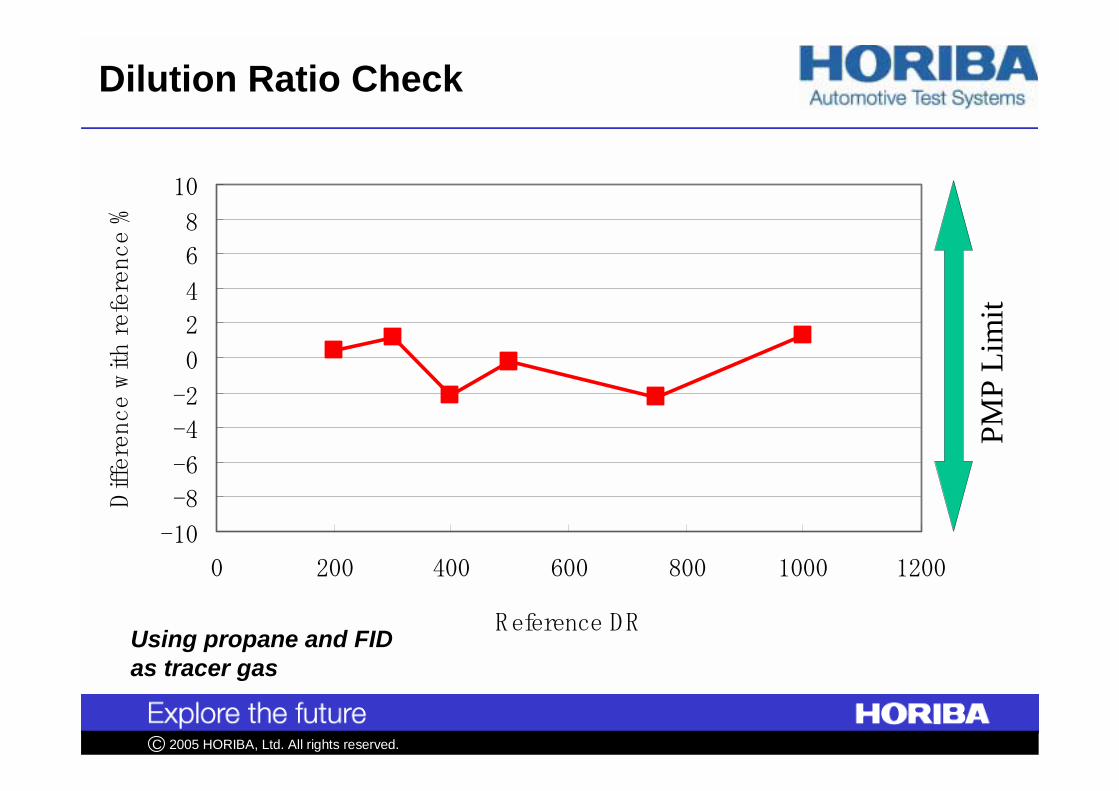
Dilution Ratio Check
-10
-8
-6
-4
-2
0
2
4
6
8
10
0 200 400 600 800 1000 1200
Reference DR
Difference with reference %
Using propane and FIDas tracer gas
PMP
Lim
it

C 2005 HORIBA, Ltd. All rights reserved.
Removal Of Volatile HC ParticlesEvaporation Tube Temperature Dependency
-40000
0
40000
80000
120000
160000
0 200 400 600 800 1000 1200
Tim e sec
Particle N
umbe
r
220 C200C
175C
150C 150C
C40 concentration (100 nm particles) downstream of EU as the function of temperature set point
C 2005 HORIBA, Ltd. All rights reserved.
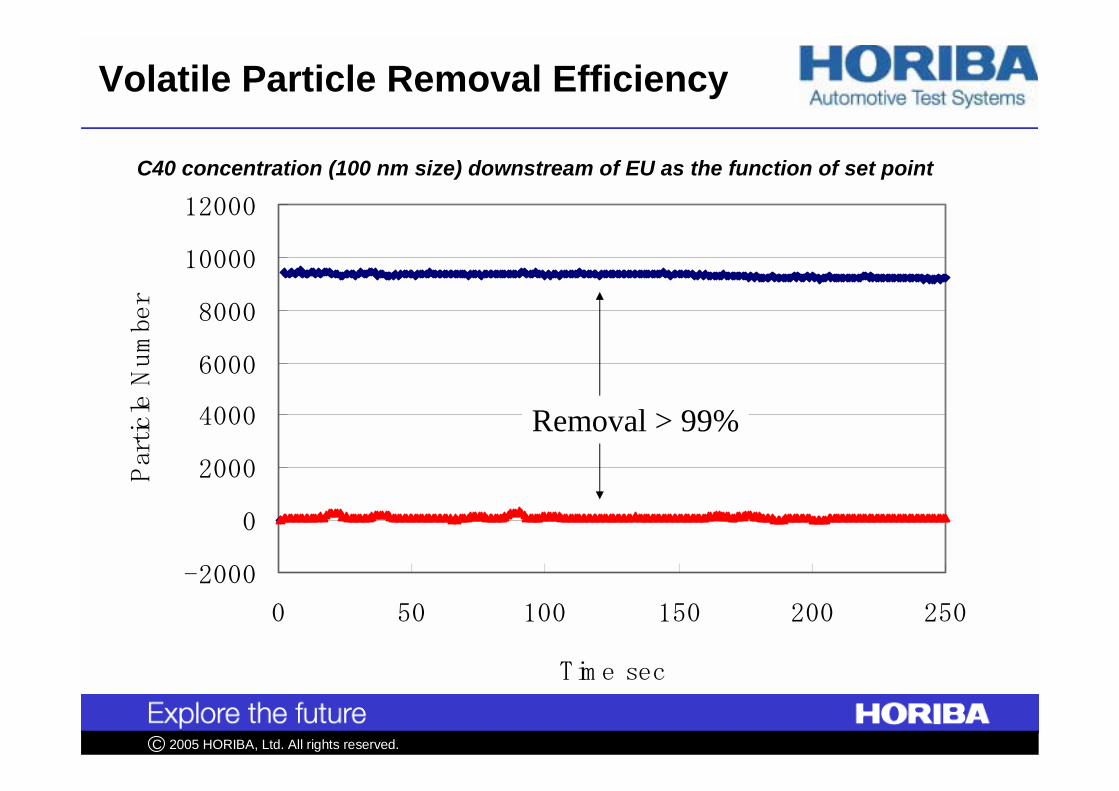
Volatile Particle Removal Efficiency
-2000
0
2000
4000
6000
8000
10000
12000
0 50 100 150 200 250
Tim e sec
Particle Numbe
rC40 concentration (100 nm size) downstream of EU as the function of set point
Removal > 99%

C 2005 HORIBA, Ltd. All rights reserved.
Particle Losses In SPCS
1.E+02
1.E+03
1.E+04
1.E+05
1.E+06
1.E+07
1 10 100 1000
Log Dp
dN/dL
ogD
p
R aw
DR 500
DR 750
DR 1000
20x2530x2540x25
Penetration > 98%

C 2005 HORIBA, Ltd. All rights reserved.
Initial Testing, Diesel On Chassis Dyno
0.0E+00
2.0E+06
4.0E+06
6.0E+06
8.0E+06
1.0E+07
1.2E+07
1.4E+07
1.6E+07
1.8E+07
2.0E+07
0 200 400 600 800 1000 1200
Time [s]
Solid
par
ticle
con
cent
ratio
n in
CVS
[p
art/c
c]
-60
-40
-20
0
20
40
60
80
100
120
140
Spee
d [k
m/h
]
Day I, Conc Day II, Conc Day III, Conc Day I, Speed Day II, Speed Day III, Speed
Total dilution RatioTotal dilution Ratio::::::::1250(50x25)1250(50x25)
0.0E+00
2.0E+06
4.0E+06
6.0E+06
8.0E+06
1.0E+07
1.2E+07
1.4E+07
1.6E+07
1.8E+07
2.0E+07
600 650 700 750 800
Time [s]
Solid
par
ticle
con
cent
ratio
n in
CVS
[p
art/c
c]
-60
-40
-20
0
20
40
60
80
100
120
140
Spee
d [k
m/h
]
Day I, Conc Day II, Conc Day III, Conc Day I, Speed Day II, Speed Day III, Speed
Diesel vehicle (1997)Diesel vehicle (1997)
C onc.(part/km )C onc.(part/km )C onc.(part/km )C onc.(part/km ) difference(%)difference(%)difference(%)difference(%)DayⅠDayⅠDayⅠDayⅠ 4.837E+134.837E+134.837E+134.837E+13 0.00%0.00%0.00%0.00%DayⅡDayⅡDayⅡDayⅡ 4.898E+134.898E+134.898E+134.898E+13 1.26%1.26%1.26%1.26%DayⅢDayⅢDayⅢDayⅢ 4.833E+134.833E+134.833E+134.833E+13 -0.08%-0.08%-0.08%-0.08%
C 2005 HORIBA, Ltd. All rights reserved.
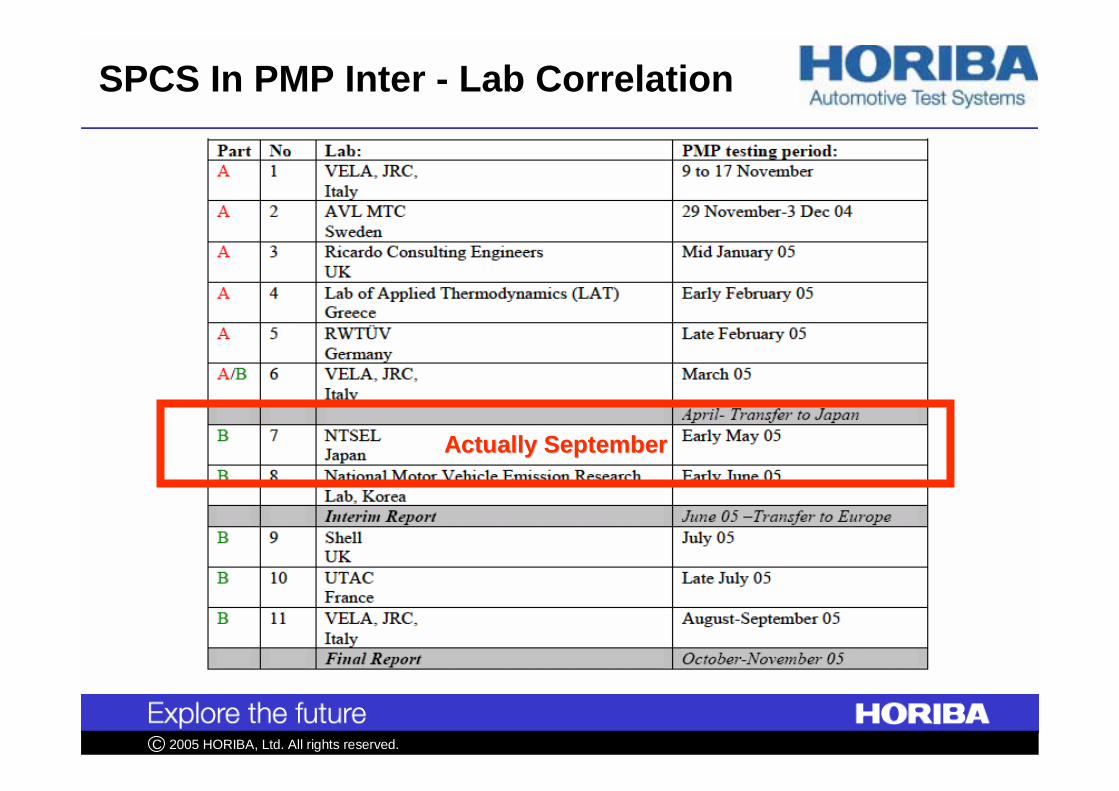
SPCS In PMP Inter - Lab Correlation
Actually SeptemberActually September

C 2005 HORIBA, Ltd. All rights reserved.
SPCS In PMP Inter - Lab Correlation
PEUGEOT 407PEUGEOT 407PEUGEOT 407PEUGEOT 407
Golden Car Golden System

C 2005 HORIBA, Ltd. All rights reserved.
SPCS In PMP Correlation Exercise
InterInter--Lab Correlation Exercise @NTSELLab Correlation Exercise @NTSEL
Repeatability of measurement by GPMS and SPCS
Outline of tested vehiclesOutline of tested vehicles
DPF + Oxi. Cat.TC, Common rail D.I1998DieselJV-2
TWC + de NOx Cat.NA, Direct Injection2990GasolineJV-1
SiC DPFTC, Common rail D.I1997DieselGVAfter treatmentEngine typeDisp.cm3Fuel
7.1%11.8% 6.8%
3.6%
32.9%
21.2%
0%
5%
10%
15%
20%
25%
30%
35%
40%
GPMS SPCS
Coefficient of variance
Coefficient of variance
Coefficient of variance
Coefficient of variance GV JV-1 JV-2
9.39E + 109.39E + 109.39E + 109.39E + 10 1.05E + 111.05E + 111.05E + 111.05E + 11
1.14E + 131.14E + 131.14E + 131.14E + 13 1.03E + 131.03E + 131.03E + 131.03E + 13
4.55E + 104.55E + 104.55E + 104.55E + 103.83E + 103.83E + 103.83E + 103.83E + 10
1E + 081E + 081E + 081E + 08
1E + 091E + 091E + 091E + 09
1E + 101E + 101E + 101E + 10
1E + 111E + 111E + 111E + 11
1E + 121E + 121E + 121E + 12
1E + 131E + 131E + 131E + 13
1E + 141E + 141E + 141E + 14
G P M SG P M SG P M SG P M S S P C SS P C SS P C SS P C S
Partic
le e
mis
sio
n (#/k
m)
Partic
le e
mis
sio
n (#/k
m)
Partic
le e
mis
sio
n (#/k
m)
Partic
le e
mis
sio
n (#/k
m)
G VG VG VG V JV -1JV -1JV -1JV -1 JV -2JV -2JV -2JV -2
Particle emission from different vehicles
C 2005 HORIBA, Ltd. All rights reserved.
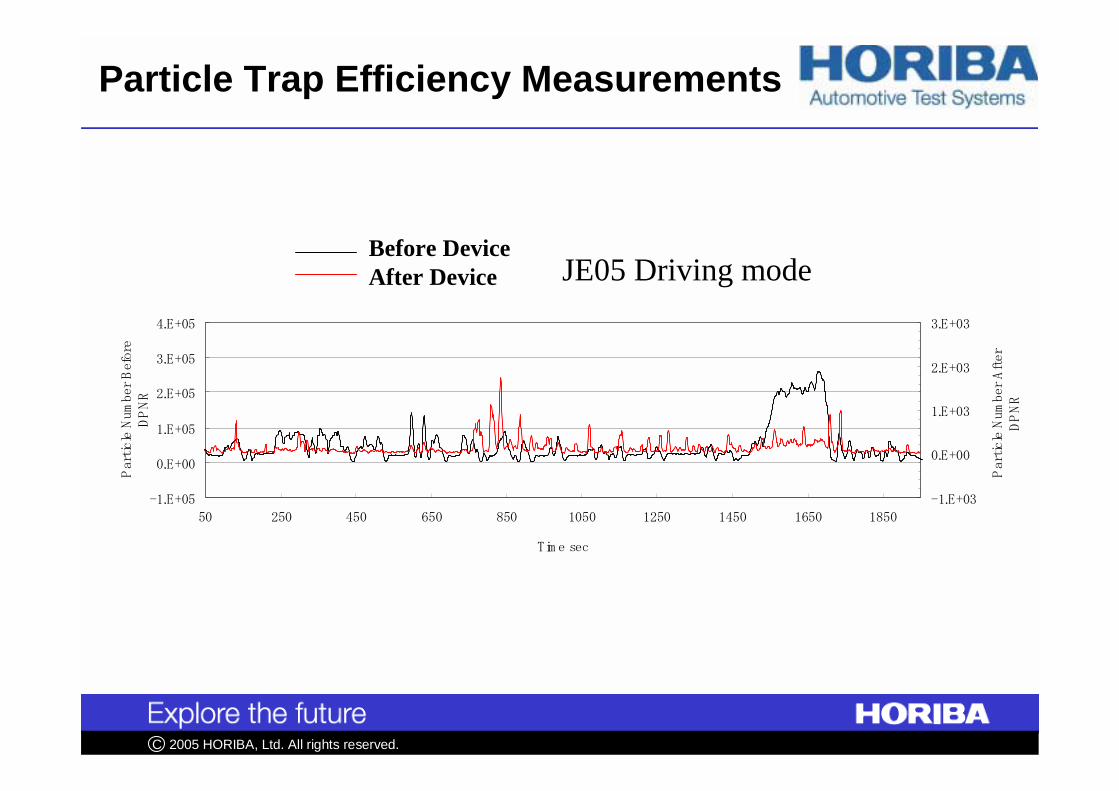
Particle Trap Efficiency Measurements
JE05 Driving modeBefore DeviceAfter Device
-1.E+05
0.E+00
1.E+05
2.E+05
3.E+05
4.E+05
50 250 450 650 850 1050 1250 1450 1650 1850
Tim e sec
Particle Number Before
DPNR
-1.E+03
0.E+00
1.E+03
2.E+03
3.E+03
Particle Number After
DPNR

C 2005 HORIBA, Ltd. All rights reserved.
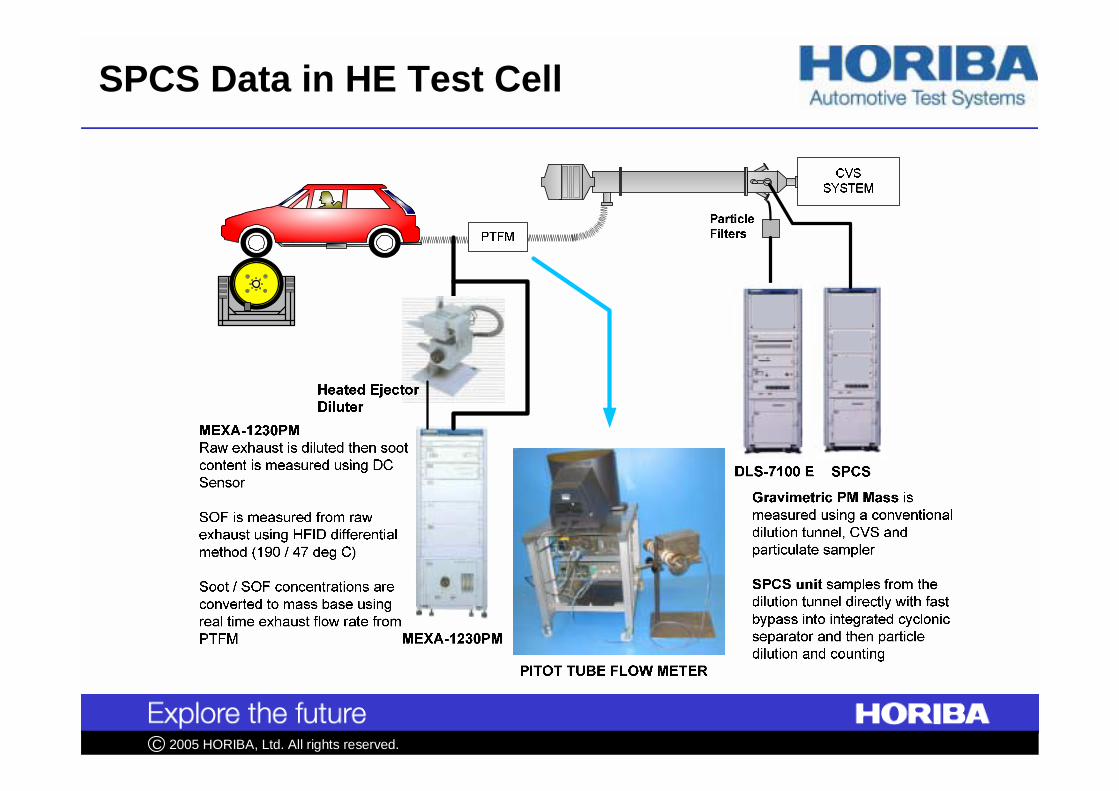
SPCS Actions after ILCE
! Prototype SPCS updated after ILCE in Japan- minor modifications incl software
! Prototype SPCS in the HE Chassis Cell – Testing on EU spec vehicles and cycles– Comparison with other PM measurements
• Full flow dilution CVS with gravimetric PM• TEOM (on CVS/DLT)• MEXA-1230PM on direct raw exhaust with a standalone PTFM
(Pitot Tube Flow Meter)
C 2005 HORIBA, Ltd. All rights reserved.
SPCS Data in HE Test Cell
C 2005 HORIBA, Ltd. All rights reserved.
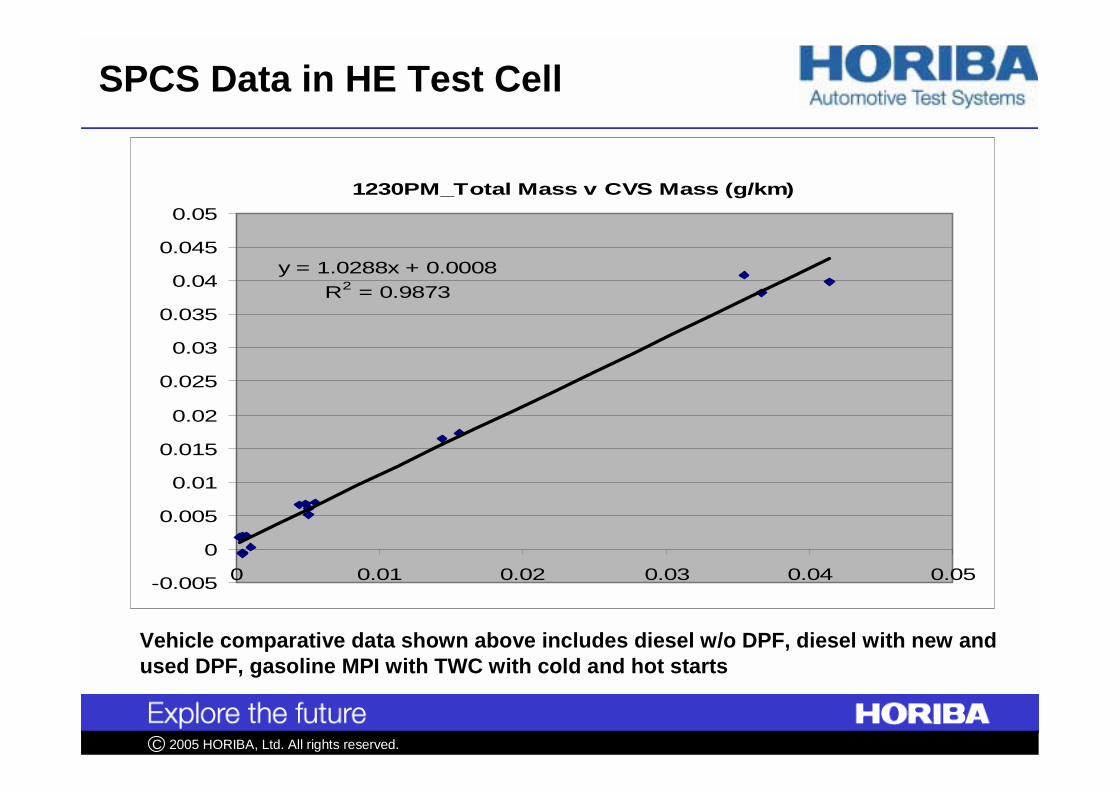
SPCS Data in HE Test Cell
1230PM_Total Mass v CVS Mass (g/km)
y = 1.0288x + 0.0008R2 = 0.9873
-0.005
0
0.005
0.01
0.015
0.02
0.025
0.03
0.035
0.04
0.045
0.05
0 0.01 0.02 0.03 0.04 0.05
Vehicle comparative data shown above includes diesel w/o DPF, diesel with new and used DPF, gasoline MPI with TWC with cold and hot starts
C 2005 HORIBA, Ltd. All rights reserved.
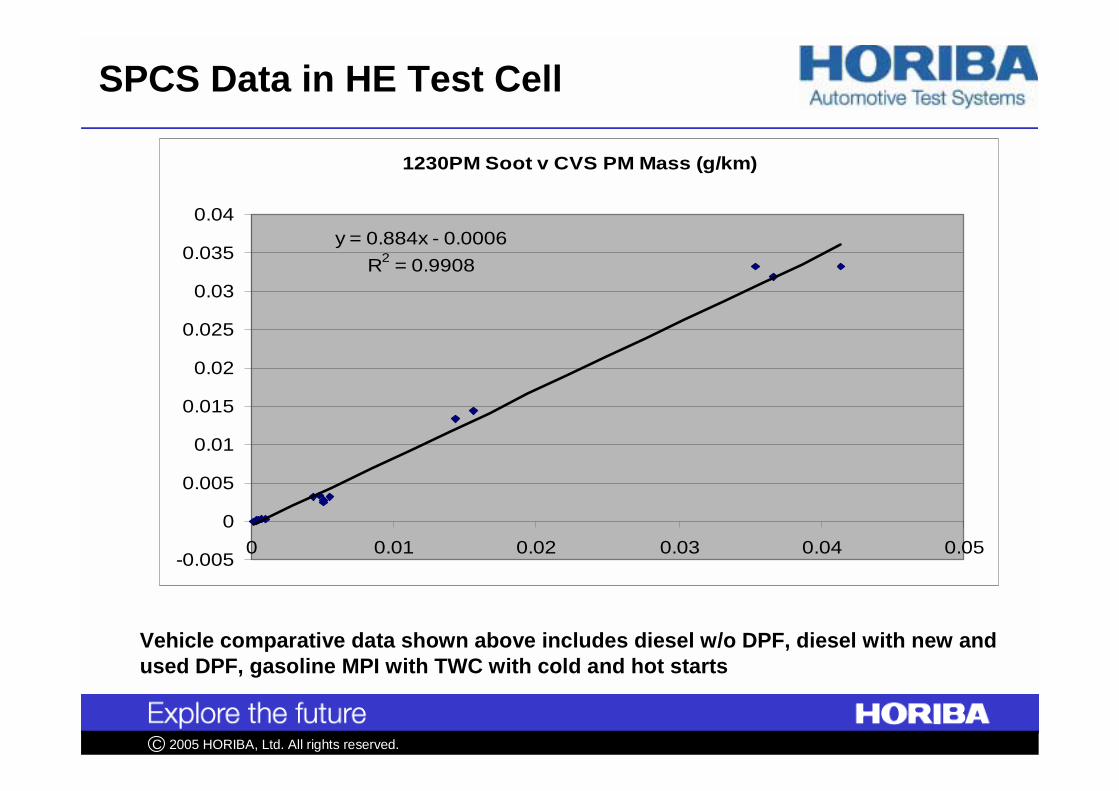
SPCS Data in HE Test Cell
1230PM Soot v CVS PM Mass (g/km)
y = 0.884x - 0.0006R2 = 0.9908
-0.005
0
0.005
0.01
0.015
0.02
0.025
0.03
0.035
0.04
0 0.01 0.02 0.03 0.04 0.05
Vehicle comparative data shown above includes diesel w/o DPF, diesel with new and used DPF, gasoline MPI with TWC with cold and hot starts

C 2005 HORIBA, Ltd. All rights reserved.
SPCS Data in HE Test Cell
Vehicle comparative data shown above includes diesel w/o DPF, diesel with new and used DPF, gasoline MPI with TWC with cold and hot starts
SPCS (particles/km) v DLT PM Mass (g/km)
y = 4E+15xR2 = 0.9885
0.00E+00
2.00E+13
4.00E+13
6.00E+13
8.00E+13
1.00E+14
1.20E+14
1.40E+14
1.60E+14
1.80E+14
0 0.005 0.01 0.015 0.02 0.025 0.03 0.035 0.04 0.045
DLT PM Mass g/km
Part
icle
Num
ber /
km
C 2005 HORIBA, Ltd. All rights reserved.
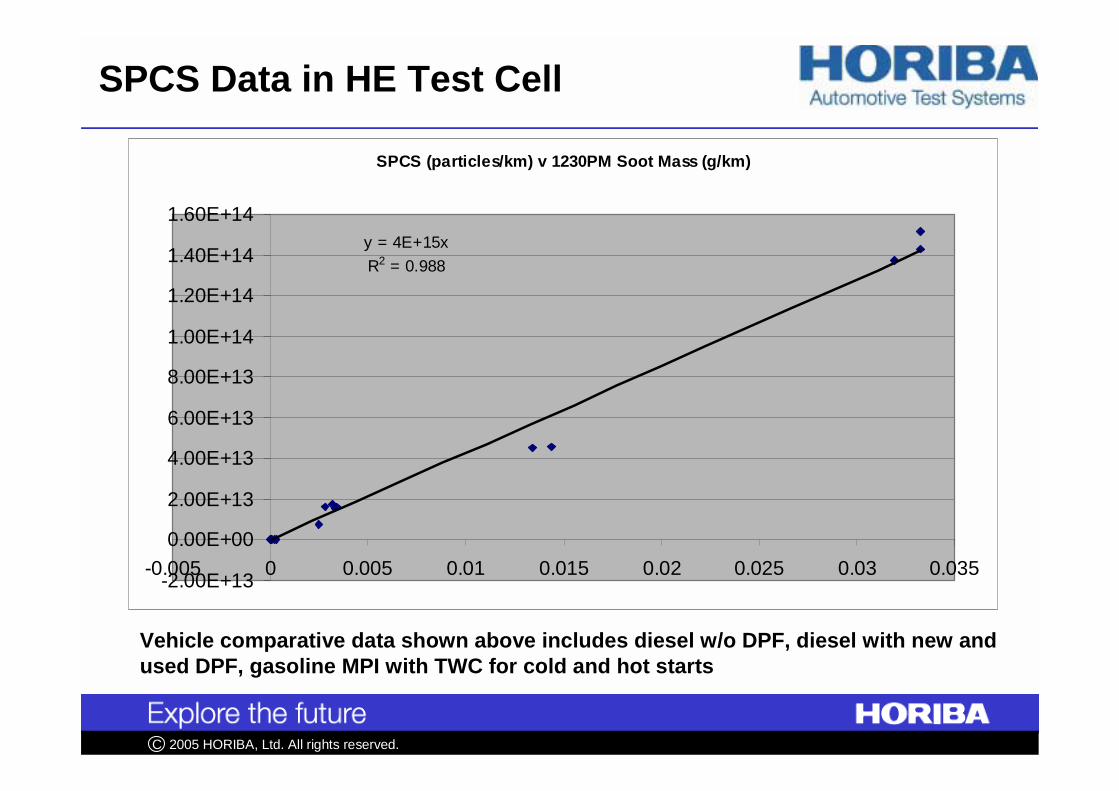
SPCS Data in HE Test Cell
Vehicle comparative data shown above includes diesel w/o DPF, diesel with new and used DPF, gasoline MPI with TWC for cold and hot starts
SPCS (particles/km) v 1230PM Soot Mass (g/km)
y = 4E+15xR2 = 0.988
-2.00E+13
0.00E+00
2.00E+13
4.00E+13
6.00E+13
8.00E+13
1.00E+14
1.20E+14
1.40E+14
1.60E+14
-0.005 0 0.005 0.01 0.015 0.02 0.025 0.03 0.035

C 2005 HORIBA, Ltd. All rights reserved.
SPCS Future Actions
! SPCS prototypes (2 sets) will be taken to JRC ISPRA for final session of PMP Inter Lab Correlation Exercise
! SPCS has been offered for use in the HDD Particle Number Program
! Timing for if and when a particle number regulation will be applied remains open
! EU Auto Industry representatives and individual manufacturers have objected to the inclusion of particle number counting in the draft LD Stage 5 regulations– Current absence of practical, traceable calibration/verification system
! Prototype SPCS results shows good potential for a highly sensitive soot measurement system
! Production SPCS scheduled for deliveries in April 2007 .


