SOLID DISPERSION AS AN APPROACH FOR SOLUBILITY AND ...ijupbs.com/Uploads/1. RPA161724554016.pdf ·...
15
1 | P a ge International Standard Serial Number (ISSN): 2319-8141 Full Text Available On www.ijupbs.com International Journal of Universal Pharmacy and Bio Sciences 6(6): November-December 2017 INTERNATIONAL JOURNAL OF UNIVERSAL PHARMACY AND BIO SCIENCES IMPACT FACTOR 4.018*** ICV 6.16*** Pharmaceutical Sciences RESEARCH ARTICLE …………!!! SOLID DISPERSION AS AN APPROACH FOR SOLUBILITY AND DISSOLUTION RATE ENHANCEMENT OF LUMEFANTRINE Charles D Na’anman 1 , Yahaya Z Sule 2 *, Patricia I Achi 2 , Hassan Musa 1 , Suzane T Allagh 1 , Kenneth C Ofokansi 3 1 Department of Pharmaceutics and Pharmaceutical Microbiology, Faculty of Pharmaceutical Sciences, Ahmadu Bello University, Zaria, Nigeria, 2 Department of Pharmaceutics and Pharmaceutical Microbiology, Faculty of Pharmaceutical Sciences, Kaduna State University, Kaduna, Nigeria, 3 Department of Pharmaceutics, Faculty of Pharmaceutical Sciences, University of Nigeria, Nsukka, Enugu State, Nigeria. KEYWORDS: Lumefantrine, Poloxamer 188, Dissolution, Solubility enhancement, Solid Dispersion. For Correspondence: Yahaya Z. Sule* Address: Department of Pharmaceutics and Pharmaceutical Microbiology, Faculty of Pharmaceutical Sciences, Kaduna State University, Kaduna, Nigeria. ABSTRACT The aim of this study was to enhance the solubility and dissolution rate of lumefantrine using Poloxamer 188 by solid dispersion technique. Solid dispersions of lumefantrine and Poloxamer 188 were prepared at the ratio of 1:1, 1:2 and 1:3 by kneading and physical mixing. The solid dispersions were characterized using Fourier Transform Infrared (FT-IR) spectroscopy, differential scanning calorimetry (DSC) and X-ray diffraction. The effect of the solid dispersion on solubility and dissolution rate of lumefantrine was evaluated using phase solubility analysis, solubility studies and in vitro dissolution studies. The pure lumefantrine powder, 1:1 lumefantrine-Poloxamer 188 solid dispersions and 1:1 lumefantrine-Poloxamer 188 physical mixtures were further formulated into tablets by direct compression. The prepared tablets were evaluated for hardness, % friability and comparative in vitro dissolution profiles with a marketed brand. FT-IR, DSC and X-ray diffraction studies revealed that there was no chemical interaction between the drug and the polymer. Prepared solid dispersions tablet exhibited higher and faster dissolution rate than the formulated tablets of the pure drug, physical mixtures and marketed product. The result of the study revealed that solid dispersion with Poloxamer 188 is a promising alternative to enhance the solubility and dissolution rate of lumefantrine.
Transcript of SOLID DISPERSION AS AN APPROACH FOR SOLUBILITY AND ...ijupbs.com/Uploads/1. RPA161724554016.pdf ·...
1 | P a g e International Standard Serial Number (ISSN): 2319-8141
Full Text Available On www.ijupbs.com
International Journal of Universal Pharmacy and Bio Sciences 6(6): November-December 2017
INTERNATIONAL JOURNAL OF UNIVERSAL
PHARMACY AND BIO SCIENCES IMPACT FACTOR 4.018***
ICV 6.16***
Pharmaceutical Sciences RESEARCH ARTICLE …………!!!
SOLID DISPERSION AS AN APPROACH FOR SOLUBILITY AND
DISSOLUTION RATE ENHANCEMENT OF LUMEFANTRINE
Charles D Na’anman1, Yahaya Z Sule
2*, Patricia I Achi
2, Hassan Musa
1, Suzane T
Allagh1, Kenneth C Ofokansi
3
1Department of Pharmaceutics and Pharmaceutical Microbiology, Faculty of Pharmaceutical
Sciences, Ahmadu Bello University, Zaria, Nigeria, 2Department of Pharmaceutics and
Pharmaceutical Microbiology, Faculty of Pharmaceutical Sciences, Kaduna State University,
Kaduna, Nigeria, 3Department of Pharmaceutics, Faculty of Pharmaceutical Sciences,
University of Nigeria, Nsukka, Enugu State, Nigeria.
KEYWORDS:
Lumefantrine, Poloxamer
188, Dissolution,
Solubility enhancement,
Solid Dispersion.
For Correspondence:
Yahaya Z. Sule*
Address:
Department of
Pharmaceutics and
Pharmaceutical
Microbiology, Faculty of
Pharmaceutical Sciences,
Kaduna State University,
Kaduna, Nigeria.
ABSTRACT
The aim of this study was to enhance the solubility and dissolution
rate of lumefantrine using Poloxamer 188 by solid dispersion
technique. Solid dispersions of lumefantrine and Poloxamer 188
were prepared at the ratio of 1:1, 1:2 and 1:3 by kneading and
physical mixing. The solid dispersions were characterized using
Fourier Transform Infrared (FT-IR) spectroscopy, differential
scanning calorimetry (DSC) and X-ray diffraction. The effect of the
solid dispersion on solubility and dissolution rate of lumefantrine
was evaluated using phase solubility analysis, solubility studies and
in vitro dissolution studies. The pure lumefantrine powder, 1:1
lumefantrine-Poloxamer 188 solid dispersions and 1:1
lumefantrine-Poloxamer 188 physical mixtures were further
formulated into tablets by direct compression. The prepared tablets
were evaluated for hardness, % friability and comparative in vitro
dissolution profiles with a marketed brand. FT-IR, DSC and X-ray
diffraction studies revealed that there was no chemical interaction
between the drug and the polymer. Prepared solid dispersions
tablet exhibited higher and faster dissolution rate than the
formulated tablets of the pure drug, physical mixtures and marketed
product. The result of the study revealed that solid dispersion with
Poloxamer 188 is a promising alternative to enhance the solubility
and dissolution rate of lumefantrine.
2 | P a g e International Standard Serial Number (ISSN): 2319-8141
Full Text Available On www.ijupbs.com
INTRODUCTION:
Lumefantrine is classified as a class II drug in the Biopharmaceutical Classification System (BCS),
this implies that it is poorly soluble in water with low bioavailability when administered orally 1. It
oral delivery is reported to be associated with high intra- and inter subject variability, and lack of
dose proportionality 1,2
. In order to improve the solubility and bioavailability, some efforts have
been made in recent years, such as the development of Lumefantrine – Oleic acid self-Nano
emulsifying ionic complex for enhanced dissolution 1, lumefantrine nanopowder prepared by wet-
milling technique 3 and recommendation/encouragement to consume high-fat meal at the time of
lumefantrine dosing 4 with the objective to improve the efficacy of the antimalarial agent.
Solid dispersions have been shown to be commercially feasible delivery system and they have
shown the capability to improve oral bioavailability and therapeutic efficacy of several therapeutic
agents 5. Solid dispersion refers to a group of solid products consisting of at least two different
components i.e. hydrophilic matrix and a hydrophobic drug. The drug can be dispersed molecularly
in amorphous particles (clusters) or in crystalline particles 6, 7
. In this technique, a poorly soluble
drug can be dispersed in a highly soluble hydrophilic carrier (matrix), which further enhances the
solubility and dissolution of that poorly soluble drug candidate. Solid dispersion technique can
yield eutectic (non-molecular level mixing) or solid solution (molecular level mixing) product. The
drug could be partially or completely soluble in the dispersing matrix. Presence of drug in the
microcrystalline state, improved the wettability and formation of high free energy amorphous form
of the drug during solid dispersion formation which contributes towards enhanced drug solubility 7,
8.
MATERIALS AND METHOD
Lumefantrine powder Batch no. ATM 121003, Manufac. date, Feb. 2012, Expiry date, Jan. 2016.
Source: Afrab Chem. Nigeria Ltd, Lagos, Poloxamer 188 (Evonik, Germany), Magnesium stearate
(BDH Chemicals Ltd Poole- England), Talc powder (BDH Chemicals Ltd Poole England), Sodium
Chloride (BDH Chemicals Ltd Poole-England), Monobasic potassium phosphate (Sigma chemical
Co.,USA), Coartem tablets; Batch No. X1571, Manufac. date Jan. 2016, Expiry date Dec. 2018,
NAFDAC Reg. No. 04 -275.
Phase solubility studies
A 20 mg quantity of lumefantrine powder was weighed and added to 20 ml of distilled water
containing increasing concentration of poloxamer 188 (0%, 0.1%, 0.25%, 0.5%, 0.75% and 1% w/v
that is 0 mg, 20 mg, 50 mg, 100 mg, 150 mg and 200 mg). The flasks were sealed and shaken at
room temperature for 48 h on a shaker bath. The samples were centrifuged using Jouan GR
3 | P a g e International Standard Serial Number (ISSN): 2319-8141
Full Text Available On www.ijupbs.com
centrifuge programmed for 45 mins and filtered through a 0.45 µm Whatman filter paper. Two
milliliters of each of the filtrates were analyzed spectrophotometrically at the wavelength of 342 nm
to calculate the concentrations of the drug.
Preparation of solid dispersions and physical mixtures
The solid dispersion was prepared by weighing quantities of lumefantrine/Poloxamer 188 in the
ratios of 1:1, 1:2 and 1:3. The mixture was placed in a mortar, kneaded with a small volume of
methanol/water in the ratio 1:1 for 45 minutes to produce a homogeneous dispersion. The
homogeneous sample was dried in a hot air oven at 45 OC. The sample was pulverized, sieved
through 120 µm mesh and then stored in a screw cap vial at room temperature for further use.
Physical mixtures of the drug and carriers, having the same composition of the solid dispersions
were prepared by simply triturating the drugs and the polymers in a porcelain mortar. The mixtures
were sieved and stored in screw cap vials at room temperature pending further use.
Solubility determination in different media
A 20 mg quantity of lumefantrine powder and equivalent of 20 mg of solid dispersion and physical
mixture of lumefantrine and Poloxamer 188 (Ratios 1:1, 1:2 and 1:3) that is, (40 mg, 60 mg and 80
mg) were separately weighed and transferred to flasks containing 20 ml of distilled water, simulated
intestinal fluid (SIF) without enzyme (pH 7.4) and simulated gastric fluid (SGF) without enzyme
(pH 1.2). The samples were agitated at 80 rpm in thermostated shaking water bath (CS 200G) at
37± 0.5 OC for 24 h and allowed to stand for 24 h. The supernatant solution was filtered through
0.45 µm Whatman filter paper. The filtrate was diluted and the absorbance was measured at 342 nm
using Jenway 6405 UV-Vis spectrophotometer.
Interaction studies
Fourier transform infrared (FTIR) spectroscopy
FT-IR was employed to evaluate possible interactions between the lumefantrine and Poloxamer
188. The FT-IR spectra were obtained by KBr pellet method over the range 500 - 4,500 cm–1
.
Differential scanning calorimetry
The lumefantrine/Poloxamer 188 solid dispersion was assessed using DSC by heating the samples
at a rate of 10 OC/ min and a temperature range of 30 to 300
OC in order to determine the possibility
of an interaction.
X-ray diffraction studies
X-ray diffraction studies of the drug and polymer alone as well as physical mixture and solid
dispersion was performed. X-ray diffraction patterns were recorded on (Brukar AXS DH Advance,
Germany). The scanning rate employed was 6 Omin
–1 over 10 to 50
O diffraction angle (2θ) range.
4 | P a g e International Standard Serial Number (ISSN): 2319-8141
Full Text Available On www.ijupbs.com
Dissolution studies
In vitro dissolution of lumefantrine powder, lumefantrine/ Poloxamer 188 solid dispersions and
physical mixtures at ratios 1:1, 1:2, 1:3 was carried out using Erweka dissolution apparatus. The
dissolution was carried out in 1000 ml of simulated gastric fluid (SGF) without enzyme (pH 7.4)
and simulated intestinal fluid (SIF) without enzyme (pH 1.2) respectively maintained at 37 OC ± 0.5
OC at 50 rpm. This was carried out by weighing 120 mg of lumefantrine powder and placing it in a
dialyzing membrane. For the solid dispersions and physical mixtures, equivalents of 120 mg (240
mg, 360 mg and 480 mg for 1:1, 1:2 and1:3 respectively) were weighed and placed in a dialyzing
membrane. Two milliliters volumes of the dissolution medium were withdrawn at intervals from 10
to 120 mins and replaced with an equivalent volume of the fresh medium. The withdrawn sample
was filtered through a 0.45 µm Whatman filter paper, diluted with 8 ml of the medium and its
absorbance measured at 342 nm to determine the drug content and percentage release.
Tablet formulation
All solid dispersion and physical mixtures (1:1, 1:2 and 1:3) exhibited pronounced enhancement
with comparable values of dissolution rate; therefore, solid dispersion of ratio 1:1 was used for the
preparation of tablets since it contains lesser amount of Poloxamer 188 than solid dispersion and
physical mixtures of ratios 1:2 and 1:3. The lumefantrine powder (120 mg), solid dispersions and
physical mixtures (ratios 1:1) containing the equivalent of 120 mg lumefantrine were weighed and
transferred into three different mortars. Each of these samples was mixed thoroughly with
microcrystalline cellulose (Avicel PH102), maize starch and magnesium stearate. The powder
mixtures were passed through sieve number 120 µm and compressed into tablets by direct
compression method using a compression force of 10 metric ton and a punch size of 10 mm. The
tablets were evaluated for thickness, diameter, weight uniformity, crushing strength, friability,
disintegration and dissolution time.
Statistical analysis
The numerical data that resulted from the various determinations were expressed as mean ±SD and
difference between means was determined by one-way analysis of variance (ANOVA) and student
t-test. A value of P<0.05 was considered as significant.
RESULTS AND DISCUSSION
Phase solubility studies
The phase solubility diagram gave a linear relationship of increasing solubility of lumefantrine with
increasing concentration of the polymer.
5 | P a g e International Standard Serial Number (ISSN): 2319-8141
Full Text Available On www.ijupbs.com
It was observed that with increasing concentration of Poloxamer 188, the solubility of the
lumefantrine increased. The solubility of pure lumefantrine was found to be 7.95µg/ml. As the
concentration of the Poloxamer 188 increased the solubility increased 2.4 fold at 1% w/v
concentration of the polymer. Increased in solubility with increasing Poloxamer 188 in solid
dispersions of valsartan was also observed and attributed to the solvent property of Poloxamer 188.
This is because Poloxamer causes a decrease in interfacial tension between the drug and the
dissolution medium thereby increasing the solubility of the drug 9.
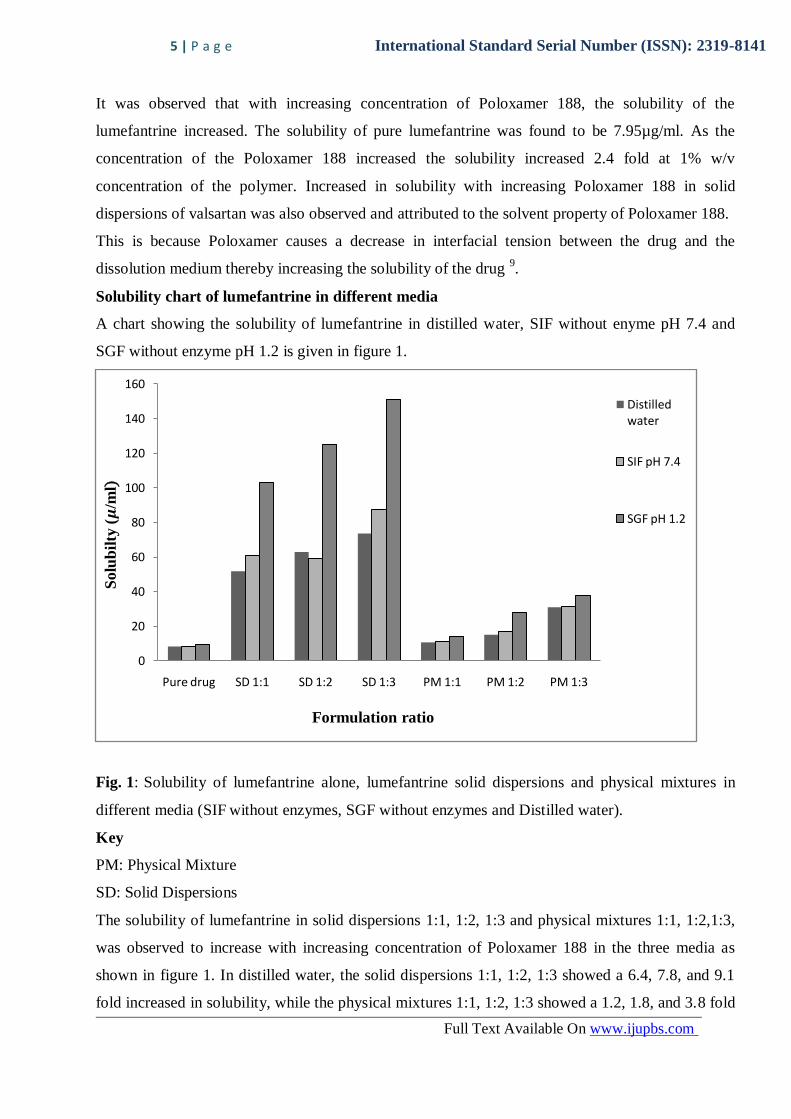
Solubility chart of lumefantrine in different media
A chart showing the solubility of lumefantrine in distilled water, SIF without enyme pH 7.4 and
SGF without enzyme pH 1.2 is given in figure 1.
Fig. 1: Solubility of lumefantrine alone, lumefantrine solid dispersions and physical mixtures in
different media (SIF without enzymes, SGF without enzymes and Distilled water).
Key
PM: Physical Mixture
SD: Solid Dispersions
The solubility of lumefantrine in solid dispersions 1:1, 1:2, 1:3 and physical mixtures 1:1, 1:2,1:3,
was observed to increase with increasing concentration of Poloxamer 188 in the three media as
shown in figure 1. In distilled water, the solid dispersions 1:1, 1:2, 1:3 showed a 6.4, 7.8, and 9.1
fold increased in solubility, while the physical mixtures 1:1, 1:2, 1:3 showed a 1.2, 1.8, and 3.8 fold
0
20
40
60
80
100
120
140
160
Pure drug SD 1:1 SD 1:2 SD 1:3 PM 1:1 PM 1:2 PM 1:3
Solu
bil
ty (𝝁
/ml)
Formulation ratio
Distilled water
SIF pH 7.4
SGF pH 1.2
6 | P a g e International Standard Serial Number (ISSN): 2319-8141
Full Text Available On www.ijupbs.com
increased in solubility. In simulated intestinal fluid without enzyme (pH 7.4), the solid dispersions
1:1, 1:2, 1:3 showed a 7.5, 7.3, and 10.9 fold increase in solubility while the physical mixtures 1:1,
1:2, 1:3 showed a 1.3, 2.1, and 3.9 fold increase in solubility. In simulated gastric fluid without
enzyme (pH 1.2), the solid dispersions 1:1, 1:2, 1:3 showed 11.2, 13.6, and 16.5 fold increase in
solubility, while the physical mixtures 1:1, 1:2, 1:3 showed 1.5, 3.0, and 4.1 fold increase in
solubility. Increase in solubility in different media with increased concentration of Poloxamer 188
has been reported to be as a result of the synergistic effect of trituration and solubilization of the
used solvent, leading to improvement in solubility 5. Also as the medium was changed, increase in
solubility was observed in the simulated intestinal fluid without enzyme as well as the simulated
gastric fluid without enzyme to define the effect of pH on the solubility of lumefantrine. It was
observed that the drug is more soluble in simulated gastric fluid without enzyme (pH 1.2) than the
simulated intestinal fluid (pH 7.4). The order of increasing solubility was; SGF without enzyme >
SIF without enzyme > distilled water.
Increase in solubility was observed in the different media in this pattern, SGF without enzyme pH
1.2 >SIF without enzyme pH7.4> Distilled water.
Interaction studies
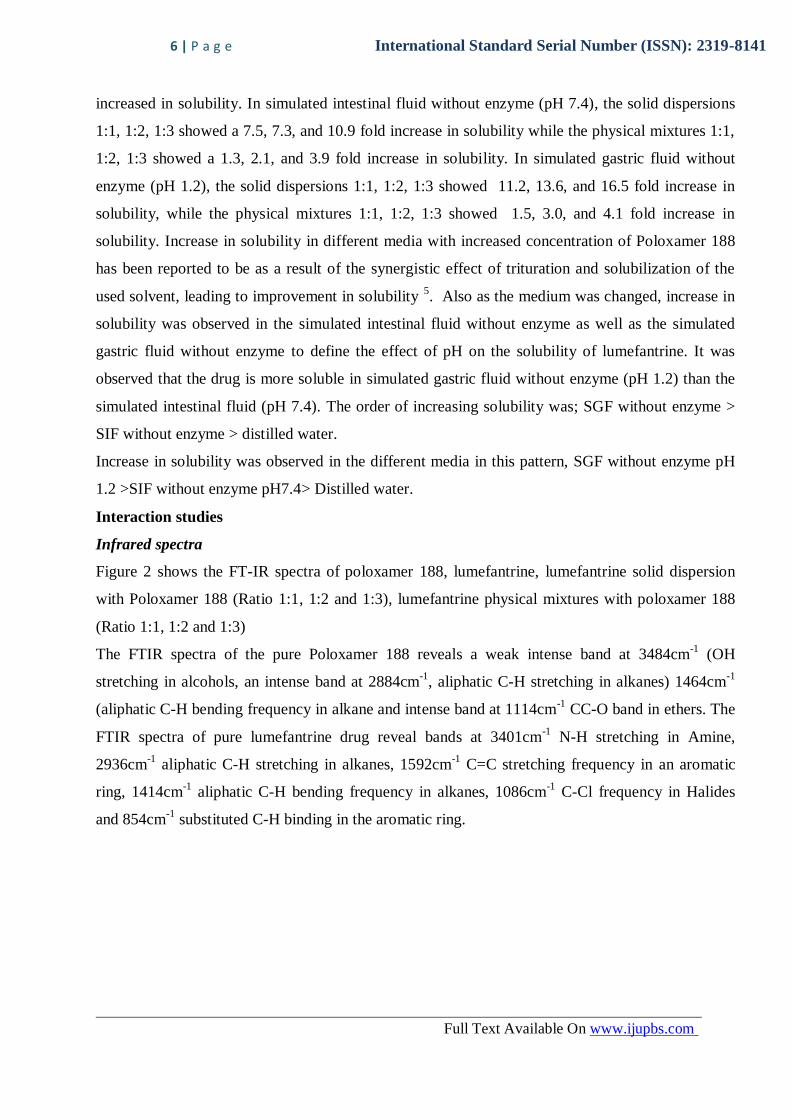
Infrared spectra
Figure 2 shows the FT-IR spectra of poloxamer 188, lumefantrine, lumefantrine solid dispersion
with Poloxamer 188 (Ratio 1:1, 1:2 and 1:3), lumefantrine physical mixtures with poloxamer 188
(Ratio 1:1, 1:2 and 1:3)
The FTIR spectra of the pure Poloxamer 188 reveals a weak intense band at 3484cm-1
(OH
stretching in alcohols, an intense band at 2884cm-1
, aliphatic C-H stretching in alkanes) 1464cm-1
(aliphatic C-H bending frequency in alkane and intense band at 1114cm-1
CC-O band in ethers. The
FTIR spectra of pure lumefantrine drug reveal bands at 3401cm-1
N-H stretching in Amine,
2936cm-1
aliphatic C-H stretching in alkanes, 1592cm-1
C=C stretching frequency in an aromatic
ring, 1414cm-1
aliphatic C-H bending frequency in alkanes, 1086cm-1
C-Cl frequency in Halides
and 854cm-1
substituted C-H binding in the aromatic ring.
7 | P a g e International Standard Serial Number (ISSN): 2319-8141
Full Text Available On www.ijupbs.com
Fig. 2: FT-IR spectrum of lumefantrine (A) Poloxamer 188 (B), physical mixtures of
lumefantrine and Poloxamer 188 (1:1) (C), physical mixture of lumefantrine and
Poloxamer 188 (Ratio 1:2) (D), physical mixtures of lumefantrine and Poloxamer
188 (Ratio 1:3) (E), solid dispersions of lumefantrine and Poloxamer 188 (Ratio 1:1)
(F), solid dispersions of lumefantrine and Poloxamer 188 (Ratio 1:2) (G), solid
dispersions of lumefantrine and Poloxamer 188 (Ratio 1:3) (H),
The FTIR spectra of lumefantrine and poloxamer 1:1 solid dispersion reveals weak intense bands
at 3407cm-1
(N-H stretching frequency), sharp intense bands at 2883cm-1
( aliphatic C-H stretching
frequency of alkanes) , 1589cm-1
(C=C stretching in aromatic ring), 1458cm-1
C-H bending in
alkane, 1371cm-1
(C-H bending in alkene), 1110cm-1
C-Cl (bending in halides) and 952cm-1
,
848cm-1
disubstituted C-H band in Aromatic ring.
The FTIR spectra of lumefantrine and poloxamer 12 solid dispersion reveals a reduced intense
band at 3417cm-1
(N-H stretching in amines), sharp peaks band at 2884cm-1
(aliphatic C-H
stretching in alkane) 1462cm-1
(C-H bending in alkene), 1363cm-1
(C-H bending in alkene),
1112cm-1
C-Cl bending halides with 951cm-1
and 846cm-1
. The solid dispersions at ratio 1:2 still
A
B
C
D
E
F
G
H
8 | P a g e International Standard Serial Number (ISSN): 2319-8141
Full Text Available On www.ijupbs.com
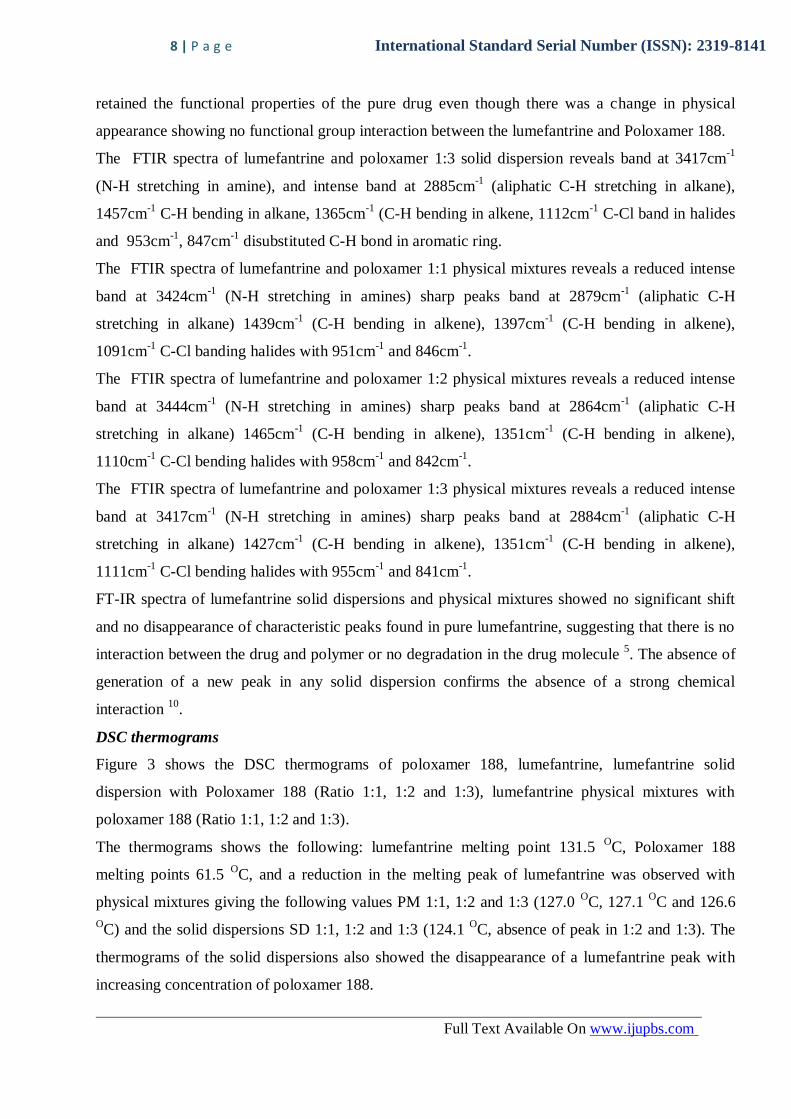
retained the functional properties of the pure drug even though there was a change in physical
appearance showing no functional group interaction between the lumefantrine and Poloxamer 188.
The FTIR spectra of lumefantrine and poloxamer 1:3 solid dispersion reveals band at 3417cm-1
(N-H stretching in amine), and intense band at 2885cm-1
(aliphatic C-H stretching in alkane),
1457cm-1
C-H bending in alkane, 1365cm-1
(C-H bending in alkene, 1112cm-1
C-Cl band in halides
and 953cm-1
, 847cm-1
disubstituted C-H bond in aromatic ring.
The FTIR spectra of lumefantrine and poloxamer 1:1 physical mixtures reveals a reduced intense
band at 3424cm-1
(N-H stretching in amines) sharp peaks band at 2879cm-1
(aliphatic C-H
stretching in alkane) 1439cm-1
(C-H bending in alkene), 1397cm-1
(C-H bending in alkene),
1091cm-1
C-Cl banding halides with 951cm-1
and 846cm-1
.
The FTIR spectra of lumefantrine and poloxamer 1:2 physical mixtures reveals a reduced intense
band at 3444cm-1
(N-H stretching in amines) sharp peaks band at 2864cm-1
(aliphatic C-H
stretching in alkane) 1465cm-1
(C-H bending in alkene), 1351cm-1
(C-H bending in alkene),
1110cm-1
C-Cl bending halides with 958cm-1
and 842cm-1
.
The FTIR spectra of lumefantrine and poloxamer 1:3 physical mixtures reveals a reduced intense
band at 3417cm-1
(N-H stretching in amines) sharp peaks band at 2884cm-1
(aliphatic C-H
stretching in alkane) 1427cm-1
(C-H bending in alkene), 1351cm-1
(C-H bending in alkene),
1111cm-1
C-Cl bending halides with 955cm-1
and 841cm-1
.
FT-IR spectra of lumefantrine solid dispersions and physical mixtures showed no significant shift
and no disappearance of characteristic peaks found in pure lumefantrine, suggesting that there is no
interaction between the drug and polymer or no degradation in the drug molecule 5. The absence of
generation of a new peak in any solid dispersion confirms the absence of a strong chemical
interaction 10
.
DSC thermograms
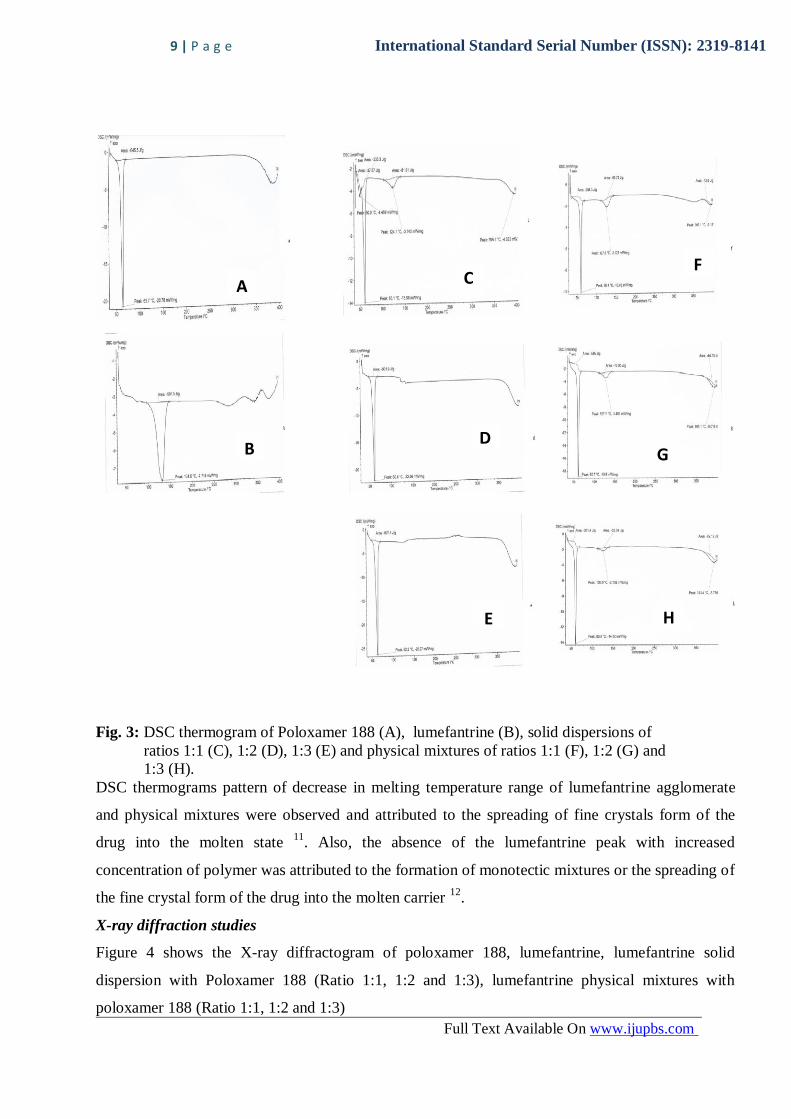
Figure 3 shows the DSC thermograms of poloxamer 188, lumefantrine, lumefantrine solid
dispersion with Poloxamer 188 (Ratio 1:1, 1:2 and 1:3), lumefantrine physical mixtures with
poloxamer 188 (Ratio 1:1, 1:2 and 1:3).
The thermograms shows the following: lumefantrine melting point 131.5 OC, Poloxamer 188
melting points 61.5 OC, and a reduction in the melting peak of lumefantrine was observed with
physical mixtures giving the following values PM 1:1, 1:2 and 1:3 (127.0 OC, 127.1
OC and 126.6
OC) and the solid dispersions SD 1:1, 1:2 and 1:3 (124.1
OC, absence of peak in 1:2 and 1:3). The
thermograms of the solid dispersions also showed the disappearance of a lumefantrine peak with
increasing concentration of poloxamer 188.
9 | P a g e International Standard Serial Number (ISSN): 2319-8141
Full Text Available On www.ijupbs.com
Fig. 3: DSC thermogram of Poloxamer 188 (A), lumefantrine (B), solid dispersions of
ratios 1:1 (C), 1:2 (D), 1:3 (E) and physical mixtures of ratios 1:1 (F), 1:2 (G) and
1:3 (H).
DSC thermograms pattern of decrease in melting temperature range of lumefantrine agglomerate
and physical mixtures were observed and attributed to the spreading of fine crystals form of the
drug into the molten state 11
. Also, the absence of the lumefantrine peak with increased
concentration of polymer was attributed to the formation of monotectic mixtures or the spreading of
the fine crystal form of the drug into the molten carrier 12
.
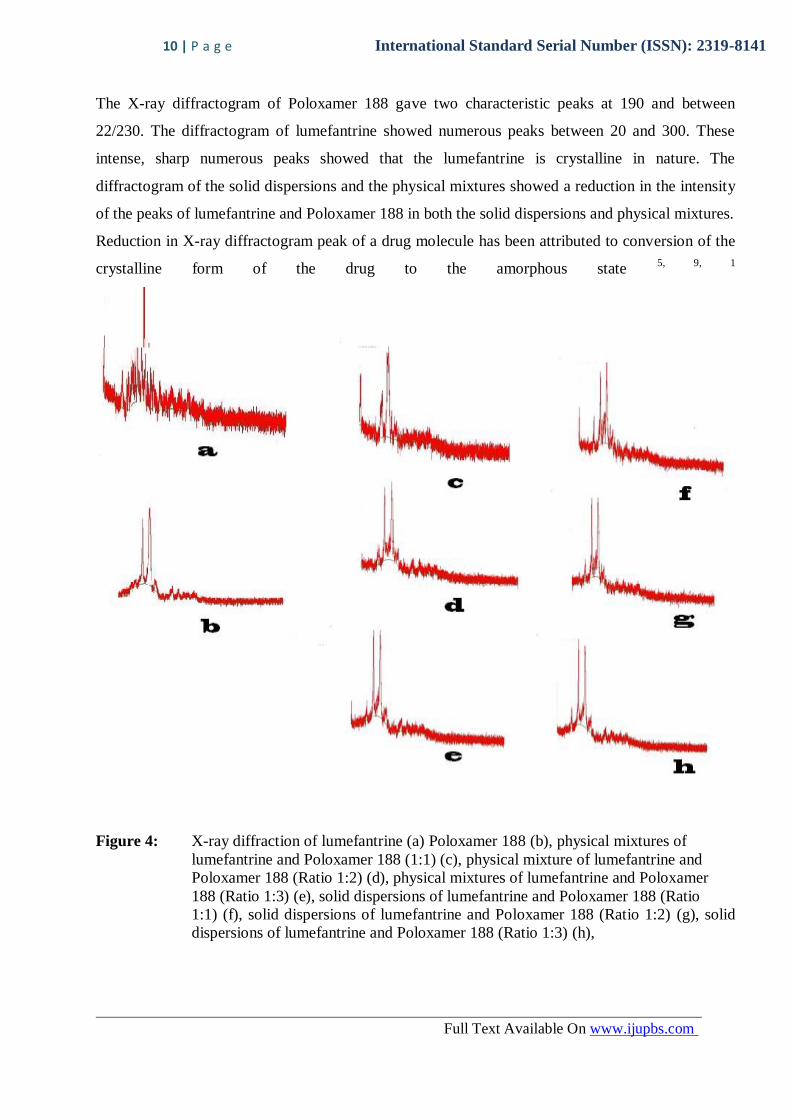
X-ray diffraction studies
Figure 4 shows the X-ray diffractogram of poloxamer 188, lumefantrine, lumefantrine solid
dispersion with Poloxamer 188 (Ratio 1:1, 1:2 and 1:3), lumefantrine physical mixtures with
poloxamer 188 (Ratio 1:1, 1:2 and 1:3)
H
A
B
C
D
E
F
G
10 | P a g e International Standard Serial Number (ISSN): 2319-8141
Full Text Available On www.ijupbs.com
The X-ray diffractogram of Poloxamer 188 gave two characteristic peaks at 190 and between
22/230. The diffractogram of lumefantrine showed numerous peaks between 20 and 300. These
intense, sharp numerous peaks showed that the lumefantrine is crystalline in nature. The
diffractogram of the solid dispersions and the physical mixtures showed a reduction in the intensity
of the peaks of lumefantrine and Poloxamer 188 in both the solid dispersions and physical mixtures.
Reduction in X-ray diffractogram peak of a drug molecule has been attributed to conversion of the
crystalline form of the drug to the amorphous state 5, 9, 1
Figure 4: X-ray diffraction of lumefantrine (a) Poloxamer 188 (b), physical mixtures of
lumefantrine and Poloxamer 188 (1:1) (c), physical mixture of lumefantrine and
Poloxamer 188 (Ratio 1:2) (d), physical mixtures of lumefantrine and Poloxamer
188 (Ratio 1:3) (e), solid dispersions of lumefantrine and Poloxamer 188 (Ratio
1:1) (f), solid dispersions of lumefantrine and Poloxamer 188 (Ratio 1:2) (g), solid
dispersions of lumefantrine and Poloxamer 188 (Ratio 1:3) (h),
11 | P a g e International Standard Serial Number (ISSN): 2319-8141
Full Text Available On www.ijupbs.com
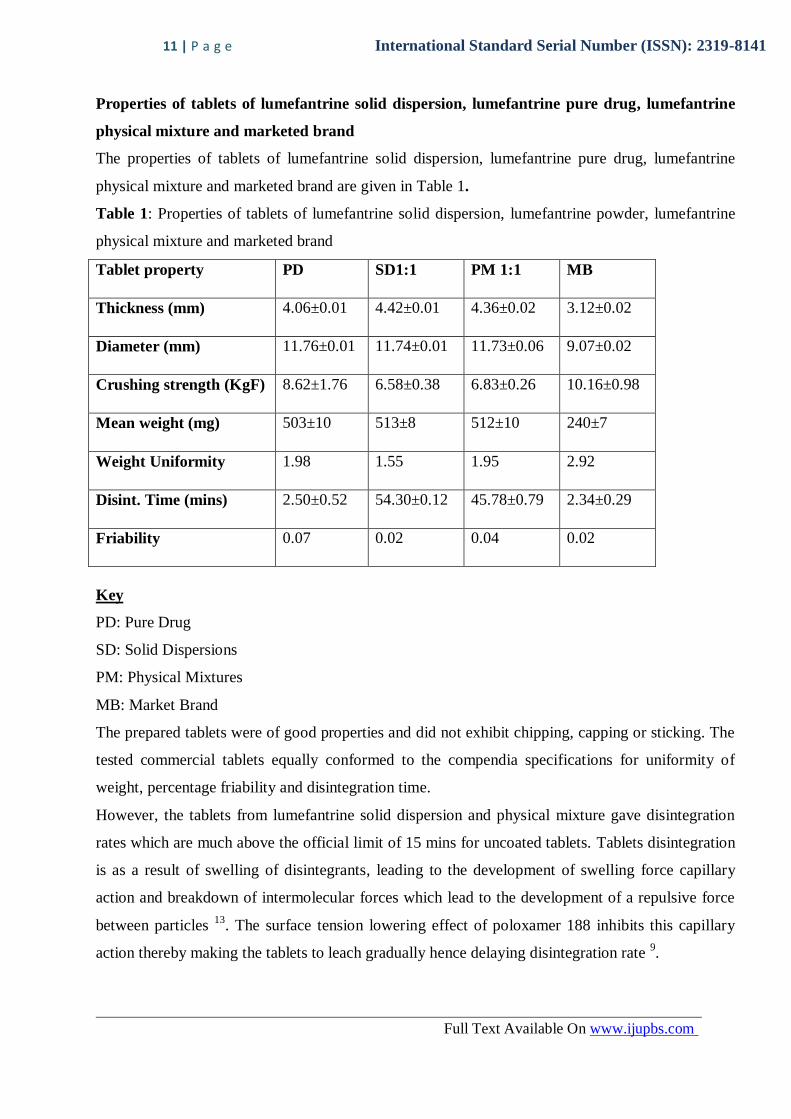
Properties of tablets of lumefantrine solid dispersion, lumefantrine pure drug, lumefantrine
physical mixture and marketed brand
The properties of tablets of lumefantrine solid dispersion, lumefantrine pure drug, lumefantrine
physical mixture and marketed brand are given in Table 1.
Table 1: Properties of tablets of lumefantrine solid dispersion, lumefantrine powder, lumefantrine
physical mixture and marketed brand
Tablet property PD SD1:1 PM 1:1 MB
Thickness (mm) 4.06±0.01 4.42±0.01 4.36±0.02 3.12±0.02
Diameter (mm) 11.76±0.01 11.74±0.01 11.73±0.06 9.07±0.02
Crushing strength (KgF) 8.62±1.76 6.58±0.38 6.83±0.26 10.16±0.98
Mean weight (mg) 503±10 513±8 512±10 240±7
Weight Uniformity 1.98 1.55 1.95 2.92
Disint. Time (mins) 2.50±0.52 54.30±0.12 45.78±0.79 2.34±0.29
Friability 0.07 0.02 0.04 0.02
Key
PD: Pure Drug
SD: Solid Dispersions
PM: Physical Mixtures
MB: Market Brand
The prepared tablets were of good properties and did not exhibit chipping, capping or sticking. The
tested commercial tablets equally conformed to the compendia specifications for uniformity of
weight, percentage friability and disintegration time.
However, the tablets from lumefantrine solid dispersion and physical mixture gave disintegration
rates which are much above the official limit of 15 mins for uncoated tablets. Tablets disintegration
is as a result of swelling of disintegrants, leading to the development of swelling force capillary
action and breakdown of intermolecular forces which lead to the development of a repulsive force
between particles 13
. The surface tension lowering effect of poloxamer 188 inhibits this capillary
action thereby making the tablets to leach gradually hence delaying disintegration rate 9.
12 | P a g e International Standard Serial Number (ISSN): 2319-8141
Full Text Available On www.ijupbs.com
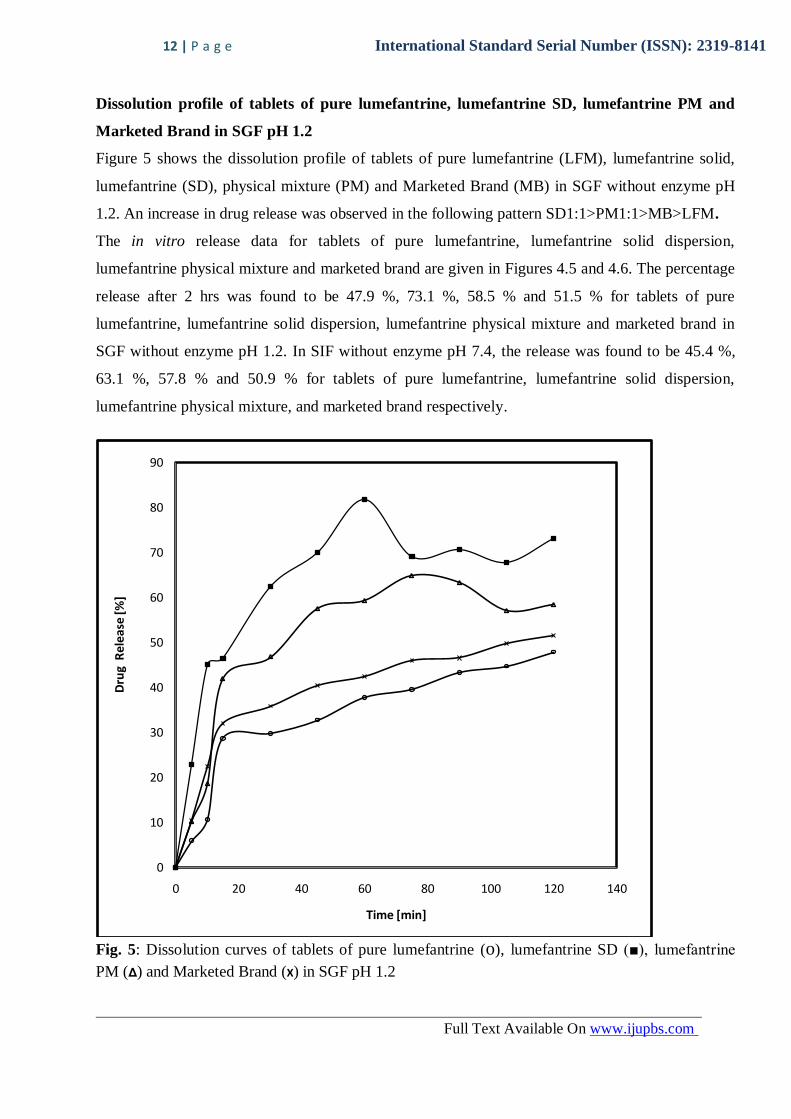
Dissolution profile of tablets of pure lumefantrine, lumefantrine SD, lumefantrine PM and
Marketed Brand in SGF pH 1.2
Figure 5 shows the dissolution profile of tablets of pure lumefantrine (LFM), lumefantrine solid,
lumefantrine (SD), physical mixture (PM) and Marketed Brand (MB) in SGF without enzyme pH
1.2. An increase in drug release was observed in the following pattern SD1:1>PM1:1>MB>LFM.
The in vitro release data for tablets of pure lumefantrine, lumefantrine solid dispersion,
lumefantrine physical mixture and marketed brand are given in Figures 4.5 and 4.6. The percentage
release after 2 hrs was found to be 47.9 %, 73.1 %, 58.5 % and 51.5 % for tablets of pure
lumefantrine, lumefantrine solid dispersion, lumefantrine physical mixture and marketed brand in
SGF without enzyme pH 1.2. In SIF without enzyme pH 7.4, the release was found to be 45.4 %,
63.1 %, 57.8 % and 50.9 % for tablets of pure lumefantrine, lumefantrine solid dispersion,
lumefantrine physical mixture, and marketed brand respectively.
Fig. 5: Dissolution curves of tablets of pure lumefantrine (o), lumefantrine SD (■), lumefantrine
PM (Δ) and Marketed Brand (X) in SGF pH 1.2
0
10
20
30
40
50
60
70
80
90
0 20 40 60 80 100 120 140
Dru
g R
elea
se [%
]
Time [min]
13 | P a g e International Standard Serial Number (ISSN): 2319-8141
Full Text Available On www.ijupbs.com
Key
PM: Physical Mixtures
SD: Solid Dispersions
LFM: Lumefantrine
MB: Marketed Brand
The lumefantrine solid dispersion tablets showed a greater release of the drug in both SGF without
enzyme (pH 1.2) and SIF without enzyme (pH 7.4) compared to tablets of pure lumefantrine,
lumefantrine physical mixture and marketed brand. In both SGF without enzyme (pH 1.2) and SIF
without enzyme (pH 7.4), the release pattern was in the following order: SD1:1 > PM 1:1 > MB >
tablets of pure lumefantrine. Also, a greater (73.1 %) release of the drug was observed in SGF
without enzyme (pH 1.2) as compared to 63.1 % in SIF without enzyme (pH 7.4) after 2 hrs.
The calculated dissolution parameters revealed that pure lumefantrine exhibited a slow initial
dissolution rate and the maximum amount of drug dissolved after 2 h was 47.9 % in SGF without
enzyme (pH 1.2). Statistically significant difference; ρ = 0.009 and 0.03 for of dissolution rate of
tablets of pure lumefantrine/SD1:1 and tablets of SD1:1/marketed brands respectively.
CONCLUSION
Solid dispersion technique can effectively be used to modify drug release by using hydrophobic
carriers such as Poloxamer 188. Solid dispersions of lumefantrine using Poloxamer 188 enhanced it
aqueous solubility and dissolution rate. Tablets formulated from 1:1 lumefantrine-poloxamer solid
dispersion showed higher dissolution rate compared to commercially available lumefantrine tablets.
Thus, the developed lumefantrine solid dispersion can be further explored to develop products with
enhanced bioavailability for more effective treatment of malaria.
ACKNOWLEDGEMENT
The authors are thankful to the management of Afrab Chem Nigeria Ltd for the kind donation of
pure samples of artemether.
CONFLICT OF INTEREST
The authors do not have any conflict of interests in the preparation of this paper.
REFERENCES:
1. Patel k, Sarma V, Vavia P. Design and evaluation of lumefantrine – Oleic acid self
nanoemulsifying ionic complex for enhanced dissolution. DARU Journal of Pharmaceutical
Sciences 2013; 21(1): 21 – 27.
14 | P a g e International Standard Serial Number (ISSN): 2319-8141
Full Text Available On www.ijupbs.com
2. Elizabeth A, Ashley KS, Niklas L, Anna A, Am K, Al B, Pratap S, Nicholas JW, Francois
N. How much fat is necessary to optimize lumefantrine oral bioavailability? Tropical
Medicine and International Health. 2007; 12(2): 195 – 200.
3. Gahoi S, Jain GK, Tripathi R, Pandey SK, Anwar M, Warsi MH. Enhanced antimalarial
activity of lumefantrine nanopowder prepared by wet-milling DYNO MILL technique.
2012; 95:16–22.
4. Steffen B, William MS, Sonia M, Raquel G, Anders B, Andreas M, Mary H, Elizabeth J,
Judy P, Bernhards O, Abdoulaye D, Umberto D, Anne-Claire M, Gilbert L, Steven EK. The
effect of food consumption on lumefantrine bioavailability in African children receiving
artemether–lumefantrine crushed or dispersible tablets (Coartem®) for acute uncomplicated
Plasmodium falciparum malaria. Tropical Medicine and International Health 2010; 15 (4)
434–441.
5. Ahire, BR, Rane BR, Bakliwal SR Pawar SP. Solubility enhancement of poorly water-
soluble drugs by solid dispersion techniques. International Journal of Pharmaceutical
Technology Research 2010; 2(3): 2007-2015.
6. Praveen KD, Arora V. Solid Dispersion A Review. Journal of Pharmaceutical and
Scientific Innovation 2012; 1(3): 27-34.
7. Reetika A, Seema S, Naresh SG. Solid dispersions: a review to enhance solubility of poorly
water soluble drugs. International Journal Universal Pharmacy and Bio Sciences. 2017;
6(3): 47 – 58.
8. Kapoor B, Kour R, Kour S, Behl H, Kour S. Solid Dispersion an Evolutionary Approach for
Solubility Enhancement of Poorly Water Soluble Drug. International Journal of Recent
Advance in Pharmaceutical Research 2010; 2(2): 1-16.
9. Anshu S, Jain CP. Preparation and characterization of solid dispersions of valsartan with
Poloxamer 188. Der Pharmacia Letter 2010; 2(2): 54-63.
10. Shah S, Joshi S, Lin S, Medan PL. Preparation and characterization of spironolactone and
solid dispersions using hydrophilic carriers. Asian Journal of Pharmaceutical Sciences
2012; 7(1):40-49.
11. Sahin G. Atomised melt agglomeration of lumefantrine: improvement in dissolution
characteristics. Journal of Pharmacy Research 2011; 4(5): 1520-1523.
12. Naima Z, Siro T, Manuel GDJ, Chantal C, Rene C, Jerome, D. Interaction between
carbamazepine and polyethylene glycol (PEG) 6000: characterization of the physical solid
15 | P a g e International Standard Serial Number (ISSN): 2319-8141
Full Text Available On www.ijupbs.com
dispersion and eutectic mixtures. European Journal of Pharmaceutical Sciences 2001; 12:
395-404.
13. Ngwuluka NC, Idiakhoa BA, Nep EI, Ogaji I, Okafor IS. Formulation and Evaluation of
Paracetamol Tablet Manufactured using the Dried Fruit of Phoenix dactylifera lineus as
Excipient. Research in Pharmaceutical Biotechnology 2010; 2(3): 25-32.


![A Systematic Review on Solid Dispersion: Enhancing the Solubility … · 2020. 8. 19. · and 600 nm [12]. Media milling, high pressure homogenization in water, high pressure homogenization](https://static.fdocuments.in/doc/165x107/60e10290170284029759d869/a-systematic-review-on-solid-dispersion-enhancing-the-solubility-2020-8-19.jpg)