solar technologies 2010 brocure - wintergreenresearch.comwintergreenresearch.com/reports/solar...
39
WINTERGREEN RESEARCH, INC. REPORT # SH24371852 700 PAGES 306 TABLES AND FIGURES 2010 $3,500 SINGLE COPY -- $7,000 WEB SITE POSTING [email protected] 781 863 5078 781 863 1235 Photovoltaic Solar Panel Market Shares, Strategies, and Forecasts, Worldwide, 2010 to 2016 Solar Systems Provide Energy Efficiency Picture by Susie Eustis MOUNTAINS OF OPPORTUNITY OPPORTUNITY ABOUNDS WinterGreen Research, Inc. Lexington, Massachusetts www.wintergreenresearch.com
-
Upload
duongnguyet -
Category
Documents
-
view
215 -
download
0
Transcript of solar technologies 2010 brocure - wintergreenresearch.comwintergreenresearch.com/reports/solar...

WINTERGREEN RESEARCH, INC.
REPORT # SH24371852 700 PAGES 306 TABLES AND FIGURES 2010
$3,500 SINGLE COPY -- $7,000 WEB SITE POSTING
[email protected] 781 863 5078 781 863 1235
Photovoltaic Solar Panel Market Shares, Strategies, and
Forecasts, Worldwide, 2010 to 2016
Solar Systems Provide Energy Efficiency
Picture by Susie Eustis
MOUNTAINS OF OPPORTUNITY
OPPORTUNITY ABOUNDS WinterGreen Research, Inc. Lexington, Massachusetts
www.wintergreenresearch.com

WINTERGREEN RESEARCH, INC.
REPORT # SH24371852 700 PAGES 306 TABLES AND FIGURES 2010
$3,500 SINGLE COPY -- $7,000 WEB SITE POSTING
[email protected] 781 863 5078 781 863 1235
CHECK OUT THESE KEY TOPICS
Commercial Solar Panels
Multicrystalline Module
Solar Utility
Residential Solar
Consumer Solar
Smart Grid
Solar Panel Technologies
Thin Film Solar Cells
Amorphous Silicon
Thin Film Solar Cells Cadmium Telluride
Thin Film Solar Cells CIGS
(Copper Indium Gallium Selenide)
Copper‐Indium‐Gallium‐Diselenide
Conversion Efficiency Confirmation From NREL
Thin‐Film On Glass Substrate
Solar CIGS On A Polymeric
Plastic Substrate
Solar Monolithic Integration On Glass
Substrate
Solar Modules Cadmium Telluride (CdTe)
Semiconductor Material
CIGS Photovoltaic Effect
Crystalline Silicon Indirect Band‐Gap Semiconductor
Solar Thin Film Substrates
Gettering in Large‐Grained Thin Polycrystalline
Silicon Films
Glass Substrate

WINTERGREEN RESEARCH, INC.
REPORT # SH24371852 700 PAGES 306 TABLES AND FIGURES 2010
$3,500 SINGLE COPY -- $7,000 WEB SITE POSTING
[email protected] 781 863 5078 781 863 1235
Thin‐Film Panels
Nanosolar
HelioVolt
MiaSole
First Solar
Photovoltaic Technologies
Solar Shading
Third‐Generation Thin‐Film Solar Applications
Flexible Glass Solar Panels
Polysilicon Producers
Solar Inverter
Solar Micro Inverter
Solar Panel Electricity Solutions
Solar Energy
Single Crystal Solar
Polycrystalline
Multicrystallline
Thin Film Panels
www.wintergreenresearch.com
Photovoltaic Solar Panel Strategies,
Technologies And Opportunities: Market Shares
and Forecasts, Worldwide, 2010-2016

WINTERGREEN RESEARCH, INC.
REPORT # SH24371852 700 PAGES 306 TABLES AND FIGURES 2010
$3,500 SINGLE COPY -- $7,000 WEB SITE POSTING
[email protected] 781 863 5078 781 863 1235
LEXINGTON, Massachusetts (February 26, 2010) – WinterGreen Research announces that it has a new study on Photovoltaic Solar Strategies, Technologies And Opportunities: Market Shares and Forecasts, Worldwide, 2010‐2016. The 2010 study has 700 pages, 306 tables and figures. Large solar farms are more popular initially, but solar is anticipated to be built out on commercial roof tops in increased quantity. The electricity generated will be fed to local substations and distributed to homes from there. The electricity generated will be used for both stationary power and to charge electric vehicles. Photovoltaics PV market growth depends on volume production to achieve economies of scale. Solar energy market driving forces relate to the opportunity to harness a cheap, long lasting, powerful energy source. Solar energy can be used to create electricity in huge quantity. Solar panels are mounted in a weatherproof frame, are mounted in areas with direct exposure to the sun to generate electricity from sunlight. Solar power systems are comprised of solar modules, related power electronics, and other components. Solar panels are used in residential, commercial and industrial applications. Solar compositions of arrays that comprise electric utility grids appear to be the wave of the future. The demand for solar energy is dependent on a lower prices for solar and higher prices for petroleum. A combination of economies of scale being realized in the manufacturing along with increases in the current prices for petroleum will drive solar energy adoption. The overall solar market has attained enough critical mass to boost competitive technologies of thin film and monocrystalline, polycrystalline, and multicrystalline silicon based systems. First Solar, the market leader, in commercial systems is participating in the solar markets at a level of $1.9 billion of a total 2009 market of $19.6 billion for 2009. First Solar is well positioned to gain significant market share over the next five years. First Solar basically does monolithic integration on glass, making things on the module level.

WINTERGREEN RESEARCH, INC.
REPORT # SH24371852 700 PAGES 306 TABLES AND FIGURES 2010
$3,500 SINGLE COPY -- $7,000 WEB SITE POSTING
[email protected] 781 863 5078 781 863 1235
First Solar PV modules are thin film PV modules. The achievement of reaching 1GW of modules in installations bodes well for the entire industry, bringing credibility to the solar energy effort. To support the growing demand, First Solar continues to push the limits on volume manufacturing. First Solar is integrating each production step. Sharp, the market leader, has achieved remarkable penetration of residential markets. Mass production of tandem‐type thin‐film solar cells means two types of cells are offered—crystalline types suitable for colder temperatures at high latitudes, and thin‐film types better suited to warmer regions. Sharp is a unique manufacturer in that they offer both types. Key market transitions are being made relative to smart grid, the increasing centrality of the local power substation, and implementation of the smart grid as a distribution center for electricity generated by solar power. Solar energy is being adopted because the petroleum reserves are facing depletion. Solar offers plentiful, cheap energy source with panels that have a 25 year life and payback within 10 years. The payback is within 8 months if the solar electricity generated is used to charge an electric vehicle. Thin film batteries and new utility level electricity storage are evolving. Thin film batteries are expected to power electric vehicles and sit on the ground outside homes and apartment buildings to store the electricity generated by solar. Thin film batteries provide the bridge to offer electricity when the sun it not shining. Thin film batteries fuel growth in solar markets. These markets are set to evolve even faster than anyone has thought. Sharp, First Solar, Trina Solar, Suntech, and Ascent Solar Technologies are among the companies anticipated to benefit from the build out of solar energy. These are the companies positioned to leverage solar energy market growth. These market participants continue to be very aggressive in both internal innovation commitments, as well as partnership and acquisition strategies. According to Susan Eustis, President of WinterGreen Research, “Worldwide solar markets are poised to achieve significant growth as solar energy is widely adopted, creating economies of scale and funding new technology efficiencies. Manufacturing efficiencies are expected to create new uses and permit users to leverage existing ones. Costs of solar panels are expected to decrease rapidly in response to the continuing economies of scale. Market strategies of the leaders Sharp First Solar, and Trina are compelling in their innovation and flexibility”

WINTERGREEN RESEARCH, INC.
REPORT # SH24371852 700 PAGES 306 TABLES AND FIGURES 2010
$3,500 SINGLE COPY -- $7,000 WEB SITE POSTING
[email protected] 781 863 5078 781 863 1235
Emerging markets depend on 100 successful trials and reference accounts. Solar energy has now surpassed that magic number and is poised for rapid growth. The reference accounts are in place, the prices of the solar modules are decreasing at a faster pace than the industry had predicted, grid parity has been achieved in some places and is on track to be achieved everywhere. Investment in solar energy is anticipated to continue. Participants will come and go, industry consolidation and high growth patterns will alternate until the nascent industry stabilizes, but solar energy is here to stay. Solar energy is in place. It works, it is no longer a dream or a long shot, it is real. Read the study, look at the pictures of the large number of installations, this is an amazing market, emerging long after early efforts to bring these technologies to reality: Why is it here now? Solar energy is evolving because the price of gasoline in going to continue to climb. Solar energy markets are big. At $19.6 billion in 2009 solar panels are anticipated to reach$125.5 billion by 2016. Market growth comes because the technology has caught the imagination of everyone, consumers, vendors, governments, politicians, oil producers, and the utility industry. The technology works, its benefits have a positive ROI over the useful life of the panels, even a significant payback. Solar provides the cheap, clean, dependable energy source needed to drive industrial growth, available. Keywords:,solar panel, solar electricity, solar market shares, solar market forecasts,solar technology,CIGS,Photovoltaic,Solar, thin film,crystalline,Substrate,Solar Modules Cadmium Telluride (CdTe) Semiconductor Material, Flexible Glass Solar Panels,Polysilicon Producers,Solar Inverter, Solar Micro Inverter, http://wintergreenresearch.com/reports/solar.htm
YOU MUST HAVE THIS STUDY

WINTERGREEN RESEARCH, INC.
REPORT # SH24371852 700 PAGES 306 TABLES AND FIGURES 2010
$3,500 SINGLE COPY -- $7,000 WEB SITE POSTING
[email protected] 781 863 5078 781 863 1235
Companies Profiled
Market Leaders
Sharp First Solar SunTech
Ascent Solar Technologies SolarWorld
BP Solar Q Cells
LDK Solar Yingli Green Energy
Trina Solar Canadian Solar Solarfun-Power
Sunpower Evergreen ET Solar
China Sunergy Energy Conversion Devices / United Solar Ovonic
Shenzhen Sunshine Electronics Kyocera Sanyo
Mitsubishi
WINTERGREEN RESEARCH, INC.
REPORT # SH24371852 700 PAGES 306 TABLES AND FIGURES 2010
$3,500 SINGLE COPY -- $7,000 WEB SITE POSTING
[email protected] 781 863 5078 781 863 1235
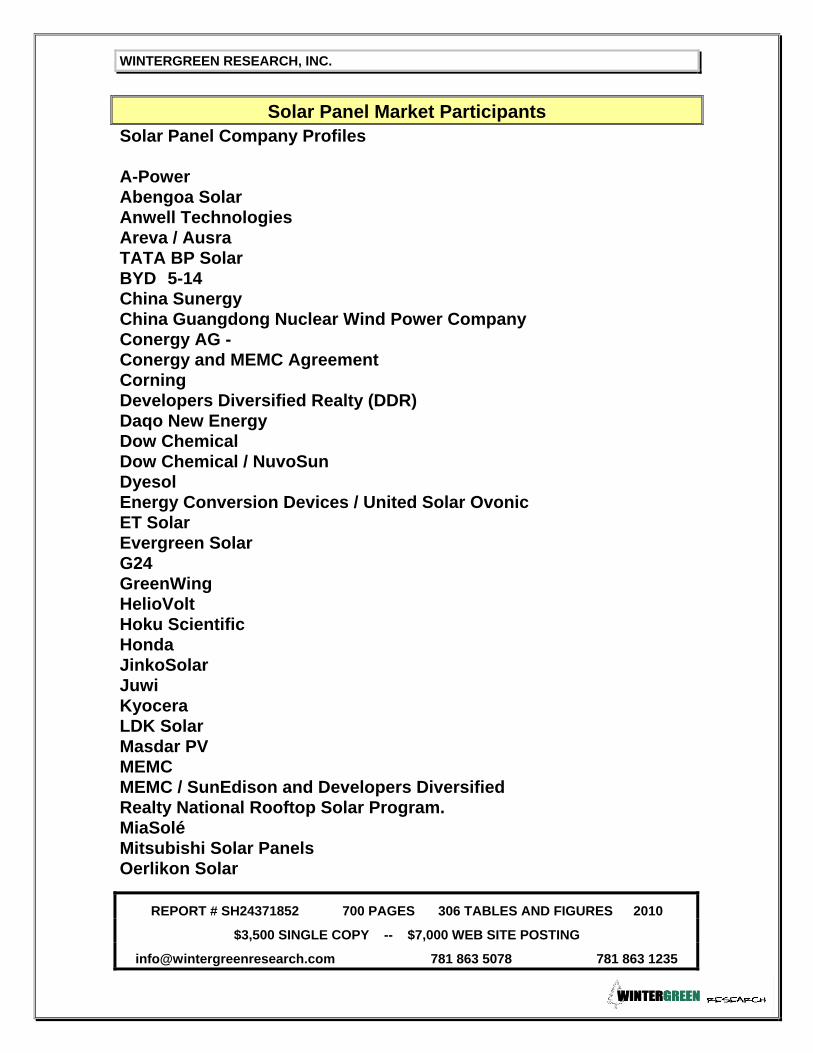
Solar Panel Market Participants Solar Panel Company Profiles A-Power Abengoa Solar Anwell Technologies Areva / Ausra TATA BP Solar BYD 5-14 China Sunergy China Guangdong Nuclear Wind Power Company Conergy AG - Conergy and MEMC Agreement Corning Developers Diversified Realty (DDR) Daqo New Energy Dow Chemical Dow Chemical / NuvoSun Dyesol Energy Conversion Devices / United Solar Ovonic ET Solar Evergreen Solar G24 GreenWing HelioVolt Hoku Scientific Honda JinkoSolar Juwi Kyocera LDK Solar Masdar PV MEMC MEMC / SunEdison and Developers Diversified Realty National Rooftop Solar Program. MiaSolé Mitsubishi Solar Panels Oerlikon Solar

WINTERGREEN RESEARCH, INC.
REPORT # SH24371852 700 PAGES 306 TABLES AND FIGURES 2010
$3,500 SINGLE COPY -- $7,000 WEB SITE POSTING
[email protected] 781 863 5078 781 863 1235
Petra Solar PNM 5-106 Ranking Solar Samsung Sanyo Scatec Solar Schott Sharp LCD Shell Oil Solar Energy Initiatives Shenzhen Sunshine Electronics Singulus Technologies SMA Solar Technology AG SMA Solar Solyndra Staples (SPLS) Solarfun Solar Fusion Power SolarWorld Sun Fields Europe SolFocus Stirling Solar Suniva Inc. SunTech SunPower SunPower Acquires SunRay Telio Solar / Telconord - Agencia de Energías Renovables Tianwei Xinjiang Goldwind

WINTERGREEN RESEARCH, INC.
REPORT # SH24371852 700 PAGES 306 TABLES AND FIGURES 2010
$3,500 SINGLE COPY -- $7,000 WEB SITE POSTING
[email protected] 781 863 5078 781 863 1235
Photovoltaic Solar Panel Market Shares, Strategies, And Forecasts, Worldwide, 2010 to 2016
Report Methodology
This is the 437th report in a series of primary market research reports that provide forecasts in solar energy, robots, communications, telecommunications, the Internet, computer, software, telephone equipment, health equipment, and batteries to store energy. Automated process and significant growth potential are a priorities in topic selection. The project leaders take direct responsibility for writing and preparing each report. They have significant experience preparing industry studies. Forecasts are based on primary research and proprietary data bases. The primary research is conducted by talking to customers, distributors and companies. The survey data is not enough to make accurate assessment of market size, so WinterGreen Research looks at the value of shipments and the average price to achieve market assessments. Our track record in achieving accuracy is unsurpassed in the industry. We are known for being able to develop accurate market shares and projections. This is our specialty. The analyst process is concentrated on getting good market numbers. This process involves looking at the markets from several different perspectives, including vendor shipments. The interview process is an essential aspect as well. We do have a lot of granular analysis of the different shipments by vendor in the study and addenda prepared after the study was published if that is appropriate. Forecasts reflect analysis of the market trends in the segment and related segments. Unit and dollar shipments are analyzed through consideration of dollar volume of each market participant in the segment. Installed base analysis and unit analysis is based on interviews and an information search. Market share analysis includes conversations with key customers of products, industry segment leaders, marketing directors, distributors, leading market participants, opinion leaders, and companies seeking to develop measurable market share.
WINTERGREEN RESEARCH, INC.
REPORT # SH24371852 700 PAGES 306 TABLES AND FIGURES 2010
$3,500 SINGLE COPY -- $7,000 WEB SITE POSTING
[email protected] 781 863 5078 781 863 1235
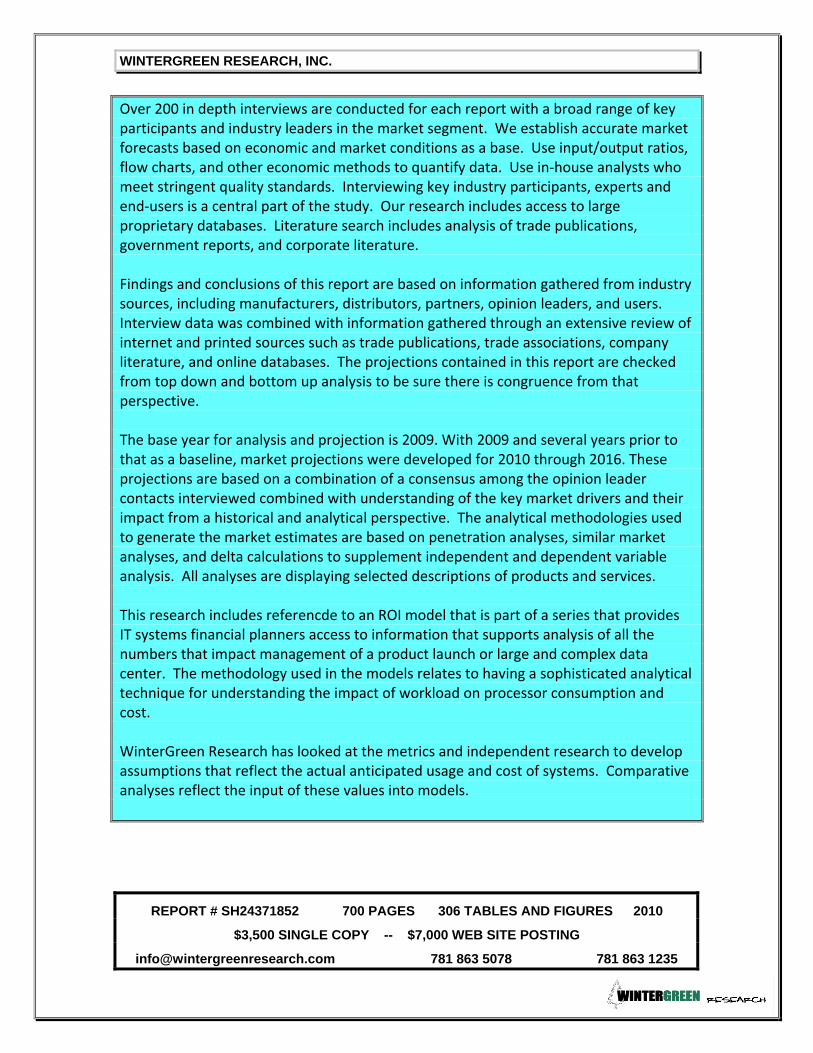
Over 200 in depth interviews are conducted for each report with a broad range of key participants and industry leaders in the market segment. We establish accurate market forecasts based on economic and market conditions as a base. Use input/output ratios, flow charts, and other economic methods to quantify data. Use in‐house analysts who meet stringent quality standards. Interviewing key industry participants, experts and end‐users is a central part of the study. Our research includes access to large proprietary databases. Literature search includes analysis of trade publications, government reports, and corporate literature. Findings and conclusions of this report are based on information gathered from industry sources, including manufacturers, distributors, partners, opinion leaders, and users. Interview data was combined with information gathered through an extensive review of internet and printed sources such as trade publications, trade associations, company literature, and online databases. The projections contained in this report are checked from top down and bottom up analysis to be sure there is congruence from that perspective. The base year for analysis and projection is 2009. With 2009 and several years prior to that as a baseline, market projections were developed for 2010 through 2016. These projections are based on a combination of a consensus among the opinion leader contacts interviewed combined with understanding of the key market drivers and their impact from a historical and analytical perspective. The analytical methodologies used to generate the market estimates are based on penetration analyses, similar market analyses, and delta calculations to supplement independent and dependent variable analysis. All analyses are displaying selected descriptions of products and services.
This research includes referencde to an ROI model that is part of a series that provides IT systems financial planners access to information that supports analysis of all the numbers that impact management of a product launch or large and complex data center. The methodology used in the models relates to having a sophisticated analytical technique for understanding the impact of workload on processor consumption and cost. WinterGreen Research has looked at the metrics and independent research to develop assumptions that reflect the actual anticipated usage and cost of systems. Comparative analyses reflect the input of these values into models.

WINTERGREEN RESEARCH, INC.
REPORT # SH24371852 700 PAGES 306 TABLES AND FIGURES 2010
$3,500 SINGLE COPY -- $7,000 WEB SITE POSTING
[email protected] 781 863 5078 781 863 1235
The variables and assumptions provided in the market research study and the ROI models are based on extensive experience in providing research to large enterprise organizations and data centers. The ROI models have lists of servers from different manufacturers, Systems z models from IBM, and labor costs by category around the world. This information has been developed from WinterGreen research proprietary data bases constructed as a result of preparing market research studies that address the software, energy, healthcare, telecommunicatons, and hardware businesses.
Photovoltaic Solar Panel Strategies,
Technologies And Opportunities: Market Shares
and Forecasts, Worldwide, 2010-2016
Table of Contents
Photovoltaic Solar Executive Summary
SOLAR TECHNOLOGY EXECUTIVE SUMMARY ES-1 Solar Energy Market Driving Forces ES-1 Solar Energy Market Shares ES-3 Photovoltaic Solar Energy Market Forecasts ES-5
Solar Industry Outlook ES-6 100 Successful Trials And Reference Accounts ES-7 Solar Utility Market Driving Forces ES-8
Commercial Solar ES-9

WINTERGREEN RESEARCH, INC.
REPORT # SH24371852 700 PAGES 306 TABLES AND FIGURES 2010
$3,500 SINGLE COPY -- $7,000 WEB SITE POSTING
[email protected] 781 863 5078 781 863 1235
Photovoltaic Solar Market Description And Market Dynamics
1. SOLAR TECHNOLOGY MARKET DESCRIPTION AND MARKET DYNAMICS 1-1 1.1 Solar Technologies 1-1
1.1.1 Research Initiatives 1-2 1.1.2 Thin Film Material Layers 1-3
1.2 Photovoltaic Conversion Of Sun Light 1-4 1.2.1 Solar Panel Orientation 1-6
1.3 Thin Film Solar Materials 1-8 1.4 Sunlight Intensity in Various Regions 1-9
1.4.1 Sunshine Index 1-13 1.4.2 Economics of PV 1-14
1.5 Variety of Solar Panel Installations 1-16 1.5.1 Off-Grid Systems: 1-21
1.6 Solar Technology 1-25 1.6.1 Cost-Competitive Solar 1-25 1.6.2 Crystalline-Silicon Panels 1-27 1.6.3 Thin-Film Solar 1-27 1.6.4 Silicon or CIGS 1-28
1.7 World's Largest PV Installation German Solar 1-31 1.8 The Basics of Solar Electricity 1-33 1.9 Utility Power Positioning 1-35
1.9.1 Utility Solar Decision Making 1-36 1.10 U.S. Building Construction Industry 1-38 1.11 Silicon Panels Harvest More Energy 1-41
1.11.1 Solar Real Estate 1-42 1.12 Smart Electric Grid Overhaul: Utility 1-43
1.12.1 IBM Smart Grid 1-43 1.12.2 U.S. Electric Grid Needs Major Overhaul: Utility 1-44 1.12.3 Flexible Solar Cells With Silicon Wires 1-44
1.13 Competition and Advanced PV Technologies 1-46 1.14 Parts Of The Solar Cell Manufacturing Process 1-47
1.14.1 Silicon Crystal Growing or Casting Plants 1-47 1.14.2 Solar Cell Plants 1-49 1.14.3 Module Assembly Plants 1-51 1.14.4 Systems Assembly 1-52
1.15 Greenhouse Gases 1-53 1.16 Productionizing Technologies 1-53 1.17 Era Of Cheap Energy 1-55
1.17.1 Unprecedented Level Of Development Worldwide 1-56 1.17.2 Population Increases 1-57
1.18 Tackling Climate Change 1-57 1.19 Power From the Sun 1-58
1.19.1 PV Industry 1-59 1.19.2 SGS Solar Services 1-60
WINTERGREEN RESEARCH, INC.
REPORT # SH24371852 700 PAGES 306 TABLES AND FIGURES 2010
$3,500 SINGLE COPY -- $7,000 WEB SITE POSTING
[email protected] 781 863 5078 781 863 1235
Photovoltaic Solar Market Shares And Market Forecasts
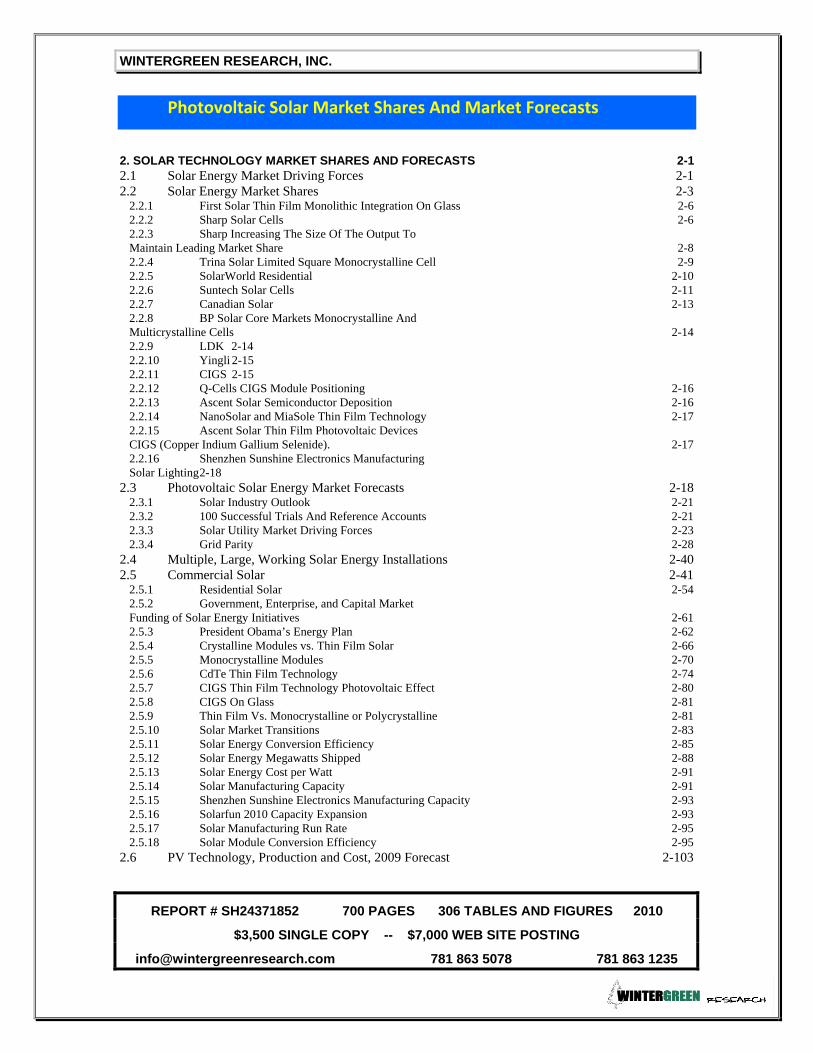
2. SOLAR TECHNOLOGY MARKET SHARES AND FORECASTS 2-1 2.1 Solar Energy Market Driving Forces 2-1 2.2 Solar Energy Market Shares 2-3
2.2.1 First Solar Thin Film Monolithic Integration On Glass 2-6 2.2.2 Sharp Solar Cells 2-6 2.2.3 Sharp Increasing The Size Of The Output To Maintain Leading Market Share 2-8 2.2.4 Trina Solar Limited Square Monocrystalline Cell 2-9 2.2.5 SolarWorld Residential 2-10 2.2.6 Suntech Solar Cells 2-11 2.2.7 Canadian Solar 2-13 2.2.8 BP Solar Core Markets Monocrystalline And Multicrystalline Cells 2-14 2.2.9 LDK 2-14 2.2.10 Yingli 2-15 2.2.11 CIGS 2-15 2.2.12 Q-Cells CIGS Module Positioning 2-16 2.2.13 Ascent Solar Semiconductor Deposition 2-16 2.2.14 NanoSolar and MiaSole Thin Film Technology 2-17 2.2.15 Ascent Solar Thin Film Photovoltaic Devices CIGS (Copper Indium Gallium Selenide). 2-17 2.2.16 Shenzhen Sunshine Electronics Manufacturing Solar Lighting 2-18
2.3 Photovoltaic Solar Energy Market Forecasts 2-18 2.3.1 Solar Industry Outlook 2-21 2.3.2 100 Successful Trials And Reference Accounts 2-21 2.3.3 Solar Utility Market Driving Forces 2-23 2.3.4 Grid Parity 2-28
2.4 Multiple, Large, Working Solar Energy Installations 2-40 2.5 Commercial Solar 2-41
2.5.1 Residential Solar 2-54 2.5.2 Government, Enterprise, and Capital Market Funding of Solar Energy Initiatives 2-61 2.5.3 President Obama’s Energy Plan 2-62 2.5.4 Crystalline Modules vs. Thin Film Solar 2-66 2.5.5 Monocrystalline Modules 2-70 2.5.6 CdTe Thin Film Technology 2-74 2.5.7 CIGS Thin Film Technology Photovoltaic Effect 2-80 2.5.8 CIGS On Glass 2-81 2.5.9 Thin Film Vs. Monocrystalline or Polycrystalline 2-81 2.5.10 Solar Market Transitions 2-83 2.5.11 Solar Energy Conversion Efficiency 2-85 2.5.12 Solar Energy Megawatts Shipped 2-88 2.5.13 Solar Energy Cost per Watt 2-91 2.5.14 Solar Manufacturing Capacity 2-91 2.5.15 Shenzhen Sunshine Electronics Manufacturing Capacity 2-93 2.5.16 Solarfun 2010 Capacity Expansion 2-93 2.5.17 Solar Manufacturing Run Rate 2-95 2.5.18 Solar Module Conversion Efficiency 2-95
2.6 PV Technology, Production and Cost, 2009 Forecast 2-103

WINTERGREEN RESEARCH, INC.
REPORT # SH24371852 700 PAGES 306 TABLES AND FIGURES 2010
$3,500 SINGLE COPY -- $7,000 WEB SITE POSTING
[email protected] 781 863 5078 781 863 1235
Photovoltaic Solar Product Description
3. SOLAR PRODUCT DESCRIPTION 3-1 3.1 Commercial Solar 3-1 3.2 First Solar Commercial Systems 3-2
3.2.1 First Solar Positioning 3-3 3.2.2 First Solar Energy High Performance. High Volume 3-4 3.2.3 First Solar Commercial-Scale Solutions 3-6 3.2.4 First Solar Largest Solar Power Plant Built In China by Americans 3-12
3.3 Trina Solar 3-12 3.4 Energy From Trina Solar Modules 3-14
3.4.1 Trina Solar Monocrystalline Modules 3-16 3.4.2 Trina Solar TSM-PC05, 215W to 235W Multicrystalline Module 3-21
3.5 Q Cells 3-39 3.5.1 Q-Cells CIGS Modules 3-39 3.5.2 Q Cells Cdte Solar Modules 3-50
3.6 Sharp 3-50 3.6.1 Sharp Solar Cell With The Highest Efficiency Of Conversion In The World 3-54 3.6.2 Sharp Mass Production Of Solar Cells 3-54
3.7 Mia Sole 3-56 3.7.1 Mia Sole Thin Film CIGS Solar 3-56 3.7.2 MiaSolé’s CIGS Solar Cell 3-59 3.7.3 Miasolé CIGS-Based Thin Film Solar Panel Manufacturing 3-62
3.8 Nanosolar 3-64 3.8.1 Nanosolar Commercial Production 3-65
3.9 Palios Flexible Glass 3-65 3.10 BYD 3-67
3.10.1 China BYD to invest $3.3 billion in solar battery plant 3-67 3.11 Armageddon Energy 3-68 3.12 United Solar Ovonic 3-68 3.13 NuvoSun 3-68
3.13.1 Dow Chemical / NuvoSun 3-69 3.14 Kyocera 3-70 3.15 SunWize Technologies 3-77 3.16 Sanyo 3-78
3.16.1 Sanyo Hit Solar Panels 3-79 3.17 REC 3-83 3.18 Canadian Solar 3-86 3.19 GE Solar Panel 3-87 3.20 BP Solar 3-88
3.20.1 British Petroleum BP Solar Panels 3-88 3.21 SolarWorld 3-90 3.22 Suntech 3-91
3.22.1 Suntech HiPerformaTM Modules 3-93 3.22.2 Suntech Solar Cells 3-96
3.23 Uni-Solar 3-97 3.24 HelioVolt 3-97 3.25 Ascent Solar 3-98

WINTERGREEN RESEARCH, INC.
REPORT # SH24371852 700 PAGES 306 TABLES AND FIGURES 2010
$3,500 SINGLE COPY -- $7,000 WEB SITE POSTING
[email protected] 781 863 5078 781 863 1235
3.26 Ascent Solar 3-99 3.27 Solarion Process 3-100 3.28 Global Solar 3-101 3.29 JA Solar 3-101 3.30 Suniva Solar Cells Set For Aerotropolis Atlanta 3-101
3.30.1 Suniva 3-103 3.30.2 Suniva® Intersection Of High Efficiency And Low Cost 3-103 3.30.3 Suniva Collaborating in Solar 3-103 3.30.4 Suniva Product Offerings: 3-105 3.30.5 Suniva Intersection of High Efficiency and Low Cost 3-111
3.31 Utility-Scale Solar Solutions 3-114 3.32 First Solar Utility-Scale Solutions 3-114 3.33 Trina Solar Utility 3-118 3.34 Kyocera Solar Utility 3-120 3.35 Sharp Utility Solar Installation 3-123
3.35.1 Sharp Utility-Scale Products 3-125 3.36 Scatec Solar 3-128
3.36.1 Scatec Solar Utility Project Development Phase 3-130 3.37 Residential Solar 3-132 3.38 Sharp Residential 3-133
3.38.1 Sharp OnEnergy™ Roof-Mounted Solar Electric Systems 3-134 3.38.2 Sharp High-Power Monocrystalline Residential Solar Modules 3-135
3.39 First Solar U.S. Residential and Small Commercial Solutions 3-136 3.40 SolarCity 3-138 3.41 Scatec Solar Residential 3-138 3.42 Solar Energy Initiatives 3-142 3.43 SolarWorld Residential 3-144 3.44 Consumer Solar 3-150 3.45 G24 Innovations 3-150
3.45.1 G24 The Solar Power Lamp 3-152 3.46 Smart Grid 3-155 3.47 Petra Solar Pole Based Solar Collectors 3-156
Photovoltaic Solar Technology
4. SOLAR STRATEGY, TECHNOLOGY, AND INDUSTRY SPECIFIC APPLICATIONS 4-1 4.1 Solar Panel Technologies 4-1
4.1.1 Thin Film Solar Cells Amorphous Silicon 4-2 4.1.2 Thin Film Solar Cells Cadmium Telluride 4-2 4.1.3 Thin Film Solar Cells CIGS (Copper Indium Gallium Selenide) 4-3 4.1.4 Miasolé Copper-Indium-Gallium-Diselenide Films Conversion Efficiency Confirmation From NREL 4-3 4.1.5 Thin-Film On Glass Substrate 4-5 4.1.6 Ascent Solar Putting CIGS On A Polymeric Or Plastic Substrate 4-5 4.1.7 First Solar Monolithic Integration On Glass 4-5

WINTERGREEN RESEARCH, INC.
REPORT # SH24371852 700 PAGES 306 TABLES AND FIGURES 2010
$3,500 SINGLE COPY -- $7,000 WEB SITE POSTING
[email protected] 781 863 5078 781 863 1235
4.1.8 Substrate Discussion 4-10 4.1.9 First Solar Modules Cadmium Telluride (CdTe) Semiconductor Material 4-10
4.2 Trina Solar Silicon Panels 4-21 4.3 Q Cells Technology 4-22 4.4 SunTech 4-23 4.5 CIGS Photovoltaic Effect 4-24
4.5.1 Crystalline Silicon Indirect Band-Gap Semiconductor 4-24 4.5.2 Solar Thin Film Substrates 4-25 4.5.3 Gettering in Large-Grained Thin Polycrystalline Silicon Films on Glass Substrate 4-26 4.5.4 EPV Solar Contracts Deliver 300 Megawatts Of Thin-Film Panels Through 2012. 4-27 4.5.5 Nanosolar 4-27 4.5.6 HelioVolt 4-27 4.5.7 First Solar 4-27 4.5.8 Photovoltaic Technologies: Single Crystal, Polycrystalline and Thin Film 4-27 4.5.9 Single Crystal and Polycrystalline 4-27 4.5.10 Thin Film Panels 4-29
4.6 Shading 4-31 4.7 Third-Generation Thin-Film Solar Applications 4-33 4.8 Flexible Glass Solar Panels 4-34 4.9 Polysilicon Producers 4-37
4.9.1 Emerging Global Solar Polysilicon Producers 4-39 4.10 Inverter and Micro Inverter Markets 4-40
Photovoltaic Solar Company Profiles
5. SOLAR COMPANY PROFILES 5-1 5.1 Selected Solar Companies 5-1 5.2 A-Power 5-1 5.3 Abengoa Solar 5-1 5.4 Anwell Technologies 5-2 5.5 Areva / Ausra 5-2
5.5.1 Areva New Strategy 5-3 5.6 Ascent Solar Technologies 5-3
5.6.1 Ascent Solar Technologies Completed Construction Of A 1.5 MW Production Line 5-4
5.7 BP 5-7 5.7.1 BP brands 5-7 5.7.2 BP Solar Revenue 5-10 5.7.3 BP Solar 5-12 5.7.4 TATA BP Solar 5-13
5.8 BYD 5-14 5.9 China Sunergy 5-15 5.10 Canadian Solar 5-16 5.11 China Guangdong Nuclear Wind Power Company 5-19 5.12 Conergy AG - 5-19

WINTERGREEN RESEARCH, INC.
REPORT # SH24371852 700 PAGES 306 TABLES AND FIGURES 2010
$3,500 SINGLE COPY -- $7,000 WEB SITE POSTING
[email protected] 781 863 5078 781 863 1235
5.12.1 Conergy Solar System Integration 5-20 5.12.2 Conergy Sale of Solar Water Pump Division to Innovative Solar Solutions 5-20 5.12.3 Conergy and MEMC Agreement 5-20
5.13 Corning 5-21 5.13.1 Corning A Growth Company 5-22 5.13.2 Corning Worldwide LCD TV 5-22 5.13.3 Other Corning Businesses 5-23 5.13.4 Corning 2010 Market Strength 5-23 5.13.5 Corning Specialty Materials Segment Gorilla Scratch-Resistant Cover Glass 5-24 5.13.6 Corning Fourth-Quarter Revenue 5-25
5.14 Developers Diversified Realty (DDR) 5-25 5.15 Daqo New Energy 5-26 5.16 Dow Chemical 5-26
5.16.1 Dow Chemical / NuvoSun 5-27 5.17 Dyesol 5-28 5.18 Energy Conversion Devices / United Solar Ovonic 5-29
5.18.1 Energy Conversion Devices Revenues 5-30 5.18.2 Energy Conversion Devices 1.87 Megawatt Uni- Solar Installation on Flanders Expo Hall in Belgium 5-31 5.18.3 Energy Conversion Devices Integrated And Commercial Rooftop Photovoltaics 5-32
5.19 ET Solar 5-35 5.19.1 ET Solar Vertically Integrated Solar Energy 5-36 5.19.2 ET Solar / USE: 5-37
5.20 Evergreen Solar 5-37 5.20.1 Evergreen Solar's Quarterly Loss Widens 5-37 5.20.2 Evergreen Solar String Ribbon™ Solar Panels 5-39
5.21 First Solar 5-40 5.21.1 First Solar Comprehensive Photovoltaic (PV) System Solutions 5-41 5.21.2 PNM Electric Utility, First Solar Contract for 22 Megawatts of Utility Scale Solar Power for New Mexico 5-49 5.21.3 First Solar Competitive Positioning in Thin Film 5-52 5.21.4 First Solar Revenue 5-52 5.21.5 First Solar Partners 5-58 5.21.6 First Solar Strategy 5-59
5.22 G24 5-64 5.22.1 G24I Dye Sensitized Solar Cell Technology Platform 5-66
5.23 GreenWing 5-67 5.24 HelioVolt 5-67 5.25 Hoku Scientific 5-67
5.25.1 Hoku Scientific 5-68 5.26 Honda 5-69
5.26.1 Honda Solar Power 5-70 5.26.2 Honda Soltec 5-74
5.27 JinkoSolar 5-74 5.28 Juwi 5-74 5.29 Kyocera 5-75
5.29.1 Kyocera Solar 5-76 5.29.2 Kyocera Supplies. 40 MW at Large-Scale Solar Power Plants in Spain 5-77
5.30 LDK Solar 5-81

WINTERGREEN RESEARCH, INC.
REPORT # SH24371852 700 PAGES 306 TABLES AND FIGURES 2010
$3,500 SINGLE COPY -- $7,000 WEB SITE POSTING
[email protected] 781 863 5078 781 863 1235
5.30.1 LDK Solar Revenue 5-83 5.30.2 LDK Solar and Q-Cells Continuation of Supply Contract 5-86
5.31 Masdar PV 5-89 5.31.1 Masdar PV Si thin film module 1,4m² 5-91
5.32 MEMC 5-92 5.32.1 MEMC Electronic Materials / SunEdison 5-93 5.32.2 MEMC / SunEdison and Developers Diversified Realty National Rooftop Solar Program. 5-93 5.32.3 MEMC / SunEdison’s REIT Solar Program Power Hosting 5-94
5.33 MiaSolé 5-95 5.33.1 Miasolé Technology Problems Fixed: 5-95 5.33.2 Miasolé Financing & Underwriting 5-98 5.33.3 MiaSolé Commercial Shipments to Multiple Customers 5-99
5.34 Mitsubishi Solar Panels 5-100 5.35 Oerlikon Solar 5-103
5.35.1 Oerlikon Coating 5-103 5.35.2 Oerlikon Coating Business Units / Market Areas / Applications 5-105
5.36 Petra Solar 5-105 5.37 PNM 5-106 5.38 Q Cells 5-106
5.38.1 Q-Cells Revenue Development 5-111 5.39 Ranking Solar 5-113 5.40 Samsung 5-114 5.41 Sanyo 5-114 5.42 Scatec Solar 5-115
5.42.1 Scatec Solar Engaging In Rural Electrification In Emerging Markets 5-118
5.43 Schott 5-118 5.43.1 Schott Business 5-119
5.44 Sharp 5-120 5.44.1 Sharp LCD 5-120 5.44.2 Sharp Solar Cell Plant 5-121 5.44.3 Sharp Thin-Film Solar Cell Facilities 5-122 5.44.4 Sharp Revenue 5-124
5.45 Shell Oil 5-126 5.46 Solar Energy Initiatives 5-129 5.47 Shenzhen Sunshine Electronics 5-130 5.48 Singulus Technologies 5-136 5.49 SMA Solar Technology AG 5-136 5.50 SMA Solar 5-137 5.51 Solyndra 5-138
5.51.1 Solyndra: 1.9 MW Project Installed 5-139 5.52 Staples (SPLS) 5-140 5.53 Solarfun 5-141
5.53.1 Solarfun Third Quarter 2009 Revenue 5-142 5.53.2 Solarfun Revenue First Quarter 2009 5-143 5.53.3 Solarfun PV Module Contracts Total 12.65 MW in China 5-144 5.53.4 Solarfun 2010 Capacity Expansion 5-145 5.53.5 Solarfun to Build 100MW Solar Power Plant in Jiayuguan City, Gansu Province 5-145
5.54 Solar Fusion Power 5-146 5.55 SolarWorld 5-148

WINTERGREEN RESEARCH, INC.
REPORT # SH24371852 700 PAGES 306 TABLES AND FIGURES 2010
$3,500 SINGLE COPY -- $7,000 WEB SITE POSTING
[email protected] 781 863 5078 781 863 1235
5.55.1 Solar World Revenue 5-149 5.55.2 SolarWorld’s Sun Modules 5-151 5.55.3 Solar World Revenues 5-152
5.56 Sun Fields Europe 5-156 5.57 SolFocus 5-156
5.57.1 SolFocus GreenWing Energy Has Agreement with Utility Scale Deployments of Concentrator Photovoltaic (CPV) Systems 5-156 5.57.2 SolFocus Raises over $77 Million 5-158
5.58 Stirling Solar 5-160 5.59 Suniva Inc. 5-160 5.60 SunTech 5-161 5.61 SunPower 5-167
5.61.1 SunPower Revenue 5-168 5.61.2 SunPower Revenue 5-170 5.61.3 SunPower Acquires SunRay 5-170
5.62 Telio Solar / Telconord - Agencia de Energías Renovables 5-171 5.63 Tianwei 5-172 5.64 Trina Solar 5-172
5.64.1 Trina Solar Photovoltaics (PV) Modules 5-173 5.64.2 Trina Solar Net Revenues 5-175 5.64.3 Trina Solar Customers 5-176 5.64.4 Trina Solar Production Process 5-176
5.65 Yingli 5-178 5.65.1 Yingli Green Energy Revenue 5-178 5.65.2 Yingli Addresses U.S. Solar Market 5-179
5.66 Xinjiang Goldwind 5-180 5.67 Solar Energy Dealers 5-181 5.68 Solar Energy Companies 5-183
5.68.1 Top 10 Solar Panel Manufacturers in USA 5-190 5.68.2 Solar Companies 5-191
Photovoltaic Solar Regional Analysis
6 SOLAR REGIONAL ANALYSIS 6-1 6.1 Photovoltaics Solar Regional Analysis 6-1 6.2 U.S. PV Market Becomes Global Demand Leader by 2012: 6-5 6.3 Solar Regional Markets 6-13
6.3.1 US Solar Regional Initiatives 6-14 6.3.2 Denver Airport Plans Solar Power For Its Fuel Farm 6-14 6.3.3 Texas Citizens Want More Renewable Energy 6-15 6.3.4 Edison Utility Takes Part in Large Solar Power Projects 6-16 6.3.5 German Solar Subsidies 6-17 6.3.6 Germany Cuts Its Solar Feed-In Tariff 6-20 6.3.7 German Solar Cell Producers 6-22 6.3.8 Solar Market in Germany 6-22 6.3.9 Italian Solar Market 6-27 6.3.10 French Solar Market 6-27 6.3.11 EDFEN & First Solar To Build 100-MW Solar Manufacturing Plant in France 6-28 6.3.12 European Solar Project Developer Epuron 6-29

WINTERGREEN RESEARCH, INC.
REPORT # SH24371852 700 PAGES 306 TABLES AND FIGURES 2010
$3,500 SINGLE COPY -- $7,000 WEB SITE POSTING
[email protected] 781 863 5078 781 863 1235
6.3.13 Japanese Utilities Switching to Solar Power Sources 6-29 6.3.14 Australian Electricity Generated 1/5 From Green Sources By 2020 6-30 6.3.15 Largest Solar Power Plant Built In China by Americans 6-31 6.3.16 China Solar Positioning 6-32 6.3.17 Solar Roadside Electric Charging Stations In Brazil 6-35 6.3.18 India 6-36 6.3.19 New Zealand National Electricity Generator Buys a US Solar Power Plant 6-40
Concentrated Solar Power (CSP)
7 CONCENTRATED SOLAR POWER (CSP) 7-1 7.1 Concentrated Solar Power (CSP) 7-1
7.1.1 Components Of A CSP System 7-2 7.1.2 Parabolic Trough 7-3 7.1.3 Parabolic Dish 7-4 7.1.4 Central Tower 7-6 7.1.5 Solar Furnace 7-7 7.1.6 Solar Radiation Types Of Receiver 7-8
7.2 Uses Of CSP Technology 7-8 7.3 Decentralised Generation 7-10 7.4 Solar Air Conditioning 7-11
7.4.1 Solar Air Conditioning Sorbent 7-11 7.4.2 Refrigerant Circulation Systems Differentiated Processes 7-11
7.5 Go Solar California 7-14 7.5.1 Power The World From Desert 7-15
7.6 Key Elements In A Solar Cell 7-15 7.6.1 Emcore Magnifies Solar Energy 7-17 7.6.2 CPV Utility Positioning 7-18
Photovoltaic Large Utility Solar Plants
8. LARGE UTILITY SOLAR PLANTS 1 8. Solar Strategy, Technology, And Industry Specific Applications 1
WINTERGREEN RESEARCH, INC.
REPORT # SH24371852 700 PAGES 306 TABLES AND FIGURES 2010
$3,500 SINGLE COPY -- $7,000 WEB SITE POSTING
[email protected] 781 863 5078 781 863 1235
List of Tables and Figures
Photovoltaic Solar Executive Summary
Table ES-1 ES-2 Solar Energy Market Driving Forces Figure ES-2 ES-4 Solar Energy Panel Shipments Market Shares, Worldwide, Dollars, 2009 Figure ES-3 ES-6 Solar Panel Photovoltaic Market Forecasts, Dollars, Worldwide, 2010-2016
Photovoltaic Solar Market Description And Market Dynamics
Figure 1-1 1-4 Fraunhofer Institute for Solar Energy Systems Figure 1-2 1-5 Flisom thin-film technology for flexible CIGS solar cells Figure 1-3 1-7 Solar Panel Azimuth Angle and Magnetic Declination Figure 1-4 1-9 Nanocrystalline Silicon Layers Figure 1-5 1-10 Average Solar Irradiance Figure 1-6 1-11 Regional Power Output Levels Per kw Of Generation Using GE Solar Electric Power Systems Figure 1-7 1-11 Map of Solar Electricity Potential In Europe Figure 1-8 1-13 Sunshine Index, U.S. Figure 1-9 1-15 US Average Daily Solar Energy Received By A Latitude Tilt Photovoltaic Cell Figure 1-10 1-16 Solar Covered Roof Table 1-11 1-17 Solar Energy Generated as a Function of Installation Type Figure 1-12 1-18 Alternative Siteing of Solar Panels

WINTERGREEN RESEARCH, INC.
REPORT # SH24371852 700 PAGES 306 TABLES AND FIGURES 2010
$3,500 SINGLE COPY -- $7,000 WEB SITE POSTING
[email protected] 781 863 5078 781 863 1235
Figure 1-13 1-19 Arizona Springerville Generating Station Solar System28- Acre Field Of PV Panels Figure 1-14 1-20 PV In Standalone Devices Solar Parking Meter Figure 1-15 1-22 Phases of Migration to Sustainable Solar Markets Figure 1-16 1-23 Public Policy to Encourage Sustainable Economics Table 1-17 1-24 Sustainable Solar Energy Market Aspects Figure 1-18 1-29 Australian Government Solar Technology Testing Figure 1-19 1-31 Germany's Biggest Solar Installation, in Lieberose. German Tariff Cuts To Solar Figure 1-20 1-34 Solar Energy Module Table 1-21 1-40 Building And Construction Market Shifts Around Solar Energy Table 1-22 1-47 Parts Of The Solar Cell Manufacturing Process Table 1-23 1-60 Description Of Solar Services Figure 1-24 1-61 High-Tech Solar Cell Production at Deutsche Cell GmbH; Freiberg/Saxony Figure 1-25 1-62 High-Tech Solar Production At Deutsche Cell GmbH; Freiberg/Saxony
Photovoltaic Solar Market Shares and Market Forecasts
Table 2-1 2-2 Solar Energy Market Driving Forces Figure 2-2 2-4 Solar Energy Panel Shipments Market Shares, Worldwide, Dollars, 2009 Table 2-3 2-5 Solar Energy Photovoltaic Panel Shipments Market Shares, Worldwide, Dollars, 2009 Figure 2-4 2-12 Suntech Solar Cells Table 2-5 2-16 Q-Cells CIGS Module Positioning Figure 2-6 2-19 Solar Panel Photovoltaic Market Forecasts, Dollars, Worldwide, 2010-2016 Table 2-7 2-19
WINTERGREEN RESEARCH, INC.
REPORT # SH24371852 700 PAGES 306 TABLES AND FIGURES 2010
$3,500 SINGLE COPY -- $7,000 WEB SITE POSTING
[email protected] 781 863 5078 781 863 1235
Photovoltaic Solar Panel Market Forecasts, Units and Dollars, 2010-2016 (Next Page) Table 2-8 2-23 Solar Energy Market Competitive Strengths Figure 2-9 2-24 Solar Energy Utility Panel Shipments Market Shares, Worldwide, Dollars, 2009 Table 2-10 2-25 Solar Utility Panels Shipments Market Shares, Worldwide, Dollars, 2009 Figure 2-11 2-26 Solar Panel Utility Photovoltaic Market Forecasts, Worldwide, Dollars, 2010-2016 Figure 2-12 2-27 Utility Solar Panel Photovoltaic Market Forecasts, Worldwide, Units, 2010-2016 Table 2-13 2-28 Photovoltaic Solar Panel Utility Market Forecasts, Units and Dollars, 2010-2016 Figure 2-14 2-30 First Solar Module Roadmap to Grid Parity Figure 2-15 2-32 Photovoltaic Solar Gigawatts Installed Forecasts, Worldwide, Megawatts, 2010-2016 Figure 2-16 2-33 Photovoltaic Solar Megawatts Shipped Forecasts, Worldwide, Megawatts, 2010-2016 Figure 2-17 2-34 Dollars per Kilowatt Hour Solar Shipment When Looked At Over 25 Years Forecasts, Worldwide, Dollars, 2010-2016 Figure 2-18 2-35 Photovoltaic Percent Advantage Solar Panel Amortized Costs vs. Retail Grid Electricity Prices to Customers, Return on Investment, 25 Year Life, Market Forecasts, Percent, Worldwide, 2010-2016 Table 2-19 2-36 Solar Photovoltaic Dollars per Megawatt per 25 Year Expected Life of EquipmentShipments, Worldwide, 2009-2016 Table 2-20 2-37 Solar Photovoltaic Dollars per Megawatt per Year Over Useful Life of Equipment Shipments, Worldwide, 2009-2016 Figure 2-21 2-38 Photovoltaic Solar Grid Parity Electricity Costs Market Forecasts, Dollars, Worldwide, 2010-2016 Figure 2-22 2-39 Price Parity for Sustainable Markets Table 2-23 2-42 Commercial Solar Energy Market Driving Forces Table 2-24 2-42 Commercial Solar Energy Market Driving Forces Table 2-24 (Continued) 2-43 Commercial Solar Energy Market Driving Forces

WINTERGREEN RESEARCH, INC.
REPORT # SH24371852 700 PAGES 306 TABLES AND FIGURES 2010
$3,500 SINGLE COPY -- $7,000 WEB SITE POSTING
[email protected] 781 863 5078 781 863 1235
Table 2-24 (Continued) 2-44 Commercial Solar Energy Market Driving Forces Figure 2-25 2-45 Solar Energy Commercial Panel Shipments Market Shares, Worldwide, Dollars, 2009 Table 2-26 2-46 Solar Commercial Panels Shipments Market Shares, Worldwide, Dollars, 2009 Figure 2-27 2-47 Solar Panel Commercial Photovoltaic Market Forecasts, Worldwide, Dollars, 2010-2016 Figure 2-28 2-48 Commercial Solar Panel Photovoltaic Market Forecasts, Worldwide, Units, 2010-2016 Table 2-29 2-49 Photovoltaic Solar Panel Commercial Market Forecasts, Units and Dollars, 2010-2016 Figure 2-30 2-50 Photovoltaic Solar Lighting Market Shares, Worldwide, Dollars, 2009 Table 2-31 2-51 Solar Lighting Market Shares, Worldwide, Dollars, 2009 Figure 2-32 2-52 Solar Panel Lighting Photovoltaic Market Forecasts, Worldwide, Dollars, 2010-2016 Figure 2-33 2-53 Lighting Solar Panel Photovoltaic Market Forecasts, Worldwide, Units, 2010-2016 Table 2-34 2-54 Photovoltaic Solar Panel Lighting Market Forecasts, Units and Dollars, 2010-2016 Figure 2-35 2-56 Solar Energy Residential Panel Shipments Market Shares, Worldwide, Dollars, 2009 Table 2-36 2-57 Solar Residential Panels Shipments Market Shares, Worldwide, Dollars, 2009 Figure 2-37 2-59 Residential Solar Panel Photovoltaic Market Forecasts, Dollars, Worldwide, 2010-2016 Figure 2-38 2-60 Residential Solar Panel Photovoltaic Market Forecasts, Worldwide, Units, 2010-2016 Table 2-39 2-61 Photovoltaic Solar Panel Residential Market Forecasts, Units and Dollars, 2010-2016 Table 2-40 2-62 President Obama’s Energy Plan Calls For: Table 2-40 (Continued) 2-63 President Obama’s Energy Plan Calls For: Table 2-41 2-65

WINTERGREEN RESEARCH, INC.
REPORT # SH24371852 700 PAGES 306 TABLES AND FIGURES 2010
$3,500 SINGLE COPY -- $7,000 WEB SITE POSTING
[email protected] 781 863 5078 781 863 1235
Driving Forces for Solar to Replace Oil As The Primary Fuel Figure 2-42 2-66 Thin Film vs. Crystalline Solar Panel Segment Shipments, Worldwide, Dollars, 2009 Figure 2-43 2-67 Thin Film vs. Crystalline Solar Panel Segment Shipments, Worldwide, Dollars, 2009 Table 2-44 2-68 Photovoltaic Monocrystalline, Poly-Crystalline, and Multicrystalline vs. Thin Film CIGS and CdTe Solar Panel Market Forecasts, Units and Dollars, Worldwide, 2010-2016 Figure 2-45 2-69 Solar Panel Photovoltaic Market Forecasts, Dollars, Worldwide, 2010-2016 Table 2-46 2-70 Photovoltaic Solar Panel Total Market Forecasts, Units and Dollars, 2010-2016 Figure 2-47 2-71 Photovoltaic Solar Monocrystalline, Poly-Crystalline, and Multicrystalline Panels, Market Shares, 2009-2015 Table 2-48 2-72 Photovoltaic Solar Monocrystalline, Poly-Crystalline, and Multicrystalline Technology Panel Market Shares, Worldwide, Dollars, 2009 Figure 2-49 2-74 Photovoltaic Monocrystalline, Poly-Crystalline, and Multicrystalline Solar Panel Market Forecasts, Dollars, Worldwide, 2010-2016 Figure 2-50 2-76 Solar Thin Film Technology Market Shares, Worldwide, Dollars, 2009 Table 2-51 2-77 Solar Thin Film Technology Market Shares, Worldwide, Dollars, 2009 Figure 2-52 2-78 Thin Film CIGS and CdTe Solar Panel Market Forecasts, Worldwide, 2010-2016 Table 2-53 2-79 Photovoltaic Monocrystalline, Poly-Crystalline, and Multicrystalline vs. Thin Film CIGS and CdTe Solar Panel Market Forecasts, Units and Dollars, Worldwide, 2010-2016 Figure 2-54 2-82 MiaSole CIGS Thin Film Solar Panel Figure 2-55 2-84 First Solar Sustainable Cost Transition Through Technology and Automated Process Table 2-56 2-85 Solar Energy Conversion Efficiency Table 2-56 (Continued) 2-86 Solar Energy Conversion Efficiency Table 2-56 (Continued) 2-87

WINTERGREEN RESEARCH, INC.
REPORT # SH24371852 700 PAGES 306 TABLES AND FIGURES 2010
$3,500 SINGLE COPY -- $7,000 WEB SITE POSTING
[email protected] 781 863 5078 781 863 1235
Solar Energy Conversion Efficiency Table 2-57 2-89 Solar Energy Megawatts Shipped Figure 2-58 2-90 Photovoltaic Solar Panel Installed Capacity European Market Segments, Megawatts, 2009 Table 2-59 2-90 Photovoltaic Solar Panel Installed Capacity European Market Segments, Megawatts, 2009 Table 2-60 2-91 Solar Energy Cost per Watt Table 2-61 2-291 Solar Manufacturing Capacity Table 2-61 (Continued) 2-92 Solar Manufacturing Capacity Table 2-62 2-94 Solar Energy Capacity Company Ranking, 2009 Table 2-63 2-95 Solar Manufacturing Run Rate Table 2-64 2-96 Solar Module Conversion Efficiency Table 2-64 (Continued) 2-97 Solar Module Conversion Efficiency Figure 2-65 2-98 Solarfun Modules Efficiencies Figure 2-66 2-99 kWh Comparison at Installation Site Operated by Desert Knowledge Australia Solar Centre Figure 2-67 2-101 Capital Cost per Watt Figure 2-68 2-102 Solar Panel Sustainable Competitive Cost Advantage Targets, $ per Watt
Photovoltaic Solar Product Description
Table 3-1 3-3 Commercial Project Classifications Figure 3-2 3-5 First Solar Capacity Expansion Plan Figure 3-3 3-6 First Solar Commercial Projects Figure 3-3 (Continued) 3-7 First Solar Commercial Projects Figure 3-4 3-7 First Solar Commercial Rooftops Figure 3-5 3-8
WINTERGREEN RESEARCH, INC.
REPORT # SH24371852 700 PAGES 306 TABLES AND FIGURES 2010
$3,500 SINGLE COPY -- $7,000 WEB SITE POSTING
[email protected] 781 863 5078 781 863 1235
First Solar Modules Figure 3-6 3-9 First Solar Modules Manufacturing Figure 3-7 3-10 First Solar Installations Figure 3-8 3-13 Trina Solar $/kWh Figure 3-9 3-15 Trina Solar Australian Daily Solar Output by Month - Average. Table 3-10 3-17 Trina Solar Product Benefits Table 3-11 3-18 Trina Solar Product Features Table 3-11 (Continued) 3-19 Trina Solar Product Features Table 3-12 3-20 Trina Solar Products Table 3-12 (Continued) 3-21 Trina Solar Products Figure 3-13 3-23 Trina Solar Modules Figure 3-14 3-24 Trina Solar Commercial Installations Figure 3-14 (Continued) 3-25 Trina Solar Commercial Installations Figure 3-14 (Continued) 3-26 Trina Solar Commercial Installations Figure 3-14 (Continued) 3-27 Trina Solar Commercial Installations Figure 3-14 (Continued) 3-28 Trina Solar Commercial Installations Figure 3-14 (Continued) 3-29 Trina Solar Commercial Installations Figure 3-14 (Continued) 3-30 Trina Solar Commercial Installations Table 3-15 3-31 Examples of the Enereco Trina Solar Projects Table 3-16 3-32 Examples of Trina Solar Gestamp Asetym and Other Solar Projects Figure 3-17 3-36 Trina Solar Commercial Installations Figure 3-17 (Continued) 3-37 Trina Solar Commercial Installations Figure 3-17 (Continued) 3-38 Trina Solar Commercial Installations Table 3-18 3-40 Q-Cells CIGS Module Positioning Table 3-19 3-41 Q-Cells High Energy Yields For Cost-Efficiency Figure 3-20 3-42 Q Cells CIGS Solar Modules
WINTERGREEN RESEARCH, INC.
REPORT # SH24371852 700 PAGES 306 TABLES AND FIGURES 2010
$3,500 SINGLE COPY -- $7,000 WEB SITE POSTING
[email protected] 781 863 5078 781 863 1235
Table 3-21 3-43 Q-Cells Solar Panel Solid Quality ‘Made in Germany’ Table 3-22 3-44 Q-Cells Strengths of SL1 Modules: Table 3-23 3-46 Q-Cells CIGS Solar Panel Table 3-23 (Continued) 3-47 Q-Cells CIGS Solar Panel Figure 3-24 3-48 Q-Cells CIGS Solar Panel Table 3-25 3-49 Q-Cells Solar Panel CIGS Key Features: Figure 3-26 3-50 Sharp Solar panels Figure 3-27 3-53 Sharp Commercial Solar Installation Figure 3-28 3-55 Sharp Panel Figure 3-29 3-58 Miasole Cross Section of CIGS Material Figure 3-30 3-60 MiaSolé CIGS Solar Cell Aspect Figure 3-31 3-61 MiaSolé’s CIGS Solar Cell Table 3-32 3-70 Kyocera Solar Panels Figure 3-33 3-74 Kyocera Solar Panels Figure 3-34 3-75 Kyocera's d.Blue Module Technology Figure 3-35 3-81 Sanyo HIT Solar Cell Figure 3-36 3-82 Sanyo Solar Panels Figure 3-37 3-85 REC Solar Panels Figure 3-37 3-87 Canadian Solar Panels Figure 3-38 3-89 BP Solar Panels Table 3-39 3-92 Suntech Pluto™ Cell Technology Key Features Table 3-40 3-93 Suntech HiPerformaTM Modules Figure 3-41 3-95 Suntech Solar Panel Table 3-42 3-105 Suniva Product Offerings: Figure 3-43 3-105 Suniva ARTisun Product Offerings Benefits: Table 3-44 3-106

WINTERGREEN RESEARCH, INC.
REPORT # SH24371852 700 PAGES 306 TABLES AND FIGURES 2010
$3,500 SINGLE COPY -- $7,000 WEB SITE POSTING
[email protected] 781 863 5078 781 863 1235
Suniva® ARTisun® 2bus Cells Benefits: Table 3-45 3-107 Suniva Typical Cell Electrical Properties: Table 3-46 3-107 Suniva Typical Cell Temperature Coefficients: Table 3-47 3-108 Suniva ARTisunWafer and Cell Specifications and Geometry Figure 3-48 3-109 Suniva ARTisun Cell Current Voltage a Function of Insulation Table 3-49 3-112 Suniva® ARTisun® Series 3bus Cell Benefits: Figure 3-50 3-113 Solarion's Copper-Indium-Gallium-(Di)Selenide Photovoltaic Cells On A Plastic Substrate Figure 3-51 3-114 First Solar Utility Project Profiles Figure 3-52 3-115 First Solar Large Installations Figure 3-53 3-117 First Solar US Utility Market Figure 3-54 3-118 Trina Solar Onnuri PV Plant Naju Korea Figure 3-55 3-119 Trina Solar Utility Installations Figue 3-56 3-121 Kyocera Avanzalia Has Inaugurated Two New Spanish Solar Power Plants Figure 3-57 3-123 Kyocera Planta Solar de Don Quijote Figure 3-58 3-124 Sharp Utility Solar Installation Table 3-59 3-125 Sharp Solar Products Table 3-60 3-127 Sharp Utility-Scale Solar Modules Figure 3-61 3-128 Sharp Utility Scale Solar Installation Figure 3-62 3-129 Scatec Solar Grid Connected Installation Table 3-63 3-130 Scatec Solar Utility Project Development Phase Table 3-64 3-131 Scatec Solar Utility Ground-Based Power Plant Components Figure 3-65 3-133 Sharp Residential Solar Panels Figure 3-66 3-136 First Solar Residential Installation Figure 3-67 3-137 First Solar Residential Installation Figure 3-68 3-137 First Solar Residential Installation

WINTERGREEN RESEARCH, INC.
REPORT # SH24371852 700 PAGES 306 TABLES AND FIGURES 2010
$3,500 SINGLE COPY -- $7,000 WEB SITE POSTING
[email protected] 781 863 5078 781 863 1235
Figure 3-69 3-138 First Solar Residential Installations Figure 3-70 3-139 Norwegian Prime Minister, Mr. Jens Stoltenberg Visits the Rural Electrification Project in India Figure 3-71 3-142 Solar Energy Initiatives Home Solar System Table 3-72 3-143 Solar Energy Residential Initiatives Figure 3-73 3-147 Solar World Solar Module Figure 3-74 3-147 Solar World Residential Modules Figure 3-75 3-148 Solar Energy Solar Park Development Table 3-76 3-152 G24 Sun Light™:Functions Figure 3-77 3-154 G24 Solar Powered Light.
Photovoltaic Solar Technology
Figure 4-1 4-4 Cross Section of Typical CIGS Solar Cell Figure 4-2 4-6 Photovoltaic PV Theoretical Limits Table 4-3 4-8 Fist Solar Technology Advantages Figure 4-4 4-9 First Solar Technology Pathways to Improved Solar Conversion Efficiency Figure 4-5 4-11 PV Module Technology & Manufacturing Figure 4-6 4-12 First Solar Top Down Efficiency of CdTe Technology Figure 4-7 4-13 Bottom Up Efficiency of CdTe Figure 4-8 4-15 CdTe Capabilities vs. First Solar Requirements Figure 4-9 4-16 First Solar Comparison of CdTe to Other Technologies Figure 4-10 4-17 Tuson Arizona Electric Use of Solar Power Figure 4-11 4-18 First Solar Improvements in Module Conversion Efficiencies Table 4-12 4-19 First Solar Roadmap

WINTERGREEN RESEARCH, INC.
REPORT # SH24371852 700 PAGES 306 TABLES AND FIGURES 2010
$3,500 SINGLE COPY -- $7,000 WEB SITE POSTING
[email protected] 781 863 5078 781 863 1235
Figure 4-13 4-20 First Solar Module CdTe Efficiency Gains vs. Crystalline Silicon >3x Figure 4-14 4-21 Trina Solar Silicon Technology Figure 4-15 4-23 SunTech Pluto Technology Figure 4-16 4-30 Thin film Panels Figure 4-17 4-31 Effect of Shading on Solar Panel Efficiency Table 4-18 4-37 Polysilicon Producers Figure 4-19 4-38 Polysilicon Feedstock to Module Competitive Cost Structure
Photovoltaic Solar Company Profiles
Table 5-1 5-17 Canadian Solar Investment Highlights Figure 5-2 5-33 Energy Conversion Devices Flanders Expo – Gent Facility Table 5-3 5-34 Uni-Solar Manufacturing Facilities: Figure 5-4 5-35 ET Solar Group Figure 5-5 5-40 First Solar Headquarters Figure 5-6 5-42 First Solar Key Messages Figure 5-7 5-43 First Solar Research Figure 5-8 5-43 First Solar Design Figure 5-9 5-44 First Solar Factory Runrate Figure 5-10 5-45 First Solar Modules Manufacturing Figure 5-11 5-46 First Solar European Business Model Figure 5-12 5-47 First Solar US Business Model Figure 5-13 5-48 First Solar US Utility Business Model Figure 5-14 5-51 First Solar Utility Market Progress Table 5-15 5-52 First Solar Competitive Positioning in Thin Film Figure 5-16 5-54

WINTERGREEN RESEARCH, INC.
REPORT # SH24371852 700 PAGES 306 TABLES AND FIGURES 2010
$3,500 SINGLE COPY -- $7,000 WEB SITE POSTING
[email protected] 781 863 5078 781 863 1235
First Solar 2010 Guidance Overview Figure 5-17 5-55 First Solar Contracted Pipeline in Gigawatts Figure 5-18 5-56 First Solar Pipeline Growth Figure 5-19 5-58 First Solar Partners Figure 5-20 5-59 First Solar Sustainable Cost Advantage Through Technology Figure 5-21 5-60 First Solar Technology Cost Advantage Figure 5-22 5-61 First Solar Technology Value Figure 5-23 5-62 First Solar Sustainable Cost Advantage Technology and Industry Model Migration Figure 5-24 5-63 First Solar Sustainable Economic Advantage Through Technology Figure 5-25 5-64 G24 Module Research Table 5-26 5-65 G24 World Class Dye Sensitized Solar Cell Technology DSSC Manufacturing Operation: Table 5-27 5-66 G24I Dye Sensitized Solar Cell Technology Platform Functions Figure 5-28 5-78 Kyocera Sales By Segment Figure 5-29 5-79 Kyocera Sales by Region Figure 5-30 5-80 Kyocera Sales Trends Table 5-31 5-97 Miasolé Technology Problems Fixed: Table 5-32 5-104 Oerlikon Coating Core Competencies Figure 5-33 5-113 Q-Cells Regional Segments Figure 5-34 5-119 Schott Sales By Region Figure 5-35 5-124 Sharp Revenue Figure 5-36 5-125 Sharp Sales By Product Group Figure 5-37 5-130 Shenzhen Sunshine Electronics Figure 5-38 5-132 Shenzhen Sunshine Electronics Laminating Machine Figure 5-39 5-133 Shenzhen Sunshine Electronics Factory Line in Shenzhen Figure 5-40 5-134

WINTERGREEN RESEARCH, INC.
REPORT # SH24371852 700 PAGES 306 TABLES AND FIGURES 2010
$3,500 SINGLE COPY -- $7,000 WEB SITE POSTING
[email protected] 781 863 5078 781 863 1235
Shenzhen Sunshine Electronics Factory in Hubei: Figure 5-41 5-135 Shenzhen Sunshine Electronics Solar Airport(Taxiway) Light Passed Test By "National Center Of Supervision & Inspection On Electric Light Source Quality (Shanghai)"Nov.28,2008 Figure 5-42 5-149 Solar World Revenue Figure 5-43 5-151 SolarWorld Group Headquarters Figure 5-44 5-163 Suntech 2009 Revenue Q3 Figure 5-45 5-165 SunTech Mainland China Activities Figure 5-46 5-166 SunTech North American Activities Figure 5-47 5-183 First Solar Sales Channels
Photovoltaic Solar Regional Analysis
Figure 6-1 6-2 Photovoltaic Solar Panel Installed Capacity European Market Segments, Megawatts, 2009 Table 6-2 6-2 Photovoltaic Solar Panel Installed Capacity European Market Segments, Megawatts, 2009 Table 6-4 6-3 Solar Regional Market Segments, Dollars, 2009 Figure 6-5 6-4 Solar World Regional Revenue Figure 6-6 6-4 Solar World Regional Revenue Figure 6-7 6-5 Canadian Solar Geographical Segmentation Figure 6-8 6-6 US PV Demand Buildup by State, 2008-2012 Figure 6-9 6-7 Industry Demand Forecast By Country Figure 6-10 6-10 Regional Growth Opportunities Figure 6-11 6-13 Public Policies Driving Solar Transition Markets Figure 6-12 6-20 German Solar Panel Installation Table 6-13 6-24 Germany's Largest Photovoltaic (PV) Power Plants
WINTERGREEN RESEARCH, INC.
REPORT # SH24371852 700 PAGES 306 TABLES AND FIGURES 2010
$3,500 SINGLE COPY -- $7,000 WEB SITE POSTING
[email protected] 781 863 5078 781 863 1235
Figure 6-14 6-34 Mainland China Solar Positioning Figure 6-15 6-37 Solar Emerging Markets Figure 6-16 6-39 Solar Industry Outlook
Concentrated Solar Power (CSP)
Figure 7-1 7-1 Heliostat Sun Tracking Mirror Table 7-2 7-2 Components Of A CSP System Figure 7-3 7-3 Parabolic Trough Collectors Producing Superheated Steam Figure 7-4 7-4 Solar Parabolic Dish With a Stirling Engine Figure 7-5 7-6 Central Tower Installation Spain Figure 7-6 7-7 Solar Furnace Figure 7-7 7-9 Solar Chemical Reactor Under solar Operation Figure 7-8 7-12 Main Components Of The System At The University Clinic Of Freiburg: Adsorption Refrigeration Machine Figure 7-9 7-13 Solar Thermal System Table 7-10 7-16 Key Elements In A Solar Cell Table 7-11 7-17 Key Main Categories Of Technology In A Solar Cell
Photovoltaic Large Utility Solar Plants
Table 8-1 8-1 Large Utility Solar Plants Figure 8-2 8-2 Large-Scale Photovoltaic Power Plants Figure 8-3 8-3 Largest Solar Plants Figure 8-4 8-3 Germany, Turnow-Preilack 54MW Table 8-5 8-4
WINTERGREEN RESEARCH, INC.
REPORT # SH24371852 700 PAGES 306 TABLES AND FIGURES 2010
$3,500 SINGLE COPY -- $7,000 WEB SITE POSTING
[email protected] 781 863 5078 781 863 1235
Solar Plants Under Construction Germany, Straßkirchen Figure 8-6 8-4 Spain, Puertollano 50MW Figure 8-7 8-5 Portugal, Moura (Alentejo) 46MW Figure 8-8 8-5 Germany, Brandis 40MW Figure 8-9 8-6 Spain, Trujillo (Cáceres) 35MW Figure 8-10 8-6 Spain, Arnedo (La Rioja) 34MW Figure 8-11 8-7 Spain, Merida (Extremadura) 30 MW Figure 8-12 8-8 Spain, Casas de Los Pinos (Castila-La Mancha) 28MW Figure 8-13 8-8 Spain, Fuente Álamo (Murcia) 26MW Figure 8-14 8-9 Italy, Montalto di Castro (Lazio) 24MW Figure 8-15 8-9 Korea, Sinan 24MW Figure 8-16 8-10 Spain, Lucainena de las Torres (Almeria) 23.2 MW Figure 8-17 8-10 Spain, Abertura (Caceres) 23.1 MW Figure 8-18 8-11 Spain, Almaraz (Caceres) 22.06 Figure 8-19 8-11 Spain, El Coronil (Andalucia) 21.47 Figure 8-20 8-12 Spain, Calavéron 21.2 MW Figure 8-21 8-12 Korea, Seoul 20 MW Figure 8-22 8-13 Spain, Calasparra (Murcia) 20 MW Figure 8-23 8-13 Spain, Beneixama (Alicante) 20MW

WINTERGREEN RESEARCH, INC.
REPORT # SH24371852 700 PAGES 306 TABLES AND FIGURES 2010
$3,500 SINGLE COPY -- $7,000 WEB SITE POSTING
[email protected] 781 863 5078 781 863 1235
ABOUT THE COMPANY
WINTERGREEN RESEARCH, IS ABLE TO IDENTIFYING MARKET TRENDS THROUGH PRIMARY
RESEARCH TECHNIQUES. THE EMPHASIS IS ON DEVELOPING ACCURATE NUMBERS THAT INCLUDE
UNDERSTANDING DEVELOPMENTS, INTERVIEWING DISTRIBUTORS AND USERS, AND INTERVIEWING OPINION
LEADERS. BY READING THE ELECTRONIC EQUIVALENT OF 40 FEET OF PAPER, WINTERGREEN RESEARCH
SENIOR ANALYSTS CAN LEARN A LOT MORE ABOUT MARKETS, A LOT FASTER THAN CAN BE LEARNED
THROUGH SURVEYS AND FOCUS GROUPS THAT ARE INHERENTLY LIMITED BECAUSE THEY ARE NOT ACCURATE.
THINKING ABOUT MARKET TRENDS IS A HIGH PRIORITY AT WINTERGREEN RESEARCH. AS WITH ALL
RESEARCH, THE VALUE PROPOSITION FOR COMPETITIVE ANALYSIS COMES FROM INTELLECTUAL INPUT AND
FILTERING OF INFORMATION FOR THE PURPOSE OF ACHIEVING INTEGRATION INSUGHT.
THE ABILITY TO IDENTIFY MARKET TRENDS IS ENHANCED BY DOING IT OVER AND OVER FOR MANY
DIFFERENT MARKETS. THAT IS WHAT WINTERGREEN RESEARCH IS ALL ABOUT: READING AND THINKING IS
AN ESSENTIAL ASPECT OF COMPETITIVE ANALYSIS. IDENTIFYING AND TALKING TO OPINION LEADERS IS THE
ESSENTIAL ASPECT OF PRODUCING GOOD, RELIABLE DATA.
WINTERGREEN RESEARCH, FOUNDED IN 1985, PROVIDES STRATEGIC MARKET ASSESSMENTS
IN TELECOMMUNICATIONS, COMMUNICATIONS EQUIPMENT, HEALTH CARE, INTERNET AND ADVANCED
COMPUTER TECHNOLOGY. INDUSTRY REPORTS FOCUS ON OPPORTUNITIES THAT EXPAND EXISTING MARKETS
OR DEVELOP MAJOR NEW MARKETS. THE REPORTS ASSESS NEW PRODUCT AND SERVICE POSITIONING
STRATEGIES, NEW AND EVOLVING TECHNOLOGIES, AND TECHNOLOGICAL IMPACT ON PRODUCTS, SERVICES,
AND MARKETS. MARKET SHARES ARE PROVIDED. LEADING MARKET PARTICIPANTS ARE PROFILED, AND
THEIR MARKETING STRATEGIES, ACQUISITIONS, AND STRATEGIC ALLIANCES ARE DISCUSSED. THE PRINCIPALS
OF WINTERGREEN RESEARCH HAVE BEEN INVOLVED IN ANALYSIS AND FORECASTING OF INTERNATIONAL
BUSINESS OPPORTUNITIES IN TELECOMMUNICATIONS AND ADVANCED COMPUTER TECHNOLOGY MARKETS
FOR OVER 30 YEARS.

WINTERGREEN RESEARCH, INC.
REPORT # SH24371852 700 PAGES 306 TABLES AND FIGURES 2010
$3,500 SINGLE COPY -- $7,000 WEB SITE POSTING
[email protected] 781 863 5078 781 863 1235
ABOUT THE PRINCIPAL AUTHORS
ELLEN T. CURTISS, TECHNICAL DIRECTOR, CO-FOUNDER OF WINTERGREEN RESEARCH, CONDUCTS
STRATEGIC AND MARKET ASSESSMENTS IN TECHNOLOGY-BASED INDUSTRIES. PREVIOUSLY SHE WAS A
MEMBER OF THE STAFF OF ARTHUR D. LITTLE, INC., FOR 23 YEARS, MOST RECENTLY AS VICE PRESIDENT OF
ARTHUR D. LITTLE DECISION RESOURCES, SPECIALIZING IN STRATEGIC PLANNING AND MARKET
DEVELOPMENT SERVICES. SHE IS A GRADUATE OF BOSTON UNIVERSITY AND THE PROGRAM FOR
MANAGEMENT DEVELOPMENT AT HARVARD GRADUATE SCHOOL OF BUSINESS ADMINISTRATION. SHE IS
THE AUTHOR OF RECENT STUDIES ON WORLDWIDE TELECOMMUNICATIONS MARKETS, THE TOP TEN INTERNET
EQUIPMENT COMPANIES, THE TOP TEN CONTRACT MANUFACTURING COMPANIES, AND THE TOP TEN
TELECOMMUNICATIONS MARKET ANALYSIS AND FORECASTS.
SUSAN EUSTIS, PRESIDENT, CO-FOUNDER OF WINTERGREEN RESEARCH, HAS DONE RESEARCH IN
COMMUNICATIONS AND COMPUTER MARKETS AND APPLICATIONS. SHE HOLDS SEVERAL PATENTS IN
MICROCOMPUTING AND PARALLEL PROCESSING. SHE HAS THE ORIGINAL PATENTS IN ELECTRONIC VOTING
MACHINES. SHE HAS NEW PATENT APPLICATIONS IN FORMAT VARYING, MULITPROCESSING, AND ELECTRONIC
VOTING. SHE IS THE AUTHOR OF RECENT STUDIES OF SOA MARKETING STRATEGIES, INTERNET EQUIPMENT,
CLOUD COMPUTING, BIOMETRICS, A STUDY OF INTERNET EQUIPMENT, WORLDWIDE TELECOMMUNICATIONS
EQUIPMENT, TOP TEN TELECOMMUNICATIONS, DIGITAL LOOP CARRIER, WEB HOSTING, WEB SERVICES,
ENERGY MARKETS, ELECTRIC VEHICLES, THIN FILM BATTERIES, BUSINESS PROCESS MANAGEMENT, AND
APPLICATION INTEGRATION MARKETS. MS. EUSTIS IS A GRADUATE OF BARNARD COLLEGE.

WINTERGREEN RESEARCH, INC.
REPORT # SH24371852 700 PAGES 306 TABLES AND FIGURES 2010
$3,500 SINGLE COPY -- $7,000 WEB SITE POSTING
[email protected] 781 863 5078 781 863 1235
ORDER FORM Return To: WinterGreen Research, Inc.
6 Raymond Street Lexington, MA 02421 USA Phone: (781) 863-5078 --- Fax: (781) 863-1235
PLEASE ENTER MY ORDER FOR:
Photovoltaic Solar Panel Strategies,
Technologies And Opportunities: Market Shares
and Forecasts, Worldwide, 2010-2016
-ALL REPORTS ARE AVAILABLE IN EITHER PRINT OR PDF- _________PDF ________PRINT
____ENCLOSED IS MY CHECK FOR $3,500 FOR SINGLE COPY, $7,000 FOR WEB SITE POSTING ____PLEASE BILL MY COMPANY USING P.O. NUMBER_________________________________________ ____PLEASE CHARGE MY MASTERCARD/VISA/AMERICAN EXPRESS— CARD NUMBER _________________________________EXP. DATE__________________ If charging to a credit card use the order form on the Internet, fax, or call. NAME________________________________________TITLE________________________________________ SIGNATURE________________________________________________________________________________ COMPANY________________________________________DIVISION________________________________________ ADDRESS________________________________________ CITY__________________________________________STATE / ZIP__________________________________________ TELEPHONE________________________________________ FAX________________________________________ EMAIL________________________________________ PLEASE NOTE: RESIDENTS OF MASSACHUSETTS AND CONNECTICUT MUST INCLUDE APPROPRIATE SALES
TAX SUBSCRIBERS OUTSIDE THE UNITED STATES MUST PROVIDE PREPAYMENT IN U.S. FUNDS