Solar + Storage Systems Business Models for Large Deployment
18
Idam Infrastructure Advisory Pvt. Ltd. Balawant Joshi, Managing Director Expert Talk on Solar, Storage & Hybrid Development Solar + Storage Systems – Business Models for Large Deployment 17 September 2020
Transcript of Solar + Storage Systems Business Models for Large Deployment

Idam Infrastructure Advisory Pvt. Ltd.
Balawant Joshi, Managing Director
Expert Talk on Solar, Storage & Hybrid Development
Solar + Storage Systems – Business Models for Large Deployment
17 September 2020

Idam Infra – Service Offerings
Idam Infrastructure Advisory Pvt. Ltd. 2

India’s ambitious solar target
3
100
60
4035.12 32.31
2.82
0
20
40
60
80
100
120
Total Solar Power Ground Mounted Solar Solar Rooftop
Cap
acit
y in
GW
Target vs Achievement of Solar Installation
Target Achieved

India can’t achieve solar target without significant storage capacity
4
Report Name PublisherReport date/ Target Year
Battery Storage need projection
Consideration
Developing a roadmap to a flexible, low‐carbon Indian electricity system: interim
findings
CPI ( with TERI and NREL)
Feb-19/ 2030
60 GWConsidering flexibility provided by Thermal, Hydro
(including PSH ) and Batteries) and demand projection as done by TERI
25 GWConsidering flexibility provided by Thermal, Hydro
(including PSH) ,Batteries and Demand Side Management) and demand projection as done by TERI
Energy Storage System:Roadmap for India : 2019-32
ISGF (with Mac Arthur
foundation and IESA)
2019 / 2032
67 GWh At MV/LV level
142 GWh At EHV level
Least-Cost Pathways for India’s Electric Power Sector
NREL May-20/2047 237 GWConsidering capacity and demand growth are based on CEA
National Electricity Plan and 19th Electric Power Survey (CEA 2018b)
Report On Optimal Generation Capacity Mix For 2029-30
CEA Jan-20/ 2030 27 GW / 108 GWhConsidering mid term review of NEP-I for installed capacity taking 2021-22 as base year and EPS for Peak load and energy projection.

5
Reverse Auctions
• ~ 30 GW of Solar Capacity has been allotted through Competitive Bidding Process.• Gradual increase in Solar Capacity over the years shows its acceptance while discovering the lowest Tariff of Rs. 2.44/kwh
15035025 25 6012515075226270130130100
500500500100100250215300500
1500
500170
500150
420100
500100
12001200
500350400100
920440225130160300450
750250500250
1500
50025050500250
7605505007501000
20025085125500
2000
75060075
2000
500150
5005501000
500
1200750500
100250
1200680
72480300
960
150500
12000
500
1200
350
2000
350
2000
1170700
12.20
8.80 8.40
8.70 8.30 8.10
6.50 6.50
8.40 8.90
6.90 6.90 6.70 7.20 7.20
6.20
8.00
5.70 5.70
4.60 5.00
4.40 4.80
4.40
5.10 5.40
4.79 4.43 4.43 4.35 4.43
3.30
2.44 2.62
3.47
2.66 3.14 3.15
2.47 2.48
3.17 2.92 2.72 2.71 2.82
3.34 2.85 2.70 2.59 2.44
3.20 2.74
2.48 2.65 2.87 2.54
3.02 2.53 2.63 2.83 2.92
3.17
2.50 2.61 2.90
2.36 2.78
0
2000
4000
6000
8000
10000
12000
14000
-
2.00
4.00
6.00
8.00
10.00
12.00
14.00
NSM
Bat
ch 1
NSM
Bat
ch 2
Ori
ssa
Phas
e 1
Ori
ssa
Phas
e 2
Kar
nat
aka
Mad
hya
Pra
des
h
Tam
il N
adu
Raj
asth
an
An
dh
ra P
rad
esh
Pun
jab
Ph
ase
1
Utt
ar P
rad
esh
Ph
ase
1
Kar
nat
aka
Ph
ase
2
Mad
hya
Pra
des
h
An
dh
ra P
rad
esh
Ph
ase
2
Kar
nat
aka
Tela
ngan
a
Pun
jab
( C
apac
ity
5-2
4)
Pu
nja
b (
Cap
acit
y 25
-100
)
NTP
C A
nan
tap
ur
Utt
ar P
rad
esh
Ph
ase
2
Mad
hya
Pra
des
h
Tela
ngan
a G
rou
p 1
Tela
ngan
a G
rou
p 2
Pun
jab
Utt
arak
han
d
AP
-50
0 M
W B
un
dlin
g
Har
yan
a (S
tate
Sch
eme)
Raj
asth
an 4
20
MW
UP
-100
MW
Bu
ndlin
g
SEC
I MH
50
0 M
W
NTP
C R
aj 1
00
MW
Kar
nat
aka
Jhar
khan
d
NTP
C K
arna
taka
NTP
C T
elan
gan
a
SEC
I AP
SEC
I Ch
atti
sgar
h
SEC
I Kar
nat
aka
SEC
I UP
SEC
I Gu
j
NTP
C R
ajas
than
SEC
I UP
SEC
I Ori
ssa
SEC
I Mah
arah
tra
REW
A 7
50 M
W
NTP
C K
adap
a
Bh
adh
la 5
00 M
W
Bh
adh
la 2
50 M
W
Tam
il N
adu
Gu
jara
t
NTP
C A
ny 2
50M
W D
CR
MH
Mah
age
nco
SEC
I RJ
Bh
adla
Ph
-III
SEC
I RJ
Bh
adla
Ph
-IV
Kar
nat
aka
KR
EDL
JNN
SM-
Kar
nat
aka
Gu
jara
t-G
UV
NL
AP
An
anth
apur
am-J
NN
SM
MH
-MSE
DC
L R
PO
KA
- P
avag
ada-
JNN
SM
MH
-mah
age
nco
Ass
am
UP
So
lar
Par
k
Pav
agad
a (T
ranc
he
VI)
SEC
I - IS
TS -
I
SEC
I - K
adap
a
SEC
I - IS
TS -
II
GR
IDC
O O
dis
ha
NTP
C -
JN
NSM
GJ
- G
UV
NL
- R
PO
- II
-R
Pav
agad
a (P
has
e V
I)
UP
NED
A -
02
UP
NED
A -
03
MSE
DC
L -
Pha
se II
GJ
- G
UV
NL
- Ph
ase
IV
SEC
I - IS
TS -
III
SEC
I - R
J
GJ
- G
UV
NL
- R
agh
anes
da
Par
k -
Ph
III
GJ
- G
UV
NL
- D
ho
lera
Par
k -
Ph
ase
V
SEC
I - D
on
dai
cha
Par
k -
MH
SEC
I - IS
TS -
IV
SEC
I - II
- R
J
UP
NED
A
SEC
I - IS
TS -
VI
NTP
C -
ISTS
SEC
I - IS
TS -
VI
Tata
Po
wer
- R
PO
MSE
DC
L -
Ph
ase
IV
SEC
I - M
anu
fact
uri
ng
Lin
ked
So
lar
UP
NED
A
SEC
I - IS
TS -
VIII
GJ
- G
UV
NL
- P
has
e V
III
NH
PC
MSE
DC
L -
Pha
se V
SEC
I - IS
TS -
IX
NTP
C -
ISTS
GJ
- G
UV
NL
- D
ho
lera
Par
k -
Ph
ase
IX
MW
₹/kWh
Tariff trends for Large Scale (50 MW and above) solar projects

Economics of battery storage–Trend
Idam Infrastructure Advisory Pvt. Ltd. 6
1160
899
707650
577
373288
214176 156
0
200
400
600
800
1000
1200
1400
2010 2011 2012 2013 2014 2015 2016 2017 2018 2019
US
D/
kW
h
Volume weighted average battery price
Source: LBNL
Recent report published by Lawrence-Berkeley National Laboratory shows that the LCOE for standalone BESS could reach Rs. 4.12/kWh by 2030.
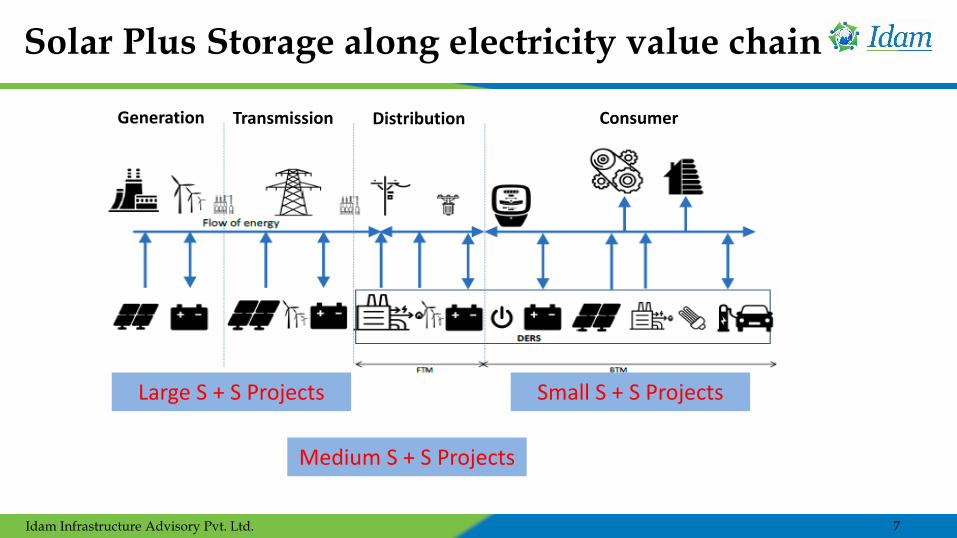
Solar Plus Storage along electricity value chain
7
Generation Transmission Distribution Consumer
Idam Infrastructure Advisory Pvt. Ltd.
Large S + S Projects
Medium S + S Projects
Small S + S Projects

Solar + Storage Project
Idam Infrastructure Advisory Pvt. Ltd. 8
• Energy Storage System co-located with RE
generator can provide firm power to the grid,
thus maintaining grid stability
• This can reduce the fluctuation in the grid and
help in better management of the frequency
• Energy Storage System co-located with RE
generator can also be used to provide power
during peak periods
• Utility can get the benefit of firm power from
renewables or/and cheaper peak power during
peak periods
Renewable Energy Plant with co-located
Energy Storage System
GridSolar Generator
ESS
BESS is co-located with Solar Plant and ESS is
charged through it
Power is supplied to
grid to manage
frequency or/and during peak periods

SECI ISTS VII tender
Idam Infrastructure Advisory Pvt. Ltd. 9
Particulars Description
Capacity OfferedMin: 50 MW; Max. 300 MW
Max. allowable to single entity 600 MWBusiness Model &
PPA tenureBOO & 25 years
Counter Party SECI
Project Location
Generation may be co-located/ different
locations. ESS has to be co-located with
RE
ESS Capacity1200 MWh (equal to MW rating of Solar+Wind)
Injection PointSingle or Multiple(s) by separate injection
at Pooling point & having separate control
CUF At-least 40% (annual)
Peak Power Supply Daily: Min. 6 hours, Max. 8 hours
Tariff
Two part tariff
Off – peak: ₹2.7/kWh
Peak: ₹6.12/kWh and ₹6.85/kWh
Energy Arbitrage
At discretion of HPD between 0:01 and
5:59 hours
ISTS/STU charges such as wheeling etc. in
scoope of HPD
Particulars Description
Power Generation
Requirement
(for project rated
capacity of 100
MW)
• Daily Minimum: 300 MWh
• Capable of delivering 50MW in any peak hour (limited
to 6 hour blocks) scheduled by DISCOM through day
ahead scheduling
• Excess generation above 300 MWh during peak hours
shall be compensated at off-peak rate
Peak Power
Generation
• Permissible shortfall up-to 15% below minimum
energy commitment, accounted monthly, beyond
which penalty is applied
• Penalty equal to the Peak tariff or tariff paid by
DISCOM to meet the shortfall in supply, whichever is
higher
Excess Generation
• Any excess generation over and above 10% of declared
annual CUF will be purchased by SECI at its discretion
{without any obligation to do so} at a fixed tariff of 75%
of the Off-Peak tariff
• In case of energy supply during Peak Hours over and
above the mandated energy requirement (300 MWh),
and in the event of such power being procured by the
Buying Utility, the HPD will be paid energy charges @
Off-Peak Tariff

SECI ISTS RTC Tender
Idam Infrastructure Advisory Pvt. Ltd. 10
Particulars Description
Capacity Offered Min: 50 MW; Max. 400 MW
Business Model &
PPA tenureBOO & 25 years
Counter Party/
Buying Utility
SECI
NDMC (200 MW) & DNH (200 MW)
Project Location
Generation may be co-located/ different
locations. ESS has to be co-located with
at-least one of the generation sources
ESS CapacityRPD allowed to resize ESS until 3 years
after COD (flexible to choose type)
Injection Point
Single or Multiple(s) by separate
injection at Pooling point & having
separate control
CUFatleast 80% (annual) & 70% (monthly)
Committed Annual energy: 100%Technology &
Interconnection
Point
Technology Agnostic
Interconnection at 220 kV or above
Developer Scope Land, Connectivity & LTA
Tariff
1st year tariff with 3% escalation Y-o-Y
till 15th year & subsequently fixed
thereafter
Particulars Description
Penalty Structure Penalty for Monthly & Annual Shortfall
Annual Shortfall
Criteria>77.5% to <80% CUF <77.5% CUF
Penalty (Annual)2* PPA Tariff (Energy
Terms)
2*PPA Tariff + Tariff
Escalation removed in the
succeeding year (upto
15/16th year)Monthly Shortfall
Criteria> 67.5% and < 70% CUF <67.5% CUF for > 2 months
Penalty (Monthly)
Calculated
Annually
PPA Tariff /month * no of
months with shortfall
PPA Tariff + Tariff
Escalation removed in the
succeeding year (upto
15/16th year)
Excess GenerationExcess Power allowed to be sold in Open Market –
Priority to PPA requirement
Grid
Unavailability
(Compensation to
RE developer)
• > 4hrs: Gen Loss = [(Avg gen/hr during the billing month) × (no of hrs of grid unavailability in particular billing month)]
Backdown:• Gen Compensation = 100% x [Scheduled energy × (no
of backdown hours during the month)] x PPA tariff
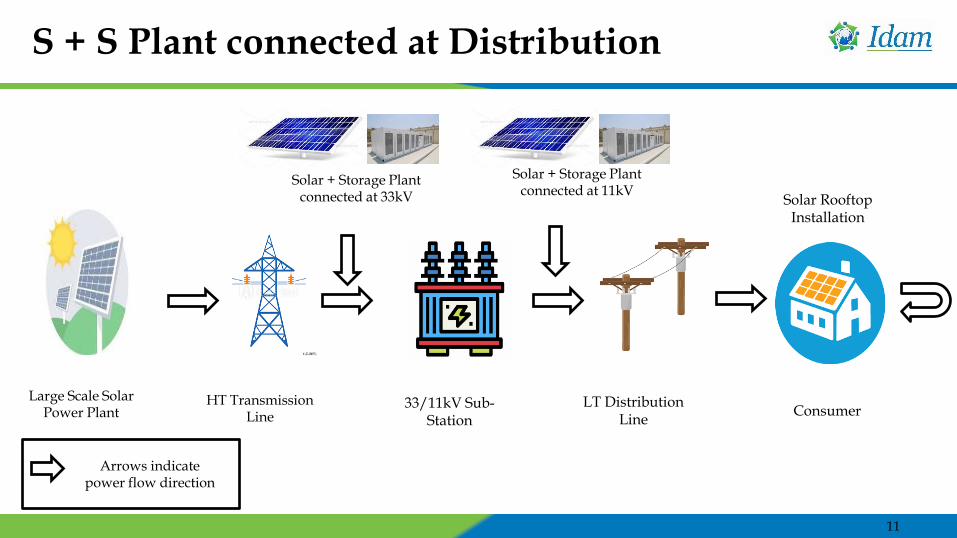
S + S Plant connected at Distribution
11
Large Scale Solar Power Plant
HT Transmission Line
33/11kV Sub-Station
LT Distribution Line
Consumer
Solar + Storage Plant connected at 33kV
Solar + Storage Plant connected at 11kV
Solar Rooftop Installation
Arrows indicate power flow direction

Cost of Generation – Decentralised Solar Plant
• Telangana
– Telangana has opted for a distributed solar power generation program. Tenders were issued for solar power plants of capacities in the range of 50 MW to 200 MW to be set up in a distributed manner.
– Out of 3,630 MW of solar installation about 1,543 MW of the total solar power capacity in Telangana is on account of distributed solar projects.
• Maharashtra
– Decentralised solar plants of 300kW to 10MW capacity on vacant, un-used land near DISCOM substation.
– Power from these plants is being fed to agriculture feeders, which is greatly benefitting both farmers and DISCOMs :
➢ Quality and reliable day time electricity to farmers;
➢ Savings on the Transmission network cost, reduced T&D losses for DISCOM
– Under 'Mukyamantri Sour Krushi Vahini Yojana’ in Maharashtra, EESL has signed 25 years PPA with MSEDCL for 500 MW decentralised solar power.
– MERC vide order dated May 21, 2020 has approved MSEDCL’s proposal of procurement of 100 MW solar power at tariff of INR 3.11 per unit for 25 years from EESL.
• Integration of storage would provide several benefits to distribution companies.
12
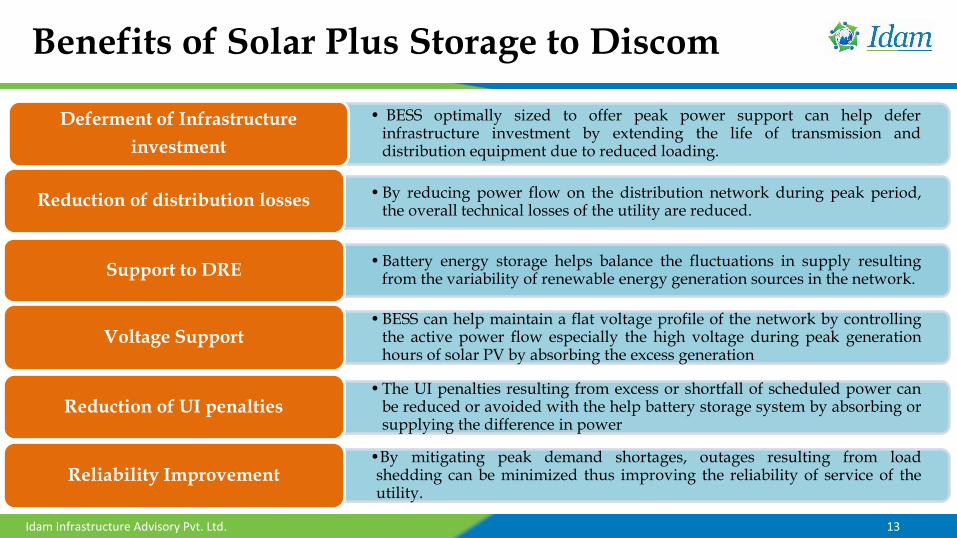
Benefits of Solar Plus Storage to Discom
• BESS optimally sized to offer peak power support can help deferinfrastructure investment by extending the life of transmission anddistribution equipment due to reduced loading.
Deferment of Infrastructure
investment
• By reducing power flow on the distribution network during peak period,the overall technical losses of the utility are reduced.
Reduction of distribution losses
• Battery energy storage helps balance the fluctuations in supply resultingfrom the variability of renewable energy generation sources in the network.
Support to DRE
• BESS can help maintain a flat voltage profile of the network by controllingthe active power flow especially the high voltage during peak generationhours of solar PV by absorbing the excess generation
Voltage Support
• The UI penalties resulting from excess or shortfall of scheduled power canbe reduced or avoided with the help battery storage system by absorbing orsupplying the difference in power
Reduction of UI penalties
•By mitigating peak demand shortages, outages resulting from loadshedding can be minimized thus improving the reliability of service of theutility.
Reliability Improvement
Idam Infrastructure Advisory Pvt. Ltd. 13
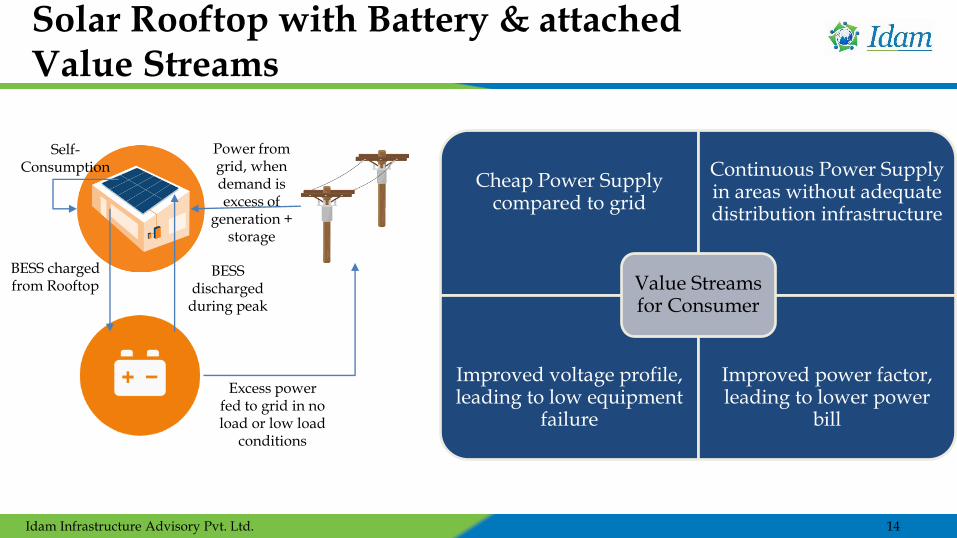
Solar Rooftop with Battery & attached Value Streams
Idam Infrastructure Advisory Pvt. Ltd. 14
Self-Consumption
BESS charged from Rooftop
Power from grid, when demand is excess of
generation + storage
BESS discharged
during peak
Excess power fed to grid in no load or low load
conditions
Cheap Power Supply compared to grid
Continuous Power Supply in areas without adequate distribution infrastructure
Improved voltage profile, leading to low equipment
failure
Improved power factor, leading to lower power
bill
Value Streams for Consumer

Commercial and Industrial Tariff range
Idam Infrastructure Advisory Pvt. Ltd. 15
0
1
2
3
4
5
6
7
8
9
10
11
12
AP DL GJ HR KA MH MP PB RS TN TS UP
Ta
riff
(₹
/k
Wh
)
0
1
2
3
4
5
6
7
8
9
AP DL GJ HR KA MH MP PB RS TN TS UP
Ta
riff
(₹
/k
Wh
)
Commercial tariff range in different states
HT Industrial tariff range in different states

BESS at consumer level needs Load Curve Analysis
Idam Infrastructure Advisory Pvt. Ltd. 16
-10.00
0.00
10.00
20.00
30.00
40.00
50.00
60.00
70.00
80.00
90.00
01
:00
02
:00
03
:00
04
:00
05
:00
06
:00
07
:00
08
:00
09
:00
10
:00
11
:00
12
:00
13
:00
14
:00
15
:00
16
:00
17
:00
18
:00
19
:00
20
:00
21
:00
22
:00
23
:00
24
:00
Week Day Consumption Load (kW) Weekend Consumption Load (kW) 80 kW SPV System
100 kW SPV System 150 kW SPV System
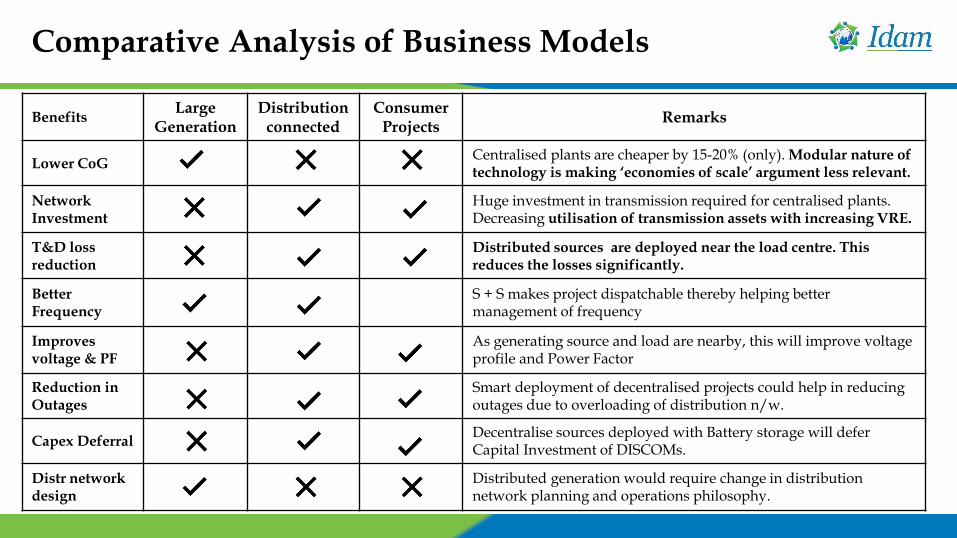
Comparative Analysis of Business Models
BenefitsLarge
GenerationDistribution
connectedConsumer
ProjectsRemarks
Lower CoGCentralised plants are cheaper by 15-20% (only). Modular nature of technology is making ‘economies of scale’ argument less relevant.
Network Investment
Huge investment in transmission required for centralised plants. Decreasing utilisation of transmission assets with increasing VRE.
T&D loss reduction
Distributed sources are deployed near the load centre. This reduces the losses significantly.
Better Frequency
S + S makes project dispatchable thereby helping better management of frequency
Improves voltage & PF
As generating source and load are nearby, this will improve voltage profile and Power Factor
Reduction in Outages
Smart deployment of decentralised projects could help in reducing outages due to overloading of distribution n/w.
Capex Deferral Decentralise sources deployed with Battery storage will defer Capital Investment of DISCOMs.
Distr network design
Distributed generation would require change in distribution network planning and operations philosophy.

Thank You
Contact:
Balawant Joshi +91 98214 21630
Ajit Pandit +91 98211 08222
Email: [email protected]
Mumbai Delhi Kolkata Hyderabad
801, Crystal Plaza,158, CST Road,Kalina, Santacruz (E),Mumbai — 400 098Phone: +91 22 4057 0200
A-31, Second Floor,Lajpat Nagar II, Near Lajpat Metro Station,New Delhi — 110 024Phone: +91 11 4943 4000
Globsyn Crystal, XI – 11 & 12,1st Floor, Block – EP, Sector V,Salt Lake Electronics Complex,Kolkata — 700 091Phone: +91 33 4604 8993
House No. 3-51, Flat No. 201,Abhishek Towers,Balanagar,Hyderabad — 500 042Phone: +91 91369 20664


![Cluster Deployment and Management - Oracle Deployment and ... scripts for cluster deployment ... Next start the storage agent on newly added storage node: [oracle@bigdatalite scripts]](https://static.fdocuments.in/doc/165x107/5aa9ef327f8b9a8b188d7a99/cluster-deployment-and-management-deployment-and-scripts-for-cluster-deployment.jpg)