Solar Radiation Sun-Earth relationships Array Orientation Solar Radiation Data Sheets.

SolarPACES Project
SOLAR RADIATION PRODUCTS
FOR THE END-USERS
FINAL REPORT
April 2021
Edited by M. Silva and L. Ramírez
Authors:
M. Silva, L. Ramírez, F. Vignola, M. Sengupta, K. Nielsen, M. Schroedter, M. Blanco, R. Meyer, M.
Larrañeta, C. Fernandez-Peruchena, S. Moreno.

Solar radiation products for end users
Page 1 of 56
CONTENT
0 INTRODUCTION ....................................................................................................................................... 3
DEFINITIONS .................................................................................................................................................................. 4 PRODUCT CATEGORIES................................................................................................................................................... 5
1 MAPS AND SOLAR RADIATION POTENTIAL ASSESSMENTS ....................................................................... 6
PRODUCTS AND SERVICES IN THE CATEGORY .................................................................................................................. 6 RELEVANT FEATURES ..................................................................................................................................................... 7 PROJECT STAGES AND END USERS ................................................................................................................................... 8
2 CONSULTANCY SERVICES ON SOLAR RADIATION MEASUREMENTS ....................................................... 10
PRODUCTS AND SERVICES IN THE CATEGORY ................................................................................................................ 11 RELEVANT FEATURES ................................................................................................................................................... 13 PROJECT STAGES AND END USERS ................................................................................................................................. 14
3 MODELED SOLAR RADIATION AND METEOROLOGICAL PARAMETERS ................................................... 18
PRODUCTS AND SERVICES IN THE CATEGORY ................................................................................................................ 18 RELEVANT FEATURES ................................................................................................................................................... 19 PROJECT STAGES AND END USERS ................................................................................................................................. 19
4 LONG TERM REPRESENTATIVE TIME SERIES IN A SPECIFIC LOCATION .................................................... 24
PRODUCTS AND SERVICES IN THE CATEGORY ................................................................................................................ 24 RELEVANT FEATURES ................................................................................................................................................... 25 PROJECT STAGES AND END USERS ................................................................................................................................. 26
5 SOLAR RADIATION VARIABILITY ............................................................................................................. 29
PRODUCTS AND SERVICES IN THE CATEGORY ................................................................................................................ 29 RELEVANT FEATURES ................................................................................................................................................... 30 PROJECT STAGES AND END USERS ................................................................................................................................. 30
6 LOW LEVEL ATTENUATION AND SUNSHAPE ........................................................................................... 34
PRODUCTS AND SERVICES IN THE CATEGORY ................................................................................................................ 35 RELEVANT FEATURES ................................................................................................................................................... 35 PROJECT STAGES AND END USERS ................................................................................................................................. 35
7 SOLAR RADIATION FORECASTING AND NOWCASTING ........................................................................... 39
PRODUCTS AND SERVICES IN THE CATEGORY .............................................................................................................................. 39 RELEVANT FEATURES ................................................................................................................................................... 39 PROJECT STAGES AND END USERS ................................................................................................................................. 40
8 CHARACTERIZATION AND CALIBRATION OF SOLAR RADIATION SENSORS.............................................. 44
PRODUCTS AND SERVICES IN THE CATEGORY ................................................................................................................ 44 RELEVANT FEATURES ................................................................................................................................................... 46 PROJECT STAGES AND END USERS ................................................................................................................................. 47
9 FUTURE WORKS ..................................................................................................................................... 50
REFERENCES ................................................................................................................................................... 51

Solar radiation products for end users
Page 2 of 56
RELATION OF SOLAR RADIATION PRODUCTS INCLUDED
1. SOLAR RADIATION MAPS. ........................................................................................................................ 6
2. POTENTIAL ASSESSMENT OF SOLAR ENERGY. .......................................................................................... 6
3. MEASURING DNI USING PYRHELIOMETER. ............................................................................................ 11
4. MEASURING DNI USING RSI ................................................................................................................... 11
5. MEASURING DNI USING ALTERNATE INSTRUMENTS .............................................................................. 12
6. MODELED SOLAR RADIATION SERIES ..................................................................................................... 18
7. TYPICAL METEOROLOGICAL YEAR .......................................................................................................... 24
8. METEOROLOGIAL YEAR OF A PO 90 ....................................................................................................... 25
9. DNI VARIABILITY MAPS .......................................................................................................................... 29
10. TIME SERIES VARIABILITY ....................................................................................................................... 29
11. LOW LEVEL ATTENUATION MEASUREMENTS AND CHARACTERIZATION. ............................................... 35
12. SUNSHAPE MEASUREMENT AND CHARACTERIZATION .......................................................................... 35
13. SOLAR RADIATION FORECASTS IN DIFFERENT TIME HORIZONS ............................................................. 39
14. CALIBRATION OF PYRHELIOMETER ........................................................................................................ 44
15. CALIBRATION OF FIELD PYRANOMETERS ............................................................................................... 45
16. CALIBRATION OF RSBR ........................................................................................................................... 45

Solar radiation products for end users
Page 3 of 56
0 INTRODUCTION
The rise in the solar energy around the world necessitates ever improved solar radiation data. The
different types of solar radiation data that are needed for the development of solar energy projects
are called “solar radiation products” in this report. Most of these products are commonly named using
similar words, but their quality and content may differ significantly from product to product. This is the
case for “solar resource assessment” products. These can either describe the solar radiation behavior
at a specific location, form the generation of an annual series for simulation, or consist of satellite-
derived solar radiation datasets.
Some products may also have a wide range of accuracy, from very precise high-quality minute
measurements to hourly estimations or predictions with low spatial resolution. All these products can
be useful and provide relevant information, but the right choice of a solar radiation product depends
on the specific requirements of the application of interest.
The objective of this project is to organize the solar radiation products according to different uses,
mainly related to the end-users and/or the stage of the project development. Each product has an
appropriate target group of customers and it is important to properly match each other. Furthermore,
in this project a set of minimal requirements is also proposed for each case study.
Figure 1 show the general purpose of this project, what is helping the end users in the selection of the
solar radiation product better for their needs (Sengupta et al., 2017).
Figure 1. General purpose of the project: help the end users in the selection of
solar radiation products. (Figure by L. Ramírez)
The outcomes of the project will be published on a dedicated web page. Examples and comparisons of
products can be added in the future if there is interest from the end user community and solar
radiation product providers.
The report is organized in the eight categories that has been established for the solar radiation
products. For each category, one or two products are presented as well as the main characteristics of
those products. Next, the specific needs of those products are presented by each project stages and
end users, including the minimum or recommended values for the relevant specification items.

Solar radiation products for end users
Page 4 of 56
Thus, the project is focused on providing practical information oriented primarily to users. At the end
of the report, references are included for those requiring deeper knowledge in the field.
DEFINITIONS
A. Product
A product is, according to the Meriam-Webster dictionary definition (second sense):
(1) : something produced.
(2) : something (such as a service) that is marketed or sold as a commodity.
In this report, the word product will be used without distinction in any of these two senses.
B. End-user
End user is the ultimate consumer of a finished product (Merriam-Webster dictionary). Thus, if a
certain user makes use of a solar radiation product to elaborate another solar radiation product the
user is not considered an end user for that specific product for the purposes of this report. For example,
a company that uses long-term solar radiation series to elaborate forecasts for a plant operator is not
the end user of the solar radiation series.
The end users of solar radiation products have been organized depending on the project stages:
(A) Pre-feasibility
(B) Feasibility and design
(C) Due Diligence Financing
(D) Plant Acceptance Tests
(E) Systems or Plant Operations
Figure 2. Main stages of a solar radiation power plant, needs and uses.
(Figure by L. Ramírez)
In addition, three general end users are considered:

Solar radiation products for end users
Page 5 of 56
(F) Grid operators
(G) Policy makers
(H) Education / Outreach
All of them (project categories and end users), require solar radiation information. Through this report,
options for meeting those needs are proposed while establishing a minimal requirement for each type
of end user.
PRODUCT CATEGORIES
In this project, the solar radiation products have been organized in nine different categories.
1. Maps and solar radiation potential assessments
2. Consultancy services on solar radiation measurements
3. Modeled solar radiation and meteorological parameters
4. Long term representative time series in a specific location
5. Solar radiation variability
6. Low level attenuation and sunshape
7. Solar radiation forecasting and nowcasting
8. Characterization and calibration of solar radiation sensors
Table 1. Look up table of categories and uses.
Grey cells in Maps and solar radiation potential assessments
9. Consultancy services on solar radiation measurements
10. Modeled solar radiation and meteorological parameters
11. Long term representative time series in a specific location
12. Solar radiation variability
13. Low level attenuation and sunshape
14. Solar radiation forecasting and nowcasting
15. Characterization and calibration of solar radiation sensors
(A) (B) (C) (D) (E) (F) (G) (H)
Pre-feasibility Feasibility and designDue Diligence
Financing
Plant Acceptance
Tests
Systems or
Plant OperationsGrid operators Policy makers Education / Outreach
1MAPS AND SOLAR RADIATION
POTENTIAL ASSESSMENTSN.A.
2
CONSULTANCY SERVICES ON
SOLAR RADIATION
MEASUREMENTS
N.A. N.A.
3
MODELED SOLAR RADIATION
AND METEOROLOGICAL
PARAMETERS
N.A.
4
LONG TERM REPRESENTATIVE
TIME SERIES IN A SPECIFIC
LOCATION
N.A. N.A. N.A.
5 SOLAR RADIATION VARIABILITY N.A. N.A.
6LOW LEVEL ATTENUATION AND
SUNSHAPEN.A.
7SOLAR RADIATION FORECASTING
AND NOWCASTINGN.A.
8
CHARACTERIZATION AND
CALIBRATION OF SOLAR
RADIATION SENSORS
N.A. N.A. N.A.
Users
Category of Product / service
Project developers needs at different plant stages Other users

Solar radiation products for end users
Page 6 of 56
Table 1 are later described. Cells with N.A. legend, means that no relevant applications are showed
later.

Solar radiation products for end users
Page 7 of 56
1 MAPS AND SOLAR RADIATION POTENTIAL ASSESSMENTS
Main authors: M. Silva, L. Ramírez
This chapter is focused on the products related to solar radiation maps and other products where
geographical information systems are applied.
Geographic Information System (GIS) are tools for the compilation, consultation, exploitation and/or
analysis of maps and geospatial data. Geospatial data are organized as a set of vector or raster layers,
and the GIS software usually permits the visualization of multiple layers of information and provides
specific methods and models that operate with those layers. In the field of renewable energy, GIS
provides convenient digital environments that help developers to identify sites with high potential and
permit policymakers to perform analyses oriented to the elaboration of energy policies (Broesamle et
al., 2001).
PRODUCTS AND SERVICES IN THE CATEGORY
Solar radiation gridded information can be adequately represented by means of solar resource maps
and GIS solar radiation layers. In addition to the representation, GIS tools also help in the data access
through standard protocols.
The main products included in this category are:
1. Solar radiation maps.
Solar radiation maps usually represent the spatial distribution of annual or monthly average values of
solar radiation for a certain geographical region. In solar radiation maps (Diabaté et al., 1989), solar
radiation values are usually represented by color codes. Solar resource maps in electronic format can
be interactive, having the potential to display additional or extended information when a point or
region of the map is selected.
2. Potential assessment of solar energy.
Potential assessment of solar energy are products that are much more elaborate than a solar radiation map (Broesamle et al., 2001). This type of product needs to specify several input parameters as: type of solar energy technology, specific characteristics of a power plant, land uses suitable with the selected power plant, and even local or regional subsidies.
Figure 3 shows an example of a two steps solar thermal electricity (STE) potential assessment. In the first step, suitable zones are identified; and in the second one the electric power is calculated from an annual map of solar energy (Navarro et al., 2015).

Solar radiation products for end users
Page 8 of 56
Figure 3. GIS analysis for a two steps STE potential assessment. Unsuitable zones in black. (Navarro et al., 2015)
RELEVANT FEATURES
The relevant features for the application of GIS tools in the field of solar energy are:
1. Spatial resolution is is related to the grid size of the map. Depends mainly on the data source for
the map generation.
2. Region covered depends on the data source for the map generation. Even when the map covers
the global Earth surface, the solar radiation estimation always comes from several data sources.
Usually, maps cover continents, countries, or specific zones.
3. Layers of related geospatial data. In addition to the solar radiation data, additional references are
needed through proper identification of the place of interest. This is at least: boundaries, regional
limits, roads, city centers, power grids, main water features…
4. Accuracy / uncertainty of the geospatial data. This parameter can vary among the parameters. The
uncertainty can apply to the value or to the geospatial location.
5. Time resolution. Usually, map values are considered to be mostly static for a specific period. This
is the case for most of the geographical parameters like road or mountains. But in the case of
meteorological variables as is the case of solar radiation, maps must refer to a specific year, month
or related to an estimated period. In addition to static values, series of maps can be available for
a zone or a specific point.
o Applications of series of maps can be included in the case of nowcasting and forecasting
systems.
o Applications of series of a specific point are addressed in the sections 3 MODELED SOLAR
RADIATION AND METEOROLOGICAL PARAMETERS and 4 LONG TERM REPRESENTATIVE
TIME SERIES IN A SPECIFIC LOCATION (Boilley & Wald, 2015).

Solar radiation products for end users
Page 9 of 56
PROJECT STAGES AND END USERS
A. Prefeasibility
GIS tools and services are useful for the identification of potential sites during the first stages of
development of solar energy projects.
In addition to the solar resource information, other relevant layers like topography, land use,
communication and transport infrastructure, water availability, power grid, etc. and models for the
estimation of the energy generation and energy cost through different technologies are usually
required.
Minimum or recommended values for the relevant specification items:
● Spatial resolution: grid size of 2.5 x 2.5 km ● Region covered: country or state level. ● Layers of related geospatial data: digital terrain model, roads, cities. ● Layers of related power system data: load, generation potential from other renewables, etc.
● Uncertainty of solar radiation data (DNI)1: ≤ 15 % ● Time resolution: from annual values to hourly values, depending on the scope of the analysis.
B. Feasibility
GIS tools can be useful at the feasibility phase, for example, to compare compatibility with other
renewable resources. In this respect, the relevant information layers (PV or wind production potential,
etc.) should have sufficient resolution and accuracy.
C. Due diligence
The GIS data on load matching and compatibility with other renewables will be considered when
analyzing risks.
D. Acceptance
No relevant application.
E. System or plant operation
In the case of big plants, there are nowcasting and forecasting services that uses solar radiation maps
with high spatial and time resolution. These services are needed for real-time control and operation of
the plant.
Minimum or recommended values for the relevant specification items:
● Spatial resolution: grid size of 100m x 100m ● Region covered: power plant level. ● Layers of related geospatial data: power plant lay out.
● Uncertainty of solar radiation data: ≤ 10 % ● Time resolution: 10 minutes.
1 All uncertainties are at 95% confidence level, unless otherwise stated

Solar radiation products for end users
Page 10 of 56
F. Grid operators
Grid operators need high-resolution solar radiation maps from short-term and very short-term
forecasts. The main use is to adjust, one day or some hours ahead, the capacity operation
programming.
● Spatial resolution: grid size of 1km x 1km ● Region covered: country or state. ● Layers of related geospatial data: boundaries, power grids.
● Uncertainty of solar radiation data: ≤ 10 % ● Time resolution: from minute to hourly values.
G. Policy making
GIS tools and services are useful for the potential assessment of solar energy systems for large areas,
helping in the elaboration of regional or national policies for their deployment. In addition to solar
radiation data, other relevant information like topography, land use, communication and transport
infrastructure, water availability, power grid, etc. and models for the estimation of the energy
generation and energy cost through different technologies are usually required.
Minimum or recommended values for the relevant specification items:
● Spatial resolution: grid size of 10km x 10km ● Region covered: country or state. ● Layers of related geospatial data: digital terrain model, boundaries.
● Uncertainty of solar radiation (DNI) data: ≤ 10 % ● Time resolution: from hourly to monthly values.
H. Education
GIS tools can be used for training developers and policy makers. The requirements for education and
training developers and policy makers are similar. In addition to solar radiation data, other relevant
information like topography, land use, communication and transport infrastructure, water availability,
power grid, etc. and models for the estimation of the energy generation and energy cost through
different technologies are usually required.
The GIS training environment should permit the elaboration and analysis of different study cases.
Minimum or recommended values for the relevant specification items:
● Spatial resolution: grid size of 10km x 10km ● Region covered: country or state. ● Layers of related geospatial data: digital terrain model, boundaries. ● Uncertainty of solar radiation (DNI) data: ≤ 10 % ● Time resolution: from hourly to annual values.

Solar radiation products for end users
Page 11 of 56
2 CONSULTANCY SERVICES ON SOLAR RADIATION MEASUREMENTS
Main author: R. Meyer, S. Weber, C. Fernandez-Peruchena
High investments required for CSP projects impose the need for high-quality solar data, which is
essential in the planning and design of the facility as well as for its operation after completion. DNI
data must be acquired for the precise location of the project site, due to its high spatial variability.
Satellite-based models, which is currently the most common approach carried out in solar resource
mapping and solar irradiance time series generation, introduce errors that are translated into bias and
disagreement of DNI frequency distribution functions, which may lead to substantial uncertainties in
the solar resource assessment. In this scenario, precise measurements of DNI at the sites of interest
are indispensable for substantial CSP project development: a 1-2 % increase in energy conversion
efficiency of a CSP plant can translate into millions of dollars in cost reductions for the CSP plant design
and operation.
Concentrating solar power plants require primarily direct radiation, which is the part of the sunlight
directly emitted by the Sun and hitting the Earth’ surface. As direct radiation is an approximately
parallel beam of light, it may be easily concentrated by optical systems such as mirrors or lenses. As
observed from Earth’s surface, the apparent size or angular diameter of the Sun is approximately 0.5°.
We refer to this as solar disk. Commonly, the terminology Direct Normal Irradiance (DNI) is used and
accounts for all radiation in the solar spectral range between 300 nm and 4000 nm within a 2.5° half-
angle around the Sun’s centre.
When observing DNI at the Earth’ surface, there is always a portion of light, which is scattered forward
by atmospheric constituents, but might have slight angular derivation compared to sunlight originating
directly from the solar disk. This part of the solar beam coming from the ring up to 2.5° radius around
the solar disk is called Circum-Solar Radiation (CSR).
In the context of the World Meteorological Organization (WMO, 2008), Baseline Surface Measurement
Network (BSRN) established the first reference guide for the installation of solar radiation instruments
(Mcarthur, 2005). The World Bank’s Sector Management Assistance Program (ESMAP) introduced the
Multi-Tier Framework for measuring energy access. For solar measurement purposes, three
configurations – or tiers – have become popular: Tier 1 to Tier 3. However, only Tier 1 and Tier 2
standards allow measurement or derivation of DNI. Together with other organizations, for CSP, Tier 1
and Tier 2 standards become applicable and are outlined in Classification of Solar Measurements for
CSP according to World Bank. The solar measurement campaign provides data of high quality to a
detailed profitability studies and the final plant design. Since even solar measurement equipment of
highest standards may contain biased or distorted data, it is recommended to quality check all records.
At best, consultancy services provide such post-processing of solar measurements as standardized
procedure to enhance data quality and ensure representativeness of on-site conditions.

Solar radiation products for end users
Page 12 of 56
PRODUCTS AND SERVICES IN THE CATEGORY
3. Measuring DNI using pyrheliometer.
Since CSP plants are based on the principle of concentrating solar radiation, it is indispensable to know
the direction of incident irradiance. Accordingly, only sunlight that directly reaches the CSP’s mirrors
can be harvested. Scattered light therefore is neglected in CSP energy yield estimates. Thus, direct
incident irradiance is of preliminary interest to CSP projects. The physical value of irradiance is
indicated as a function of the irradiated area. To specify the area’s orientation, solar measurements
commonly record radiation incident normal to the direction of sunlight. This value is referred to as
Direct Normal Irradiance (DNI).
A pyrheliometer enables the capture of direct sunlight – the preliminary driver for energy yield
generated by CSP systems. As illustrated in Figure 4, the pyrheliometer’s narrow field of view and
elongated cavity receives irradiance directly emitted from the Sun when positioned towards the sun.
Today, operational pyrheliometers for commercial application are available from various
manufacturers, such as EKO, Eppley, Hukseflux, Kipp & Zonen and Middelton. Here, it is of utmost
importance to ensure the envisaged instrument complies with ISO9060:2018 Class A standards for Tier
1 and ISO9060:2018 Class B for Tier 2, respectively.
Figure 4: Pyrheliometer to measure DNI. By precise positioning in direction of
incident sunlight, the radiometer at the pyrheliometer’s rear, only direct sunlight is registered. Image shows the Hukseflux DR30-D1 pyrheliometer.
4. Measuring DNI using RSI
The principle of an RSI is to measure both global and diffuse irradiance. This is achieved by a fast-
response photodiode mounted to the RSI’s head unit (see small black cylinder in Figure 5) and a curved
blank band. At daytime, the black band rotates around the photodiode once every minute and thereby
shades the sensor. Accordingly, the black band is called shadowband.
When the shadowband is stationary, the photodiode is measuring global irradiance. If the shadowband
is rotating, the system can automatically derive the value of diffuse irradiance at the instant the sensor
is shaded. From these two properties (global and diffuse irradiance) and the Sun’s elevation angle, DNI
may then be derived. Figure 5 shows an example of such an RSI. The motor to drive the shadowband
Scattered light
Direct sunlight

Solar radiation products for end users
Page 13 of 56
sits within the casing and is power consuming. Consequently, solar measurement systems that
consider RSI systems need to consider enhanced power demand.
In analogue to the pyrheliometer’s market, several manufacturers offer RSI systems for commercial
use and differ in both design and technical specifications. Commonly, consultancy services that offer
solar measurement campaigns have a certain brand or type they collaborate with and which they will
promote. It is more important to bear general recommendations and standards in mind. An
internationally recognized collected edition such as NREL’s Best Practices Handbook (Sengupta et al.,
2017) and standards such as ISO9060 and IEC 61724-1 are specific examples. Both classification
standards provide instrumentation guidelines for particular applications, such as solar measurements.
Figure 5: RSI (centre) mounted to a HelioScale φ station
Currently, popular models for RSIs are for instance Reichert GmbH’s RSP 4G (seen in Figure 5),
Irradiance Inc.’s RSR2, Yankee Environmental Systems, Inc.’s SDR1 and CSP-Services GmbH’s Twin-RSI.
As aforementioned, such systems rely especially on measurements while the shadowband is turning.
Since one rotation takes approx. only 1 second, most of RSIs use a detector (photosensor) with a fast
response time. The required fast response time is the reason why thermopile sensors are not usually
employed here. Instead, silicon-based semiconducting sensors are commonly used. An example for
such is Li-COR’s Li-200SA, which is installed on the RSP 4G (see Figure 5).
5. Measuring DNI using alternate instruments
Since tracked systems commonly provide the highest level of accuracy, these are the preferred choice
for CSP-relevant solar measurements. However, there are various systems that allow measurement or
at least derivation of DNI. One such instrument is Delta-T Devices, Ltd. SPN-1 where an array of seven
thermopile pyranometers is assembled under a glass dome. The glass dome is equipped with a shading
mask, which is specifically designed to ensure that at least one of the sensors is shaded and one is
unshaded at any time of the day and year (Sengupta et al., 2017). The benefit of such a system with
no moving parts is clearly the reduced requirements in power supply and lower maintenance
requirements but comes with large systematic biases (Vuilleumier et. al, 2017).
Another instrument that enables DNI measurement is the Scanning Pyrheliometer/Pyranometer
(SCAPP) or the sunshine duration sensor of type Soni e3. The latter requires great effort in station
maintenance while both systems are less accurate than tracked systems. Thus, in alignment with
NREL’s Best Practices, DNI measurements are recommended to be based on tracked systems. The
characteristics such measurements achieve are provided in the following section.

Solar radiation products for end users
Page 14 of 56
I. Extended measurement instruments for CSP
While solar measurements are of major interest to CSP projects, a broad choice for extended
investigations is available. Cost-efficient solutions are briefly mentioned.
Although solar measurement stations for CSP applications are designed to capture only direct sunlight,
measurements are affected by the Sun’s circumsolar region. Depending on atmospheric conditions,
the magnitude of the circumsolar irradiance varies. Since all CSP systems rely on precise deflection of
direct sunlight, the circumsolar share does not contribute to energy production. Accordingly, to
determine DNI and the consequent energy yield precisely, such scattered light must be considered.
Therefore, so-called Solar Aureole Measurement (SAM) devices are employed (Wilbert, 2014). SAM
devices allows determination of the share of DNI that will not contribute to energy production and,
thus, increases the reliability of power performance prediction. A recommended device for circumsolar
radiation measurements is a so-called ISE-CSR camera.
Further recommended services for CSP target technical aspects of plant operation and are not directly
related to solar irradiance measurements. However, soiling measurement systems may be considered
alongside solar measurement stations and offer cost-efficient analysis. By adding reference cells (see
assembly on the left in Figure 5) to ground-based solar measurement stations, consultancy services for
solar measurements can help analyze the expected soiling impact. By doing so, best practices for
cleaning schedules can be determined and thereby will maximize energy yield under consideration of
plant maintenance expenses.
Finally, it is also recommended to include measurements of:
Global irradiation.
Diffuse irradiation.
Wind speed and direction.
Ambient temperature.
Humidity.
All these instruments do not add significant cost to the measurement station but provide improved
quality control of the DNI measurements.
RELEVANT FEATURES
The relevant features for the application of solar radiation measurements in CSP are:
1. Type of instrument for DNI measurement. The type of instrument fixes the uncertainty range and maintenance needs.
o Uncertainty. Must be lower when the stage of the plant is more advanced. o Maintenance. It is well related to the uncertainty, and more frequent maintenance results
in lower uncertainty. 2. Time resolution. From hourly data to one minute data. 3. Time period. Global period goes from few months to online measurements. 4. Extended measurements. 5. Number of measurement stations required.

Solar radiation products for end users
Page 15 of 56
PROJECT STAGES AND END USERS
A. Prefeasibility
No relevant application
B. Feasibility (site qualification)
Developers and financial institutions are interested in the economic viability of CSP projects and the
ability of the facility to service its debt in any scenario during plant lifetime. Long-term DNI series, that
provides valuable information on inter-annual variability and seasonal trends of solar resource, is
crucial for estimating the expected outputs from a CSP plant during the feasibility stage. Despite the
fact that the ground network of radiometric measurements is continuously growing, long-term (multi-
decadal) solar irradiance ground measurements at the site selected for a CSP plant are usually not
available and consequently satellite-based modeled series are typically used for solar resource
assessments. To overcome the inaccuracies introduced by these modeled series (not suitable for
feasibility studies), a common solution is to post-process the modeled data with coincident and quality
assured ground measurements (typically 1 year) at the site(IEC/TS 62862-1-2, 2017). This procedure is
designed for understanding the source of discrepancy between modeled and measured series and
subsequently to improve the accuracy of the resulting time series for reliable solar resource
assessments at the project site. Ground measurements can also be used for gap filling in long-term
modeled series.
During site qualification, considered locations are often remote and bare ground, which can be
challenging for the solar measurement campaign: In general, no on-site power supply is to be assumed.
This necessitates that the solar measurement station has a self-sustaining power supply. This is best
realized by simple PV-modules mounted to the station’s structure. While such solar panels may provide
sufficient power supply during sunny days, it would not function during the nighttime. Therefore, the
solar panel is tied to power batteries. For solar measurement station of type Tier 1 and Tier 2, PV
modules commonly provide 120 V to 150 V, although requirements for power supply highly depend
on the location.
For this purpose, data logging systems that process the recorded data ought to provide Global System
for Mobile Communication (GSM) technology. Mobile data transfer is a prerequisite for live data
quality and station operation checks. Such remote surveillance is recommended to be performed on a
daily basis. This allows the consultancy service to pre-empt station malfunction by alerting local
personnel in time. Since consultancy services ideally maintain an extensive network of multiple
stations, such daily station checks may be provided at low cost to the end user.
Minimum or recommended values for the relevant specification items:
Type of solar radiation instruments. o Solar components: GHI, DNI and DHI o Uncertainty of solar radiation data: < 5 % (daily totals) o Measurement devices:
pyrheliometers and pyranometers: Good quality according to WMO or Class A or B according to ISO 9060
rotating shadowband irradiometers

Solar radiation products for end users
Page 16 of 56
o Maintenance: weekly station maintenance: radiometers should be cleaned and checked
(pyrheliometer alignment and pyranometers horizontality and shading) weekly measured data monitoring to identify any issues with measurements.
Time resolution: 1 hour
Time period: > year
Extended measurements: yes.
Number of measurement stations required: 1.
C. Due diligence (commissioning)
The estimations of CSP plant outputs made in previous stages can now be updated with new solar
radiation measured with high accuracy in order to reduce its uncertainty and to accurately assess the
reliability of the plant output prediction under different scenarios during the plant lifetime (Fernández-
Peruchena et al., 2018). The better the ground-measured solar irradiance data, the more accurately
the bias in the satellite-derived data can be evaluated and subsequently corrected. Radiometers must
be maintained, and the meteorological station must be regularly checked. In addition, auxiliary
meteorological measurements (ambient temperature, wind speed/direction, precipitation, relative
humidity, and barometric pressure) are also crucial at this stage as they influence the estimated system
performance. All these efforts are aimed at reducing the risk for the investors through the mitigation
of uncertainties.
Considering services for solar measurements, the plant owner may not be responsible for operation
and maintenance (O&M). Accordingly, consultancy services for solar measurements are recommended
to be requested by the financial investor.
Minimum or recommended values for the relevant specification items:
Type of solar radiation instruments. o Solar components: GHI, DNI and DHI o Uncertainty of solar radiation data: < 2 % (daily totals) o Measurement devices: pyrheliometers and pyranometers: Good quality according to
WMO or Class A according to ISO 9060 o Maintenance:
▪ daily station maintenance: radiometers should be cleaned and checked (pyrheliometer alignment and pyranometers horizontality and shading)
▪ daily measured data monitoring to identify any issues with measurements.
Time resolution: 1 min
Time period: > 1 year
Extended measurements: yes
Number of measurement stations required: 1.
D. Acceptance
Solar radiation measurements may be used for conducting the different phases of plant acceptance
testing. The initial acceptance testing, that must be conducted and passed by the CSP plant typically
includes a demonstration of the capability and efficiency of the major systems in the plant. Commercial
Operation Testing is intended for the project to demonstrate to the utility or off-taker that the plant is
ready to go into normal operation. Final Acceptance Test is typically a 12-month or longer performance

Solar radiation products for end users
Page 17 of 56
test where the actual plant performance must achieve some level of performance in relation to the
EPC’s performance model (Mehos et al., 2020).
Minimum or recommended values for the relevant specification items:
Type of solar radiation instruments. o Solar components: GHI, DNI and DHI. o Uncertainty of solar radiation data: < 2 % (daily totals). o Measurement devices: pyrheliometers and pyranometers: Good quality according to
WMO or Class A according to ISO 9060. o Maintenance:
▪ daily station maintenance: radiometers should be cleaned and checked (pyrheliometer alignment and pyranometers horizontality and shading)
▪ daily measured data monitoring to identify any issues with measurements.
Time resolution: 1 min
Time period: > 1 year
Extended measurements: yes.
Number of measurement stations required: >1.
E. System or plant operation
CSP plant control and operational planning benefits from a detailed understanding of the solar
resource fueling the plant. To achieve the highest accuracies in solar radiation measurements, the
domes and windows of the instruments must be cleaned daily, and the station must be checked daily
as well (pyrheliometer alignment, shade disk position, etc.), and the instruments must be calibrated
regularly according to manufacturer specifications. A measurement station of this configuration will
suffer significant degradation in the quality and accuracy of the data without regular (daily)
maintenance. Auxiliary meteorological measurements are also crucial at this stage for developing an
optimum operating strategy for the solar plant. All these data allow assessing the power plant
performance to improve yield predictions.
At this phase, the ratio of produced electricity to theoretically possible production is surveyed and
referred to as performance ratio (PR). The theoretical production is commonly simulated based on
meteorological data and operation settings as contractually agreed upon. Operation settings thereby
often follow and is outlined by the International Electrotechnical Commission (IEC, 2011). Since
settings are often predefined or contractually binding, the plants PR is driven by meteorological
conditions, which therefore must be monitored continuously at utmost accuracy.
In addition, solar resource measurements during plant operations are needed for much more than the
average annual production of the plant. For instance, analysis of diurnal electricity output is relevant
to identify the needs and capacity of on-site storage systems. Redistributing the feed into the power
grid allows the optimization of turnover and adaption to the demand.
To enable such monitoring at all times, redundant measurements become relevant: To avoid gaps in
solar measurements, Tier 1 stations are often recommended to be equipped with a second
pyrheliometer and/or pyranometer. Such redundancy can furthermore be utilized for data quality
control by intercomparing values.
Minimum or recommended values for the relevant specification items:

Solar radiation products for end users
Page 18 of 56
Type of solar radiation instruments. o Solar components: GHI, DNI and DHI. o Uncertainty of solar radiation data: < 2 % (daily totals). o Measurement devices: pyrheliometers and pyranometers: Good quality according to
WMO or First class according to ISO 9060. o Maintenance:
▪ daily station maintenance: radiometers should be cleaned and checked (pyrheliometer alignment and pyranometers horizontality and shading)
▪ daily measured data monitoring to identify any issues with measurements.
o Calibration of pyranometers and pyrheliometers according to the international ISO 9847 and ISO 9059 standards.
Time resolution: 1 min
Time period: > year
Extended measurements: yes.
Number of measurement stations required: >2 (STE power plants > 50MW).
F. Grid operators
No relevant application
G. Policy making
The deployment of solar radiation monitoring networks enhances the quality of solar resource maps
(through the validation of solar radiation models or eventually the correction of their systematic
biases, especially for DNI), which helps to make decisions about the type of solar technology to be used
and is mandatory for designing the implementation of solar technologies in a country. In addition,
many areas such as agrometeorology or climate sciences benefit from radiometric networks.
Minimum or recommended values for the relevant specification items:
Type of solar radiation instruments: Good quality Class B or better instruments that are maintained on a regular basis.
Time resolution: 1 hour
Time period: > year
Extended measurements: no.
Number of measurement stations required: should be determined as a function of the existing climate zones and topography in the region.
H. Education
Solar radiation measurements lessons at university level are key for future generations of renewable
energy engineers, and also for a wide range of areas: agriculture (irrigation requirements), hydrology,
ecology, climate and atmospheric sciences, or weather forecasting among others.
Type of solar radiation instruments: whatever.
Time resolution: 1 hour
Time period: whatever.
Extended measurements: no.
Number of measurement stations required: 1.
Solar radiation products for end users
Page 19 of 56
3 MODELED SOLAR RADIATION AND METEOROLOGICAL PARAMETERS
Main author: M. Sengupta
Accurate solar radiation datasets are required at all stages of development and operations of a solar
generation facility. In most cases solar radiation measurements using ground-based instruments are
only available on-site for about a year before a project receives financing. As solar resource varies
significantly on an annual basis, understanding the inter-annual variability and collecting data for
multiple years is important since the variability could range in the order of 5%-10% for Global
Horizontal Irradiance (GHI) and up to 15% for Direct Normal Irradiance (DNI)(Gueymard & Wilcox,
2011).
Various stage of solar energy projects as shown in Figure 2 have different data requirements. As can
be seen in this figure from the Solar Resource Handbook (Sengupta et al., 2017) all stages of a project
require modeled solar resource information.
PRODUCTS AND SERVICES IN THE CATEGORY
6. Modeled Solar Radiation series
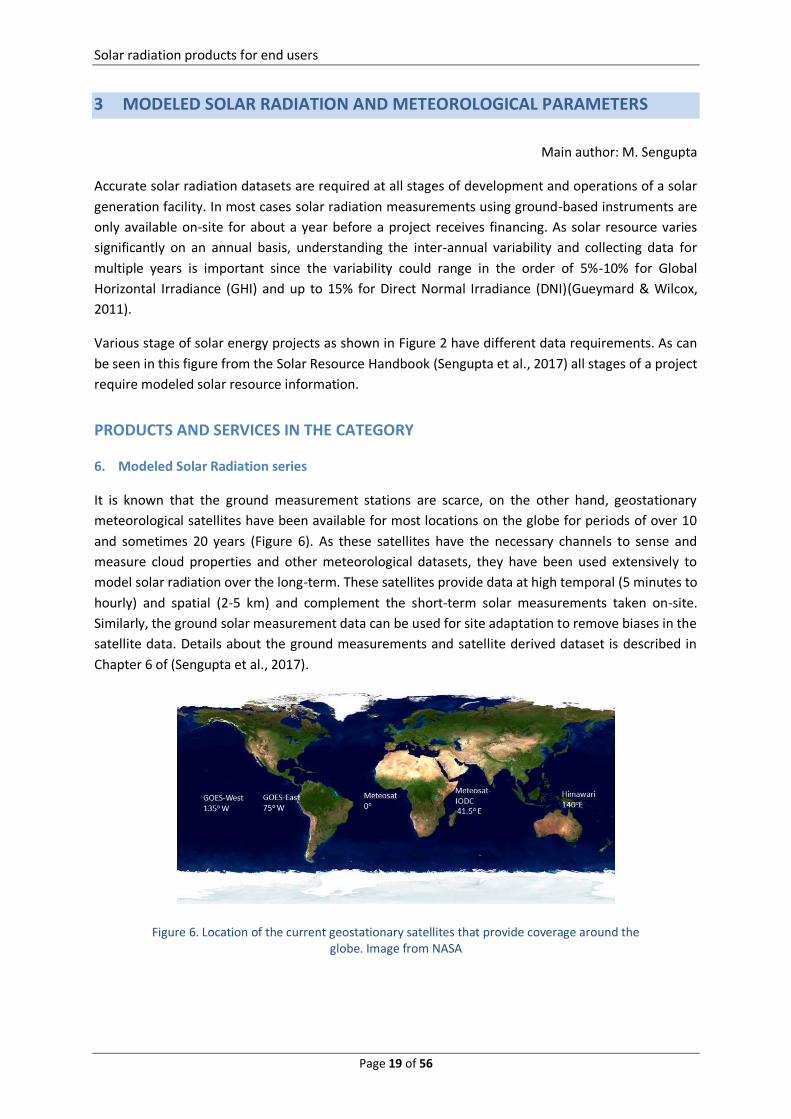
It is known that the ground measurement stations are scarce, on the other hand, geostationary
meteorological satellites have been available for most locations on the globe for periods of over 10
and sometimes 20 years (Figure 6). As these satellites have the necessary channels to sense and
measure cloud properties and other meteorological datasets, they have been used extensively to
model solar radiation over the long-term. These satellites provide data at high temporal (5 minutes to
hourly) and spatial (2-5 km) and complement the short-term solar measurements taken on-site.
Similarly, the ground solar measurement data can be used for site adaptation to remove biases in the
satellite data. Details about the ground measurements and satellite derived dataset is described in
Chapter 6 of (Sengupta et al., 2017).
Figure 6. Location of the current geostationary satellites that provide coverage around the globe. Image from NASA

Solar radiation products for end users
Page 20 of 56
While solar radiation is the most important variable information, additional meteorological variables
are required to model electric generation using various technologies such as photovoltaics and solar
thermal technologies. Some of the meteorological parameters such as temperature, humidity,
pressure, wind-speed and surface albedo are important. As these parameters are not regularly
measured on a long-term basis at prospective sites modeled datasets form an important component
of the requirements for solar generation modeling. These modeled data can derived from reanalysis
datasets such as Modern-Era Retrospective Analysis for Research and Applications, version-2 (MERRA-
2) from NASA(Gelaro et al., 2017); North American Regional Reanalysis (NARR)(Mesinger et al., 2006);
Climate Forecast System Reanalysis from the National Center from Environmental Prediction (NCEP)
and ERA-5 from the European Center for Medium Range Weather Forecasting (ECMWF).
RELEVANT FEATURES
The relevant features for the modeled solar radiation and meteorological parameters are:
1. Spatial resolution. It is related with the grid size. Depends mainly on the data source for the
estimation.
2. Region covered. Usually, cover continents, countries, or specific zones.
3. Solar radiation variables included. 4. Accuracy / uncertainty of the solar radiation. 5. Time resolution. 6. Time period. 7. Extended variables.
PROJECT STAGES AND END USERS
A. Prefeasibility
For the four steps of a project, prefeasibility studies which is at the early stages of project development,
have the lowest data requirement. For these studies, solar resource maps depicting regional long-term
annual means which can provide a rough estimation of the expected solar resource are considered
(e.g., Figure 7). Maps providing monthly or seasonal information if available can enhance the accuracy
of prefeasibility studies and can provide additional important information such as matching of load
and generation. While long-term ground measurements would be ideal, there is a need for modeled
data as ground measurements may not be available regionally. The modeled data should be available
for multiple years and preferably over at least a 10 year period. These datasets can be obtained from
various sources as described in Chapter 5 of (Sengupta et al., 2017). Normally prefeasibility studies
have a goal of determining whether there is sufficient resource availability on a consistent basis, as
shown by multiple years of modeled data. As mentioned above, the temporal resolution of the data
should be annual values at a minimum and spatial resolution of the datasets can be tens of kilometers
unless the location has significant terrain impacts on the resource. Additionally, the uncertainty in the
datasets may be higher than in later stage of the project but should be reasonably representative of
the location being considered. In most cases the most recent data may not be needed. The multi-year
modeled data at regional scale is analyzed to determine the availability of annual solar resource.
Prefeasibility studies are used for determining viable technologies and whether subsidies are required
to make the site viable.

Solar radiation products for end users
Page 21 of 56
Figure 7. Example of long-term solar resource averages.
Minimum or recommended values for the relevant specification items:
Spatial resolution: better than 10 km.
Region covered: country or state.
Solar radiation variables included: GHI, DNI.
Accuracy / uncertainty of the solar radiation: <10%.
Time resolution: months/annual.
Time period: long-term.
Extended variables: not needed.
B. Feasibility
For feasibility studies the requirements for data significantly increase with a need for multi-year data
of at least a hourly resolution. Normally the satellites have been able to provide data at hourly
resolution for the last 10-20 years based on location. More recent data are needed as there is need for
overlap with ground measurements which will probably be available for a short period of time (at least
for a year) and mostly for a recent time period. Combining short-term measurements with the satellite-
based dataset provides a long-term dataset of higher accuracy. This dataset enables understanding of
the long-term solar resource variability and in removing any bias that might occur in the modeled
dataset. This is referred to as site adaptation (IEC/TS 62862-1-2, 2017). The feasibility studies are
primarily conducted to quantify yield and optimize the design of the plant using various models such
as PYSyst, System Advisor Model or PlantPredict. The ground measurements are used to conduct a
preliminary validation of the modeled data.
Minimum or recommended values for the relevant specification items:

Solar radiation products for end users
Page 22 of 56
Spatial resolution: < 5km.
Region covered: power plant location.
Solar radiation variables included: GHI, DNI.
Accuracy / uncertainty of the solar radiation: <5%.
Time resolution: hourly.
Time period: >10 years.
Extended variables: not needed.
C. Due diligence
At this point in the process there is a need for highly accurate ground measurements mostly measuring
resource every minute coupled with modeled data that covers the period during which the ground
data was collected. Normally, over a year of ground data is required. This ground data is then used for
site-adaptation of the modeled data that captures seasonal and interannual variability. The
expectation is that the site adapted modeled data is more accurate and can be used for developing
the final design of the project and conducting a detail assessment of the financials of the project (see
Chapter 8 of (Sengupta et al., 2017)).
Minimum or recommended values for the relevant specification items:
Spatial resolution: < 5km.
Region covered: power plant or nearby location .
Solar radiation variables included: GHI, DNI.
Accuracy / uncertainty of the solar radiation: <5%.
Time resolution: 15 minutes.
Time period: >10 years.
Extended variables: temperature, relative humidity, wind speed and direction.
D. Acceptance
High resolution solar resource dataset is required once a solar plant is built. The modeled and
measured data of the same quality and resolution as available for due diligence may be used. In most
cases additional ground measurements are available for large utility scale plants. This ensures that the
ground data is of high-quality and low uncertainty as it is used to determine whether the plant is
producing as per projections that were used in the due diligence phase of the project.
Minimum or recommended values for the relevant specification items:
Spatial resolution: < 5km.
Region covered: power plant location.
Solar radiation variables included: GHI, DNI.
Accuracy / uncertainty of the solar radiation: <5%.
Time resolution: 15 minutes.
Time period: >10 years.
Extended variables: temperature, relative humidity.

Solar radiation products for end users
Page 23 of 56
E. System or plant operation
Plant operations require measured or modeled data in close to real-time as it is used to detect and fix
any technical faults in the system that is leading to under-generation. This data is available at high-
resolution at 15 minutes or less with delays that are less than a day. Modeled forecast of solar resource
is also important at this point as forecasts are used to for determining operational strategies including
unit commitment and dispatch where optimizing time-of-day pricing versus production potential
becomes essential (Sengupta et al., 2017). Problems with production can also be spotted with this
short-interval data. High quality ground-based measurements can be used to assess system
performance over time.
Minimum or recommended values for the relevant specification items:
Spatial resolution: < 5km.
Region covered: power plant location and surroundings.
Solar radiation variables included: DNI.
Accuracy / uncertainty of the solar radiation: <5%.
Time resolution: 15 minutes.
Time period: current moment.
Extended variables: temperature, relative humidity.
F. Grid operators
No relevant application.
G. Policy making
Annual maps of solar resource are important for making various policy decisions such as identifying
renewable energy zones, transmission planning and for determination of subsidies. It should be noted
that other datasets such as land-use maps are required for policy making.
Minimum or recommended values for the relevant specification items:
Spatial resolution: 5 to 15 km.
Region covered: country or state.
Solar radiation variables included: GHI, DNI.
Accuracy / uncertainty of the solar radiation: >10%.
Time resolution: annual. Monthly or seasonal can provide additional useful information for uses such as load matching.
Time period: long term.
Extended variables: not needed.
H. Education/Outreach
Educating and outreaching, end-users the availability solar resource data, data products, and research
results through a variety of mechanisms, including public web access, web-based tools, scientific
papers, technical reports, presentations at conferences and workshops. Some of these same data sets
are now being marketed commercially or integrated into commercial data products by the private
sector. The availability of such resource satisfies the end-user needs for design and decision tools. In

Solar radiation products for end users
Page 24 of 56
most cases education purposes are best met if public datasets are easily available. Nowadays there are
various public solar and meteorological datasets such as NREL’s NSRDB. These datasets are extremely
useful for students of renewable energy as there are no hurdles to dissemination and publication.
Minimum or recommended values for the relevant specification items:
Spatial resolution: not critical.
Region covered: country or state.
Solar radiation variables included: DNI, GHI.
Uncertainty of the solar radiation data: < 10%.
Time resolution: annual. Monthly, seasonal datasets provide the ability to answer advanced research questions.
Time period: long term.
Extended variables: not needed.

Solar radiation products for end users
Page 25 of 56
4 LONG TERM REPRESENTATIVE TIME SERIES IN A SPECIFIC LOCATION
Main authors: M. Blanco, M. Larrañeta
Time series of solar irradiance and other meteorological variables are essential inputs required to
design, evaluate and optimize solar energy systems at a given location. Currently, the most common
approach regarding their use consist of using these time series to build a “representative” solar
radiation and meteorological year for the given location, and then use this representative year in the
design, evaluation and optimization of solar energy systems at the location.
The starting point to build such a representative year is always a database with hourly or sub-hourly
time series of solar irradiance and other meteorological variables encompassing many years. The basic
idea is to concatenate the average months to generate an annual set representing “typical” conditions
(Lourdes Ramírez et al., 2012). This annual set can be named in different ways depending mainly on
the variables needed to build the final series and their weighting factors, the source of data (measured
and/or modelled), or the application. Commonly used names are Representative Meteorological Year
(RMY), Representative Solar Year (RSY), Test Reference years (TRY), Design Reference Year (DRY)(A
Habte et al., 2014). However, the most common denomination is Typical Meteorological Year (TMY).
Figure 8 shows the timeline of the most relevant methodologies for the generation of a condensed
year of meteorological data representing a long-term behavior.
Figure 8. Timeline of the main proposal of methodologies for long-term representative series generation. (Figure by L. Ramírez)
PRODUCTS AND SERVICES IN THE CATEGORY
7. Typical Meteorological Year
A TMY represents typical conditions, rather than extreme ones. A standard for the creation of a
meteorological data set for the simulation of Solar Thermal electricity Plants was developed in the
context of the International Electrotechnical Committee (Lourdes Ramírez et al., 2012)

Solar radiation products for end users
Page 26 of 56
8. Meteorological year of a PoE90
TMY it is not adequate to analyze adverse or worst-case conditions occurring at a location, an analysis
that is usually required in profitability and annual payback assessments. For those analyses, the
common practice is to generate a meteorological year in which the annual solar irradiation is expected
to be exceeded by 90% of the years during the power plant`s lifetime (Fernández-Peruchena et al.,
2018). The annual values is called PoE90 when the corresponding annual series is called MY90. It should
be noted that annual solar irradiation values are not uniquely correlated to the energy yield of a solar
plant. The yield is typically also influenced by other meteorological variables, such relative humidity,
wind speed and direction, ambient temperature, etc. Therefore, the MY90 similar to the TMY must
also include the time series of the rest of relevant meteorological variables.
In some cases, other series like MY75, MY95 or MY99 maybe required.
9. Long-term series
If a long-term time series of solar radiation data (measured or modeled) is available, an alternative to
the elaboration and use of a TMY, is to find the average year, and the extreme years, using the average
year as the TMY and the extreme low year at the MY90. In the case of good quality time series, this
approach has the advantage that the analysis is performed with real years that actually happened.
10. Multiyear synthetic series
A recent approach for long term characterization of solar radiation is to use a large number of Plausible
Meteorological Years (PMYs), synthetically generated yearly series that are consistent with the
observed statistical characteristics of the solar resource at the project location, allowing for a
stochastic assessment of the energy yield and a deeper characterization of the inherent variability of
the solar radiation. This alternative approach consist on the use of synthetic multiple annual time series
representing different scenarios of the solar resource at the site (Lourdes Ramírez et al., 2017). In a
recent approach (Larrañeta et al., 2019) 100 annual sets of coupled GHI+DNI at 1-min resolution
representing long-term performance of the solar radiation could be obtained from common satellite
derived databases. This method extends the range of potential scenarios with respect to the observed
ones, ensuring that the statistical characteristics observed in the input series are maintained.
PMYs could be a complementary product to TMYs, MY90 and MY99 providing a wider range of
scenarios and facilitates the exploration of the impact of the climate change in the long term
performance of the solar radiation. The resulting synthetic data sets can be used for feasibility
assessments of solar projects to help engineers assess solar radiation variability and its impact on solar
energy systems.
RELEVANT FEATURES
The relevant features for the application TMY and MY90 in the field of solar energy are:
1. Extension of the available dataset for the typical year calculation. 2. Available radiometric and meteorological variables for the calculation. 3. Time resolution of the available data and the desired typical year resolution. 4. Uncertainty of relevant meteorological data.
Solar radiation products for end users
Page 27 of 56
PROJECT STAGES AND END USERS
A. Prefeasibility
At the prefeasibility stage, TMYs are used in widely available computer programs, such as the System
Advisor Model (SAM), PVSYST, or PVWatts, to provide the solar resource and weather information
needed to perform energy yield simulations of solar energy systems.
At this stage, the energy yield simulations of solar energy systems are needed to optimize their
configuration, i.e., to size their sub-systems for a specific site and application, and to analyze and
compare expected performance at alternative sites. In addition to include the time series of the
appropriate radiometric variables for the solar energy system being considered, GHI and DHI for PV
systems and DNI for CSP systems, the TMY should incorporate time series of other relevant
meteorological variables, such as temperature, relative humidity and wind speed and direction, as
mentioned earlier.
The recommended features of the TMYs at prefeasibility stage are the following:
● Elaborated from a minimum of 10 to 15 annual satellite derived solar radiation datasets ● Uncertainty of solar radiation data: ≤ ± 15 % ● 1-hour time resolution
B. Feasibility
At the feasibility stage, TMYs are used within the context of siting, developing, designing and sizing the
solar energy systems. Higher resolution solar radiation time series is required at this stage.
The degree to which the variability of solar irradiance is appropriately captured in the time series data
mainly depends on the temporal resolution of the series as ramping events are more prevalent and
frequent at a higher temporal resolution (Meybodi et al., 2017). These events are caused by clouds,
which affect solar irradiance at minute timescales. Although most of the widely available simulation
tools are quasi-static and do not fully simulate transient behavior, providing them with hourly data as
input, instead of higher temporal resolution data, typically results in an overestimation of the
production of the solar energy systems being analyzed. At the feasibility stage in the development of
a solar project the uncertainty of the solar radiation and other meteorological data shall be reduced.
This can be achieved by performing an on-site adaptation of the satellite-derived data to correct biases.
While on the ground measurement devices present a lower uncertainty (pyrheliometers,
pyranometers, etc.) than satellite derived data, it is very unlikely that many years of ground
measurement data is available in the location under study. At least ten annual sets of ground-based
data in the location or its proximity is recommended. For DNI data, ground measurements within a
radius of 10 km from the exact location under study can be used, while for GHI data, this radius can be
extended to 100 km.
The recommended features of the meteorological time series at the feasibility stage are the following:
● On–site adapted satellite derived solar radiation data or more than 10 years ground measurement data on site or its proximity.
● 1 to 10 minute time resolution ● Uncertainty of solar radiation data: ≤ 5 %

Solar radiation products for end users
Page 28 of 56
C. Due diligence financing
At the due diligence financing stage, solar systems developers require an assessment of the expected
performance of the solar plant in different scenarios, the so-called bankability assessment. At this
stage, in addition to the most probable scenario provided by TMY annual series, information related
to the project annual payback in a bad year is usually required by the promoters to carry out the energy
yield prognosis based both in mean (TMY) and extreme (MY90) annual sets. High-resolution
meteorological data with low uncertainty is required for a precise assessment. Extreme annual sets for
several annual probabilities of exceedance scenarios (MY75, MY90, MY99), for which the calculation
method is similar, are recommended.
The multi-year approach is also a possibility because it is more comprehensive than classical
approaches since the impact of the monthly, daily and intra-daily variability of the solar radiation is
taken into account in the plant production estimations. Methods for estimating multiple time series
representing long-term performance of solar radiation in different probabilities of exceedance are still
immature but represent a promising solution for a better understanding of the inherent variability of
the solar radiation and its impact on the solar harnessing systems (Pagh Nielsen et al., 2016).
The recommended features of the long-term representative time series at this stage are the following:
● On–site adapted satellite derived solar radiation data for the long-term series calculation or more than 10 years ground measurement data on site or its proximity.
● 1 to 10 minute time resolution ● Calculation of mean (TMY) and extreme scenarios (MY75, MY90, MY99). ● Multiyear stochastic analysis ● Uncertainty of solar radiation data: ≤ 5 %
D. Acceptance
No relevant application
E. System or plant operation
No relevant application
F. Grid operator
No relevant application
G. Policy making
TMY are useful for the assessment of the potential for solar energy systems on large areas, helping in
the elaboration of regional or national policies for their deployment. These time series are usually
required to estimate the energy generation and cost of different solar technologies.
The recommended features of the TMYs for this purpose are the following:
● 10 to 15 annual satellite derived solar radiation datasets for the TMYs series calculation ● 1-hour time resolution
● Uncertainty of solar radiation data: ≤ 10 %

Solar radiation products for end users
Page 29 of 56
H. Education
Long-term representative time series can be used for training developers and policy makers and for
other educational purposes at the University level. For example, the use of TMY is recommended in
the context of explaining or analyzing the impact of modification of the different components of the
solar energy systems.
The recommended features of the TMYs at for this application are the following:
● 10 to 15 annual satellite derived solar radiation datasets for the TMYs series calculation ● 1-hour time resolution
● Uncertainty of solar radiation data: ≤ 10 %

Solar radiation products for end users
Page 30 of 56
5 SOLAR RADIATION VARIABILITY
Main author: S. Moreno.
The direct normal component of the solar resource is variable in time and space. The value of the DNI
incident on a site varies throughout the day and depends on the climate of the location. Its value has
a deterministic and a stochastic component. The deterministic component is caused by the apparent
daily motion of the sun in the sky and the Earth-Sun distance. This component can be calculated by
means of the Earth-Sun geometrical equations. The stochastic and less predictable component is
caused by several agents but the main one is the motion of the clouds. Clouds have a stochastic
behavior difficult to forecast at high temporal resolutions. In the absence of clouds, the atmospheric
components such as aerosols also have an influence, although these parameters are slowly varying
and do not significantly influence solar radiation at high temporal resolutions. Both agents are
dependent on the climatic features of the area and, for high resolutions, on the microclimatic features
of the location. So, the variability of the DNI could be quantified through estimating dispersion during
a specific period (temporal variability) or over a specific area (spatial variability).
The variability can be expressed as the coefficient of variation (COV) for variables having a normal
distribution, as the variance for any other known statistical distribution, or as the interquartile range
when the distribution is unknown. COV is obtained by dividing the standard deviation by the mean of
the population or sample (Sengupta et al., 2017).
PRODUCTS AND SERVICES IN THE CATEGORY
11. DNI variability maps
In the context of a Solar Energy project, the spatial variability of the DNI is mainly used in the pre-
feasibility stage to assess the suitability of datasets from nearby locations when a quality dataset on-
site is not available.
12. Time series variability
The time variability is used in different stages of the project and for different time resolutions, from
annual to daily resolution. As the stages of the project progress, the resolution of the variability
evaluated increases. Figure 9 shows how the variability of a GHI time series at a North American
location varies depending on the integration time (Perez et al., 2016).

Solar radiation products for end users
Page 31 of 56
Figure 9. Variability of GHI time series at a North American location, depending on the integration time.
(Perez et al., 2016)
RELEVANT FEATURES
The relevant features for the solar radiation variability are:
1. Solar radiation variables for the variability assessment. 2. Time resolution (from annual to hourly). 3. Spatial resolution. 4. Period of records.
PROJECT STAGES AND END USERS
A. Prefeasibility
In most countries, the available solar resource information is limited. So, it is common that no on-site
data is available or, if so, the data is of low-quality or does not cover a long enough time period. The
knowledge of the spatial variability in the area of interest helps to assess the suitability of datasets
from nearby locations. In areas with low spatial variability, measurements from a nearby station could
possibly represent the solar resource at the selected site, avoiding the need for additional
measurements to extend the dataset, filling gaps (Moreno-Tejera et al., 2015) or, even, representing
the location (Moreno-Tejera et al., 2016) when no on-site data are available. In these cases, the
distance to consider a station close to the site could be considered between 10 and 50 km depending
on the spatial variability value (Sengupta et al., 2017). The spatial variability can be quantified by the
annual DNI COV of an area and is commonly estimated by means of geographic information system
(GIS) solar resource layers or annual DNI maps.
The value of the spatial variability of an area depends on the weather that is related with the climate
and the orography of the terrain. A study developed by (Gueymard & Wilcox, 2011; Aron Habte et al.,
2020) about the spatial variability of years of data (1998–2005 and 2017 respectivelly) from the U.S.
showed that variability tends to be higher in coastal areas and in mountainous areas. Furthermore, the
study also reveals that in locations of significant variability, most of the variability occurs over short
distances. In these locations, complementary information, as spatio-temporal mean annual variability
metrics, helps to evaluate the adequacy of the use of measurements from a location some distance
away.

Solar radiation products for end users
Page 32 of 56
Figure 10. Spatial variability in DNI (left) and GTI (right) over continental United States in terms of COV.
(Gueymard & Wilcox, 2011)
The recommended features for the solar radiation variability for this application are the following:
Solar radiation variables for the variability assessment: DNI and GHI.
Time resolution: annual.
Spatial resolution: 5 km.
Period of records: >10 years.
B. Feasibility
In the feasibility stage, an annual dataset of DNI values, or Typical Solar Years (TSYs) (Lara-Fanego et
al., 2016), is developed through a long-term dataset of measurements or modelled data. This dataset
should statistically represent the solar resource behavior at the selected site, and therefore the
temporal variability of the site. The inter-annual variability of the location can help to evaluate how
long the reference dataset should be recommended, although a dataset as long as possible is desirable,
in general, a minimum of 10 years is commonly accepted. So, the inter-annual variability is used to
evaluate the uncertainty of the RSY dataset and, as a consequence, the representative annual
production of the plant. On the other hand, when a long-term dataset is not available on-site, temporal
variability at higher resolutions (monthly and daily) is also required to produce DNI long-term series
(multiyears).
The recommended features for the solar radiation variability for this application are the following:
Solar radiation variables for the variability assessment: DNI.
Time resolution: annual.
Spatial resolution: on site data.
Period of records: >10 years.
C. Due diligence
In this stage, in addition to the dataset of the most representative scenario of DNI, other datasets that
represent different probabilistic scenarios are evaluated. These scenarios account for extreme
situations in order to evaluate the investment risks. These scenarios should statistically consider the

Solar radiation products for end users
Page 33 of 56
annual and the monthly variability of the long-term dataset. So, a statistical analysis of the annual
values of a long-term dataset is required to estimate the annual DNI value of each scenario and
monthly variability metrics are used for the generation of the dataset. With the assessment of the
production of the CSP plant through these series, a similar statistical behaviour between the resource
and the production is assumed. An alternative method to statistically characterize the production of
the plant is the generation of multiple annual datasets, multiyear or plausible meteorological annual
data series (Larrañeta et al., 2019) that statistically represent the resource of the site. These annual
data series should include the interannual variability of the DNI and for their generation monthly and
daily variability metrics should also be considered.
The recommended features for the solar radiation variability for this application are the following:
Solar radiation variables for the variability assessment: DNI.
Time resolution: hourly.
Spatial resolution: on site data.
Period of records: >10 years.
D. Acceptance
No relevant application.
E. System or plant operation
No relevant application.
F. Grid operators
As the variability or ramping nowcast/forecast is needed by the grid operator, spatial and temporal
solar resource variability assessment for operation programming according to capacity availability
planning is required.
The recommended features for the solar radiation variability for this application are the following:
Solar radiation variables for the variability assessment: DNI.
Time resolution: minutely.
Spatial resolution: 15 km.
G. Policy making
The availability of free information about the monthly and annual radiation variability of a country
helps to know its solar potential. In the case of CSP, this knowledge is useful to promote suitable
technology in each area and maximize DNI exploitation. The monthly variability is also useful for
determining the most probable production of CSP plants during the year, helping to plan the net
balance through promotion of other technologies. To achieve these goals, the development of
regulation that considers the features (spatial and temporal variability) of the resource and the
technology is also required.
The recommended features for the solar radiation variability for this application are the following:
Solar radiation variables for the variability assessment: DNI.

Solar radiation products for end users
Page 34 of 56
Time resolution: monthly (minimum).
Spatial resolution: 5 km.
Period of records: >10 years.
H. Education
For the development of an adequate policy that promotes the use of CSP technologies, the training of
policy makers in solar resource is fundamental. DNI is variable in time and space. Knowledge of DNI
features is recommended for its exploitation. The understanding of GIS layers or annual DNI maps help
to know the spatial variability of a region or a country. Moreover, the training on the assessment of
spatio-temporal daily variability of an area is also recommended.
The recommended features for the solar radiation variability for this application are the following:
Solar radiation variables for the variability assessment: DNI.
Time resolution: annual.
Spatial resolution: 5 km.
Period of records: >10 years.

Solar radiation products for end users
Page 35 of 56
6 LOW LEVEL ATTENUATION AND SUNSHAPE
Main author: K.P. Nielsen
Low-level attenuation and sunshape are two factors strongly related with the atmospheric
components in the path between the Sun and the solar collector or the solar system. The atmospheric
components are not homogeneously distributed in the sun path, and thus, they various solar
technologies in different ways. In the case of solar thermal electricity two main parts in the solar path
can be identified: the part between the top of the atmosphere (TOA) and the solar reflector; and the
part between the solar reflector and the solar receiver. As the distance between the solar reflector
and the solar receiver increases the the low-level attenuation also increases in the system. Therefore
solar tower systems are strongly affected by low-level attenuation.
Low level attenuation is an important factor for the performance of central receiver concentrating
solar power plants. The low-level attenuation affects the transmittance from the focusing mirrors (the
heliostats) to the central receiver. It can occur either due to fog, water vapor or low-level aerosols.
Aerosol particles are solid and liquid particles in the atmosphere that are not clouds or precipitation.
Low level attenuation can vary independently from the overall atmospheric aerosol attenuation and
therefore need to be assessed at the location.
A portion of the direct normal irradiance (DNI) that is scattered as it passes through the atmosphere is
scattered into the forward direction and is included in the DNI as measured by pyrheliometer. These
have a field of view of ≈5° and DNI measurements during cloud-free conditions include irradiance from
this scattered DNI depending on AM and AOD. The solar beam does not only go in a straight line but
covers an angular range around the direction of the sun. This circumsolar irradiance initially occurs
since the sun disk covers an angular range and can be exacerbated by aerosols and thin ice (cirrus)
clouds. The angular distribution of solar radiance around the sun disk is called the sunshape.
While the sunlight coming directly from the solar disk can be concentrated very efficiently by large
scale solar thermal electric facilities, systems with high concentration can only partly use this
circumsolar radiation. As different solar concentrating designs can utilize the circumsolar radiation
differently and as the collector efficiency varies continuously with the angular distance from the sun
center, it is important to characterize and understand the sunshape in order to accurately assess the
solar potential of a given site. The sunshape can be roughly described with scalar parameters as the
circumsolar ratio and the circumsolar contribution (the contribution of the circumsolar irradiance to
DNI for specific angular intervals). The effect of the sunshape on the plant performance is most
relevant for highly concentrating systems.

Solar radiation products for end users
Page 36 of 56
PRODUCTS AND SERVICES IN THE CATEGORY
13. Low level attenuation measurements and characterization.
14. Sunshape measurement and characterization
RELEVANT FEATURES
The relevant features for the low-level attenuation and sunshape characterization in the field of solar
energy are:
1. Input parameter for calculation. 2. Type of measurements. 3. Time resolution. 4. Period of time.
PROJECT STAGES AND END USERS
A. Prefeasibility
At the prefeasibility stage, the low-level attenuation is difficult to assess. Current satellite and
reanalysis products have rather crude assumptions of how the aerosols vary as a function of height
and are not recommended as data sources for assessing the low-level attenuation. Assessments of the
overall atmospheric aerosol optical depth (AOD) and the variability of this can be used as an indication:
If the AOD and the variability of this are both low, the low-level attenuation will also be low.
The sunshape under cloudless conditions can be assessed from knowledge of the aerosol optical
properties, but this is not easily obtainable. Measurement methods have been developed to determine
the sunshape and the circumsolar contribution, and commercial all-weather systems are available on
the market. There are expensive Sun and Aureole Measurement Systems (SAM) and prototypes of
sunshape cameras. Pyrheliometers with different aperture angles and Rotating Shadowband
Irradiometer based methods are commercially available to measure the circumsolar contribution.
Assessment of the overall atmospheric aerosol optical depth (AOD) and the variability of this can be
used as an indication: If the AOD is low, the aerosol-related broadening of the sunshape will also be
low. Thin ice clouds also affect the sunshape. Information on the frequency of thin ice clouds can be
found for instance in the auxiliary data provided from the CAMS Solar Radiation Service
(http://solar.atmosphere.copernicus.eu).
The recommended features for the low-level attenuation and sunshape characterization for this
application are the following:
Input parameter for calculation: DNI, AOD, visibility.
Time resolution: daily.
Period of time: long term.

Solar radiation products for end users
Page 37 of 56
B. Feasibility
For the feasibility phase more detailed information on the low-level attenuation should be collected.
The clear sky DNI can be used as an indicator of the expected extinction by translating the clear sky
transmittance of the total atmosphere to the low level extinction under the assumption of a certain
aerosol height profile (Hanrieder et al., 2016). If the resulting low-level attenuation is low, the
assumption of the aerosol height distribution has a low influence, and the estimated low-level
attenuation is sufficient for the yield analysis. Higher estimated attenuation levels indicate that an on-
site measurement campaign is required. Such measurements are possible with different techniques as
summarized by (Hanrieder et al., 2017) of which at least three are commercially available. If nearby
visibility measurements are available these give information on the low level attenuation can be used
(Hanrieder et al., 2017; Mishra et al., 2020). A minimum of one year of data should be collected to
ensure that the data represents all seasonal variations. High relative humidity conditions enhance the
attenuation of many types of aerosols, which affects the low-level attenuation. Therefore, sites with
lower relative humidity are often preferable. In deserts with abundant dust aerosols lower wind speeds
are also preferable.
If estimations from the pre-feasibility phase do not clearly indicated narrow sunshapes, measurements
should be carried out. The above-mentioned measurement systems can be established at few selected
sites to characterize the solar resource. Sunshape measurements from similar climates and nearby
sites should also be considered (Bendt et al., 1979).
Depending on the result of the sunshape and attenuation analysis a choice can be made either to have
a single very tall central tower surrounded be an extended area of heliostats, more than one tower
with smaller areas of heliostats around them or another CSP technology that is less affected by the
sunshape and the attenuation, e.g., parabolic troughs.
The recommended features for the low-level attenuation and sunshape characterization for this
application are the following:
Input parameter for calculation: DNI, AOD, visibility.
Time resolution: daily.
Period of time: long term.
C. Due diligence
Accurate estimates of the solar resource must be used to assess the costs and benefits of the regional
solar data center. Without accounting for the low-level attenuation and sunshape characterization,
errors in estimations of the solar potential can be made. To secure financing, realistic estimates of the
low-level attenuation must be made, or it must be ruled out that low level attenuation will be an issue
of significance overestimation of solar potential.
The recommended features for the low-level attenuation and sunshape characterization for this
application are the following:
Input parameter for calculation: AOD, visibility.
Time resolution: hourly.
Period of time: one year.

Solar radiation products for end users
Page 38 of 56
D. Acceptance
Data should be collected at the sites and should be certified by an expert. Here data constitute visibility
or/and direct measurements of the low-level attenuation. As for the general irradiance data, this
includes review of calibration data and maintenance logs.
If the previous project phases do not clearly indicate narrow sunshapes, sunshape measurements
should be performed at the site or a nearby location. The effect of sunshape on the available DNI
available resource should be estimated. For sites with low cloud impact and rather low aerosol load,
estimates of the sunshape using models that incorporate AOD values from ground-based AOD
instruments or satellite measurements could be used. It is also possible to estimate AOD from clear
sky high-quality DNI measurements. Data should be collected at candidate sites or nearby locations
and should be certified by an expert. In any case it must be assured that low AOD conditions are
present during the acceptance tests if no sunshape measurements are carried out. Furthermore, data
collected during cloud passages of thin clouds cannot be evaluated unless sunshape measurements
are present. As with irradiance data in general, this includes review of calibration data and
maintenance logs.
Furthermore, the effects of a volcanic eruption of the scale of the 1991 Pinatubo eruption on the
sunshape should be accounted for. How would this affect the plant yield?
The recommended features for the low-level attenuation and sunshape characterization for this
application are the following:
Input parameter for calculation: DNI, AOD, visibility.
Time resolution: minutely.
Period of time: period of testing.
E. System or plant operation
The low-level attenuation measurements should be continued while the plant is operational. These
data are important for evaluating the plant performance if a noticeable effect is expected from the
previous analyses.
The sunshape measurements should be continued while the plant is operational if a noticeable effect
is expected from the previous analyses. These data are important for evaluating the plant
performance. For instance, plant performance estimates need accurate measurements of the amount
DNI irradiance that can be concentrated.
The recommended features for the low-level attenuation and sunshape characterization for this
application are the following:
Input parameter for calculation: DNI, AOD, visibility.
Time resolution: minutely.
Period of time: real time.
F. Grid operator
No relevant application.

Solar radiation products for end users
Page 39 of 56
G. Policy making
Low-level attenuation and sunshape characterization is an important factor for building a bankable
dataset. Policy makers should ensure that these types are data are being gathered at a number of
locations so that there can be expertise in these kinds of measurements and developers can
understand how these measurements affect the predicted performance of the system.
The further development of instruments that can accurately measure the sunshape should be
encouraged. For near-future scenarios with high grid penetration of solar and other types of renewable
energies, the effects of major volcanic eruptions with a 100 year return rate on the sunshape should
be considered.
The recommended features for the low-level attenuation and sunshape characterization for this
application are the following:
Input parameter for calculation: DNI.
Time resolution: daily.
Period of time: long term.
H. Education
Optics and radiative transfer are the basic science disciplines that can be used to theoretically describe
how the solar beam is attenuated and scattered around its primary direction. Here in particular the
optics of aerosols is important to study.
Students should make themselves familiar with theoretical optics and radiative transfer. Textbooks
such as “Principles of Optics” (Born & Wolf, 2000) and “Radiative Transfer in the Atmosphere and
Ocean” (Thomas & Stamnes, 1999) can be recommended. The libRadtran GNU software library of
radiative transfer algorithms can also be recommended (Mayer & Kylling, 2005). On the practical side,
students should study solar radiometry and spectroscopy. A good textbook on this topic is “Solar and
infrared radiation measurements”(Vignola et al., 2019).
The recommended features for the low-level attenuation and sunshape characterization for this
application are the following:
Input parameter for calculation: DNI, AOD, visibility.
Time resolution: daily.
Period of time: long term.

Solar radiation products for end users
Page 40 of 56
7 SOLAR RADIATION FORECASTING AND NOWCASTING
Main author: M. Schroedter
CSP is dominated by large power plants, resulting in needs for forecasting at the site of the power plant
(Schroedter-Homscheidt & Wilbert, 2017). Therefore, a point forecast for the power plant location is
needed. The power plant operator may need as well as spatially resolved forecast inside the solar field
of a power plant. The grid operator may need a number of forecasts for all CSP power plants inside the
grid operation zone (e.g. a region, a country, a multi-country area).
In general, several forecast horizons are needed – from nowcasting of the upcoming minutes to hours
up to forecasting of today or the upcoming 10 days.
Even when some different methodologies are used commonly for its ensemble in an unique prediction,
the basis of the weather forecasting is the use of numerical weather prediction (NWP) models (Perez
et al., 2011).
Figure 11. Techniques suitable for different forecasting’s horizon and spatial resolution.
(L. Ramírez & Vindel, 2016)
PRODUCTS AND SERVICES IN THE CATEGORY
15. Solar Radiation Forecasts in different time horizons
RELEVANT FEATURES
1. Temporal resolution
DNI values in NWP forecasts represent an accumulated value over a certain time interval. The temporal
resolution defines the length of these intervals. In camera- and satellite-based forecasts both can be
available – accumulated values or instantaneous radiation values for a certain point in time.
For wind speed NWP models provide instantaneous value at the reported time which is typically
validated against observations providing the mean of the last 10 minutes before the reported time.
Furthermore, NWP models provide maximum winds over a defined period (e.g. 1h, 6h, or 12h) and

Solar radiation products for end users
Page 41 of 56
provide wind gusts as maximum value during the previous period. Based on ensemble forecasts, also
the probability to exceed 15 or 20 m/s wind gusts is available as well and may serve as useful to predict
potential storm damage.
2. Forecasting horizon
The forecast horizon is the number of minutes, hours, or days up to which a forecasting system delivers
forecasts.
3. Refresh time
This is defined as the frequency the forecast system is started again and the forecasted values are
updated. It may be several hours in NWP-based forecasts and less than a minute for nowcasts.
4. Spatial resolution
From one single point for the power plant to the spatially resolved DNI inside the solar field on sub-
field sector level.
5. Variables
DNI, wind gust, air temperature, uncertainty ranges, circumsolar ratio/sun shape, expected variability,
aerosol load in the boundary layer.
PROJECT STAGES AND END USERS
A. Prefeasibility
No relevant application.
B. Feasibility
In case of a day ahead market with flexible and/or market-oriented tariffs, forecast data is requested
in the feasibility study to quantify the value of the market participation in the economic feasibility
calculation with respect to local forecast quality. In this case, historical forecasts of a previous year will
be used.
Requirements from the section System or Plant Operation apply as far as they are marked as minimum
or recommended requirements for the day-ahead market participation.
The relevant features for the solar radiation forecasting and nowcasting for this application are the
following:
Temporal resolution: hourly.
Forecasting horizon: one day ahead.
Refresh time: daily.
Spatial resolution: nearest NWP grid point to the center of the power plant solar field.
Variables: DNI, uncertainty ranges, expected variability.
Solar radiation products for end users
Page 42 of 56
C. Due diligence
Forecasting may be needed if the participation in day ahead markets is defined as part of the due
diligence procedure.
Requirements from the section System or Plant Operation apply as far as they are marked as minimum
or recommended requirements for the day-ahead market participation.
The relevant features for the solar radiation forecasting and nowcasting for this application are the
following:
Temporal resolution: hourly.
Forecasting horizon: one day ahead.
Refresh time: daily.
Spatial resolution: nearest NWP grid point to the center of the power plant solar field.
Variables: DNI, uncertainty ranges, expected variability.
D. Acceptance
Forecasting may be needed if the participation in day ahead markets is defined as part of the
acceptance procedure.
Requirements from the section System or Plant Operation apply as far as they are marked as minimum
or recommended requirements for the day-ahead market participation.
The relevant features for the solar radiation forecasting and nowcasting for this application are the
following:
Temporal resolution: hourly.
Forecasting horizon: one day ahead.
Refresh time: daily.
Spatial resolution: nearest NWP grid point to the center of the power plant solar field.
Variables: DNI, uncertainty ranges, expected variability.
E. System or plant operation
There are several aspects in power plant operations which require meteorological forecasts. The
following use cases are described separately:
Controlling actual operations
The relevant features for the solar radiation forecasting and nowcasting for this application are the
following:
● Temporal resolution: 1 sec to 1 min.
● Forecasting horizon: camera and satellite-based nowcasting for the next 15 minutes (for a site
with very low occurrence of clouds and mainly completely clear skies a camera system might
not be needed).
● Refresh time: every 6 or 3 hours.

Solar radiation products for end users
Page 43 of 56
● Spatial resolution: spatially resolved DNI inside the solar field on sub-field sector level.
● Variables: DNI, wind gust, air temperature.
Planning actual operations
The relevant features for the solar radiation forecasting and nowcasting for this application are the
following:
● Temporal resolution: 1 to 10 min.
● Forecasting horizon: satellite-based nowcasting up to 6 hours.
● Refresh time: every 1 to 3 hours is recommended.
● Spatial resolution: spatially resolved DNI inside the solar field on sub-field sector level.
● Variables: DNI, uncertainty ranges, expected variability, wind gust, air temperature.
Planning maintenance
The relevant features for the solar radiation forecasting and nowcasting for this application are the
following:
● Temporal resolution: hourly or 3-hourly.
● Forecasting horizon: NWP-based medium term forecasts the next 10 days.
● Refresh time: every 6 or 3 hours.
● Spatial resolution: nearest NWP grid point to the center of the power plant solar field.
● Variables: DNI, wind gust, air temperature.
F. Grid operator
Participating in an intra-day market
The relevant features for the solar radiation forecasting and nowcasting for this application are the
following:
● Temporal resolution: 15 to 60 min (depending on market).
● Forecasting horizon: in addition, NWP-based short-term forecasts for the remaining part of
today.
● Refresh time: updated every 1 to 3 hours is recommended.
● Spatial resolution: point forecast for the center of the power plant solar field.
● Variables: DNI, uncertainty ranges, expected variability.
Participating in a day-ahead market
The relevant features for the solar radiation forecasting and nowcasting for this application are the
following:
● Temporal resolution: 15 to 60 min (depending on market).
● Forecasting horizon: NWP-based short-term forecasts for the upcoming day.
● Refresh time: updated every 6 or 3 hours.
● Spatial resolution: point forecast for the center of the power plant solar field.
● Variables: DNI, uncertainty ranges, expected variability.

Solar radiation products for end users
Page 44 of 56
G. Policy making
In case of a day ahead market with flexible and/or market-oriented tariffs, forecast data is requested
in the policy development phase to quantify the value of the market participation in the economic
feasibility calculation with respect to local forecast quality. In this case, historical forecasts of a
previous year will be used. The use of climatologies is not recommended as such a dataset does not
include the information how well the radiation and therefore solar production is predicted. This is of
relevance if assessing the market value of solar production in markets not providing any fixed feed-in
tariff.
The relevant features for the solar radiation forecasting and nowcasting for this application are the
following:
● Temporal resolution: 15 to 60 min (depending on market).
● Forecasting horizon: NWP-based short-term forecasts for the upcoming day.
● Refresh time: updated every 6 or 3 hours.
● Spatial resolution: point forecast for the center of the power plant solar field.
● Variables: DNI, uncertainty ranges, expected variability.
H. Education
In case of e.g. grid integration studies in the training sector, forecast data is requested to quantify the
value of the market participation in the economic feasibility calculation with respect to local forecast
quality. In this case, historical forecasts of a previous year will be used.
The relevant features for the solar radiation forecasting and nowcasting for this application are the
following:
● Temporal resolution: 15 to 60 min (depending on market).
● Forecasting horizon: NWP-based short-term forecasts for the upcoming day.
● Refresh time: updated every 6 or 3 hours.
● Spatial resolution: point forecast for the center of the power plant solar field.
● Variables: DNI, uncertainty ranges, expected variability.

Solar radiation products for end users
Page 45 of 56
8 CHARACTERIZATION AND CALIBRATION OF SOLAR RADIATION SENSORS
Main author: F. Vignola
There are two principal types of instruments that measure the incident solar radiation, the
pyrheliometer to measure the direct normal irradiance2 (DNI) and the pyranometer to measure the
global horizontal irradiance (GHI) and the diffuse horizontal irradiance (DfHI). There are many
manufacturers of each type of instrument and there are several novel instruments that measure all
three components at once. In addition, there are instruments that measure the circumsolar irradiance
(scattered light surrounding the solar disk) and spectroradiometers that measure the spectral
distribution of incident DNI, GHI, DfHI, and ground reflected irradiance. Spectroradiometers and other
specialized instruments such as ultraviolet sensors and pyrgeometers that measure long-wavelength
radiation will not be discussed here. For a more thorough treatment of instruments that measure solar
radiation see (Vignola et al., 2019).
Discussion will start with pyrheliometers that measure DNI irradiance, followed by a discussion of
instruments being tested that measure the circumsolar irradiance and then pyranometers are
reviewed. Multifaceted pyranometers that produce all three irradiance values will then be covered.
Not covered are spectroradiometers that monitor the spectral distribution on the incident radiation.
Instead of measuring the total or broadband incident solar radiation, spectroradiometers measure the
spectral composition of the incident solar radiation.
PRODUCTS AND SERVICES IN THE CATEGORY
16. Calibration of pyrheliometer
Pyrheliometers consist of a tube with an aperture at one end of the tube and the sensor is at the other
end of the tube. They have baffles to limit the field of view to the solar disk and a small area around
the disk and are similar in appearance to small telescopes. Common pyrheliometers have a field of
view that range from about 5.0° to 5.7° degrees with a 5.0° field of view now becoming standard.
There are three types of pyrheliometers, and their performance will be compared and contrasted.
Absolute Cavity Radiometers:
Thermopile-based pyrheliometers:
Photodiode-based pyrheliometer:
Calibration of a pyrheliometer is done by comparing the output of the instrument under clear stable
atmospheric conditions against the output of an absolute cavity radiometer that has its calibration
traceable to the World Radiometric Reference (WRR). Alternatively, the instrument can be calibrated
against another pyrheliometer of the same type that has its calibration traceable to the WRR (ASTM
E816-05, 2015; ISO 9847:1992, 1992).
2 The term beam normal irradiance (BNI) is being used more frequently to avoid confusion with direct and diffuse, especially when the components are on horizontal or tilted surface
Solar radiation products for end users
Page 46 of 56
The uncertainties determined for the instruments in this section are obtained using the Guide to the
Expression of Uncertainty in Measurements (JCGM, 2008). Pyrheliometers are classified into types to
help differentiate the uncertainties in irradiance measurements from these instruments.
17. Calibration of field pyranometers
There are three distinct methods for calibrating pyranometers:
Shade/unshade calibration: The most accurate method is the shade/unshade method. The DNI
irradiance is calculated by subtracting the unshaded measurement from the shaded
measurement and projecting this difference equal to the angle of incidence.
Summation method: The second method is to calculate the reference GHI from the
combination of DNI projected onto a horizontal surface plus the measured DfHI irradiance
(ASTM, 2015; ISO 9847:1992, 1992).
Side by side calibration: The third method is method is a side by side comparison with a
reference pyranometer that has its calibration traceable to the WRR (ISO 9847:1992, 1992).
The percent uncertainties given for pyranometer are for a limited range of incident angles, typically
from 30° to 60°. Therefore, under clear skies when the solar zenith angle is greater than 60° or less
than 30° systematic biases in the data can be greater than the stated uncertainty. This is particularly
true during the winter months when the latitude is 40° or more from the equator (Wilcox & Myers,
2008). During the middle of winter at these high latitudes, the SZA is always larger than 63° and this is
outside the range specified for the pyranometer uncertainty (see Figures 6.a and 6.b).
18. Calibration of RSBR
Rotating Shadowband Irradiometer (RSI) and SPN1 Sunshine Pyranometers are two instruments that
determine all three irradiance component, GHI, DfHI, and DNI irradiance, simultaneously and are often
used in regions with where little maintenance is available. The generic name for these instruments is
a rotating shadowband irradiometer (RSI), however some use the term Rotating Shadow Band
Radiometer (RSBR) because irradiometers typically refer to instruments measuring infrared radiation.
A brief description of these instruments is given along with a discussion of the strengths and
weaknesses of each type.
There are two types of RSI instruments. One uses a thermopile-based pyranometer and the other uses
a photodiode-based pyranometer. In general, the RSBR measures GHI and then periodically a shadow
band rotates in front of the pyranometer to measure the DfHI irradiance. The direct horizontal
irradiance (DrHI) is calculated by subtracting the DfHI from the GHI and the DNI is determined by
projecting the DrHI onto the normal surface.
Both instruments require adjustment algorithms to remove systematic effects associated with the
problems of the pyranometer used to measure the irradiance (Vignola et al., 2016; Vuilleumier et al.,
2017).
Several methods have been used to calibrate RSI instruments. Calibration methods have to consider
the adjustment methodology used to remove the systematic biases associated with the instrument. A
detailed description on the different methodologies can be found in (Jessen et al., 2016).

Solar radiation products for end users
Page 47 of 56
The algorithms used to remove the bias from the RSI measurements are different for each calibration
methodology. The RSBR instruments are evolving as are the algorithms used to remove the systematic
biases.
RELEVANT FEATURES
1. Deviation from true cosine response, also called Lambertian response.
The flux of energy incident on a surface is proportional to the intensity of the energy from a given
direction multiplied by the cosine of the angle of incidence. This is called Lambert Law. In practice
when one measures the intensity of light on the thermopile, the measurement intensity closely follows
Lambert’s Law, but the match is not perfect. There can be many causes for this deviation from a true
cosine response. These sources of deviation can range from the level of the sensor to the effects of
the light passing through the glass dome(s). All pyranometers exhibit some deviation from the Lambert
Law, especially at large incident angles.
2. Thermal offsets
Thermal offsets are caused by radiative losses from the black disc to the sky with the radiation first
heating the glass dome(s) before being radiated to the sky. The amount of thermal offset is dependent
on the difference between the black disc and the sky temperature. When the sky is cloudy, the sky
temperature is close to ambient temperature and the radiative offset is small. When the sky is clear,
the sky temperature is typically much less than ambient temperature and the thermal offset can range
from a few watt hours/m2 per hour to 10 or even 20 Whr/m2 per hour. Pyranometers that are on tilted
surfaces exhibit smaller thermal offsets because the instrument ‘sees’ some ground that is close to
ambient temperature.
3. Dust or frost on the optics
Pyranometers need to be cleaned periodically otherwise dust can build up on the optics and this
reduces the light reaching the sensor. When a pyranometer is mounted in a ventilator, buildup of dust,
ice, or snow is greatly reduced. This helps maintain the quality of the measurements because dust or
other contaminates reduce the amount of light reaching the sensor. Proper cleaning and maintenance
of the instruments is important for a quality dataset.
4. Change in responsivity over time
Thermopile-based pyranometer have a responsivity that degrades with time. The absorptivity of the
black coating on the sensor disk degrades with exposure to UV radiation. The degradation of the
responsivity can vary between 0.5% and 1.0% per year (see Figs. 5.a and 5.b). Therefore, it is
important to calibrate the instruments every year or two. Since the calibration result typically has an
uncertainty larger than the degradation rate, it is useful to record the change in responsivity and
determine the trend to get a better idea of the calibration value. If the instrument is mounted in a
ventilator, then the calibration should also be done in a ventilator because the ventilator affects the
thermal offset, and this affects the calibration result.
5. Spectral response:
Thermopile pyranometers respond to a wide range of wavelengths and usually have a glass dome that
allows wavelengths up to 2500 nm to pass through without hindrance. Some pyranometers have
special domes that have transmissivity that is approximately constant up to 4000 nm.

Solar radiation products for end users
Page 48 of 56
6. Non-linearity
A perfect pyranometer would have a uniform responsivity over all intensities of light. For the better
pyranometers, this responsivity doesn’t vary more than 0.2% to 0.5% from the responsivity at 500
W/m2 over a range from 100 W/m2 to 1000 W/m2.
7. Temperature dependence
Thermopile-based pyranometers measure the temperature difference between the body of the
pyranometer and the central disk glued to the thermopile. The body of the pyranometer has a large
thermal mass (heat sink) that is minimally affected by the ambient temperature. The current from the
thermopile is a measure of the heat flow from the sensor to the heat sink. However, there are other
paths through which heat can flow such as by radiation and convection and these alternate paths
reduce measured irradiance and the characteristics of the thermopile result in a temperature
dependence of the measured irradiance. Factory specification for the pyranometers usually come with
a plot of responsivity verses temperature and it is possible to adjust the measured value based on the
ambient temperature measurement, but this is rarely done. However, by recording the ambient
temperature along with the GHI or DfHI measurements, it is always possible at some future date to
adjust the measured values for the effect of temperature. The temperature adjustment is also affected
if the pyranometer is mounted in a ventilator that keeps air flowing over the dome to keep dust and/or
frost from settling on the pyranometer dome. Sometimes ventilators warm the air and this affects the
thermal offset and the temperature dependence of the instrument. For example, pyranometers
mounted in ventilators can have smaller thermal offsets, especially if the ventilator uses a high speed
DC fan (Dutton et al., 2001).
PROJECT STAGES AND END USERS
In the case of measurements characterization, the relevant features for calibration sensors are defined
at each calibration standard. Thus, in this case the relevant features for the characterization and
calibration of solar radiation sensors at each project stage are the need of one specific type of
characterization service.
A. Prefeasibility
On site measurements are not required for prefeasibility analysis. This analysis relies main on satellite-
derived irradiance values or previously available measured data.
B. Feasibility
Ground-based measurements augment satellite-derived values in feasibility studies and are useful in
assuring that the values fully characterize the solar resource. Therefore, the instruments should be
calibrated to ensure the data accurately reflects the solar resource. In addition, the calibration helps
identify biases in the ground-based measurements.
Calibration of pyrheliometer: yes.
Calibration of pyranometers: yes.
Calibration of RSI: yes

Solar radiation products for end users
Page 49 of 56
Maintenance: frequent cleaning; alignment checking (frequency depending on site-specific
factors)
C. Due diligence
Calibration of ground-based measurements help reduce the uncertainty in the measurements and
hence provide more confidence in the performance predictions. The relevant features for the
characterization and calibration of solar radiation sensors for this application are the following
Calibration of pyrheliometer: yes.
Calibration of field pyranometers: yes.
Calibration of RSI: yes.
Maintenance: frequent cleaning; alignment checking (frequency depending on site-specific
factors)
D. Acceptance
Calibrated ground-based measurements provide assurance that the performance and predicted
performance match. It is best practice to calibrate the radiometers at the beginning and end of their
use in the field. That helps ensure that problems have not cropped up in the instrument. The relevant
features for the characterization and calibration of solar radiation sensors for this application are the
following:
Calibration of pyrheliometer: yes.
Calibration of field pyranometers: yes.
Calibration of RSI: yes.
Maintenance: frequent cleaning; alignment checking (frequency depending on site-specific
factors)
E. System or plant operation
Ground-based solar irradiance measurement, especially those that aide in forecasts are used to
determine the operation mode of the facility and check on the plant performance. The relevant
features for the characterization and calibration of solar radiation sensors for this application are the
following
Field calibration of pyrheliometer: Every two years.
Field calibration of pyranometers: Every two years.
Field calibration of RSI: Every two years.
Maintenance: frequent cleaning; alignment checking (frequency depending on site-specific
factors)
F. Grid operator
Ground-based measurements are useful in forecasting facility production and therefore are
important for grid operators.

Solar radiation products for end users
Page 50 of 56
G. Policy making
Not relevant as long as satellite-derived data have been validated and any biases well characterized.
H. Education
Calibrations are useful for training and understanding the solar resource and for research. Site
specific measurements are not needed for this and calibrations of teaching instruments can be
conducted every few years.

Solar radiation products for end users
Page 51 of 56
9 FUTURE WORKS
Since both the user needs and the solutions provided by the scientific community and product
developers will certainly evolve in the near future, so must do this document and the associated web
page.
Just to mention some examples, it is expected that there will be new developments in the following
fields:
Long-term representative series. The most usual practice today is to use TMY and PoE series
for feasibility analysis or due diligence, but the availability of longer data periods (measured
or modeled) and the development of multiyear approaches based on synthetically generated
series will likely change the way these tasks are performed today.
Characterization of low-level attenuation and sunshape. Although these topics have gained
the attention of researchers during the last years and some project developers have
incorporated their assessment in some commercial projects (mainly based on the tower
technology) there is still a long way to go until this becomes a common practice.
Forecasting. There is a clear need for more accurate forecasts in all time horizons, form the
long-term where the effect of climate change on the solar resource needs to be assessed to
the very short term or nowcasting, necessary to optimize plant and grid operations.
It is the intention of the authors to promote a frequent update of the project information with the help
and feedback of users and product developers, so that the end users can easily find useful, practical
and up-to-date information in the project web page.

Solar radiation products for end users
Page 52 of 56
REFERENCES
ASTM. (2015). ASTM G167 - 15 Standard Test Method for Calibration of a Pyranometer Using a Pyrheliometer. https://www.astm.org/Standards/G167.htm
ASTM E816-05. (2015). Standard test method for calibration of pyrheliometers by comparison to reference pyrheliometers. In ASTM: Vol. ASTM E816- (Issue Reapproved). https://doi.org/10.1520/E0816-15.1
Bendt, P., Rabl, A., Gaul, H. W., & Reed, K. A. (1979). Optical analysis and optimization of line focus solar collectors. In SERI/TR-34-09. Solar Energy Research Institute. http://citeseerx.ist.psu.edu/viewdoc/download?doi=10.1.1.129.5191&rep=rep1&type=pdf
Boilley, A., & Wald, L. (2015). Comparison between meteorological re-analyses from ERA-Interim and MERRA and measurements of daily solar irradiation at surface. Renewable Energy, 75, 135–143. https://doi.org/10.1016/j.renene.2014.09.042
Born, M., & Wolf, E. (2000). Principles of Optics, 7th (expanded) edition, Cambridge University Press, Cambridge, 1999. In Optics & Laser Technology (Vol. 32, Issue 5).
Broesamle, H., Mannstein, H., Schillings, C., & Trieb, F. (2001). Assessment of solar electricity potentials in North Africa based on satellite data and a geographic information system. Solar Energy, 70(1), 1–12. https://doi.org/10.1016/S0038-092X(00)00126-2
Diabaté, L., Moussu, G., & Wald, L. (1989). Description of an operational tool for determining global solar radiation at ground using geostationary satellite images. Solar Energy, 42(3), 201–207. https://doi.org/10.1016/0038-092X(89)90012-1
Dutton, E. G., Michalsky, J. J., Stoffel, T., Forgan, B. W., Hickey, J., Nelson, D. W., Alberta, T. L., & Reda, I. (2001). Measurement of the broadband diffuse solar irradiance using current commercial instrumentation with a correction for thermal offset errors. Journal of Atmospheric and Oceanic Technology, 18(3), 297–314. https://doi.org/10.1175/1520-0426(2001)018<0297:MOBDSI>2.0.CO;2
Fernández-Peruchena, C. M., Vignola, F., Gastón, M., Lara-Fanego, V., Ramírez, L., Zarzalejo, L., Silva, M., Pavón, M., Moreno, S., Bermejo, D., Pulgar, J., Macias, S., & Valenzuela, R. X. (2018). Probabilistic assessment of concentrated solar power plants yield: The EVA methodology. Renewable and Sustainable Energy Reviews, 91, 802–811. https://doi.org/10.1016/j.rser.2018.03.018
Gelaro, R., McCarty, W., Suárez, M. J., Todling, R., Molod, A., Takacs, L., Randles, C. A., Darmenov, A., Bosilovich, M. G., Reichle, R., Wargan, K., Coy, L., Cullather, R., Draper, C., Akella, S., Buchard, V., Conaty, A., da Silva, A. M., Gu, W., … Zhao, B. (2017). The Modern-Era Retrospective Analysis for Research and Applications, Version 2 (MERRA-2). Journal of Climate, 30(14), 5419–5454. https://doi.org/10.1175/JCLI-D-16-0758.1
Gueymard, C. A., & Wilcox, S. M. (2011). Assessment of spatial and temporal variability in the US solar resource from radiometric measurements and predictions from models using ground-based or satellite data. Solar Energy, 85(5), 1068–1084. https://doi.org/10.1016/j.solener.2011.02.030
Habte, A, Lopez, A., Sengupta, M., & Wilcox, S. (2014). Temporal and Spatial Comparison of Gridded TMY, TDY, and TGY Data Sets. In NREL/TP-5D00-60886. National Renewable Energy Laboratory. http://www.nrel.gov/docs/fy14osti/60886.pdf

Solar radiation products for end users
Page 53 of 56
Habte, Aron, Sengupta, M., Gueymard, C., Golnas, A., & Xie, Y. (2020). Long-term spatial and temporal solar resource variability over America using the NSRDB version 3 (1998–2017). Renewable and Sustainable Energy Reviews, 134, 110285. https://doi.org/10.1016/j.rser.2020.110285
Hanrieder, N., Sengupta, M., Xie, Y., Wilbert, S., & Pitz-Paal, R. (2016). Modeling beam attenuation in solar tower plants using common DNI measurements. Solar Energy, 129, 244–255. https://doi.org/10.1016/j.solener.2016.01.051
Hanrieder, N., Wilbert, S., Mancera-Guevara, D., Buck, R., Giuliano, S., & Pitz-Paal, R. (2017). Atmospheric extinction in solar tower plants - A review. Solar Energy. https://doi.org/10.1016/j.solener.2017.01.013
IEC/TS 62862-1-2. (2017). Solar thermal electric plants – Part 1-2: Creation of annual solar radiation data set electric plant simulation for solar thermal.
IEC. (2011). IEC 60050 - International Electrotechnical Vocabulary - Details for IEV number 602-03-15: “spinning reserve of a system.” http://www.electropedia.org/iev/iev.nsf/display?openform&ievref=602-03-15
ISO 9847:1992. (1992). Solar Energy – Calibration of field pyranometers by comparison to a reference pyranometer. In ISO.
JCGM. (2008). Evaluation of measurement data-Guide to the expression of uncertainty in measurement Évaluation des données de mesure-Guide pour l’expression de l’incertitude de mesure. www.bipm.org
Jessen, W., Wilbert, S., Nouri, B., Geuder, N., & Fritz, H. (2016). Calibration methods for rotating shadowband irradiometers and optimizing the calibration duration. Atmospheric Measurement Techniques, 9(4), 1601–1612. https://doi.org/10.5194/amt-9-1601-2016
Lara-Fanego, V., Pulgar, J., Fernández-Peruchena, C. M., Gastón, M., Moreno, S., Ramírez, L., Valenzuela, R. X., Bermejo, D., Silva, M., Pavón, M., Bernardos, A., Zarzalejo, L. F., & Macías, S. (2016). A novel procedure for generating solar irradiance TSYs. SolarPACES Conference.
Larrañeta, M., Fernandez-Peruchena, C., Silva-Pérez, M. A., Lillo-bravo, I., Grantham, A., & Boland, J. (2019). Generation of synthetic solar datasets for risk analysis. Solar Energy, 187, 212–225. https://doi.org/10.1016/j.solener.2019.05.042
Mayer, B., & Kylling, A. (2005). Technical note: The libRadtran software package for radiative transfer calculations - Description and examples of use. In Atmospheric Chemistry and Physics (Vol. 5, Issue 7). https://doi.org/10.5194/acp-5-1855-2005
Mcarthur, L. J. B. (2005). Baseline Surface Radiation Network (BSRN) Operations Manual Version 2.1. In WCRP-121. WMO/TD-No. 1274. World Climate Research Programme. http://bsrn.awi.de/fileadmin/user_upload/bsrn.awi.de/Publications/McArthur.pdf
Mehos, M., Price, H., Cable, R., Kearney, D., Kelly, B., Kolb, G., & Morse, F. (2020). Concentrating Solar Power Best Practices Study. www.nrel.gov/publications.
Mesinger, F., DiMego, G., Kalnay, E., Mitchell, K., Shafran, P. C., Ebisuzaki, W., Jović, D., Woollen, J., Rogers, E., Berbery, E. H., Ek, M. B., Fan, Y., Grumbine, R., Higgins, W., Li, H., Lin, Y., Manikin, G., Parrish, D., & Shi, W. (2006). North American regional reanalysis. Bulletin of the American Meteorological Society, 87(3). https://doi.org/10.1175/BAMS-87-3-343
Meybodi, M. A., Ramirez Santigosa, L., & Beath, A. C. (2017). A study on the impact of time resolution

Solar radiation products for end users
Page 54 of 56
in solar data on the performance modelling of CSP plants. Renewable Energy, 109. https://doi.org/10.1016/j.renene.2017.03.024
Mishra, B. R., Hanrieder, N., Modi, A., & Kedare, S. B. (2020). Comparison of three models to estimate the slant path atmospheric attenuation in central receiver solar thermal plants under Indian climatic conditions. Solar Energy, 211, 1042–1052. https://doi.org/10.1016/j.solener.2020.10.049
Moreno-Tejera, S., Ramírez-Santigosa, L., & Silva-Pérez, M. A. (2015). A proposed methodology for quick assessment of timestamp and quality control results of solar radiation data. Renewable Energy, 78, 531–537. https://doi.org/10.1016/j.renene.2015.01.031
Moreno-Tejera, S., Silva-Pérez, M. A., Lillo-Bravo, I., & Ramírez-Santigosa, L. (2016). Solar resource assessment in Seville, Spain. Statistical characterisation of solar radiation at different time resolutions. Solar Energy, 132, 430–441. https://doi.org/10.1016/j.solener.2016.03.032
Navarro, A. A., Domínguez, P., Ramírez, L., Polo, J., & Zarza, E. (2015). Assessment and validation of exclusion zones for CSP power plants. SolarPACES Conference, 1.
Pagh Nielsen, K., Vignola, F., Ramírez, L., Blanc, P., Meyer, R., & Blanco, M. (2016). Excerpts from the report: " BeyondTMY -Meteorological Data Sets for CSP/STE Performance Simulations ". SolarPACES Conference. https://cms2016.solarpaces-conference.org/file/display_attachment/8255203bdb0683a70c343de296dbfa9?filename=Kristian+Pagh+Nielsen+-+Paper.pdf
Perez, R., Beauharnois, M., Karl Hemker Jr., Kivalov, S., Lorenz, E., Pelland, S., Schlemmer, J., & Knowe, G. Van. (2011). Evaluation of numerical weather prediction solar irradiance forecasts in the US. American Solar Energy Society – Proc. ASES Annual Conference. http://www.asrc.albany.edu/people/faculty/perez/2011/forc.pdf
Perez, R., David, M., Hoff, T. E., Jamaly, M., Kivalov, S., Kleissl, J., Lauret, P., & Perez, M. (2016). Spatial and Temporal Variability of Solar Energy. Foundations and Trends® in Renewable Energy, 1(1), 1–44. https://doi.org/10.1561/2700000006
Ramírez, L., & Vindel, J. M. (2016). Forecasting and nowcasting of DNI for concentrating solar thermal systems. In Advances in Concentrating Solar Thermal Research and Technology (pp. 295–310). Elsevier Inc. https://doi.org/10.1016/B978-0-08-100516-3.00013-7
Ramírez, Lourdes, Barnechea, B., Bernardos, A., Bolinaga, B., Cony, M., Moreno, S., Orive, R., Polo, J., Redondo, C., Salbidegoitia, I. B., Serrano, L., Tovar, J., & Zarzalejo, L. F. (2012). Towards the standardization of procedures for solar radiation data series generation. SolarPACES Conference, 5.
Ramírez, Lourdes, Pagh, K., Vignola, F., Blanco, M., Blanc, P., Meyer, R., & Wilbert. (2017). Road Map for Creation of Advanced Meteorological Data Sets for CSP Performance Simulations. In SolarPACES repository. http://www.solarpaces.org/images/SolarPACES-T5_BeyondTMY_Road_Map.pdf
Schroedter-Homscheidt, M., & Wilbert, S. (2017). Methods to Provide Meteorological Forecasts for Optimum CSP System Operations. In The Performance of Concentrated Solar Power (CSP) Systems: Analysis, Measurement and Assessment (pp. 253–281). Elsevier Inc. https://doi.org/10.1016/B978-0-08-100447-0.00008-0
Sengupta, M., Habte, A., Gueymard, C., Wilbert, S., Renné, D., & Stoffel, T. (2017). Best Practices Handbook for the Collection and Use of Solar Resource Data for Solar Energy Applications. In

Solar radiation products for end users
Page 55 of 56
Technical Report - NREL/TP-5D00-68886 (Issue December). https://doi.org/10.18777/ieashc-task46-2015-0001
Thomas, G. E., & Stamnes, K. (1999). Radiative Transfer in the Atmosphere and Ocean. Cambridge University Press. https://doi.org/10.1017/CBO9780511613470
Vignola, F., Derocher, Z., Peterson, J., Vuilleumier, L., Félix, C., Gröbner, J., & Kouremeti, N. (2016). Effects of changing spectral radiation distribution on the performance of photodiode pyranometers. Solar Energy, 129, 224–235. https://doi.org/10.1016/j.solener.2016.01.047
Vignola, F., Michalsky, J., & Stoffel, T. (2019). Solar and Infrared Radiation Measurements. CRC Press. https://doi.org/10.1201/b22306
Vuilleumier, L., Félix, C., Vignola, F., Blanc, P., Badosa, J., Kazantzidis, A., & Calpini, B. (2017). Performance evaluation of radiation sensors for the solar energy sector. Meteorologische Zeitschrift, 26(5), 485–505. https://doi.org/10.1127/metz/2017/0836
Wilbert, S. (2014). Determination of Circumsolar Radiation and its Effect on Concentrating Solar Power. In PhD Thesis (RWTH-CONV-145307). Faculty of Mechanical Engineering. RWTH Aachen University. http://publications.rwth-aachen.de/record/444996
Wilcox, S. M., & Myers, D. R. (2008). Evaluation of Radiometers in Full-Time Use at the National Renewable Energy Laboratory Solar Radiation Research Laboratory. National Renewable Energy Laboratory (U.S.). https://doi.org/10.2172/946331
WMO. (2008). Measurement of Meteorological Variables. In Guide to Meteorological Instruments and Methods of Observation: Vols. I & II (Issue 8). https://www.wmo.int/pages/prog/gcos/documents/gruanmanuals/CIMO/CIMO_Guide-7th_Edition-2008.pdf