Solar PV Panel Uplift Study - Home - Walter Scott, Jr ...meroney/PapersPDF/CEP09-10-4ppt.pdf · 1...
34
1 1 Solar PV Solar PV Panel Uplift Panel Uplift Study Study Wind Engineering Fluids Laboratory Wind Engineering Fluids Laboratory Robert N. Meroney & David E. Neff Robert N. Meroney & David E. Neff May 2010 May 2010 CWE2010 CWE2010 Durham, NC Durham, NC
Transcript of Solar PV Panel Uplift Study - Home - Walter Scott, Jr ...meroney/PapersPDF/CEP09-10-4ppt.pdf · 1...

11
Solar PV Solar PV
Panel Uplift Panel Uplift
StudyStudy
Wind Engineering Fluids LaboratoryWind Engineering Fluids Laboratory
Robert N. Meroney & David E. NeffRobert N. Meroney & David E. NeffMay 2010May 2010
CWE2010CWE2010
Durham, NCDurham, NC

22
Scope of StudyScope of Study
�� Goals of study were:Goals of study were:�� Investigate the wind performance of clientInvestigate the wind performance of client’’s s
photovoltaic (PV) array systems,photovoltaic (PV) array systems,
�� Formulate new wind resistant design criteria,Formulate new wind resistant design criteria,
�� Evaluate CFD as a design tool for PV Evaluate CFD as a design tool for PV collectors.collectors.
�� Fluid modeling used visualization, Fluid modeling used visualization, pressure and force balance systems.pressure and force balance systems.
�� CFD used the FLUENT 6.0 code.CFD used the FLUENT 6.0 code.
33
Wind Tunnel BalanceWind Tunnel Balance
�� Balance calibrated to measure CBalance calibrated to measure CDD, C, CLL and Cand CMM

44
½½ & Full Scale Model Tiles& Full Scale Model Tiles
Full Scale Tile in MWT ½ Scale Load Test Control Tile
Load Test Control Tile & Model Curb3 x 3 array with Control & Dummy Tiles
55
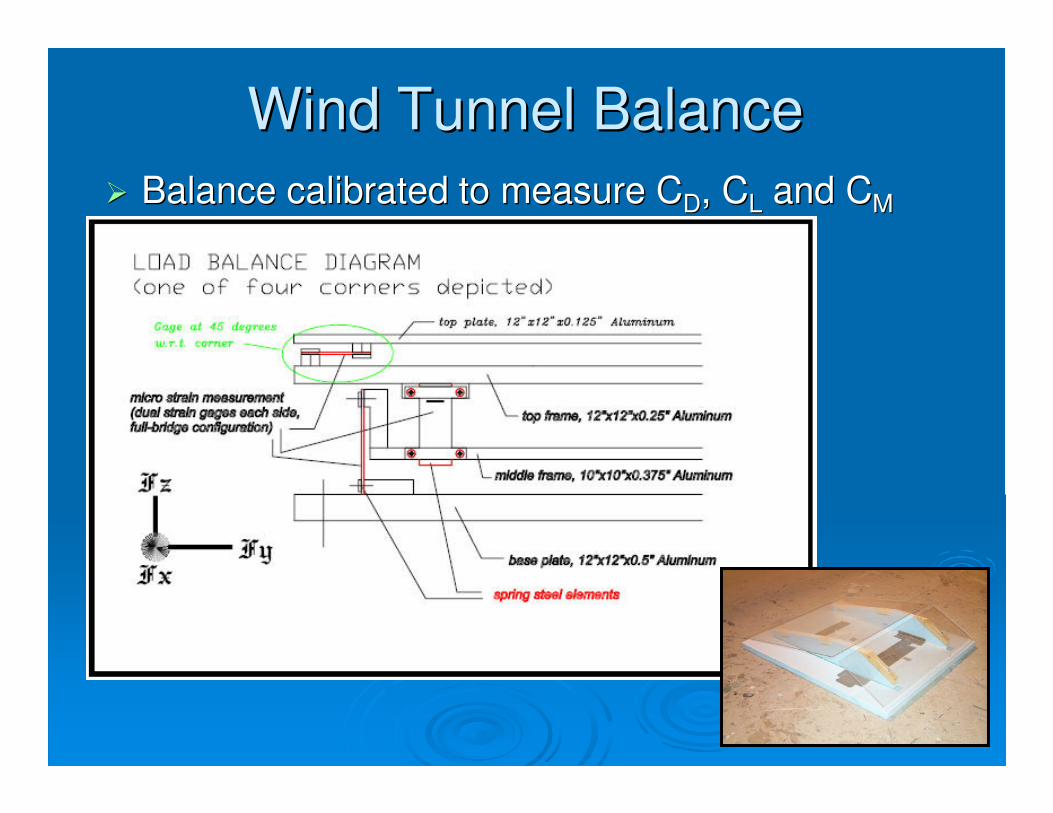
Fluid Modeling MeasurementsFluid Modeling Measurements

66
CFD 2CFD 2--D Boundary D Boundary CondtionsCondtions
�� Domain x=40 feet, y=10 feetDomain x=40 feet, y=10 feet�� Grid: Grid: dx_mindx_min=0.05 feet, =0.05 feet, dx_maxdx_max=0.7 feet=0.7 feet
�� BL on panels: BL on panels: dy_mindy_min=0.005 feet=0.005 feet
�� Grid shape: triangle pavedGrid shape: triangle paved
�� Three panelsThree panels
�� Orientations at 0 and 180 degreesOrientations at 0 and 180 degrees
�� Inlet Velocity, U=10 m/s uniformInlet Velocity, U=10 m/s uniform
�� Inlet Turbulence, I= 15%, L= 1 mInlet Turbulence, I= 15%, L= 1 m
�� Turbulence model: kTurbulence model: k--omega, standard wall omega, standard wall functionsfunctions

77
Inlet Profiles for WT & CFDInlet Profiles for WT & CFD

88
0o Orientation
CFD 2CFD 2--D Grid LayoutD Grid Layout

99
180o Orientation
1010
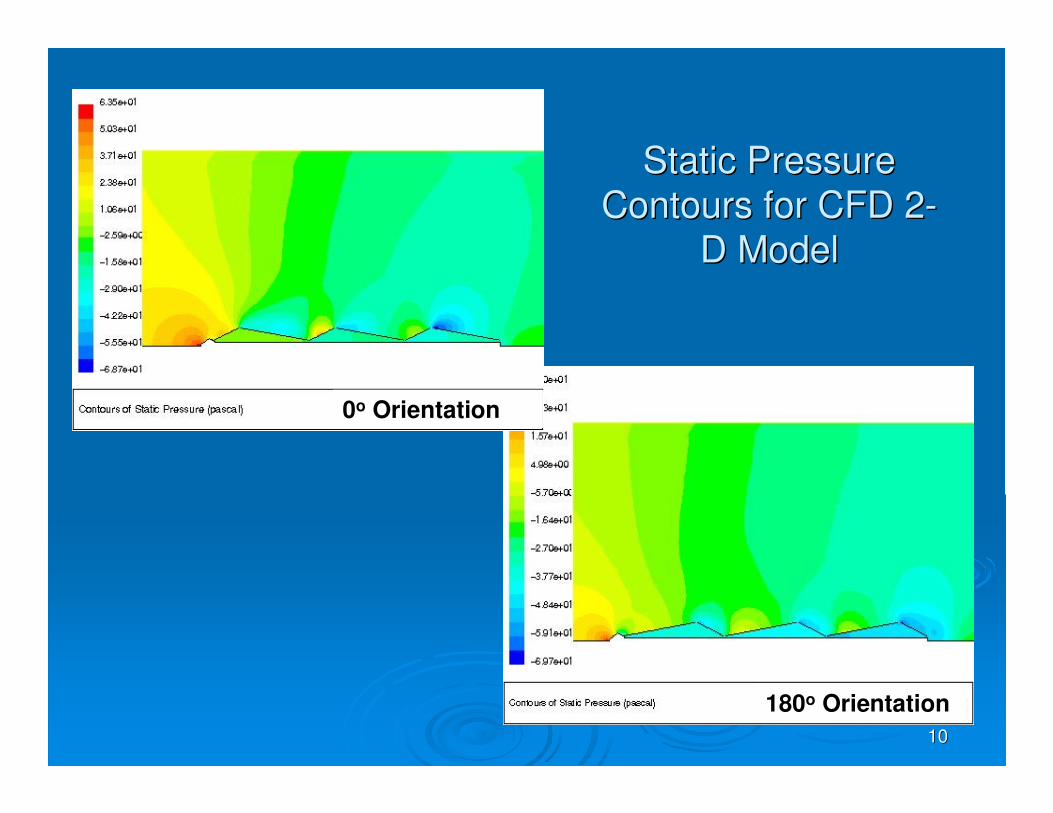
Static Pressure Static Pressure
Contours for CFD 2Contours for CFD 2--
D ModelD Model
0o Orientation
180o Orientation

1111
Velocity Magnitude Velocity Magnitude
Contours for CFD Contours for CFD
22--D ModelD Model
0o Orientation
180o Orientation
1212
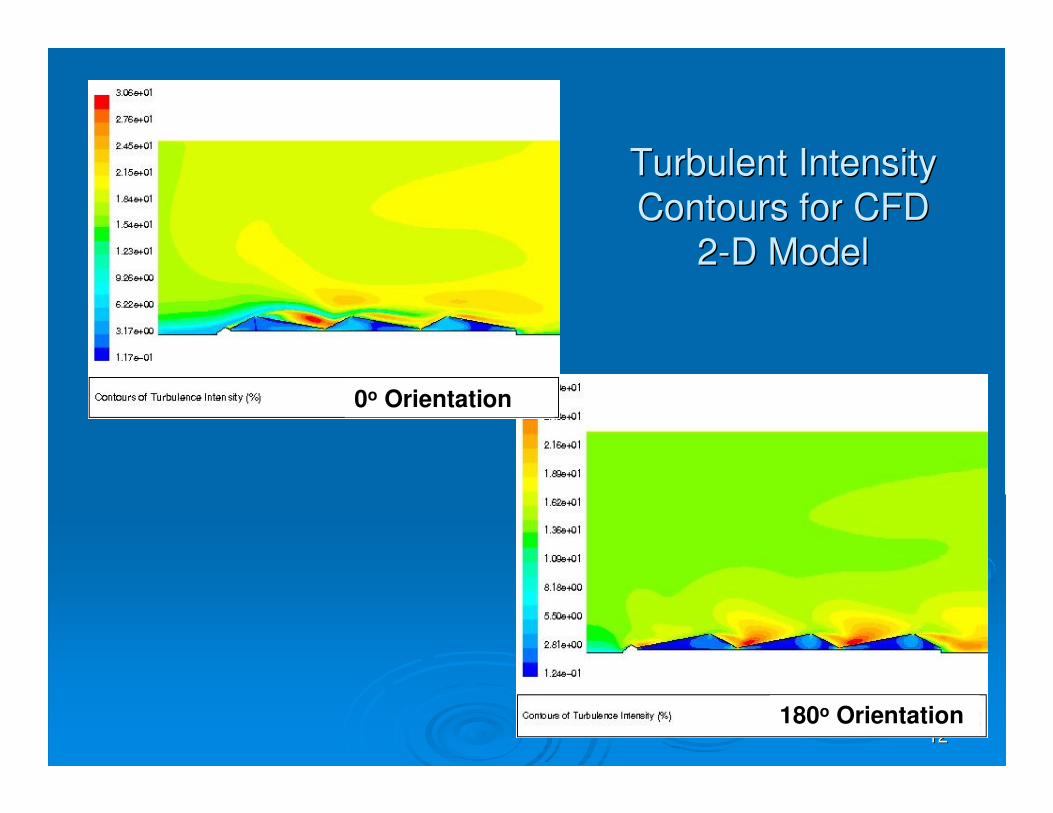
Turbulent Intensity Turbulent Intensity
Contours for CFD Contours for CFD
22--D ModelD Model
0o Orientation
180o Orientation

1313
Velocity Profiles for CFD 2Velocity Profiles for CFD 2--D ModelD Model
0o Orientation 180o Orientation
0o Orientation 180o Orientation

1414
Velocity Vector Plots for CFD 2Velocity Vector Plots for CFD 2--D ModelD Model
0o Orientation 180o Orientation
0o Orientation 180o Orientation

1515
180o Orientation
180o Orientation180o Orientation
180o Orientation

1616
0o Orientation 180o Orientation
0o Orientation 180o Orientation
Particle Particle PathlinePathline Plots for CFD 2Plots for CFD 2--D ModelD Model

1717
22--D Forces, CD Forces, CDD & C& CLL
--0.430.43--0.420.42--0.350.350.200.20--0.090.090.370.37C lift yC lift y
--26.926.9--26.326.3--21.821.87.887.88--3.383.3814.4414.44Force YForce Y
((newtonsnewtons))
0.1050.1050.1060.1060.0930.0930.200.200.230.230.250.25C drag xC drag x
6.466.466.496.495.685.687.687.689.059.059.729.72Force XForce X
((newtonsnewtons))
180 180
degdeg
P3D3P3D3
180 180
degdeg
P2D2P2D2
180 180
degdeg
P1D1P1D1
0 deg0 deg
P3D3P3D3
0 deg0 deg
P2D2P2D2
0 deg0 deg
P1D1P1D1

1818
Overall Load Comparisons Between Overall Load Comparisons Between
CFD 2CFD 2--D and WT ModelsD and WT Models
00oo OrientationOrientation 180180oo OrientationOrientation

1919
33--D Boundary D Boundary CondtionsCondtions
�� Domain x=40 feet, y=10 feet, z = 2 feet Domain x=40 feet, y=10 feet, z = 2 feet (symmetry along plate center and one side)(symmetry along plate center and one side)�� Grid: Grid: dx_mindx_min=0.1 feet, =0.1 feet, dx_maxdx_max=0.7 feet=0.7 feet
�� Grid shape: tetrahedral pavedGrid shape: tetrahedral paved
�� Three panelsThree panels
�� Orientations at 0 and 180 degreesOrientations at 0 and 180 degrees
�� Inlet Velocity, U=10 m/s uniformInlet Velocity, U=10 m/s uniform
�� Inlet Turbulence, I= 15%, L= 1 mInlet Turbulence, I= 15%, L= 1 m
�� Turbulence model: kTurbulence model: k--omega, standard wall omega, standard wall functionsfunctions

2020
40 ft
10 ft
2 ft
CFD 3CFD 3--D Grid LayoutD Grid Layout
2121
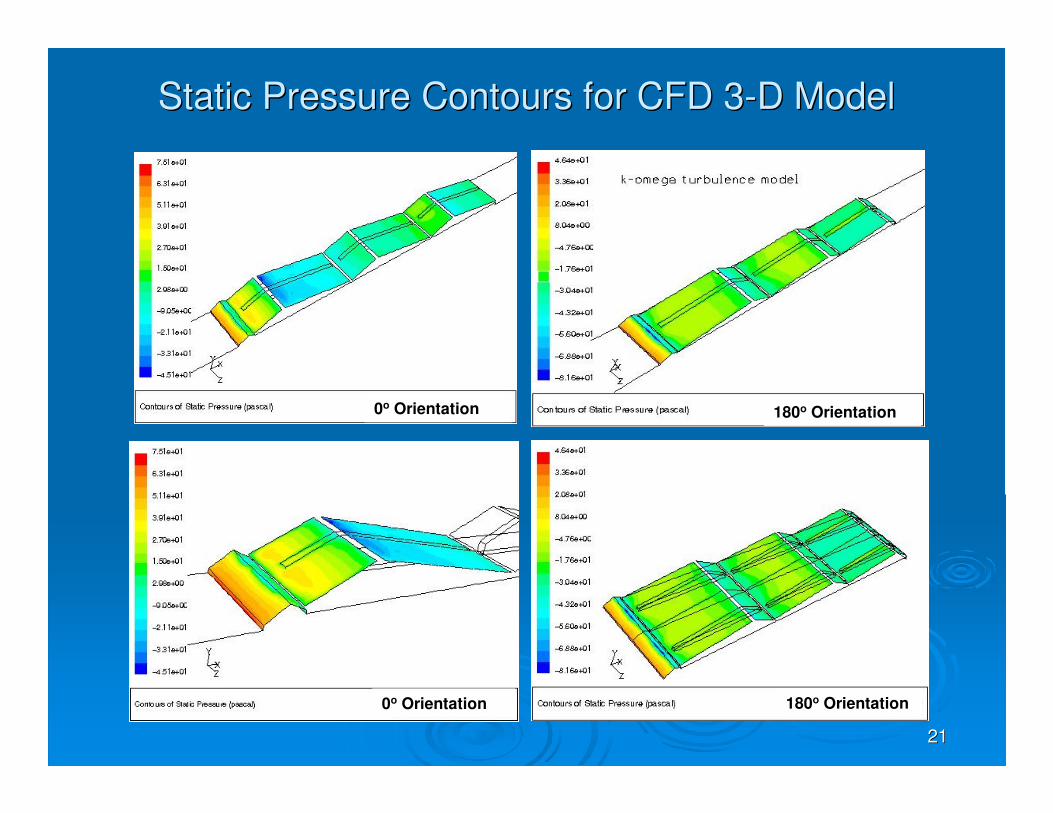
Static Pressure Contours for CFD 3Static Pressure Contours for CFD 3--D ModelD Model
0o Orientation 180o Orientation
0o Orientation 180o Orientation

2222
Velocity Magnitude Velocity Magnitude
Contours for CFD Contours for CFD
33--D ModelD Model
0o Orientation
180o Orientation

2323
0o Orientation
180o Orientation
Turbulent Intensity Turbulent Intensity
Contours for CFD Contours for CFD
33--D ModelD Model

2424
Velocity Profiles for CFD 3Velocity Profiles for CFD 3--D ModelD Model
0o Orientation 180o Orientation
0o Orientation 180o Orientation

2525
Velocity Vector Plots for CFD 3Velocity Vector Plots for CFD 3--D ModelD Model
0o Orientation 0o Orientation
0o Orientation 0o Orientation

2626
0o Orientation 0o Orientation
0o Orientation

2727

2828
Line at x=1.4, z=0.02
0o Orientation 0o Orientation
0o Orientation 0o Orientation
Particle Particle PathlinePathline Plots for CFD 3Plots for CFD 3--D ModelD Model

2929
Line x = 3.6 z=0.1
Line x = 3.6 z=1.0 Line x = 3.6 z=1.9
Line x = 3.6 z=0.02
0o Orientation 0o Orientation
0o Orientation 0o Orientation

3030
33--D CFD with Alternative Turbulence ModelsD CFD with Alternative Turbulence Models
WD = 180
-0.50
-0.30
-0.10
0.10
0.30
0.50
1st Tile 2nd Tile 3rd Tile
PV Position
Fo
rce
Co
eff
icie
nt
Cd meas Cd k-w Cd RNG Cd k-e
Cl meas Cl k-w Cl RNG Cl k-e
WD = 180
-1.40
-1.20
-1.00
-0.80
-0.60
-0.40
-0.20
0.00
1st Tile 2nd Tile 3rd Tile
PV Position
Mo
me
nt
Co
eff
icie
nt
measured k-omega RNG k-epsilon
CD meas CL meas
CM meas
K-e
K-ω
RNG K-e
KappaKappa--omega turbulence model chosen for subsequent calculationsomega turbulence model chosen for subsequent calculations
180180oo OrientationOrientation

3131
Forces, Forces, CdCd & & ClCl
--0.080.08--0.060.06--0.080.080.140.140.020.020.040.04
C lift yC lift y
Wind Wind
TunnelTunnel
--0.090.09--0.070.07--0.140.140.010.01--0.050.050.030.03C lift y C lift y
CFDCFD
0.240.240.120.120.180.180.330.33--0.040.040.410.41
C drag x C drag x
Wind Wind
TunnelTunnel
0.220.220.160.160.260.260.170.17--0.050.050.470.47C drag x C drag x
CFDCFD
180 180
degdeg
P3D3P3D3
180 180
degdeg
P2D2P2D2
180 180
degdeg
P1D1P1D1
0 deg0 deg
P3D3P3D3
0 deg0 deg
P2D2P2D2
0 deg0 deg
P1D1P1D1

3232
Overall Load Comparisons Between Overall Load Comparisons Between
CFD 3CFD 3--D and WT ModelsD and WT Models
00oo OrientationOrientation 180180oo OrientationOrientation

3333
SummarySummary
�� A hybrid numerical and physical model study A hybrid numerical and physical model study
of wind loading on PV arrays revealed:of wind loading on PV arrays revealed:
�� 22--D CFD simulation provide qualitative guidance,D CFD simulation provide qualitative guidance,
�� 33--D CFD simulation replicated windD CFD simulation replicated wind--tunnel tunnel
CCDD, C, CLL & C& CMM measurementsmeasurements
�� Agreement was sufficient to justify sensitivity Agreement was sufficient to justify sensitivity
study using CFD of alternative PV array study using CFD of alternative PV array
designs.designs.

3434
The EndThe End