Solar Market Overview for Affordable Housing · Solar Market Overview for Affordable Housing Amy...
45
Solar Market Overview for Affordable Housing Amy Hollander October 17, 2017
Transcript of Solar Market Overview for Affordable Housing · Solar Market Overview for Affordable Housing Amy...

Solar Market Overview for Affordable Housing
Amy Hollander
October 17, 2017

2
Agenda
• Market Update
– PV Cost Trends
– Technology
– Solar Trends for Single and Multifamily Housing
– Regulatory Considerations
– Incentives
– Common Solar Financing Structures

PV Cost Trends
NATIONAL RENEWABLE ENERGY LABORATORY 4
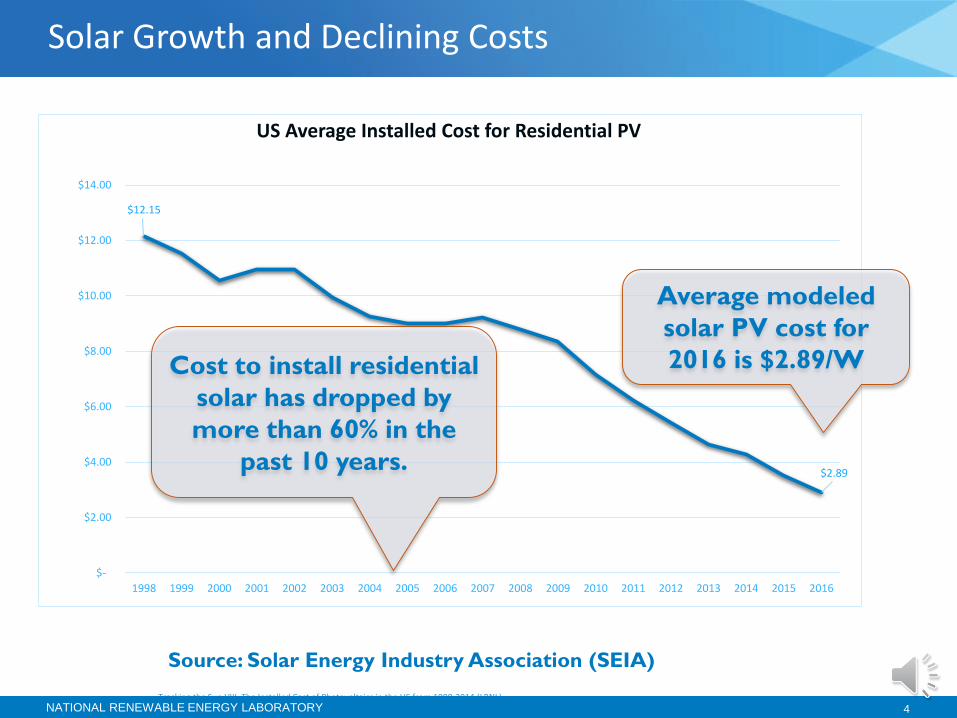
Solar Growth and Declining Costs
$12.15
$2.89
$-
$2.00
$4.00
$6.00
$8.00
$10.00
$12.00
$14.00
1998 1999 2000 2001 2002 2003 2004 2005 2006 2007 2008 2009 2010 2011 2012 2013 2014 2015 2016
US Average Installed Cost for Residential PV
Cost to install residential
solar has dropped by
more than 60% in the
past 10 years.
Average modeled
solar PV cost for
2016 is $2.89/W
Source: Solar Energy Industry Association (SEIA)

NATIONAL RENEWABLE ENERGY LABORATORY 5

NATIONAL RENEWABLE ENERGY LABORATORY 6
U.S. Renewable Generation Capacity Growth

NATIONAL RENEWABLE ENERGY LABORATORY 7
U.S. Electricity Generation by Fuel

NATIONAL RENEWABLE ENERGY LABORATORY 8

NATIONAL RENEWABLE ENERGY LABORATORY 9

The Cost of Not BeingResilient

NATIONAL RENEWABLE ENERGY LABORATORY 11
2017 Hurricane Season – Power Outages Costing Lives
For the first time since 2005 the U.S. has had four major hurricanes make landfall on the mainland.

NATIONAL RENEWABLE ENERGY LABORATORY 12
2017 2018Aug Sep Oct Nov Dec 2018
Hurricane Harvey Category 4
Aug 25
Impacted Texas Gulf Coast • winds over 130mph,• 50 inches of rain, • 1.5 ft of flood waters,• 136,000+ buildings impacted• Death Toll = 88
Hurricane HarveyImage Credit –Left to Righthttp://a.abcnews.com/images/US/hurricane-harvey-ht-jpo-170901_4x3_992.jpghttps://static.dezeen.com/uploads/2017/09/houston-flooded-hurricane-harvey-urban-design_dezeen_hero-852x479.jpghttp://a.abcnews.com/images/US/hurricane-harvey-01-ap-mt-170829_4x3_992.jpg

NATIONAL RENEWABLE ENERGY LABORATORY 13
2017 2018Aug Sep Oct Nov Dec 2018
Hurricane IrmaCategory 4 and 5
Sept 10
Impacted Caribbean (Category 5) and Florida (Category 4)• $50billion in damages in Florida• Miami-Dade County had ~730,000 without power• ~6 million across the state without power• Death Toll = 75
Hurricane Irma
Image Credit –Left to Righthttp://www.miamiherald.com/news/nation-
world/world/americas/article177687526.htmlhttp://www.aljazeera.com/mritems/imagecache/mbdxxlarge/mritems/Images/2017/9/11/63c351a3c66d411f8c96fad716e93fd2_18.jpg

NATIONAL RENEWABLE ENERGY LABORATORY 14
2017 2018Aug Sep Oct Nov Dec 2018
Hurricane MariaCategory 4
Sept 20
Impacted Puerto Rico and the Caribbean• ~$60billion in damages• Crippled 95% of communications networks in Puerto Rico• Millions without food, water and power• Death toll = 48
Hurricane Maria
Image credit: L-Rhttps://www.gannett-cdn.com/-mm-/460bb6af77d3b53103130b8f37e47261e0cbe0f1/c=689-0-4783-3078&r=x404&c=534x401/local/-/media/2017/10/03/USATODAY/USATODAY/636426185590734256-XXX-10022017-Yabucoa-Puerto-Rico-Hurricane-Maria-homes08.JPGhttps://timedotcom.files.wordpress.com/2017/09/puerto-rico-hurricane-maria-aftermath1.jpg?quality=85https://timedotcom.files.wordpress.com/2017/09/puerto-rico-hurricane-maria-aftermath-5.jpg?quality=85

NATIONAL RENEWABLE ENERGY LABORATORY 15
2017 2018Aug Sep Oct Nov Dec 2018
Hurricane NateCategory 1
Oct 8
Impacted Gulf Coast States• Alabama Power reported Sunday afternoon that more
than 63,000 customers were without power.• Mississippi Power said 3,716 of its customers were
without power, while in Louisiana, 332 homes were affected.
• Death Toll in Central America = 45 (2 in U.S.)
Hurricane NateImage credit: L-Rhttp://media.npr.org/assets/img/2017/10/08/gettyimages-858867316-2_wide-4902ecc18daa341687b2275ef812ea0ce19928e1-s900-c85.jpghttps://thenypost.files.wordpress.com/2017/10/hurricane-nate-embed.jpg?quality=90&strip=all&w=662&strip=allhttps://www.reviewjournal.com/wp-content/uploads/2017/10/9388995_web1_9388995-ba8cf5fd3d024196a53f0a8259f257c3.jpg

NATIONAL RENEWABLE ENERGY LABORATORY 16
2017 2018Aug Sep Oct Nov Dec 2018
Northern California
Fires
WildfiresImage Credit: The Mercury News/Bay Area News:http://www.mercurynews.com/2017/10/10/pge-power-lines-linked-to-wine-country-fires/
Impacted Wine Country • 102,000 PG&E customers were without
power.• 3,500 structures were burned.• Death toll: 35

NATIONAL RENEWABLE ENERGY LABORATORY 17
Disaster Recovery at NREL: Deeper Dive
Image Sources: http://www.reuters.com/article/us-storm-sandy-hurricane-idUSBRE89N16J20121030http://www.serve.gov/site-page/sandyCamden County MUA: http://www.ccmua.org/

WHAT IS RESILIENCE?
“the ability to anticipate, prepare for, and adapt to changing conditions and withstand, respond to,
and recover rapidly from disruptions through adaptable and holistic planning and technical
solutions”.
www.nrel.gov/tech_deployment/resilience-planning-roadmap/

NATIONAL RENEWABLE ENERGY LABORATORY 19
Electricity System Overview
Quadrennial Energy Review , 2016

Technology

NATIONAL RENEWABLE ENERGY LABORATORY 21
District Net Zero Housing (NZH) and Net Plus Housing
Commercial Buildings
Residential Buildings
Mixed-Use Buildings
Photovoltaics
Affordable Housing
Solar Hot Water
Wind Turbines Combined Heat and PowerDistrict Geothermal Heating and Cooling
Battery Storage Thermal Storage
Biomass and Waste-to-Energy Landfill GasMicrogrids Dispatchable Loads

NATIONAL RENEWABLE ENERGY LABORATORY 22
Cook County Community Solar Project
•Local Benefits Analysis published (8/17)
•15 Replicable Case Studies – most
plan to pursue installation. Website
for cases, financials etc.
•Final Report – Findings:
–For potential site owners
–For policy / regulatory process
Project end date: Sept. 30, 2017
What’s At Stake:

NATIONAL RENEWABLE ENERGY LABORATORY 23
Microgrids with Storage
• Inverters convert direct current power from solar to alternating current power compatible with the island’s utility system.
• Other inverters reverse that conversion for battery charging.
• When solar goes to sleep, the batteries discharge through their inverters.
• If solar batteries are low, diesel generators automatically back up power to the user, and recharge battery bank until there is enough charge to sustain the island load by itself.
• Result: Island uses 50% of previously diesel powered generation.
• Microgrid controller device optimizes solar first, then storage, then diesel if necessary.
NATIONAL RENEWABLE ENERGY LABORATORY 24
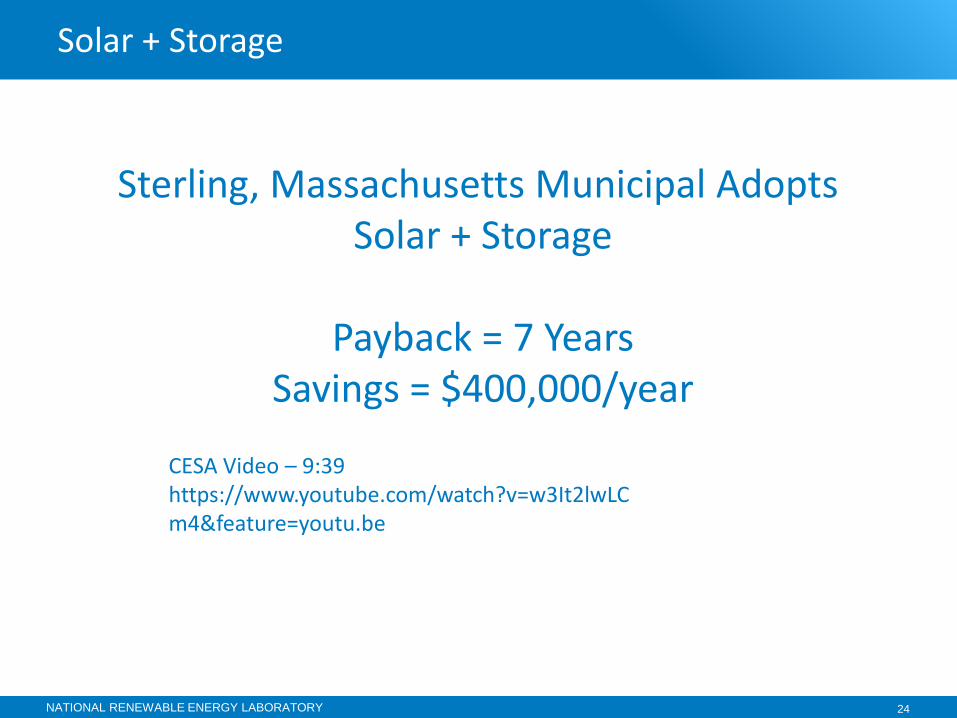
Solar + Storage
CESA Video – 9:39https://www.youtube.com/watch?v=w3It2lwLCm4&feature=youtu.be
Sterling, Massachusetts Municipal Adopts Solar + Storage
Payback = 7 YearsSavings = $400,000/year

Solar Trends for Affordable Single and Multifamily Housing

26
Top Financing Options for Owner-occupied Homes
• LIHEAP/WAP– Colorado Rooftop Solar
Program
• Direct Cash Incentives– California Single-family
Affordable Solar Housing
• On-bill Financing– Ouachita Cooperative in
Arkansas
• Loans– Massachusetts’ Solar Loan
Program
• Third-party Leasing/ESA– PosiGen in Connecticut

27
Top Financing Options for Multi-family Housing Providers
• Capital Refinancing– Anecdotal evidence
• Third-party Leasing/PPA & Energy Service Agreements
• LIHEAP/WAP
• On-bill Financing
• PACE– California has launched a
Low-income PACE pilot:– https://thinkprogress.org/new-program-
will-support-clean-energy-and-efficiency-
for-low-income-residents-a24198304245/

28
NREL has developed a variety of world-class tools that can be used to model urban mixed-use developments
• OpenStudio/EnergyPlus
• Renewable Energy Optimization (REopt) tool
• REopt Lite
• Campus Modeling Tool (CMT)
• Subdivision Energy Analysis Tool (SEAT)
• Urban Opt -Urban Renewable Building And Neighborhood Optimization tool
Coming Soon:URBANopt
Urban Renewable Building And Neighborhood Optimization tool

Regulatory Trends & Considerations

30REVIEW DRAFT – NOT FOR CITATION, QUOTATION, OR DISTRIBUTION
State Renewable Portfolio Standards (RPS)and Goals

31REVIEW DRAFT – NOT FOR CITATION, QUOTATION, OR DISTRIBUTION
Renewable Portfolio Standards and Goals

Incentives

33REVIEW DRAFT – NOT FOR CITATION, QUOTATION, OR DISTRIBUTION
• 30% ITC extended through Dec. 31, 2019
• Future solar trade case could impose tariff on foreign PV panels and increase system costs
Factors Impacting Economics
Reference: http://news.energysage.com/congress-extends-the-solar-tax-credit/

34
Database of State Incentives for Renewables & Efficiency
Website for Incentives: http://www.dsireusa.org/

Solar Financing Structures

NATIONAL RENEWABLE ENERGY LABORATORY 36
• Power Purchase Agreements (PPAs)
• Energy Services Agreements (ESAs)
• Community Solar Model
• LIHTC and Solar
• How corporate tax cuts may affect the market
Solar Finance Structures

NATIONAL RENEWABLE ENERGY LABORATORY 37
• On-site renewable power purchase agreements (PPAs) allow affordable housing agencies to fund on-site renewable energy projects with no up-front capital costs.
• Developers install renewable energy systems on multifamily properties. In exchange, agencies agree to purchase the power generated by the system.
• Developers can capture the tax credits as well as depreciation which can result in heavy tax relief for the first 6 to 8 years of the project
Solar Developers Create Power Purchase Agreements

NATIONAL RENEWABLE ENERGY LABORATORY 38
Power Purchase Agreement Economics –Sam Modeling
Power Purchase Agreement Economicso Modeled as 20 year term and 7 year term with buy out in year 8o Buy out modeled as Net Present Value (NPV) of PPA, O&M expense, and state and federal
tax savings– Buy out in beginning of year 8 for 7 year PPA estimated at less than $200k
o After year 7 Housing Agency takes over ownership, gets all electricity savings but also has to pay operating expense (O&M)
*Note: A PPA includes 30% Investment Tax Credit (ITC) and Modified Accelerated Cost Recovery (MACRS)
Estimated Buy Out and Electricity SavingsMACRS is a method of depreciation in which a business’ investments in certain tangible property are recovered, for tax purposes, over a specified time period through annual deductions. Developers can take an additional 35% annually for depreciation, which usually tapers to zero at 7 to 8 years.
ScenarioREC Center PPA
($1.85/Watt)
REC Center 7 Year PPA
($1.85/Watt)System size (kW) 305.7 305.71st Year PPA Rate 8.14 ¢/kWh 8.14 ¢/kWhNPV ($) $374,816 -
Category High End Low End
Estimated Buy Out at Year 8 ($ NPV) Less than $200kLess than
$200k
NPV of Electricity Cost Savings Year 1-10 ($) $238,949 NPV of Electricity Cost Sav Minus Operating Exp8-20 ($) $903,650

NATIONAL RENEWABLE ENERGY LABORATORY 39
Agency Purchase Economics – SAM Modeling
*Note does not include 30% ITC or MACRS
ScenarioREC Center Cash
($1.85/Watt)
REC Center Cash ($1.85/Watt) No
DemandSystem size (kW) 305.7 305.7
Net capital cost ($) $564,267 $564,267
Annual energy (kWh/yr) 436,095 436,095
Capacity factor (year 1) 16.3% 16.3%
Energy yield (year 1) 1,430 kWh/kW 1,430 kWh/kW
Levelized COE (nominal) 12.72 ¢/kWh 12.72 ¢/kWh
Net electricity savings with system (year 1) $66,571 $40,341
Net demand savings with system (year 1) $26,230 $0
Net present value ($) $251,376 ($110,481)
Payback period (yrs) 9.0 years 15.5 years
Weather File
Annual Cost Savings ($/yr)
TMY3 $66,5702014 $71,8722013 $74,0642012 $70,4392011 $69,306
Annual Cost Savings Based on Weather File
NATIONAL RENEWABLE ENERGY LABORATORY 40
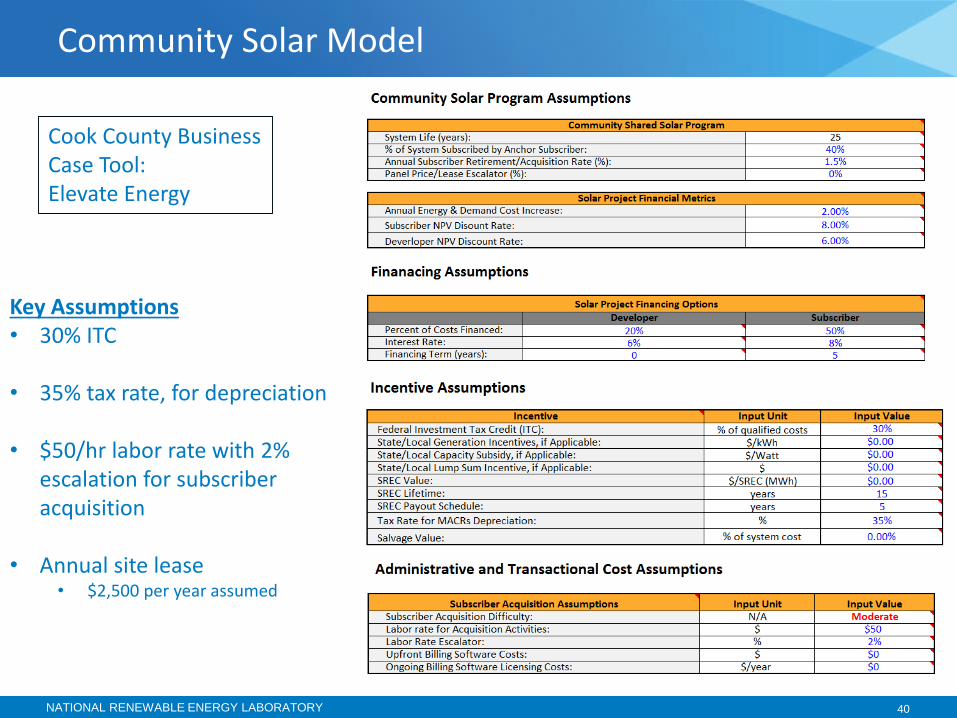
Community Solar Model
Key Assumptions• 30% ITC
• 35% tax rate, for depreciation
• $50/hr labor rate with 2% escalation for subscriber acquisition
• Annual site lease• $2,500 per year assumed
Cook County BusinessCase Tool:Elevate Energy

NATIONAL RENEWABLE ENERGY LABORATORY 41
Energy Services Agreement (ESAs) for Solar
• An Energy Services Agreement (ESA) or Company (ESCO) incurs the cost of implementing a range of energy conservation measures (ECMs)—which can include solar
• Upgrades are paid from the energy, water, and operations savings resulting from these ECMs.
• The ESCO and the agency negotiate to decide who maintains the ECMs.
• Payments to the contractor cannot exceed savings in any one year.
• These contracts are recommended for renewable energy projects only if energy-efficiency measures also are being performed.

42
Considerations for Low Income Housing Tax Credit (LIHTC) Solar on Affordable Housing
• LIHTC housing is NOT regulated by HUD
• Implementing state agencies manage this program
• HUD approval is not required for solar– Additional research
may be needed to determine solar requirements on a state-by-state basis
LIHTC Housing Size Characteristics from 1995 –2015
0%
5%
10%
15%
20%
25%
30%
35%
40%
0-10Units
11-20Units
21-50Units
51-99Units
100+Units
Pe
rce
nta
ge o
f A
ll R
ep
ort
ed
P
roje
cts
(19
95
-2
01
5)
Number of Units

NATIONAL RENEWABLE ENERGY LABORATORY 43
Tax Benefit to Investors May Change
Finance Structures
$(2)
$(1)
$-
$1
$2
$3
$4
$5
1 2 3 4 5 6 7 8 9 10 11 12 13 14 15 16 17 18 19 20 21 22 23 24 25 26 27 28 29 30
Fed
eral
Tax
Ben
efit
/ (
Exp
ense
)
Year
Federal Tax Benefit/Expense Over Life of PV Project
35% tax rate
15% tax rate
NATIONAL RENEWABLE ENERGY LABORATORY 44
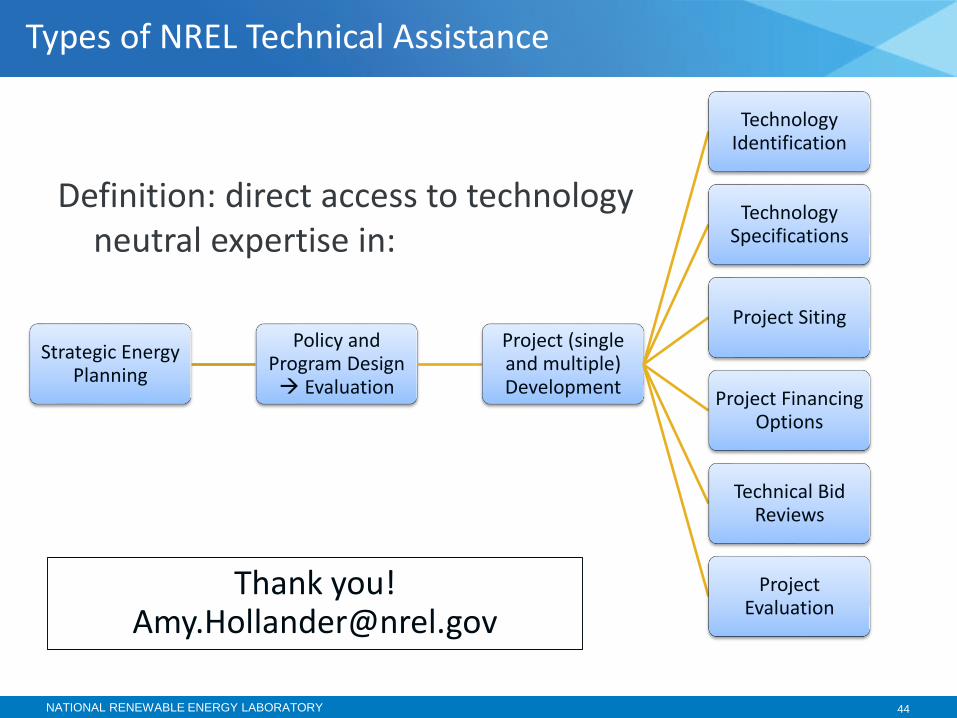
Definition: direct access to technology neutral expertise in:
Types of NREL Technical Assistance
Strategic Energy Planning
Policy and Program Design Evaluation
Project (single and multiple) Development
Technology Identification
Technology Specifications
Project Siting
Project Financing Options
Technical Bid Reviews
Project Evaluation
Thank [email protected]

720 KW
1,156 KW
524 KW
449 KW408 KW 94 KW
NREL PV Systems - South Table Mesa Campus
Amy Hollander 303.275.3198 [email protected]
QUESTIONS?
50 KW