SOLAR INCOME FUND - bluefieldsif.com · BLUEFIELD SOLAR INCOME FUND ... Total Shareholder Return...
16
CONFIDENTIAL SOLAR INCOME FUND ANNUAL RESULTS FOR THE YEAR ENDED 30 JUNE 2017
-
Upload
truonglien -
Category
Documents
-
view
218 -
download
3
Transcript of SOLAR INCOME FUND - bluefieldsif.com · BLUEFIELD SOLAR INCOME FUND ... Total Shareholder Return...

CONFIDENTIAL
SOLAR INCOME FUNDANNUAL RESULTS
FOR THE YEAR ENDED 30 JUNE 2017

2
▪ Sterling income fund listed on the London Stock Exchange
▪ Majority regulated revenues directly linked to RPI
▪ Revenues largely uncorrelated to traditional markets
▪ £573m Directors’ valuation and market capitalisation of £425m1
▪ 441.5 MWp1 of generating capacity
▪ Portfolio of large ground-based solar farms
▪ Mandate to invest only solar PV assets
▪ Investment mandate to invest only in the UK
▪ Full pay-out model
BLUEFIELD SOLAR INCOME FUND
Sterling income fund with revenues largely uncorrelated to traditional markets
1. BSIF accounts
31. BSIF accounts
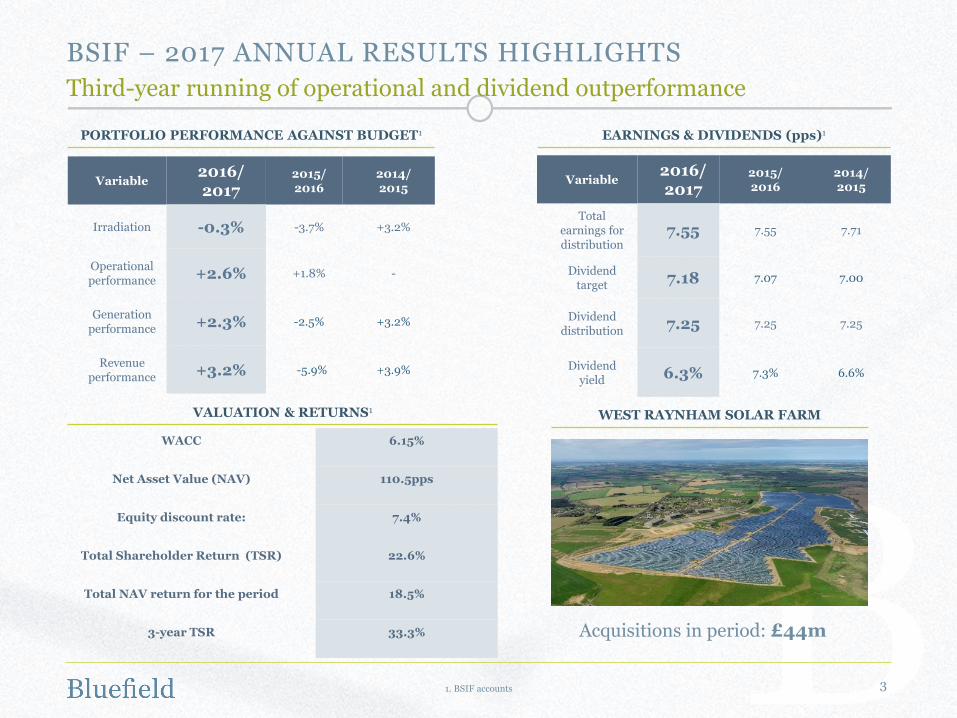
EARNINGS & DIVIDENDS (pps)1PORTFOLIO PERFORMANCE AGAINST BUDGET1
VALUATION & RETURNS1
Variable2016/ 2017
2015/ 2016
2014/ 2015
Total earnings for distribution
7.55 7.55 7.71
Dividend target 7.18 7.07 7.00
Dividend distribution 7.25 7.25 7.25
Dividend yield 6.3% 7.3% 6.6%
Variable2016/ 2017
2015/ 2016
2014/ 2015
Irradiation -0.3% -3.7% +3.2%
Operational performance +2.6% +1.8% -
Generation performance +2.3% -2.5% +3.2%
Revenue performance +3.2% -5.9% +3.9%
WEST RAYNHAM SOLAR FARM
BSIF – 2017 ANNUAL RESULTS HIGHLIGHTS
Third-year running of operational and dividend outperformance
Acquisitions in period: £44m
WACC 6.15%
Net Asset Value (NAV) 110.5pps
Equity discount rate: 7.4%
Total Shareholder Return (TSR) 22.6%
Total NAV return for the period 18.5%
3-year TSR 33.3%
4
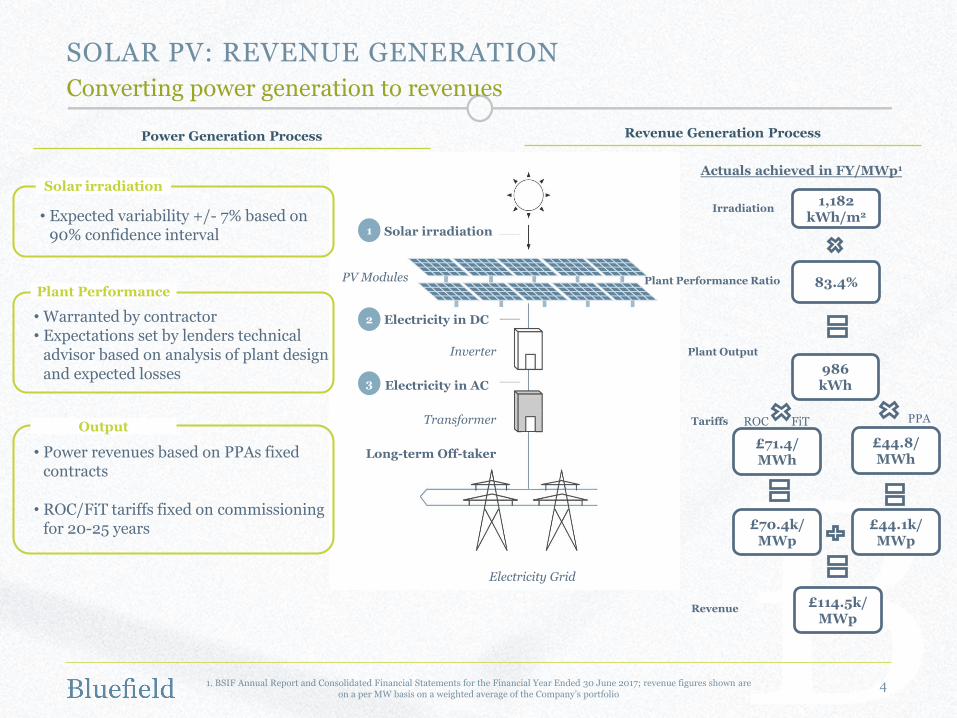
SOLAR PV: REVENUE GENERATION
Converting power generation to revenues
Solar irradiation
Electricity in DC
Inverter
Electricity in AC
Transformer
Long-term Off-taker
PV Modules
Electricity Grid
1
2
3
Solar irradiation
Plant Performance
Output
• Expected variability +/- 7% based on 90% confidence interval
• Warranted by contractor • Expectations set by lenders technical
advisor based on analysis of plant design and expected losses
• Power revenues based on PPAs fixed contracts
• ROC/FiT tariffs fixed on commissioning for 20-25 years
1,182kWh/m2
83.4%
986kWh
£44.8/ MWh
£71.4/MWh
£44.1k/MWp
£70.4k/MWp
£114.5k/MWp
Irradiation
Plant Performance Ratio
Plant Output
Tariffs ROC FiT PPA
Revenue
Actuals achieved in FY/MWp1
Power Generation Process Revenue Generation Process
1. BSIF Annual Report and Consolidated Financial Statements for the Financial Year Ended 30 June 2017; revenue figures shown areon a per MW basis on a weighted average of the Company’s portfolio

51. BSIF 2016/2017 accounts, 2. Bluefield analysis based on BSIF accounts, *excludes one-off transaction costs and the release of up-front frees related to the Company’s debt facilities
16/17 (£m)1 15/16 (£m)1 16/17 Commentary
Portfolio Income 49.2 36.5£114.5k/MW revenue + £.1.3m liquidated damages earned in the period
Portfolio and project finance interest costs (12.0) (7.8) £0.7m interest payments for Project Durrants
Total Portfolio Income Earned 37.1 28.7
Group Operating Costs* (4.2) (3.9) Ongoing charges (annualised): 1.10%
Group Interest Costs (4.4) (3.2) Interest on Aviva long-term & RCF financing
Underlying Earnings 28.5 21.6
BSIF earnings & dividend flows (pps)2
Underlying earnings of £28.5m = 8.32pps
CONSOLIDATED PORTFOLIO EARNINGS
Strong portfolio income allows debt amortisation and 7.25p distribution
0.23
8.32
(1.00)
(7.25)
0.3
0.0
1.5
3.0
4.5
6.0
7.5
9.0
Reserves b/f(pps)
Underlyingearnings per
share
Total debtrepayments
Dividenddistribution
Reserves c/f(pps)

61. Bluefield analysis based on publicly available information for listed funds and partly confidential market intelligence on private deals, 23. Bluefield analysis
Bluefield Solar was the first solar fund to list on the LSE in 2013 and started to acquire projects at competitive prices. Most recently, inflows of new low-cost capital has caused solar valuations to trend upwards. The Company has maintained its pricing discipline with multiples decreasing in line with the ROC degression. The Company has continued to monitor the market for opportunities, screening more than 300MW in the first half of 2017, and is currently reviewing about 400MW worth of potential investments.
0.8
0.9
1.0
1.1
1.2
1.3
1.4
1.5
Jan-13 Sep-13 May-14 Dec-14 Aug-15 Apr-16 Dec-16 Aug-17
Other Listed Renewables FundsBSIFBSIF pricing trendline
Recent private deals
Indicative market price trend
UK solar acquisition pricing (£m/MWp)1 BSIF potential investment review activity2
7 21
168
1331
67 67
125
398
3037
58
226239
271
338
0
50
100
150
200
250
300
350
400
450
Reviews in period since Dec Reviews post-period
Current pipeline Cumulative in period since Dec
UK SOLAR ASSET PRICING & BSIF INVESTMENT REVIEW
Low-cost capital entering the market has pushed up asset pricing
7
Commentary
1. UK BEIS Department as of 30 June 2017 (retrieved in September 2017), 2. BNEF market sizing tool, 3. BSIFG accounts 4. Bloomberg New Energy Finance & Bluefield projection
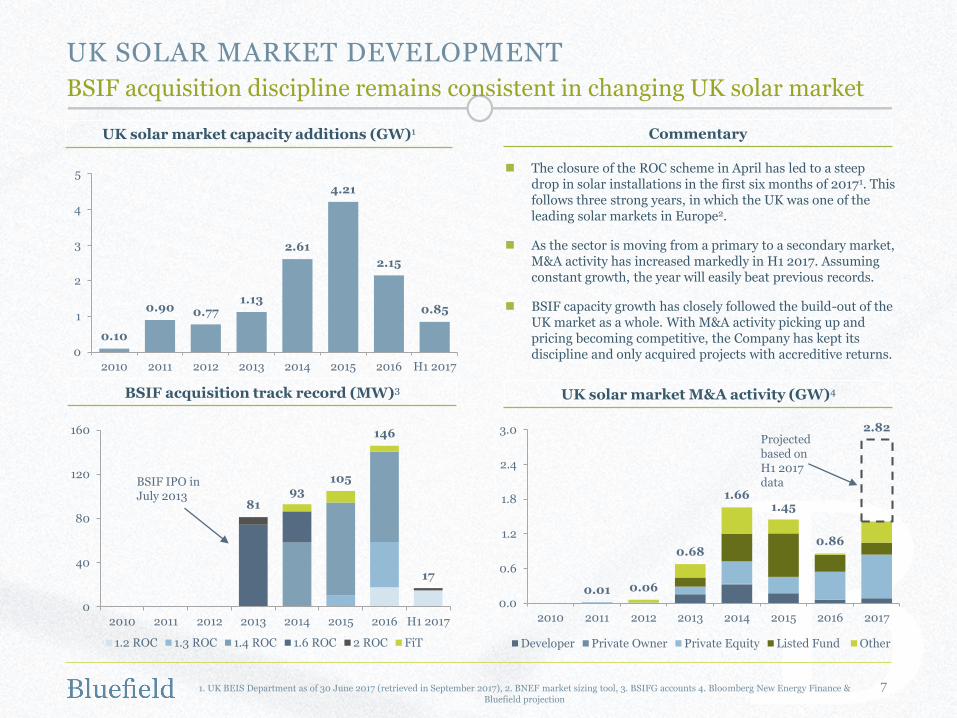
0.10
0.90 0.771.13
2.61
4.21
2.15
0.85
0
1
2
3
4
5
2010 2011 2012 2013 2014 2015 2016 H1 2017
UK solar market capacity additions (GW)1
BSIF acquisition track record (MW)3
8193
105
146
17
0
40
80
120
160
2010 2011 2012 2013 2014 2015 2016 H1 2017
1.2 ROC 1.3 ROC 1.4 ROC 1.6 ROC 2 ROC FiT
BSIF IPO in July 2013
0.01 0.06
0.68
1.661.45
0.86
2.82
0.0
0.6
1.2
1.8
2.4
3.0
2010 2011 2012 2013 2014 2015 2016 2017
Developer Private Owner Private Equity Listed Fund Other
Projected based on H1 2017 data
UK solar market M&A activity (GW)4
The closure of the ROC scheme in April has led to a steep drop in solar installations in the first six months of 20171. This follows three strong years, in which the UK was one of the leading solar markets in Europe2.
As the sector is moving from a primary to a secondary market, M&A activity has increased markedly in H1 2017. Assuming constant growth, the year will easily beat previous records.
BSIF capacity growth has closely followed the build-out of the UK market as a whole. With M&A activity picking up and pricing becoming competitive, the Company has kept its discipline and only acquired projects with accreditive returns.
UK SOLAR MARKET DEVELOPMENT
BSIF acquisition discipline remains consistent in changing UK solar market
1. BSIF accounts, 2. Companies’ accounts
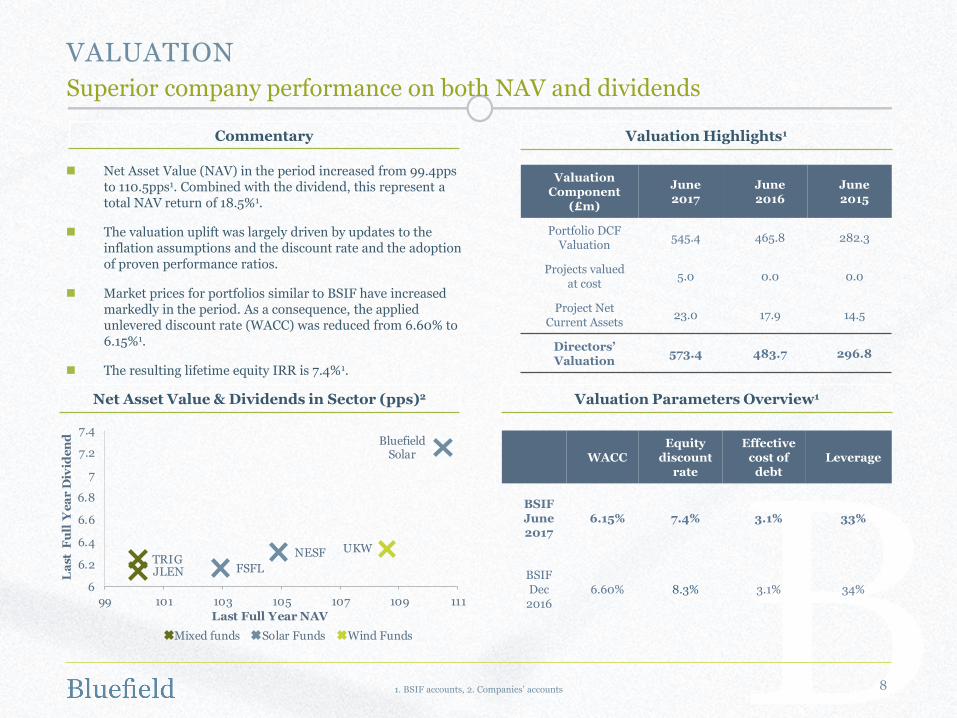
Valuation Component
(£m)
June 2017
June 2016
June 2015
Portfolio DCF Valuation
545.4 465.8 282.3
Projects valued at cost
5.0 0.0 0.0
Project Net Current Assets
23.0 17.9 14.5
Directors’ Valuation
573.4 483.7 296.8
Valuation Highlights1
Net Asset Value & Dividends in Sector (pps)2
8
Commentary
Net Asset Value (NAV) in the period increased from 99.4pps to 110.5pps1. Combined with the dividend, this represent a total NAV return of 18.5%1.
The valuation uplift was largely driven by updates to the inflation assumptions and the discount rate and the adoption of proven performance ratios.
Market prices for portfolios similar to BSIF have increased markedly in the period. As a consequence, the applied unlevered discount rate (WACC) was reduced from 6.60% to 6.15%1.
The resulting lifetime equity IRR is 7.4%1.
Valuation Parameters Overview1
WACCEquity
discount rate
Effective cost of
debtLeverage
BSIF June 2017
6.15% 7.4% 3.1% 33%
BSIF Dec 2016
6.60% 8.3% 3.1% 34%
TRIGJLEN
Bluefield Solar
NESF
FSFL
UKW
6
6.2
6.4
6.6
6.8
7
7.2
7.4
99 101 103 105 107 109 111
La
st F
ull
Ye
ar
Div
ide
nd
Last Full Year NAV
Mixed funds Solar Funds Wind Funds
VALUATION
Superior company performance on both NAV and dividends

1. BSIF accounts
NAV Movement in Period (£m)1
Portfolio Valuation Movement in Period (£m)1
9
VALUATION MOVEMENT
NAV benefits from lower discount rate and adoption of proven PRs
307.8
60.6 (0.8)
367.6
(23.0)42.1 23.1
(1.2)
408.6
050
100150200250300350400450
30 June 2016NAV
Further issue ofshares
Raising costs forPlacement
Adjustedstarting position
Dividends paidin the period
Movement invalue of
Investments
Income releasedto the Company
Net Operationalcosts
30 June 2017NAV
483.7
531.3
573.447.6
(30.7)3.4
10.47.2 20.2
31.6
420
440
460
480
500
520
540
560
580
600
30 June 2016Valuation
Additions inthe period
RebasedValuation
Cash Receiptsfrom portfolio
Power pricemovement
Updatedinflation
assumption
Updated PRassumption
Discount rate Balance ofportfolio
return
30 June 2017Valuation
10
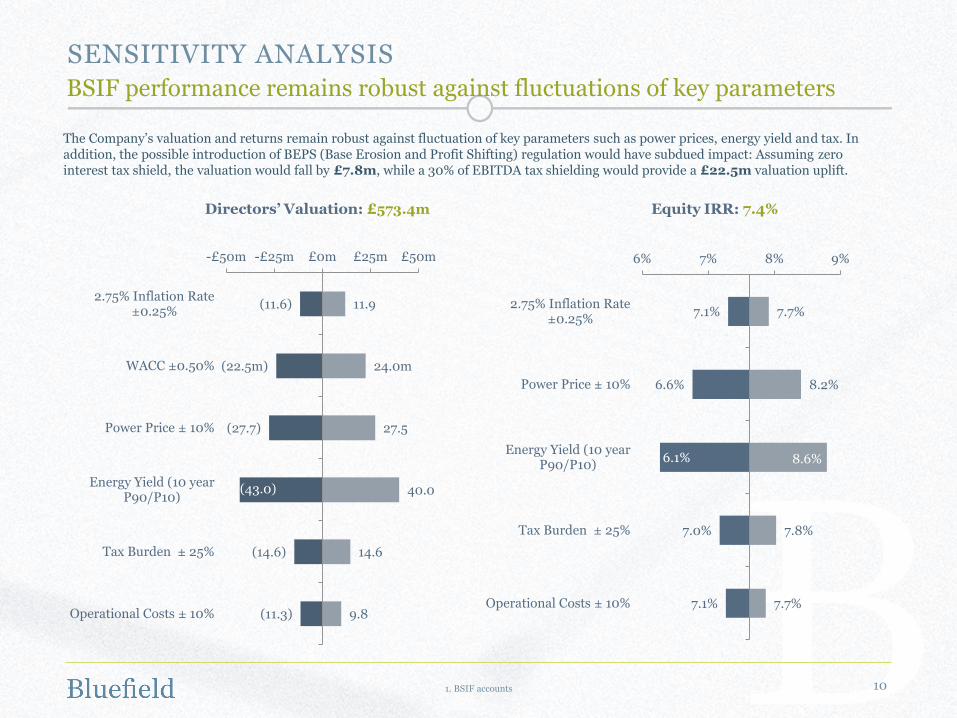
Directors’ Valuation: £573.4m
(11.6)
(22.5m)
(27.7)
(43.0)
(14.6)
(11.3)
11.9
24.0m
27.5
40.0
14.6
9.8
-£50m -£25m £0m £25m £50m
2.75% Inflation Rate±0.25%
WACC ±0.50%
Power Price ± 10%
Energy Yield (10 yearP90/P10)
Tax Burden ± 25%
Operational Costs ± 10%
7.1%
6.6%
6.1%
7.0%
7.1%
7.7%
8.2%
8.6%
7.8%
7.7%
6% 7% 8% 9%
2.75% Inflation Rate±0.25%
Power Price ± 10%
Energy Yield (10 yearP90/P10)
Tax Burden ± 25%
Operational Costs ± 10%
Equity IRR: 7.4%
The Company’s valuation and returns remain robust against fluctuation of key parameters such as power prices, energy yield and tax. In addition, the possible introduction of BEPS (Base Erosion and Profit Shifting) regulation would have subdued impact: Assuming zero interest tax shield, the valuation would fall by £7.8m, while a 30% of EBITDA tax shielding would provide a £22.5m valuation uplift.
SENSITIVITY ANALYSIS
BSIF performance remains robust against fluctuations of key parameters
1. BSIF accounts

11
Total power generation of 409GWh
Operational performance ahead of budget with PR of 83.4% (2.6% ahead)2
Gross revenues of £49.2m
£117,663 per MW per annum2
Underlying Earnings
8.32pps
Portfolio Performance
Revenue Generation
Reducing Cost Base
Operation and Maintenance reduction from £12k/MW at IPO to £8k/MW
Ongoing charges of 1.10%
UNDERLYING EARNINGS & NAV
3 Pillars of Performance1
1. All data from BSIF accounts, 2. based on operating portfolio of 401.2MW
The Company is served by solar professionals experienced in financial, debt and technical asset management
The team has been involved in over £1.25 billion of solar PV funds and/or transactions
5,600 hours monitoring, 90 days analysing critical payment milestones and 133 days on site (Bluefield Services)
3 Pillars of Performance Outcomes so FarResult
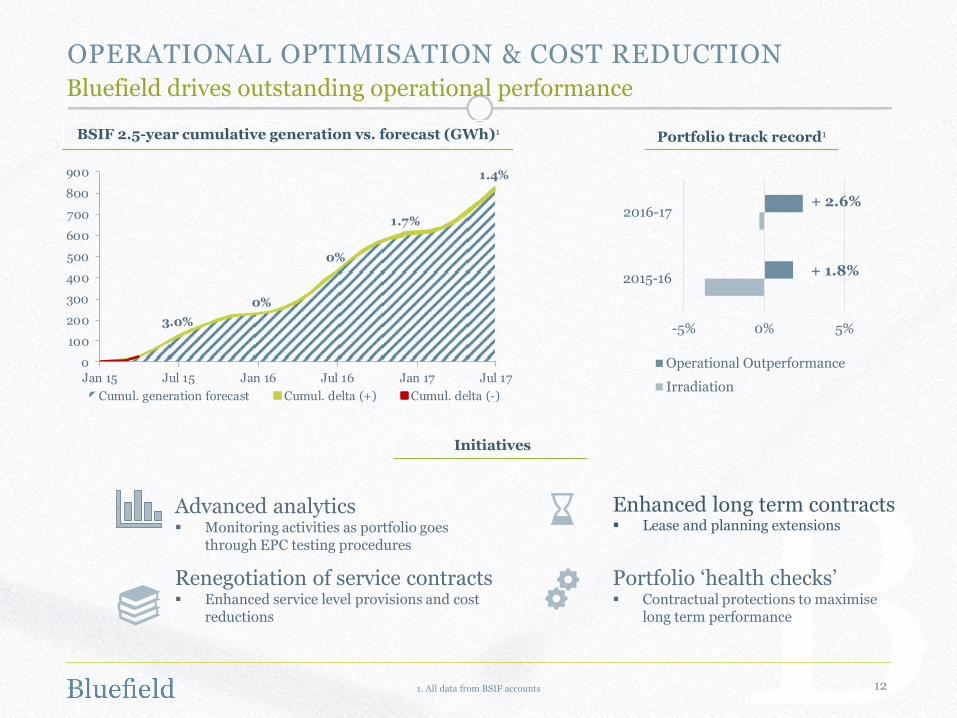
BSIF 2.5-year cumulative generation vs. forecast (GWh)1
12
3.0%
0%
0%
1.7%
1.4%
0
100
200
300
400
500
600
700
800
900
Jan 15 Jul 15 Jan 16 Jul 16 Jan 17 Jul 17
Cumul. generation forecast Cumul. delta (+) Cumul. delta (-)
Portfolio track record1
OPERATIONAL OPTIMISATION & COST REDUCTION
Bluefield drives outstanding operational performance
1. All data from BSIF accounts
-5% 0% 5%
2015-16
2016-17
Operational Outperformance
Irradiation
Advanced analytics▪ Monitoring activities as portfolio goes
through EPC testing procedures
Enhanced long term contracts▪ Lease and planning extensions
Renegotiation of service contracts▪ Enhanced service level provisions and cost
reductions
Portfolio ‘health checks’▪ Contractual protections to maximise
long term performance
Initiatives
+ 2.6%
+ 1.8%
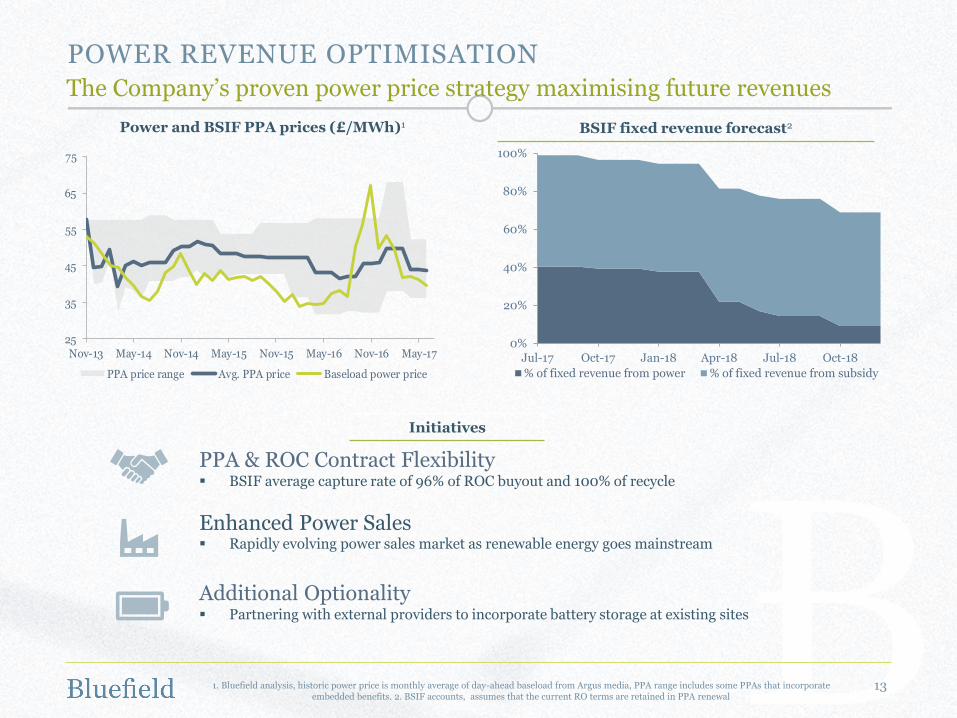
1. Bluefield analysis, historic power price is monthly average of day-ahead baseload from Argus media, PPA range includes some PPAs that incorporate embedded benefits. 2. BSIF accounts, assumes that the current RO terms are retained in PPA renewal
Power and BSIF PPA prices (£/MWh)1 BSIF fixed revenue forecast2
25
35
45
55
65
75
Nov-13 May-14 Nov-14 May-15 Nov-15 May-16 Nov-16 May-17
PPA price range Avg. PPA price Baseload power price
POWER REVENUE OPTIMISATION
The Company’s proven power price strategy maximising future revenues
13
PPA & ROC Contract Flexibility▪ BSIF average capture rate of 96% of ROC buyout and 100% of recycle
Enhanced Power Sales▪ Rapidly evolving power sales market as renewable energy goes mainstream
Additional Optionality ▪ Partnering with external providers to incorporate battery storage at existing sites
Initiatives
0%
20%
40%
60%
80%
100%
Jul-17 Oct-17 Jan-18 Apr-18 Jul-18 Oct-18
% of fixed revenue from power % of fixed revenue from subsidy
14
The Company is a high yielding income fund and the principal measure of our health will always be the cash flows we generate year by year.
The Company and its Investment Adviser will continue to examine acquisition opportunities, but will maintain the discipline necessary to deliver acceptable returns to our shareholders, as we have done during our first four years.
Our focus in the coming year will be to optimise our revenue from the existing portfolio, both by active management of our power contracts…and strong operational management through BSL.
““
John Rennocks, Chairman, 18 September, 2017
CONCLUSION
Three messages from the Chairman’s Statement

15
DISCLAIMER
This presentation is being made and this document is being issued by Bluefield Partners LLP (the Investment Adviser), which is authorised and regulated by the Financial Conduct Authority(the FCA), in relation to Bluefield Solar Income Fund Limited (the Company). This document is only being communicated to persons who would result in such communication falling within oneof the exemptions set out in the Financial Services and Markets Act 2000 (Financial Promotion) Order 2005 (the Financial Promotion Order).
This document has not been verified and is not and should not be construed as an offer to sell or the solicitation of an offer to purchase or subscribe for any investment, is intended for informationpurposes only and does not constitute investment advice. The information and opinions contained in this document are for background purposes only and do not purport to be full or complete. Noreliance may be placed for any purpose on the information or opinions contained in this document or their accuracy or completeness. No representation, warranty or undertaking, express orimplied, is given as to the accuracy or completeness of the information or opinions contained in this document by the Investment Adviser and no liability is accepted by the Investment Adviser forthe accuracy or completeness of any such information or opinions. Recipients of this document who intend to apply for or purchase shares are reminded that any such application or purchase maybe made solely on the basis of the information and opinions contained in the Company’s prospectus, which may be different from the information and opinions contained in this document.
This material is being circulated on a confidential basis. The information contained herein is confidential to such person and is neither to be disclosed to any other person, nor copied orreproduced, in any form, in whole or in part without the prior consent of Investment Adviser.
This presentation is being made and this document is being distributed in the United Kingdom only to and is directed only at persons who have professional experience in matters relating toinvestments who fall within the definition of “investment professionals” in Article 19(5) of, or a person failing within Article 49(2) (High Net Worth Companies, etc.) of, the Financial PromotionOrder (all such persons together being referred to as “relevant persons”). Any person who is not a relevant person should not act or rely on this presentation or this document or any of its contents.Recipients in jurisdictions outside the United Kingdom should inform themselves about and observe any applicable legal or regulatory requirements in relation to the distribution or possession ofthis presentation to or in that jurisdiction. In this respect, none of Numis Securities Limited (the Sponsor), the Investment Adviser, or their respective connected persons accepts any liability toany person in relation to the distribution or possession of this presentation to or in any jurisdiction.
The shares of the Company (the Shares) have not been nor will be registered under the U.S. Securities Act of 1933, as amended, (the Securities Act) or with any securities regulatory authority ofany State or other jurisdiction of the United States and shares may not be offered, sold, exercised, resold, transferred or delivered, directly or indirectly, within the United States or to, or for theaccount or benefit of, US Persons (as defined in Regulation S under the Securities Act). There will be no public offer of the Shares in the United States and neither the shares may be offered or soldwithin the United States, or to US Persons. Any offering and sale of the Shares outside the United States to non-US Persons will be in reliance on Regulation S under the Securities Act. TheCompany has not been and will not be registered under the U.S. Investment Company Act of 1940, as amended (the Investment Company Act) and investors will not be entitled to the benefitsof the Investment Company Act.
This document, or any copy of it, may not be: (i) taken or transmitted into the United States of America; (ii) distributed, directly or indirectly, in the United States of America or to any US person(within the meaning of regulations made under the Securities Act); or (iii) taken or transmitted into or distributed in Canada, Australia, Japan, the Republic of Ireland or the Republic of SouthAfrica, or any other jurisdiction where to do so may constitute a violation of the securities laws of any such jurisdiction, or to any resident of any such jurisdiction. Any failure to comply with theserestrictions may constitute a violation of the securities laws of any such jurisdiction.
The Company is categorised as an internally managed non-EU Alternative Investment Fund for the purposes of the Alternative Investment Fund Managers Directive (the AIFM Directive). Assuch neither the Company nor the Investment Adviser is required to be authorised as an alternative investment fund manager under the AIFM Directive.
The Company is a registered closed-ended collective investment scheme registered pursuant to the Protection of Investors (Bailiwick of Guernsey) Law, 1987, as amended and the RegisteredCollective Investment Scheme Rules 2008 issued by the Guernsey Financial Services Commission (the GFSC). The GFSC, in granting registration, has not reviewed this document but has reliedupon specific warranties provided by Heritage International Fund Managers Limited, the Company’s administrator. The Shares are listed and traded on the London Stock Exchange’s Main Marketfor listed securities.
A registered closed-ended collective investment scheme is not permitted to be directly offered to the public in Guernsey, but may be offered to regulated entities in Guernsey or offered to the publicby entities appropriately licensed under the Protection of Investors (Bailiwick of Guernsey) Law, 1987, as amended.

16
IMPORTANT NOTICE REGARDING TRACK RECORD INFORMATION
This document includes track record information and performance data regarding the Company. Such information is not necessarily comprehensive and potential investors shouldnot consider such information to be indicative of the possible future performance of the Company or any investment opportunity to which this document relates. Past performanceof the Company is not a reliable indicator and cannot be relied upon as a guide to future performance of the Company or the Investment Adviser. The Company has no investmentor trading history and the track record information and performance data included herein relates to business activities that are not directly comparable with the Company’sinvestment objective and therefore are not indicative of the returns the Company will, or is likely to, generate going forward. The Company will not make the same investmentsreflected in the track record information included herein. Potential investors should be aware that any investment in the Company is speculative, involves a high degree of risk, andcould result in the loss of all or substantially all of their investment.
Potential investors should consider the following factors which, among others, may cause the Company’s performance to differ materially from the track record information andperformance data described in this document:
• The track record information and performance data included in this document was generated by a number of different persons in a variety of circumstances and who may differfrom those who will manage the Company’s investments. It may or may not reflect the deduction of fees or the reinvestment of dividends and other earnings.
• Results can be positively or negatively affected by market conditions beyond the control of the Company and the Investment Adviser.
• Differences between the Company and the circumstances in which the track record information and performance data was generated include (but are not limited to) all orcertain of: actual acquisitions and investments made, investment objectives, fee arrangements, structure (including for tax purposes), term, leverage, performance targets andinvestment horizons. All of these factors can affect returns and impact the usefulness of performance comparisons and as a result, none of the historical information containedin this document is directly comparable to the returns that the Company may generate.
• Market conditions at the times covered by the track record information may be different in many respects from those that prevail at present or in the future, with the result thatthe performance of investment portfolios originated now may be significantly different from those originated in the past. In this regard, it should be noted that there is noguarantee that these returns can be achieved or can be continued if achieved.
• The Company and its intermediate holding entities may be subject to taxes on some or all of their earnings in the various jurisdictions in which they invest. Any taxes paid orincurred by the Company and intermediate holding entities will reduce the proceeds available from the sale of an investment to make future investments or distributions and/orpay the expenses and other operating costs of the Company.
TRACK RECORD