Solar Hydrogen Project Group Update 21 st July 2009.
23
Solar Hydrogen Project Group Update 21 st July 2009
-
date post
19-Dec-2015 -
Category
Documents
-
view
213 -
download
0
Transcript of Solar Hydrogen Project Group Update 21 st July 2009.

Solar Hydrogen Project
Group Update
21st July 2009

CC-124 growth kinetics model Bojan Tamburic
Error caused by O2 bubble evolutionData outliers ‘brushed’
Fit Logistic (Sigmoid) curve of the form:
)tr(t 0e1
KOD(t)
)tr(t 0e1
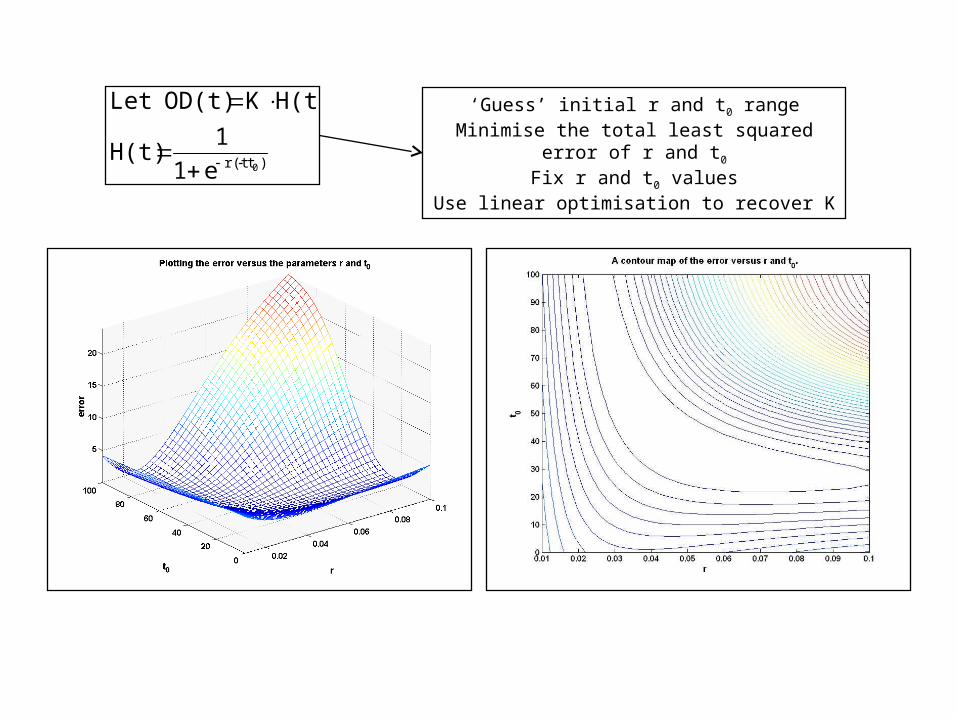
1H(t)
H(t)KOD(t)Let
‘Guess’ initial r and t0 rangeMinimise the total least squared error of r and t0
Fix r and t0 valuesUse linear optimisation to recover K

K)OD(,twhene1
KOD(t) )tr(t 0
So K is the maximum attainable OD
t0 and r tell us something about the growth rate – but not easy to visualiseBiologists typically use doubling time – not really appropriate for logistic curve
Gradient at t0 – maximum growth rate
Regression coefficient = 0.98
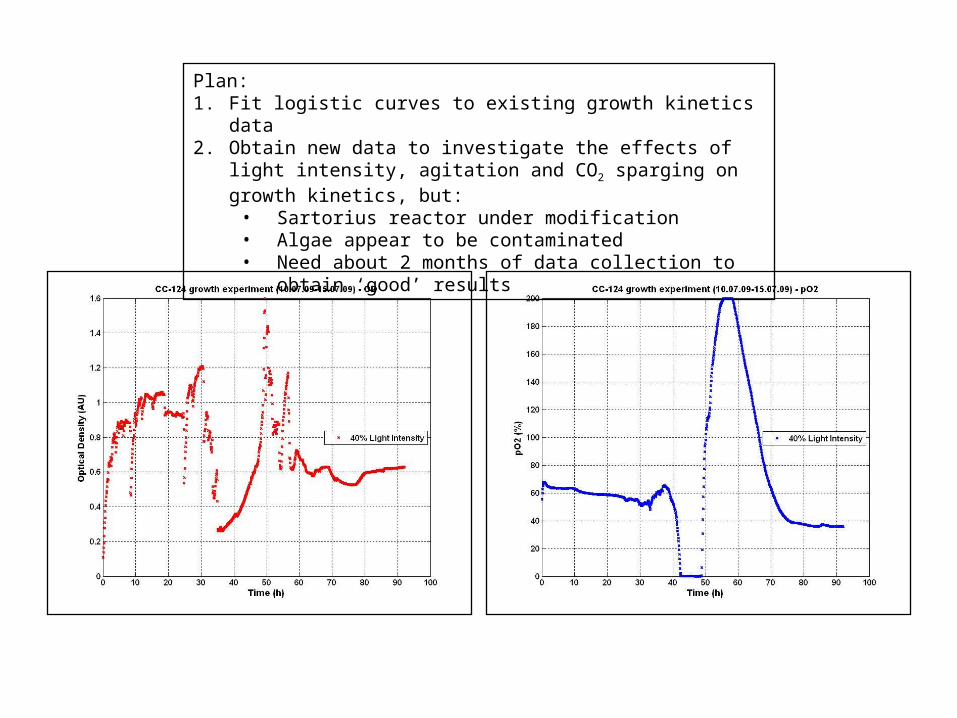
Plan:1. Fit logistic curves to existing growth kinetics data2. Obtain new data to investigate the effects of light intensity, agitation
and CO2 sparging on growth kinetics, but:• Sartorius reactor under modification• Algae appear to be contaminated• Need about 2 months of data collection to obtain ‘good’ results

Solar Hydrogen Project: SD
• Fe2O3 work:
– First stage of comparative study of different types of Fe2O3:
• Old EPFL CVD – Voltammetry– Impedance – Transient photocurrent measurements
Solar Hydrogen Project: SD
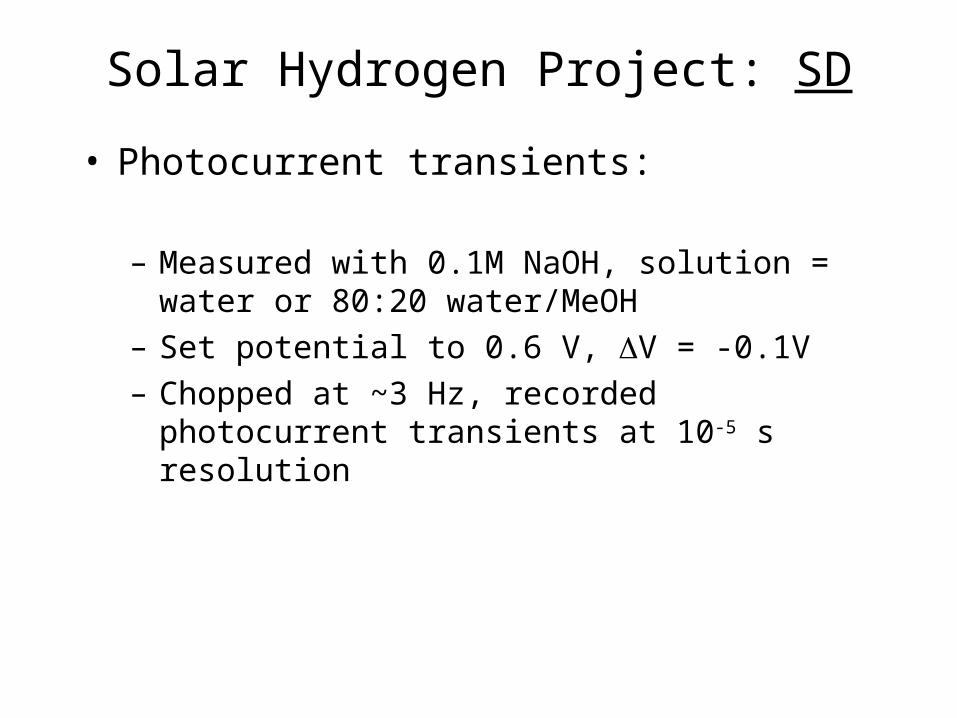
• Photocurrent transients:
– Measured with 0.1M NaOH, solution = water or 80:20 water/MeOH
– Set potential to 0.6 V, V = -0.1V– Chopped at ~3 Hz, recorded photocurrent
transients at 10-5 s resolution

Fe2O3 (EPFL): NaOH-H2O
-1.0E-05
0.0E+00
1.0E-05
2.0E-05
3.0E-05
4.0E-05
5.0E-05
-0.5 -0.25 0 0.25 0.5 0.75 1
Potential vs qre / Volts
cd /
Acm
-2
Dark 450 nm

Fe2O3 (EPFL): NaOH-H2O/MeOH
-1.0E-05
0.0E+00
1.0E-05
2.0E-05
3.0E-05
4.0E-05
5.0E-05
-0.50 -0.25 0.00 0.25 0.50 0.75 1.00
Potential vs qre/ Volt
cd /
Acm
-2
Dark 450 nm
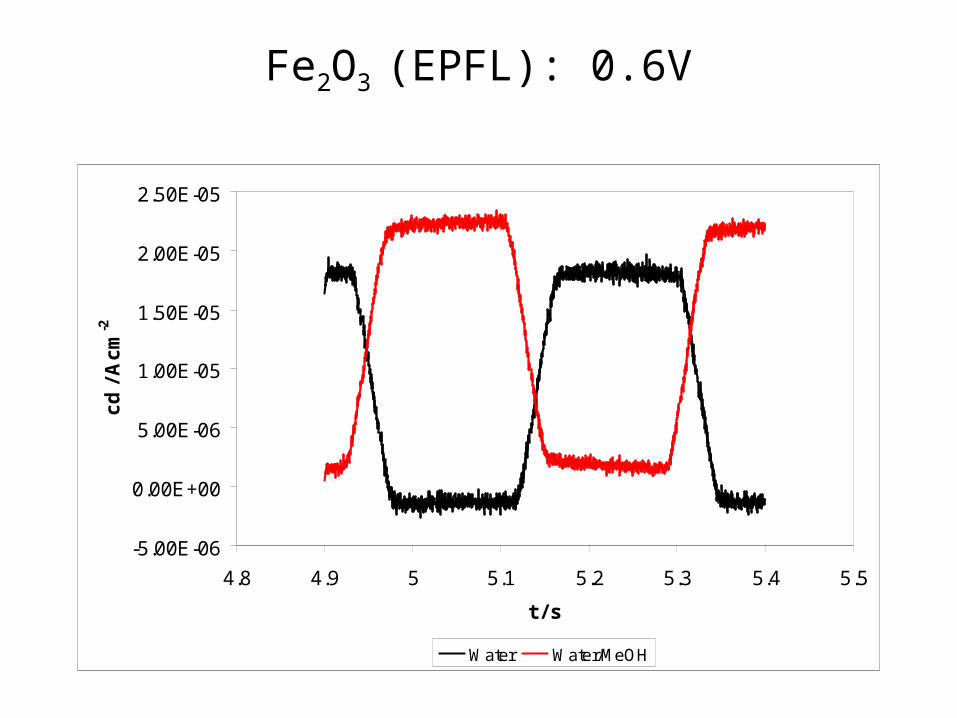
Fe2O3 (EPFL): 0.6V
-5.00E-06
0.00E+00
5.00E-06
1.00E-05
1.50E-05
2.00E-05
2.50E-05
4.8 4.9 5 5.1 5.2 5.3 5.4 5.5
t / s
cd
/ A
cm
-2
Water Water/MeOH
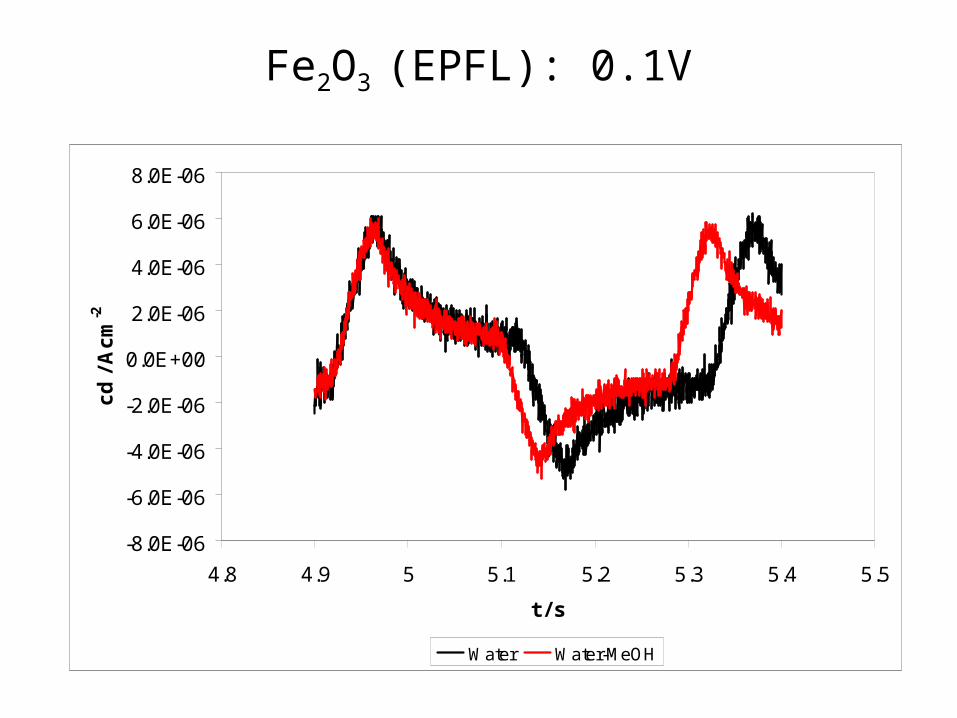
Fe2O3 (EPFL): 0.1V
-8.0E-06
-6.0E-06
-4.0E-06
-2.0E-06
0.0E+00
2.0E-06
4.0E-06
6.0E-06
8.0E-06
4.8 4.9 5 5.1 5.2 5.3 5.4 5.5
t / s
cd
/ A
cm
-2
Water Water-MeOH
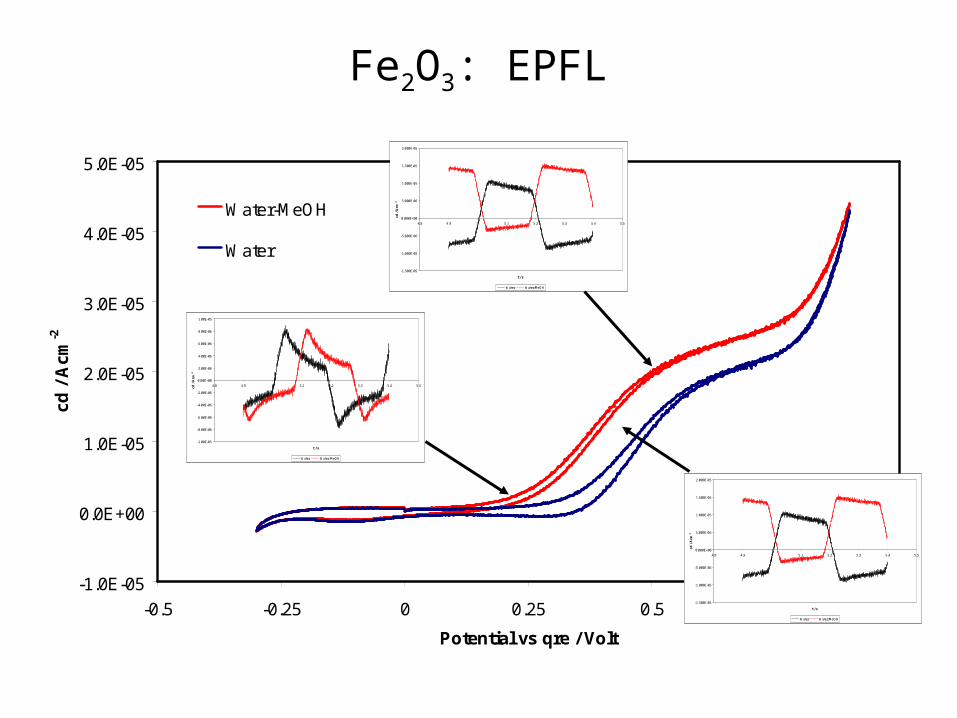
Fe2O3: EPFL
-1.0E-05
0.0E+00
1.0E-05
2.0E-05
3.0E-05
4.0E-05
5.0E-05
-0.5 -0.25 0 0.25 0.5 0.75 1
Potential vs qre / Volt
cd /
Acm
-2
Water-MeOH
Water-1.500E-05
-1.000E-05
-5.000E-06
0.000E+00
5.000E-06
1.000E-05
1.500E-05
2.000E-05
4.8 4.9 5 5.1 5.2 5.3 5.4 5.5
t / s
cd /
Acm
-2
Water Water/MeOH
-1.00E-05
-8.00E-06
-6.00E-06
-4.00E-06
-2.00E-06
0.00E+00
2.00E-06
4.00E-06
6.00E-06
8.00E-06
1.00E-05
4.8 4.9 5 5.1 5.2 5.3 5.4 5.5
t / s
cd /
Acm
-2
Water Water-MeOH
-1.500E-05
-1.000E-05
-5.000E-06
0.000E+00
5.000E-06
1.000E-05
1.500E-05
2.000E-05
4.8 4.9 5 5.1 5.2 5.3 5.4 5.5
t / s
cd /
Acm
-2
Water Water/MeOH

Conclusions
• Preliminary (and not concluded yet)
– In the absence of MeOH see cathodic “dark” current, even at 0.6 V.
– As applied potential is increased, the photocurrent becomes increasingly transient
– As applied potential is increased the cathodic “dark” current increases (relative to the photocurrent)
Photo-electrochemical Reactor Modeling:
Week 3 Update
Zachary Ulissi

Reactor Design: Original & Wedges

Reactor Design: Extra Post
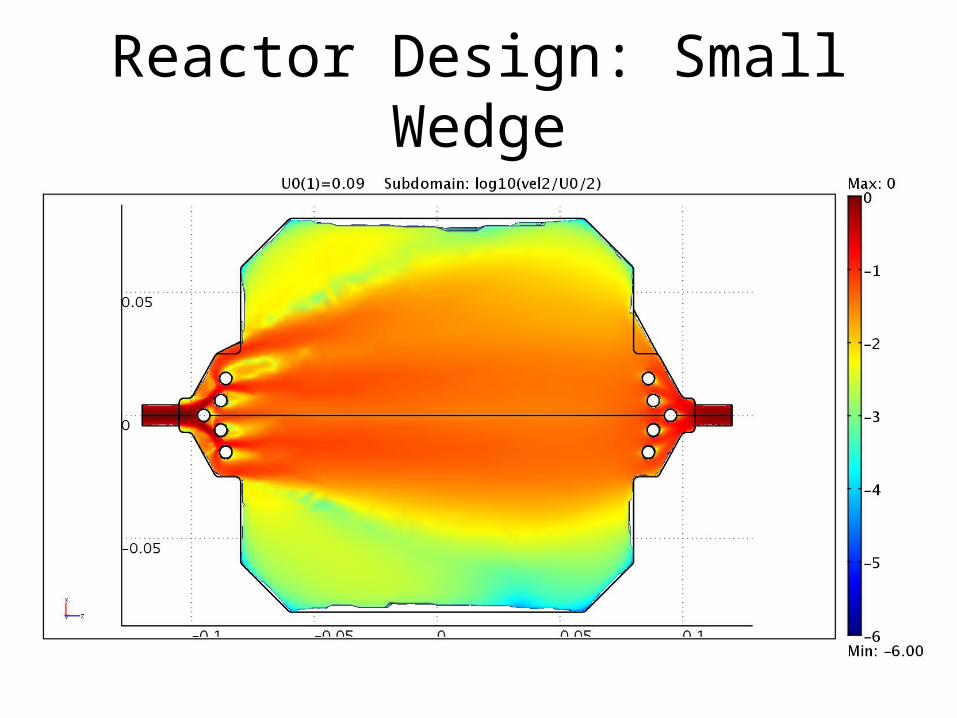
Reactor Design: Small Wedge
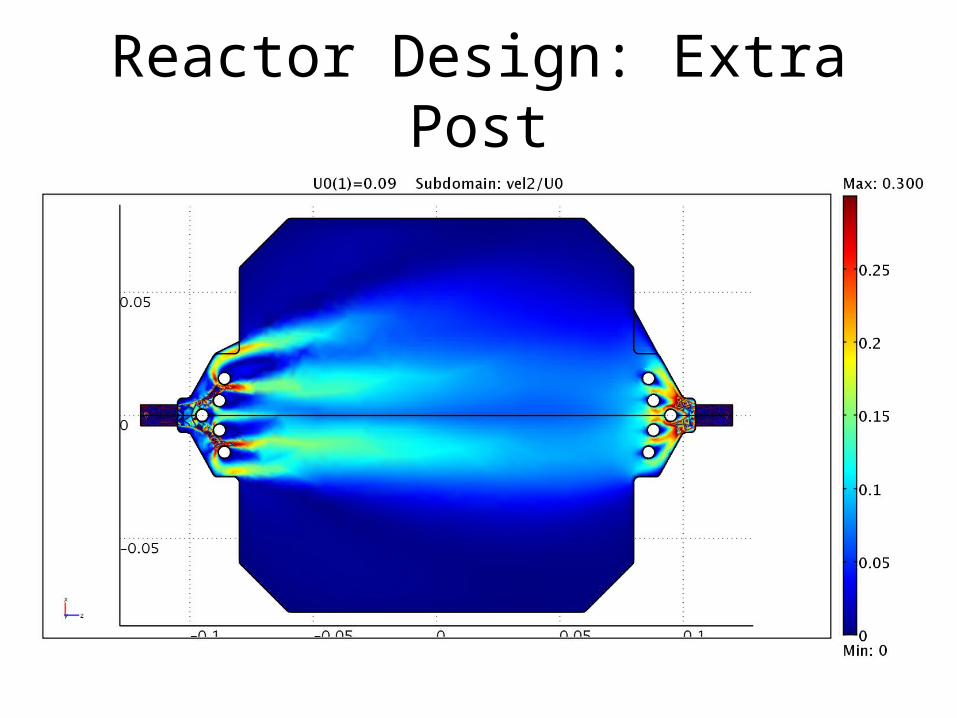
Reactor Design: Extra Post

Mass Transfer In the Laminar Regime
(300 ml/min liquid flow)
Goal: 2 A/m2

Mass Transfer Limit for Laminar Flow
Goal: 2 A/m2

Mass Transfer Limit for Laminar Flow
Goal: 2 A/m2

Insufficient Mixing!

Laminar Diffusion Completed