Solar Hot Water Supply Chain Market Analysis€¦ · hot water 61-70% Pool Heating 30-39% Market...
30
©2010 Navigant Consulting, Inc. Solar Water Heating Supply Chain Market Analysis Study for the City of Milwaukee SOLAR THERMAL ‘10 September 30, 2010 NCI Reference: 142304
Transcript of Solar Hot Water Supply Chain Market Analysis€¦ · hot water 61-70% Pool Heating 30-39% Market...

©2010 Navigant Consulting, Inc.
Solar Water Heating Supply Chain Market Analysis
Study for the City of Milwaukee
SOLAR THERMAL ‘10
September 30, 2010
NCI Reference: 142304
©2010 Navigant Consulting, Inc. 2
Disclaimer
This presentation was prepared by Navigant Consulting, Inc.1 for SOLAR THERMAL ‘10.. The work presented in this report represents our best efforts and judgments based on the information available at the time this report was prepared. Navigant Consulting, Inc. is not responsible for the reader’s use of, or reliance upon, the report, nor any decisions based on the report.
NAVIGANT CONSULTING, INC. MAKES NO REPRESENTATIONS OR WARRANTIES, EXPRESSED OR IMPLIED.
Readers of the report are advised that they assume all liabilities incurred by them, or third parties, as a result of their reliance on the report, or the data, information, findings and opinions contained in the report.
September 30, 2010
Content of Report
1. ‚Navigant‛ is a service mark of Navigant International, Inc. Navigant Consulting, Inc. (NCI) is not affiliated, associated, or in any way connected with Navigant International, Inc. and NCI’s use of ‚Navigant‛ is made under license from Navigant International, Inc.

©2010 Navigant Consulting, Inc. 3
Acknowledgements
NCI would like to thank the U.S. Department of Energy, We Energies, the City of Milwaukee, and the National Renewable Energy Laboratory for supporting this project. In addition, our team would like to thank all the industry experts that we
interviewed and all the survey respondents. Your input was valuable and had a big contribution to the study.
Acknowledgements
Available on:www.MilwaukeeShines.comwww.we-energies.com/REwww.navigantconsutling.comhttp://solaramericacities.energy.govwww.navigantconsulting.com
Copy of Presentation

©2010 Navigant Consulting, Inc.
NCI reviewed the SWH market and analyzed the opportunity for Milwaukee area manufacturers.
Scope of Work
NCI Scope of Work – SWH Market
Overview of the SWH Industry
1Overview of SWH System Types and
Costs
Overview of SWH System Components
and Supply Chain
2 3
4
Milwaukee Opportunities
Analysis
4
Milwaukee Case Study
SWH and Manufacturing
Incentives
5 6
Today’s presentation will focus on items 1, 3, and 4

©2010 Navigant Consulting, Inc. 5
After 33% average annual growth prior to 1981, the U.S. market declined. Since 1991, there has been a 6% compounded annual growth rate (CAGR).
U.S. Market » Total Shipments
*Data reported in 1000’s of sq.ft. MWth is calculated based upon an internationally agreed upon conversion factor of 0.7 kWth/m2.Source: International Energy Agency’s Solar Cooling and Heating Program, Solar Heating Worldwide 2008 Edition, Industry Interviews, Navigant Consulting, Inc. based on data from Energy Information Administration, Solar Thermal Collector Manufacturing Activities 2008 & Renewable Energy Annual. Annual installations domestic production and imports of low, medium and high temperature collectors.
Total U.S. Shipments of Solar Thermal Collectors
0
5,000
10,000
15,000
20,000
25,000
-
200
400
600
800
1,000
1,200
1,400
1,600 33% CAGR 6% CAGR
Sh
ipm
ents
(T
ho
usa
nd
s o
f sq
ft)
Sh
ipm
ents
(M
Wth
)

©2010 Navigant Consulting, Inc. 6
A small number of states dominate the SWH market.
U.S. Market » Shipments by State
• On the order of 35% of all new U.S. solar domestic water heating systems are installed in Hawaii.
• Six states continue to account for almost 70% of all domestic SWH systems.
• On the order of ~8,500 SWH systems were sold in the U.S. in 2006, and ~25,000 in 2009.
2009 U.S. Domestic SWH by State
Source: Navigant Consulting, Inc. based on interview with Les Nelson, SRCC, State Incentive Programs (CA, HI, FL)
AZ,
1000
CA,
1000
FL, 1000
HI, 4000
New
England
250
OR, 250
Mid-
Atlantic
250
ROUS,
400CO, 250 AZ,
1500CA,
1000
FL, 5000
HI, 8750
New
England
1500
OR, 500
Mid-
Atlantic
1500
ROUS,
5000
2006 U.S. Domestic SWH by State
8,500 Systems 25,000 Systems

©2010 Navigant Consulting, Inc. 7
Buildings with electric water heating in states that have high solar insolation and high electric rates will have the best payback with SWH.
U.S. Market » Regional Economics
0
5
10
15
20
25
30
AZ CA PA MO TX HI FL WI
Pay
bac
k T
ime
(Yea
rs)
Natural Gas
Electricity
Solar Water Heating Systems – Payback Time in Years

©2010 Navigant Consulting, Inc.
Heating and
hot water
61-70%
Pool
Heating
30-39%
Market Value by Use
8
The hot water and heating market represents nearly 70% of the market value, but only 16% of the area of collectors shipped.
U.S. Market » Market Segments
Source: Navigant Consulting, Inc. analysis based on data from: Industry Interviews, Energy Information Administration’s Solar Thermal and Photovoltaic Collector Manufacturing Activities 2008 and Renewable Energy Annual, and internal analysis. Note: Pool Heating System size was assumed to be 350-400sqft; Non-pool heating systems were assumed to be 50-64 sqft.
Heating
and hot
water
16%
Pool
Heating
84%
Area of Collectors
Shipped by Use
Total area shipped
17 mill Sq Ft
Total number of Systems shipped
64,000-82,000
Total Market Value
$260-$495 million
2008 Market Segmentation
Heating
and hot
water
51-61%
Pool
Heating
39-49%
Number of Systems
Shipped by Use

©2010 Navigant Consulting, Inc. 9
Even with optimistic U.S. market growth, the total value of the market remains modest between 2010-2017.
U.S. Market » Future Growth
$0
$500
$1,000
$1,500
$2,000
$2,500
$3,000
$3,500
$4,000
2010 2011 2012 2013 2014 2015 2016 2017
Mar
ket
Val
ue
($M
M)
BAU
High
Market Value Projection for the U.S. SWH Industry
Source: NCI Analysis. System Size: domestic SWH system 40sqft; Pool system 400 sqft;
CAGR 24% CAGR 15%
Market Growth AssumptionsBAU: Pool CAGR 5%; other SWH CAGR 21%High: Pool CAGR 8%; other SWH CAGR 32%

©2010 Navigant Consulting, Inc. 10
The U.S. SWH market size was $800MM in 2009. ~50% of the total value is material cost, which is dominated by collectors.
U.S. Market » Components
11%3%
9%
10%
16%
51%
Storage Tank
Heat exchanger and
circulator system
Sensors & Gauges
Valves
Tubing & Insulation
Collector and
Mounts
Solar Water Heating – U.S. Component Values
Source: RS Means, Navigant Consulting, Inc. based on data from Energy Information Administration, Solar Thermal and Photovoltaic Collector Manufacturing Activities 2008 and Renewable Energy Annual and Industry Interviews.
2009 SWH Component Market: $400MM
$204MM
$44MM
$12MM
$36MM
$40MM
$64MM

©2010 Navigant Consulting, Inc.
Europe,
12% United
States
Turkey
JapanAustralia
Brazil
IsraelIndiaOther
China,
75%
11
China overwhelmingly led 2008 installations with 75% of global installations….
Global Market » Shipments
Source: International Energy Agency Solar Heating and Cooling Programme, Solar Heat Worldwide – Market and Contributions to the Energy Supply 2008, Edition 2010. May, 2010.
Note: At the time of the writing of this report, complete global 2009 data was not yet available
Newly Installed Solar Thermal Collectors in 2008, by Area
GreeceAustria
France
UK
Cyprus
Switz.
Germany
, 43%
Other
©2010 Navigant Consulting, Inc.
Greece
Austria
France
UK
Cyprus
Switz.Germany,
42%
Other
12
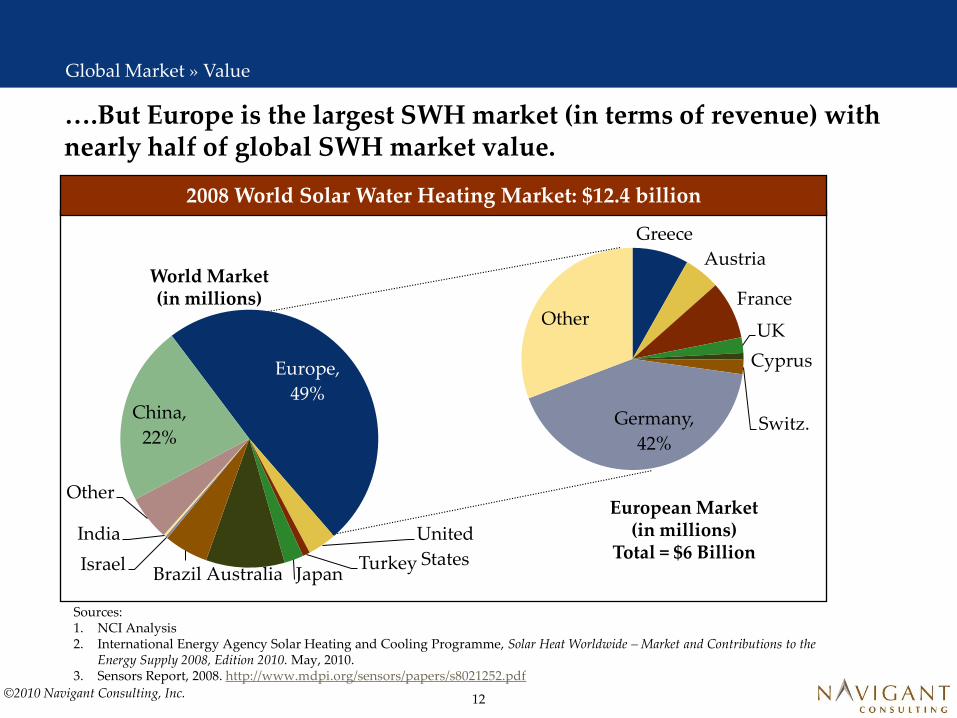
….But Europe is the largest SWH market (in terms of revenue) with nearly half of global SWH market value.
Global Market » Value
Sources: 1. NCI Analysis2. International Energy Agency Solar Heating and Cooling Programme, Solar Heat Worldwide – Market and Contributions to the
Energy Supply 2008, Edition 2010. May, 2010. 3. Sensors Report, 2008. http://www.mdpi.org/sensors/papers/s8021252.pdf
2008 World Solar Water Heating Market: $12.4 billion
World Market (in millions)
European Market (in millions)
Total = $6 Billion
Europe,
49%
United
StatesTurkeyJapanAustraliaBrazil
Israel
India
Other
China,
22%

©2010 Navigant Consulting, Inc. 13
A variety of drivers influence global SWH markets….
Drivers
• To counter high paybacks* in some areas, governments have established capacity-based (i.e. $/kWth) or performance-based (i.e. $/kWhth or $/MMBtu) incentives to encourage adoption.
Incentives
• Several jurisdictions (e.g. Hawaii, Israel, and Spain) have created SWH regulation.
• Regulation typically takes the form of building code requirements that SWH be included in a certain percentage of new construction.
Regulation
• To counter lack of consumer awareness, governments or national trade groups have conducted large marketing campaigns.
• Desire to be green.
Marketing
• Rural areas in some countries have no access to electricity or natural gas for water heating, so SWH systems are the only option for domestic hot water (beyond boiling over a fireplace).
Lack of Infrastructure
Key
Dri
ver
s
* Given large variations in price and insolation levels around the world, some markets have relatively short payback periods without incentives.

©2010 Navigant Consulting, Inc. 14
…. But they are countered by several barriers.
Barriers
• Most consumers are not aware that SWH is an option for their home or business – they mostly associate ‚solar energy‛ with photovoltaics.
Consumer Awareness
• SWH installation requires skills of plumbers and roofers, but many contractors are not trained in both.
Labor Supply
• Water heaters are typically replaced when one breaks. Since the building owner is not expecting this expense, they opt for a regular water heater with a lower up-front costs (~$1,000 vs. ~$6,000).
• Many potential customers focus solely on pay back and these are greater than 7 years in most of the US.
Economic
• Many incentive programs require system level SRCC OG-300 certification:
⁻ The certification is for a fixed set of components, so an installer would have to get certification for every variation in component choice.
⁻ The certification process currently takes 12 to 18 months.
Regulations
Key
Bar
rier
s

©2010 Navigant Consulting, Inc. 15
China and Europe lead global demand for SWH systems, but for different reasons.
Global Market » Drivers
Reasons for Leadership in Global SWH Demand
Eu
rop
e
• Continued long term support of SWH incentives. This helps industry plan long term
• Education campaigns. Awareness for SWH systems is lacking in most markets, butcampaigns raising awareness and pointing out the benefits of SWH systems create more customer demand.
• Performance based incentives. This encourages proper system design and sizing.• Policy. Some municipalities are requiring SWH systems to be installed per local
building codes.
Ch
ina
• The Chinese market accounts for most of the global installations.
• Low cost systems and limited availability of electricity and natural gas have driven industry growth.
− The Chinese government does not offer incentives for manufacturers or end users.
• There is often no need for freeze protection, thus helping to reduce system costs.

©2010 Navigant Consulting, Inc. 16
Below are some likely market trends impacting SWH.
Market Trends
Expected SWH Market Trends
Increased Commercial
Systems
• Larger commercial projects are expected to increase over the coming years.• American Recovery and Reinvestment Act (ARRA) funds are likely to
impact the industry only in the short term until funds are depleted. • The market will depend on available financing for projects
Reduced Natural Gas (NG) Prices
• NG prices drive electricity prices. Current forecasts are not as high as several years ago as a result of shale gas. Lower NG prices may not increase electricity prices as much as once expected.− A carbon tax/cap and trade could lead to an increase in electricity prices.
Reduced SWH System Prices
• As the industry matures and manufacturing volume grows, prices are likely to decline.
• Streamlining installation costs and time is expected as installers gain more experience. − Innovative components and preassembly will also reduce cost.
Stricter IncentiveReporting
Requirements
• More states may adopt strict incentive reporting requirements, similar to HI and CA, which may hinder market adoption by installers. − But, this will result in higher quality and better design installations.

©2010 Navigant Consulting, Inc.
Contractors have the highest margins across the value chain.
Financing (1. I Banks, 2. Pension Funds, 3. Financial Advisory/Placement); R&D
Water Pump Solar CollectorReceive & store
productAttain product
from distributor
Heat ExchangerMounting
SystemLimited technical
supportSite assessment
Expansion Tank Storage Tank Stores spare partsSystem
installation
ControlsLimited contractor
trainingSystem
maintenance
Isolation Valve Overhead
Backup WH
Tempering Valve
System Integrator
Distributor/Wholesaler*
ContractorComponent
ManufacturerValue Chain
Segment
40%-65%
25%* 40%15%-20%Margin
Solar Hot Water Value Chain
* Distributer/Wholesaler does not always exist as markets and channels to market are fragmented and small
SWH Component and Supply Chain » Margins
17
©2010 Navigant Consulting, Inc. 18
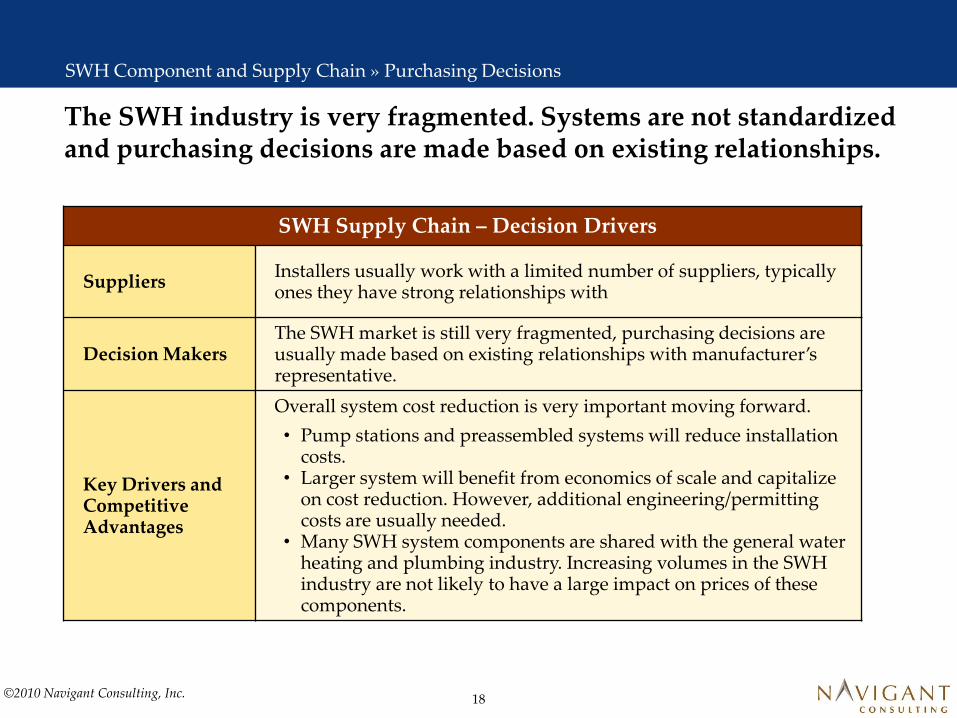
The SWH industry is very fragmented. Systems are not standardized and purchasing decisions are made based on existing relationships.
SWH Supply Chain – Decision Drivers
Suppliers Installers usually work with a limited number of suppliers, typically ones they have strong relationships with
Decision Makers The SWH market is still very fragmented, purchasing decisions are usually made based on existing relationships with manufacturer’s representative.
Key Drivers and Competitive Advantages
Overall system cost reduction is very important moving forward.
• Pump stations and preassembled systems will reduce installation costs.
• Larger system will benefit from economics of scale and capitalize on cost reduction. However, additional engineering/permitting costs are usually needed.
• Many SWH system components are shared with the general water heating and plumbing industry. Increasing volumes in the SWH industry are not likely to have a large impact on prices of these components.
SWH Component and Supply Chain » Purchasing Decisions

©2010 Navigant Consulting, Inc. 19
SWH components are usually manufactured/assembled locally with the exception of premium products that may be imported.
SWH Components and Supply Chain » International Exports
SWH Component Exports
US
Exports• Some US manufacturers sell into international markets such as South
America, the Caribbean, and the Pacific Rim
Exporting to Europe
• Selling into the high value European market is more difficult, mainly due to regulatory issues and shipping costs.
• The accepted certification in Europe is the Solar Keymark certification. To date no US manufacturer has gained this certification.
• The certification process and shipping costs and do not allow for US products to be price competitive with local manufacturers.
EU Exporting
• European companies have established themselves as exporters outside their domestic market.
• Successful products are high quality with advanced product design such as tanks, controllers, and pumps.
• European products have established SRCC OG300 certification for their products to be sold in the US.
• Companies also assemble and manufacture locally in the US
Ch
ina
Exporting
• Chinese products are mostly used in the local Chinese market. • Due to Chinese reputation for low quality products exports to EU and US
markets include many sub-components that are later repackaged and rebranded by local companies.

©2010 Navigant Consulting, Inc. 20
CH2M Hill assessed City of Milwaukee’s ability to develop a solar manufacturing sector and recommended entering the SWH market.
Milwaukee Area’s Interest in Solar Water Heating
• Commit to the solar products industry with solid public action
• Organize a working group of stakeholders
• Coordinate public and private interests
• Analyze situation and prioritize opportunities and actions
• Improve the Milwaukee product
• Invest to bridge gaps (specifically in local solar manufacturing initiatives, sites/buildings, and incentives)
• Commit resources to outreach and marketing− Develop an informational kit− Market to solar product companies (local/foreign, PV/SHW)
• Develop showcase projects to educate and create public enthusiasm
• Create highly visible solar product projects − Small PV assembly or SHW collector manufacturing operation− Local commercial, industrial, or small utility scale installation
Previous Recommendations and Next Steps

©2010 Navigant Consulting, Inc. 21
Milwaukee provides significant resources to its manufacturers.
Milwaukee’s Strengths
Existing manufacturing and engineering base
Manufacturing employs 21.5% of areas workforce, • the third highest percent of manufacturing
employees in the country.
Skilled manufacturing workforce A leader in the production of medical electronics, mining machinery, power trains, forgings, and internal combustion engines.
University engineering programs Milwaukee School of Engineering and University of Wisconsin are just two of the engineering schools in the Milwaukee area.
Abundant high-quality water supply
Access to abundant usable water as they are located on the coast of lake Michigan
Competitive electrical rates Wisconsin’s electrical rates for industrial and commercial sectors are below the national average.
Milwaukee Area’s Manufacturing Strengths

©2010 Navigant Consulting, Inc. 22
Milwaukee provides significant resources to its manufacturers.
Milwaukee’s Strengths
Good transportation/distribution channels and facilities
Lake Michigan provides water transport in addition to the railways and highway infrastructure that supports Milwaukee's distribution.
Public/private enthusiasm and support for creating solar product
Many stakeholders within the state support solar development.
Milwaukee-area companies already involved in solar product supply chain
Examples include: Caleffi, A.O. Smith, JCI, Hot Water Products, Helios, and Bubbling Springs
We Energies committed to developing solar generation
We Energies has funded studies with the hope of increasing awareness and popularity in renewable energy.
Federal, state and city incentives Milwaukee offers PACE Solar Loan Program; Wisconsin offers sales and property tax exemption on SWH systems, Federal incentives include tax credits and loan programs.
Milwaukee Area’s Manufacturing Strengths, Continued

©2010 Navigant Consulting, Inc.
NCI applied a multi-step screening process to identify the components most suited for Milwaukee manufacturers.
Screening Process
Potential Value of Component
Interest of Manufacturers
All SWH Components
The survey also provided a gauge of the interest of Milwaukee manufactures for each SWH component. Low interest components were filtered out.
Interviews with industry experts provided information regarding the potential value of each component. Low potential value components were filtered at this step.
Description of Screens
Manufacturing Capability
The manufacturing processes for each component were compiled and then compared with the capabilities of the Milwaukee manufactures as determined by the survey results. This filtered out components that could not easily be manufactured by a majority of the manufacturers.
Recommended Components
23

©2010 Navigant Consulting, Inc.
Milwaukee manufacturers have strong capabilities in machining, stamping, welding, and molding.
SWH Component
Mac
hin
ing
Sta
mp
ing
Ro
llin
g
Tu
rret
P
un
ch
Wel
din
g
(TIG
& M
IG)
Las
er
Cu
ttin
g
Cas
tin
g
Pip
e B
end
ing
San
db
last
ing
Pai
nti
ng
Co
atin
g
Mo
ldin
g
En
amel
C
oat
ing
SWH Water Storage Tank X X X X X X X X X X X X
Heat Exchanger for potable water X X X
Electronic Controls X
Fractional Horsepower Pumps X X
Pump Motor Flanges X X X
Hydronic Valves X X
Expansion Tank X
Air Elimination Valve X X
Piping X
Pipe Fittings X
Assembly – Pump Stations
Temperature Gauges X X X
Pressure Gauges X X X
Drain back Tank X X X X X X X X X X X X
Pipe Insulation
Dirt and Air Separators X X X
Thermal Mixing Valves X X X
Solar Thermal Collector X X X X X
Solar Thermal Collector - Frame X X X X
Collector Mounting system X X X X
Milwaukee Capabilities » MFG
Current Capabilities
High
Medium
Low
24

©2010 Navigant Consulting, Inc.
Milwaukee Manufacturers’ Interest for Producing SWH Parts
Milwaukee manufacturers are most interested in producing hot water storage tanks and collector mounts for the SWH industry.
Manufacturer’s Interest
0%
5%
10%
15%
20%
25%
30%
35%
40%
45%
50%
Per
cen
t o
f R
esp
on
den
ts
Currently Produce Interested in Producing Not Interested
Source: Survey conducted by Navigant Consulting in 2010.
25

©2010 Navigant Consulting, Inc. 26
Based on the Milwaukee area’s manufacturing capabilities & interest and the value-add ranking of the components, 7 components are worth considering for investment.
SWH Components
Assembly –Pump Station
Collector Mounting/ Racking System
Solar Thermal Collector Frame
Drain Back Tank
SWH Water Storage Tank
Expansion Tank
Heat Exchanger for Potable Water
Milwaukee Capabilities › Summary
SWH Component Capability Interest Value-Add
SWH Water Storage Tank Medium High MediumHeat Exchanger for Potable Water High High MediumElectronic Controls Low Low HighFractional Horsepower Pumps Low Low Low
Pump Motor Flanges Medium Low Low
Hydronic Valves Low Low Low
Expansion Tank High Medium Medium
Air Elimination Valve Medium Medium LowPiping Medium Low Low
Pipe Fittings Medium Low Low
Assembly – Pump Station Medium Medium High
Temperature Gauges Low Low Low
Pressure Gauges Medium Low LowDrain back Tank Medium High MediumPipe Insulation Low Low Low
Dirt and Air Separators Medium Low Low
Thermal Mixing Valves Medium Low Low
Solar Thermal Collector Medium High MediumSolar Thermal Collector Frame High High HighCollector Mounting/Racking System High High High
Collectors were not recommended due to their intricate design and high
price which allows them to be shipped from overseas
with a reduced cost impact

©2010 Navigant Consulting, Inc.
Component Picture Comments
Assembly –Pump Station
Pump stations are high value add components, as they reduce the installation costs of SWH systems which constitute nearly half of the total cost. The pump station is made up of manufactured parts and requires assembly, pipe brazing and a molded plastic case.
Collector Mounting/ Racking System
Collector racks are currently either made by the installer or the collector manufacturer. A metal fabricating shop could easily produce collector racks using metal stamping and machining.
Solar Thermal CollectorFrame
The collector frame is typically aluminum and serves to encase the absorbing pipes, glass and insulation. The fame could be made using sheet metal stamping.
Drain-back Tank Drain-back tanks are used to drain the water out of the solar collectors when there is not enough sun to prevent freezing in cold weather. The tanks are specific to the SWH market. The major manufacturing requirements are stamping, rolling, machining, and painting.
Below are components most suited to the Milwaukee manufacturers*.
Milwaukee Capabilities › Components for Manufacturers
27
*Based on value, capability and interest.

©2010 Navigant Consulting, Inc.
Component Picture Comments
SWH Water Storage Tanks
Although hot water storage tanks are currently made for the general water heating industry, the SWH industry requires tanks with two heat exchangers, one for the back up heater and one for the solar collectors. The major requirements for manufacturing are stamping, rolling, painting and assembly.
Expansion Tank Expansion tanks are another product that is currentlymade for the general water heating market, however with the growing use of glycol, expansion tanks for the SWH industry must be manufactured with tougher inner bladders to resist deterioration due to the glycol. The tanks can be manufactured by stamping and assembly.
Heat Exchanger for Potable Water
Heat exchangers are an important part of the SWH market and are required to be made out of stainless steel with the growing use of glycol. The plate exchangers can be manufactured using machining, stamping, rolling and welding.
Below are components most suited to the Milwaukee manufacturers*.
Milwaukee Capabilities › Components for Manufacturers
28
*Based on value, capability and interest.

©2010 Navigant Consulting, Inc. 29
Recommendations
• Milwaukee manufactures have the capabilities to manufacture high quality components for the SWH industry.
• The size and highly fragmented nature of this emerging market presents opportunities for new players, but also risks.
• Navigant recommends Milwaukee manufacturers concentrate on producing high value components that customers are willing to pay a premium for; such as components that are currently imported from Europe.
• In the past, Milwaukee manufacturers have focused on one customer. However, to be successful in the SWH market, NCI recommends targeting multiple customers.
− The SWH industry is more fragmented with smaller customers that could quickly exit and leave a manufacturer s with stranded assets.
NCI’s Assessment of the SWH Opportunity for Milwaukee Manufacturers
Navigant believes the SWH market could be an attractive opportunity for Milwaukee manufacturers.

©2010 Navigant Consulting, Inc.
Key Contacts
Key Contacts
Key Contacts
Key Contacts
Lisa FrantzisManaging DirectorBurlington, MA(781) 270-8314 [email protected]
Shalom GoffriManaging ConsultantBurlington, MA(781) 270-8374 [email protected]
Jay Paidipati Associate Director San Francisco, MA(415) [email protected]
Haley SawyerSenior ConsultantBurlington, MA(781) 270-8369 [email protected]
Tucker MoffatConsultantBurlington, MA(781) 270-8367 [email protected]
Other Report Contributors:Constantine Von WentzelWilliam Goetzler