SOLAR GENERATION - Greenpeace · SOLAR GENERATION SOLAR ELECTRICITY FOR OVER ONE ... between the...
52
2 SOLAR GENERATION SOLAR ELECTRICITY FOR OVER ONE BILLION PEOPLE AND TWO MILLION JOBS BY 2020 SEPTEMBER 2006
Transcript of SOLAR GENERATION - Greenpeace · SOLAR GENERATION SOLAR ELECTRICITY FOR OVER ONE ... between the...

2
SOLAR GENERATIONSOLAR ELECTRICITY FOR OVER ONE BILLION PEOPLE AND TWO MILLION JOBS BY 2020
SEPTEMBER 2006

22
Foreword . . . . . . . . 3
Executive Summary . 6
Part One: SOLAR BASICS 9
Part Two: THE SOLAR POWER MARKET . . . . . . . . . . . . . . . . . . . . . . . . . . . . . . . . . . 15
Part Three: THE SOLAR RACE . . . . . . . . . . . . . . . . . . . . . . . . . . . . . . . . . . . . . . . . 21
Part Four: THE SOLAR FUTURE . . . . . . . . . . . . . . . . . . . . . . . . . . . . . . . . . . . . . . . 29
Part five: THE RIGHT POLICY FOR THE SOLAR GENERATION . . . . . . . . . . . . . . . . . . . . . . . 47
Note: The currency quoted in this report is mainly the US dollar, with the euro in some sections on European countries.
CONTENTS

33
The Solar Generation which was assigned to be born in 2000 by Greenpeace and EPIA
as parents, now is growing up and about to go to school! In their lessons the Solar
Generation soon will be confronted that major challenges are facing our global society:
1. Employment and solar industry
2. Security of affordable energy supply
3. Poverty eradication
4. Climate change.
One of the lessons to be learned would probably be, that energy access has become a
prior issue to enable a sustainable and fair development for future generations.
The European Photovoltaic Industry Association (EPIA) and Greenpeace publish this
third edition of Solar Generation to update our understanding of the contribution that
solar power can make to the world’s energy supply. The report is a practical blueprint to
show that solar power is capable of supplying electricity to more than one billion peo-
ple within two decades, even if our overall electricity use doubles in that time.
Solar Generation aims to define the role that solar electricity will play in the lives of a
population born today and growing up into an important energy saving and consump-
tion group. The aim has been to examine how solar electricity will be perceived from
both the consumer and the business point of view within the timescale of one single
generation. The report highlights the benefits which solar energy offers to the world -
for the climate and environment, for social development, for economy and supply as
well as for industry and employment.
1. EMPLOYMENT AND SOLAR INDUSTRYSolar photovoltaics can and should play an important role within a sustainable energy
system of the future. Solar photovoltaics (PV) is one of the key technologies to generate
decentralised electricity for private households around the world, and the technology is
on its way. The market has grown by more than 40 % each year for almost one decade
now and the industry is investing large sums for building more production facilities
each year.
The further development of PV solar electricity out of niche markets to a common
mainstream technology will be crucial in 2006 and 2007. The PV market is still depen-
dent on policy. A clear industrial and political commitment from Governments to the
expansion of the PV industry implies that the current surge of activity in the solar elec-
tricity sector represents only a foretaste of the massive transformation and expansion
that this sector will experience in the coming decades.
FOREWORD

44
Due to adequate market support programs in a relatively small number of countries,
the first market rush has performed already. Long term foreseeable conditions for ex-
ample provided by the German feed in tariff act (EEG) lead the PV Solar electricity in-
dustry to become a remarkable business partner generating jobs. This is about to con-
tinue, when new investments on production facilities for solar silicon cells and modules
come on line between 2007 and 2010. The PV solar industry is at a crossroads – once the
supply bottleneck is passed, when new facilities are online to allow for major produc-
tion growth, the industry can become a serious player in the power sector. Phasing in PV
solar electricity will therefore require a shift from centralised to decentralised power
production, passing far greater control to individual consumers.
2. SECURITY OF AFFORDABLE ENERGY SUPPLYAs prices are skyrocketing for oil, gas and coal coming form countries with political in-
stability, the question of affordable, clean and secure energy supply becomes a question
of renewable energies. More and more people see that fossil fuels have a negative im-
pact on the world’s climate, the economy and everyday lives. Renewable energies and
energy efficiency can cover future energy needs, but seeing it from today’s eyes, a long-
term strategy is required in order to meet this target. The shift in the energy sector
takes a least one generation – the “Solar Generation”.
Security of energy Supply – both in terms of access to fuels and in terms of price stabil-
ity – is playing a growing role within the current global energy debate. If developing
countries base their growth on the former model of industrialised countries, our planet
will not be able to support this expansion in a sustainable way. The rapidly increasing
demand for fossil fuels in 2006 propelled the price of crude oil above US$75 per barrel
for the first time, demonstrating that in the future the price of oil will continue to rise
dramatically if supply is to meet this growing demand. Economies that have not pre-
pared themselves for diversification of their energy mix will be particularly affected by
these developments in world oil markets.
Solar power is a prime choice in developing an affordable, feasible, global power source
that can substitute fossil fuels in all climate zones around the world. The solar radiation
reaching the earth’s surface in one year is providing more than 10.000 times over the
yearly needs worldwide. Whereas large solar thermal power plants can harvest the sun
centralised in dry and hot desert like areas to generate electrical energy, PV solar elec-
tricity is to supply energy decentralised at the very place where consumed.
SolarGeneration III has been carried out as collaboration between the European Photo-
voltaic Industry Association (EPIA), Greenpeace International and the German Aero-
space Centre (DLR), the largest engineering research organisation in Germany. Projec-
tions on the future pattern of solar energy development have been extrapolated from a
larger study of global sustainable energy pathways up to 2050 conducted by DLR for
Greenpeace and the European Renewable Energy Council (EREC).
FOREWORD
55
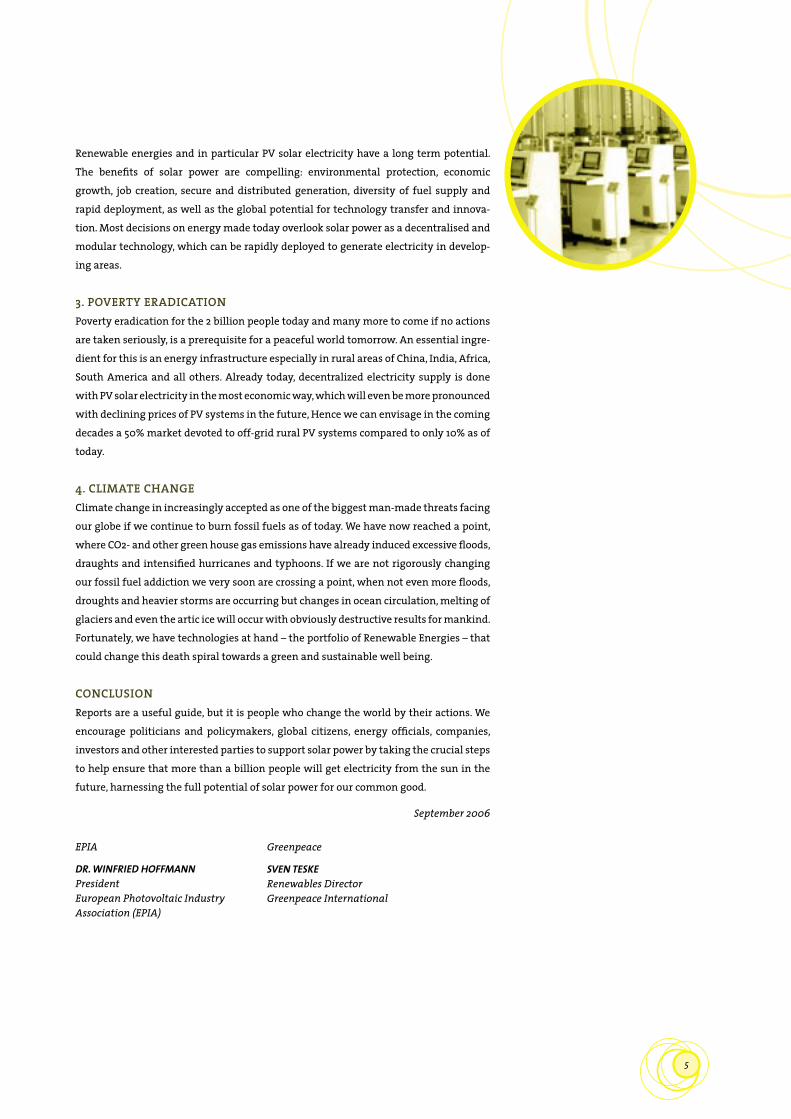
Renewable energies and in particular PV solar electricity have a long term potential.
The benefits of solar power are compelling: environmental protection, economic
growth, job creation, secure and distributed generation, diversity of fuel supply and
rapid deployment, as well as the global potential for technology transfer and innova-
tion. Most decisions on energy made today overlook solar power as a decentralised and
modular technology, which can be rapidly deployed to generate electricity in develop-
ing areas.
3. POVERTY ERADICATIONPoverty eradication for the 2 billion people today and many more to come if no actions
are taken seriously, is a prerequisite for a peaceful world tomorrow. An essential ingre-
dient for this is an energy infrastructure especially in rural areas of China, India, Africa,
South America and all others. Already today, decentralized electricity supply is done
with PV solar electricity in the most economic way, which will even be more pronounced
with declining prices of PV systems in the future, Hence we can envisage in the coming
decades a 50% market devoted to off-grid rural PV systems compared to only 10% as of
today.
4. CLIMATE CHANGEClimate change in increasingly accepted as one of the biggest man-made threats facing
our globe if we continue to burn fossil fuels as of today. We have now reached a point,
where CO2- and other green house gas emissions have already induced excessive floods,
draughts and intensified hurricanes and typhoons. If we are not rigorously changing
our fossil fuel addiction we very soon are crossing a point, when not even more floods,
droughts and heavier storms are occurring but changes in ocean circulation, melting of
glaciers and even the artic ice will occur with obviously destructive results for mankind.
Fortunately, we have technologies at hand – the portfolio of Renewable Energies – that
could change this death spiral towards a green and sustainable well being.
CONCLUSIONReports are a useful guide, but it is people who change the world by their actions. We
encourage politicians and policymakers, global citizens, energy officials, companies,
investors and other interested parties to support solar power by taking the crucial steps
to help ensure that more than a billion people will get electricity from the sun in the
future, harnessing the full potential of solar power for our common good.
September 2006
EPIA
DR. WINFRIED HOFFMANNPresident European Photovoltaic Industry Association (EPIA)
Greenpeace
SVEN TESKERenewables Director Greenpeace International

6
GLOBAL STATUS OF SOLAR PHOTOVOLTAICS
The solar electricity market is booming. In 2005 the cumulative installed capacity of solar photovoltaic (PV) systems around the world passed the landmark figure of 5000MWp. Global ship-ments of PV cells and modules have been growing at an average annual rate of more than 35% for the past few years.
Such has been the growth in the solar electricity industry that business only of the European PV industry in 2005 was worth more than Ð5 billion.
Competition among the major manufacturers has become in-creasingly intense, with new players entering the market as the potential for PV opens up. The worldwide photovoltaic industry, particularly in Europe and Japan, is investing heavily in new production facilities and technologies. At the same time, politi-cal support for the development of solar electricity has led to far-reaching promotion frameworks being put in place in a number of countries, notably Germany and Japan.
Since the first issue of Solar Generation was produced in 2001, the global market has continued to expand at the rate then pre-dicted. While some countries, such as the United States, have lagged behind in their expected development, others such as Germany have exceeded expectations. There is also evidence of new enthusiasm for solar power in some of its most promising potential world markets, such as China.
This the third issue of our global solar PV market forecast Solar Generation after its first appearances in 2001 and in 2004. Since then, our estimates have been proved to be realistic, even a little conservative, as the market grew faster. Compared to the first market forecast, the market volume in 2005 was three years ahead of schedule, and the market volume in 2010 is now ex-pected to be over 5500MW – twice our expectation in 2001.
This clear commercial commitment to the expansion of the PV industry means that the current surge of activity in the solar electricity sector represents only a foretaste of the massive transformation and expansion expected to occur over the com-ing decades. The target: realisation of a common goal of sub-stantially increasing the penetration of solar electricity into the global energy mix while also cutting greenhouse gas emis-sions.
Much work still needs to be done to turn potential into reality. One crucial step is to bring a far broader range of actors into the sector, particularly in the investment finance, marketing and retailing areas. At the same time, there is a need to transmit to as wide an ience as possible the message that solar electricity will bring socio-economic, industrial and environmental bene-fits to regions which proactively encourage its uptake.
SOLAR GENERATION: A PROJECTION TO 2025
Numerous qualitative analyses about the potential market de-velopment of solar photovoltaics have been published in the past. The aim here has been to compile a detailed quantitative knowledge base, coupled with clearly defined and realistic as-sumptions from which extrapolations can be made on the likely development of the solar electricity market up to 2025 and be-yond. The results which have emerged from this extensive anal-ysis point to a technology that is going to have a significant fu-ture impact on the everyday lives of the population born today.
Clearly, this transformation will not happen by itself. It will re-quire the far-reaching commitment of consumers and industry, as well as significant political will. The level of commitment needed, however, has already been demonstrated in those countries which show the greatest growth in their solar elec-tricity industries. We must learn from them and adapt and de-
EXECUTIVE SUMMARY
Annual MW installation capacity: Market versus “SolarGeneration” scenario predictions since 2001
Year 2001 2002 2003 2004 2005 2006 2007 2008 2009 2010
Market Result MW] 334 439 594 815 1397
SG I (2001) [MW] 321 408 518 659 838 1060 1340 1700 2150 2810
SG II (2004) [MW] 985 1283 1675 2190 2877 3634
SG III (2006) [MW] 1883 2540 3420 4630 5550

7
ploy the corresponding catalysts at a global level if solar elec-tricity is to fulfil the potential that we need it to.
SOLAR GENERATION: METHODOLOGY AND ASSUMPTIONS
Taking its lead from Japanese and German success stories, this EPIA/Greenpeace report looks forward to what solar power could achieve, given the right market conditions and an antici-pated fall in costs, over the first two decades of the twenty-first century. As well as projections for installed capacity and energy output it makes assessments of the level of investment re-quired, the number of jobs which could be created, and the cru-cial effect that an increased input from solar electricity will have on greenhouse gas emissions.
This scenario for 2025, together with an extended projection forwards to 2040, is based on the following core inputs:
• PV market development over recent years both globally and in specific regions
• national and regional market support programmes• national targets for PV installations and manufacturing capacity• the potential for PV in terms of solar irradiation, the availability
of suitable roof space and the demand for electricity in areas not connected to the grid.
The following assumptions have been used:MARKET GROWTH RATES: The average annual growth rate of the worldwide PV market up to 2009 is projected to be 35% and 26% between 2010 and 2015. Between 2016 and 2025, the market will slowly consolidate at a high level, growth rates going down to 19% until 2020 and 11% between 2021 and 2025. Although initial growth is expected to be fastest in the grid-connected sector, by 2010 the off-grid sector will play an increasing role.
ELECTRICITY GENERATION: Figures for the growth in global electric-ity demand up to 2020 (on which comparisons with expected PV development are based) have been taken from projections by the International Energy Agency. These show total world power demand increasing to 23,000 Terawatt hours (TWh) by 2025. DLR has been asked by Greenpeace International and EREC to conduct a study on global sustainable energy pathways up to 2050. The scenarios are based on the reference scenario from IEA World Energy Outlook (2004). The energy demand is split up in electricity and fuels. A low energy demand scenario has been developed based on the IEA reference scenario: For the year 2025, the energy efficiency scenario estimates a global electricity demand of 16.845 TWh in 2025.
CARBON DIOXIDE SAVINGS: Over the whole scenario period it is es-timated that an average of 0.6 kg of COc would be saved per kilowatt-hour of output from a solar generator.
PROJECTION TO 2040: For the period 2025-2040 a moderate annual growth rate of 15% has been assumed, as well as a very conser-vative lifetime of 20 years for PV modules.
The scenario is also divided in two ways – into the four main global market divisions (consumer applications, grid-connect-ed, remote industrial and off-grid rural), and into the regions of the world as defined in projections of future electricity demand made by the International Energy Agency. These regions are OECD Europe, OECD Pacific, OECD North America, Latin Ameri-ca, East Asia, South Asia, China, the Middle East, Africa and the Rest of the World.
SOLAR GENERATION: KEY RESULTS OF THE EPIA/GREENPEACE ANALYSIS
The key results of the EPIA/Greenpeace scenario clearly show that, even from a relatively low baseline, solar electricity has the potential to make a major contribution to both future glob-al electricity supply and the mitigation of climate change. These key results are shown in Table 1.
Table 1: Key results of the EPIA/Greenpeace analysis
2025 2020
Global Solar Electricity Output in 2025:
589 TWh 276 TWh
Global electricity demand in 2025 / 2020 (IEA projection)
2,5 % 1,3 %
Global electricity demand in 2025/20 with moderate energy efficiency (Greenpeace International Projection)
3,5 % 1,7 %
Global Solar Electricity Output in 2040:
4890 TWh
Global electricity demand in 2040 (IEA projection)
16 %
Global electricity demand in 2040 with moderate energy efficiency (Greenpeace International Projection)
24 %
Detailed Projections for 2025:
PV systems capacity 433 GWp 205 GWp
Grid-connected consumers world wide
290 million 135 million
Off-grid consumers 1.6 billion 900 million
Employment potential, full-time jobs world wide
3,2 million 1,9 million
Investment value
Average annual investment value 2005 - 2025
45,2 billion Ð 30,9 billion Ð
Investment value in 2025 102,5 billion Ð 76,1 billion Ð
Prices for grid connected PV systems; Reduction down to 2 ¤ per Wp
Cumulative carbon savings 2.204 million ton.COc
851,5 million ton.COc
Annual COc savings 353 million ton.COc
165,4 million ton.COc
8
SOLAR GENERATION: PV’S CONTRIBUTION TO GLOBAL ELECTRICITY SUPPLY
The EPIA/Greenpeace scenario shows that by 2025 PV systems could be generating approximately 589 TWh of electricity around the world. This means that enough solar power would be produced globally in twenty years’ time to satisfy the elec-tricity needs of 20% of the entire EU-25. Put another way, this would represent the annual output from 150 coal-fired power plants.
Global installed capacity of solar power systems would reach 433 GWp by 2025. About two thirds of this would be in the grid-connected market, mainly in industrialised countries. Assum-ing that 80% of these systems are installed on residential build-ings, and their average size is 3 kWp, the total number of people by then generating their own electricity from a grid-connected solar system would reach 290 million. In Europe alone there would be roughly 41 million people receiving their supply from solar electricity generation.
Although the key markets are now located mainly in the indus-trialised world, a global shift will result in a significant share – approximately 40 GWp – being taken by the developing world in 2025. Since system sizes are much smaller than grid connect-ed systems and the population density greater, this means that up to a billion people in developing countries would by then be using solar electricity. This would represent a considerable breakthrough for the technology from its present emerging sta-tus.
By 2040, the penetration of solar generation would be even greater. Assuming that overall global power consumption had by then increased from 16,000 to 36,500 TWh, the solar contri-bution would equal 16% of the world’s electricity output. This would define solar power as an established world energy source.
SOLAR GENERATION: PV’S CONTRIBUTION TO INDUSTRY, EMPLOYMENT AND THE ENVIRONMENT
For the solar production industry, global annual shipments of PV modules will rise from 1.4 GWp in 2005 to more than 55 GWp in 2025. This represents an increase by a factor of 40.
For job seekers in 2025, this will contribute considerably to-wards their employment prospects. On the assumption that more jobs will be created in the installation and servicing of PV systems than in their manufacture, the result is that by 2025 it is likely that more than 3.2 million full-time jobs will have been created by the development of solar power around the world. Most of those would be in installation and marketing.
By 2025 solar PV would also have had one other important ef-fect. In environmental terms, it would have reduced annual COc emissions by 353 million tonnes. This reduction is equivalent to the emissions from Australia AND New Zealand, or 150 coal-fired power plants. Cumulative COc savings from solar electricity generation between 2005 and 2025 will have reached a level of 2.2 billion tonnes.
POLICY RECOMMENDATIONS
In order to supply up to a billion people with solar electricity by 2025, and go on to achieve a global electricity share of 20% or more by 2040, a major shift in energy policy will be needed. Ex-perience over the past few years has demonstrated the effec-tiveness of joint industrial and political commitment to achiev-ing greater penetration of solar electricity into the energy mix at local, national, regional and global levels.
A number of key political actions are required.
• FIRSTLY, an annual world PV market growth of 5GWp+ by 2010 will only be achieved through the extension of best practice sup-port schemes, appropriately adapted to local circumstances, to encourage the uptake of solar electricity amongst consumers. The German and Japanese experiences highlight the impact, which such actions can have on the global photovoltaics indus-try.
• SECONDLY, the inherent barriers to the take-up of solar power, and the subsidies available to fossil and nuclear fuels, which currently penalise renewable sources, must be removed.
• THIRDLY, legally enforceable mechanisms must be implemented to secure and accelerate the new market for solar photovoltaics. Particularly in industrialised and emerging economies, the intro-duction or expansion of premium feed-in tariffs with guaranteed lifetimes must be a cornerstone of all future promotion mecha-nisms for solar electricity.
Our goal now must be to mobilise the necessary industrial, po-litical and end-user commitment to this technology and, more importantly, the service it provides. We must redouble our ef-forts to ensure that the generation born today benefits from all the socio-economic and environmental benefits that solar elec-tricity offers.
EXECUTIVE SUMMARY
PART ONE
SOLAR BASICS

10
THE SOLAR POTENTIAL
There is more than enough solar radiation available around the world to satisfy the demand for solar power systems. The pro-portion of the sun’s rays that reaches the earth’s surface is enough to provide for global energy consumption 10,000 times over. On average, each square metre of land is exposed to enough sunlight to produce 1,700 kWh of power every year.
The statistical information base for the solar energy resource is very solid. The US National Solar Radiation database, for exam-ple, has logged 30 years of solar radiation and supplementary meteorological data from 237 sites in the USA.
The greater the available solar resource at a given location, the larger the quantity of electricity generated. Tropical regions of-fer a better resource than more temperate latitudes. The aver-age irradiation in Europe is about 1,000 kWh per square metre and year, for example, compared with 1,800 kWh in the Middle East.
Figure 1.2 shows the estimated potential energy output from solar PV generators in different parts of the world. The calcula-tion used here takes into account the average efficiency of mod-ules and converters as well as the correct angle to the sun re-quired at different latitudes.
In terms of final demand, the report Solar Electricity in 2010 (European Photovoltaic Industry Association, 2001) shows that only the market segment comprising grid-connected PV roof-top systems, the most dynamic growth area in the market, has the potential to generate an average of 16% of electricity con-sumption across the OECD (industrialised) countries. This is roughly equivalent to today’s contribution from hydropower.
WHAT IS PHOTOVOLTAIC ENERGY?
“Photovoltaic” is a marriage of two words: “photo”, meaning light, and “voltaic”, meaning electricity. Photovoltaic technolo-gy, the scientific term used to describe what we use to convert solar energy into electricity, generates electricity from light.
We use a semi-conductor material which can be adapted to re-lease electrons, the negatively charged particles that form the basis of electricity. The most common semi-conductor material used in photovoltaic (PV) cells is silicon, an element most com-monly found in sand.
All PV cells have at least two layers of such semi-conductors, one positively charged and one negatively charged. When light shines on the semi-conductor, the electric field across the junc-tion between these two layers causes electricity to flow, gener-ating DC current. The greater the intensity of the light, the greater the flow of electricity.
A photovoltaic system therefore does not need bright sunlight in order to operate. It also generates electricity on cloudy days by a rationing of the energy output that depends on the density of the clouds. Due to the reflection of sunlight, days with slight cloud can even result in higher energy yields than days with a completely cloudless sky.
Generating energy through solar PV is quite different from how a solar thermal system works, where the sun’s rays are used to generate heat, usually for hot water in a house, swimming pool etc.
THE ADVANTAGES OF SOLAR POWER• The fuel is free. • There are no moving parts to wear out, break down or replace. • Only minimal maintenance is required to keep the system running.• The systems are modular and can be quickly installed anywhere.• It produces no noise, harmful emissions or polluting gases.
PV TECHNOLOGY The most important parts of a PV system are the CELLS which form the basic building blocks of the unit which collects the sun’s light, the MODULES which bring together large numbers of cells into a unit, and, in some situations, the INVERTERS used to convert the electricity generated into a form suitable for every-day use.
PART ONE: SOLAR BASICS
2500
200050
0
-50
1500
1000-150 -100 -50 0 50 100 150
[kW
h / (
m2 )]
Source: Gregor Czisch, ISET, Kassel, Germany
Figure 1.1: Global variations in irradiation
300
250
200
50
0
-50 150
100-150 -100 -50 0 50 100 150
[kW
h / (
m2 )]
Source: Gregor Czisch, ISET, Kassel, Germany
Figure 1.2: Energy potential from PV around the world

11
PV CELLS AND MODULESPV cells are generally made either from thick CRYSTALLINE SILICON, sliced from ingots or castings or from grown ribbons, or THIN FILM, deposited in thin layers on a low-cost backing. Most cell production (93.5% in 2005) has so far involved the former, while future plans will also have a strong focus on the latter. Thin film technology based on silicon and other materials is expect-ed to gain a much larger share of the PV market in the future. This technology offers several advantages such as low material consumption, low weight and a smooth appearance.
CRYSTALLINE SILICONCrystalline silicon is still the mainstay of most PV modules. Al-though in some technical parameters it is not the ideal material for solar cells, it has the benefit of being widely available, well understood and uses the same technology developed for the electronics industry. Efficiencies of more than 20% have been obtained with silicon cells in the laboratory. Solar cell efficiency in the production process and the thickness of the solar cell are important fields for optimisation. Wafers, very thin slices of silicon, are the basis for crystalline solar cells. Thinner wafers mean less silicon needed per solar cell and, as a consequence, lower costs per solar cell. The average thickness of the wafers could be reduced from 0.32 mm in 2003 to 0.24 mm in 2005. In the same period the average efficiency could be increased from 14% to 15%. By 2010 the aim is to reduce the wafer thickness to 0.15 mm while increasing its efficiency to 17.5%.
THIN FILMThin film modules are constructed by depositing extremely thin layers of photosensitive materials on a low-cost backing such as glass, stainless steel or a polymer foil. This results in lower production costs compared to the more material-inten-sive crystalline technology. This price advantage is counterbal-anced at the moment, however, by substantially lower efficien-cy rates and less experience of the modules’ lifetime performance.
Several types of thin film modules are commercially available at the moment. These are manufactured from amorphous sili-con (a-Si), copper indium diselenide (CIS, CIGS) and cadmium telluride (CdTe) as well as hybrid cells consjsting of an amor-phous silicon and a microcrystalline layer (a-Si/m-Si)
All of these have active layers in the thickness range of less than a few microns. This approach allows higher automation once a certain production volume is reached, while they all use an in-tegrated approach to the module architecture. This is less la-bour-intensive compared to the assembly of crystalline mod-ules by interconnecting a number of individual cells.
The temporary shortage of silicon offers the opportunity of in-creasing market shares for thin film technologies. EPIA expects a growth of the thin film market share up to 12%-20% of the to-tal PV market in 2010.
There are several new companies working on the development of thin film production based on a roll-to-roll approach. This ap-proach means that a flexible substrate, e.g. stainless steel, is coated in a continuous process with layers as used in one of the thin film technologies. The successful implementation of such a production method in the industrial environment offers op-portunities for a significantly higher throughput in the factory and lower costs can be expected as a consequence.
Among these three commercially available thin film technolo-gies, a-Si is the most important in terms of production and in-stallation (4.5% of the total market in 2005).
Multicrystalline thin film on glass (CSG) is a promising thin film technology which is now entering industrial production. Microcrystalline technology, in particular the combination of amorphous silicon and microcrystalline silicon (a-Si/m-Si), is another approach with encouraging results.
OTHER CELL TYPESCONCENTRATOR CELLS focus light from a large area onto a small area of photovoltaic material using an optical concentrator (such as a Fresnel lens), thus minimising the quantity of PV cells required. The two main drawbacks with concentrator sys-tems are that they cannot make use of diffuse sunlight, and must always be directed towards the sun with a tracking system.
Figure 1.3: Cell technology shares in 2005
ribbon-/sheetc-Si 2,9%CIS 0,2%
a-Si 4,7%
CdTe 1,6%
poly c-Si 52,3%
mono c-Si38,3%
Source: “Photon International”, March 2006

12
SPHERAL SOLAR TECHNOLOGY uses minute silicon beads bonded to an aluminium foil matrix. This offers a big cost advantage be-cause of the reduced requirement for silicon. Two companies, from Canada and Japan, are planning to commercialise mod-ules with spheral solar cells, with one of them already predict-ing a module efficiency of 11%. This represents an excellent ex-ample of the rapid technical progress in photovoltaics.
MODULESModules are clusters of PV cells incorporated into a unit, usually by soldering them together under a sheet of glass. They can be adapted in size to the proposed site, and quickly installed. They are also robust, reliable and weatherproof. Module producers usually guarantee a power output of 80% of the nominal power even after 20-25 years.
When a PV installation is described as having a capacity of 3 kWp(peak), this refers to the output of the system under stan-dard testing conditions (STC), allowing comparisons between different modules. In central Europe a 3 kWp rated solar elec-tricity system, with a module area of approximately 27 square metres, would produce enough power to meet the electricity demand of an energy-conscious household.
Table 1.1: Module and cell efficiencies
Type Typical module efficiency (%)
Single crystalline cell [mono c-Si] 12-15
Multicrystalline silicon [Multi c- 11-14
Amorphous silicon [a-Si] 5-7
Cadmium telluride [CdTe] 6-7.5
CIS 9-9.5
a-Si/m-Si 10
Source: International Energy Agency (IEA) Photovoltaic Power Systems Programme,
INVERTERSInverters are used to convert the direct current (DC) power gen-erated by a PV generator into alternating current (AC) compati-ble with the local electricity distribution network. This is essen-tial for grid-connected PV systems. Inverters are offered in a wide range of power classes, from a few hundred watts through the most frequently used range of several kWp (3-6 kWp) up to central inverters for large-scale systems with severalhundred kWp
COMPONENTS FOR STAND-ALONE PV SYSTEMSStand-alone (off-grid) PV systems contain a BATTERY, frequently of the lead acid type, to store the energy for future use. New high-quality batteries designed especially for solar applications with lifetimes of up to 15 years are now available. However the lifetime of the battery strongly depends on the battery man-agement and the user’s behaviour. The battery is connected to the PV array via a CHARGE CONTROLLER. The charge controller pro-tects the battery from overcharging or discharging, and can also provide information about the state of the system or en-able metering and pre-payment for the electricity used. If AC output is needed, an INVERTER is required to convert the DC pow-er from the array.
TYPES OF PV SYSTEM
GRID CONNECTEDThis is the most popular type of solar PV system for homes and businesses in the developed world. Connection to the local elec-tricity network allows any excess power produced to be sold to the utility. Electricity is then imported from the network out-side daylight hours. An inverter is used to convert the DC power produced by the system to AC power for running normal elec-trical equipment.
In countries with a premium feed-in tariff, this is considerably higher that the usual tariff paid by the customer to the utility, so usually all electricity produced is fed into the public grid and sold to the utility. This is the situation in countries such as Ger-many or Spain.
OFF-GRIDCompletely independent of the grid, the system is connected to a battery via a charge controller, which stores the electricity generated and acts as the main power supply. An inverter can be used to provide AC power, enabling the use of normal appli-ances without mains power. Typical off-grid applications are industrial applications such as repeater stations for mobile phones or rural electrification. Rural electrification means ei-ther small solar home systems (SHS) covering basic electricity needs or solar mini grids, which are larger solar electricity sys-tems providing electricity for several households.
HYBRID SYSTEMA solar system can be combined with another source of power - a biomass generator, a wind turbine or diesel generator - to ensure a consistent supply of electricity. A hybrid system can be grid connected, stand alone or grid support.
GRID-CONNECTED SYSTEMS:
The massive increase of PV markets worldwide is mainly due to the tremendous growth of grid-connected PV markets world-
PART ONE: SOLAR BASICS
Figure 1.4: Grid connected photovoltaic systems – how do they work?
1 PV array2 PV array combiner / junction box3 Grid tied inverter4 Import / Export meter5 Connection to the grid6 Load

13
wide. But it has to be emphasized that all PV market segments are growing. The principle of grid-connected PV systems is ex-plained in Figure 1.4.
The electricity (direct current) generated by the solar cells in the PV modules is transported via normal cables to an inverter. This electrical tool, which is often installed somewhere close to the house’s connection point to the public grid, transforms the di-rect current into alternating current in order to make it compat-ible with the electricity in the house and the public grid. Then there are two options:
1. In countries with an attractive feed-in tariff for solar electricity (see Feed-in tariffs) all electricity generated will be fed after the inverter directly into the grid. The electricity is thereby sold to the utility. The amount of electricity fed into the grid will be mea-sured by a meter in order to get the correct payment from the utility.
2. In countries without an attractive feed in tariff for solar electric-ity (e.g. a feed-in tariff below the usual consumer prices for elec-tricity) the electricity is in the first place used to cover the electric-ity demand in the house. By this the electricity bill can be reduced. Only if there is no or not enough demand within the house, the surplus electricity will be fed into the grid.
THE BENEFITS OF SOLAR POWERPhotovoltaic power systems offer many unique benefits above and beyond simple energy delivery. That is why comparisons with conventional electricity generation - and more particular-ly comparison with the unit energy costs of conventional gen-eration - are not always valid. If the amenity value of the energy service that PV provides, or other non-energy benefits, could be appropriately priced, the overall economics of PV generation would be dramatically improved in numerous applications, even in some grid-connection situations.
SPACE-SAVING INSTALLATIONPV is a simple, low-risk technology that can be installed virtu-ally anywhere where there is available light. This means that there is a huge potential for the use of roofs or façades on pub-lic, private industrial buildings. PV modules can be used as part of a building’s envelope, providing protection from wind and
rain or serving to shade the interior. During their operation such systems can also help reduce buildings’ heating loads or assist in ventilation through convection.
OTHER PLACES WHERE PV CAN BE INSTALLED include the sound barri-ers along communication links such as motorways. Also areas such as former mining land are suitable for large ground based PV systemsImproving the electricity network
For power companies and their customers, PV has the advan-tage of providing relatively quick and modular deployment. This can offset investment in major new plant and help to strengthen the electricity network, particularly at the end of the distribution line. Since power is generated close to the point of use, such distributed generators can reduce transmission losses, improve service reliability for customers and help to pro-vide peak power demand..
PROTECTING THE ENVIRONMENTSolar power involves none of the polluting emissions or envi-ronmental safety concerns associated with conventional gen-eration technologies. There is no pollution in the form of ex-haust fumes or noise during operation. Decommissioning a system is unproblematic.
Most importantly, in terms of the wider environment, there are no emissions of carbon dioxide - the main gas responsible for global climate change (see Climate Change and Fuel Choices) during the operation of a PV system. Although indirect emis-sions of COc occur at other stages of the life-cycle, these are sig-nificantly lower than the avoided emissions. Solar power can therefore make a substantial contribution towards internation-al commitments to reduce emissions of greenhouse gases and their contribution to climate change (see box The Climate Change Imperative), if governments adopt a wider use of PV in their national energy generation.
CLIMATE CHANGE AND FUEL CHOICES Carbon dioxide is responsible for more than 50% of the man-made greenhouse effect, making it the most important contrib-utor to climate change. It is produced mainly by the burning of fossil fuels. Natural gas is the most environmentally sound of
QUESTIONS ABOUT PHOTOVOLTAIC SYSTEMS 1. DO WE HAVE ENOUGH SILICON?The raw material for pure silicon used in the PV industry is abundantly available worldwide. 23% of the earth’s crust consists of silicon. How-ever, the process of producing the pure silicon needed for crystalline solar cells is complex. The period from planning a new silicon factory to its first output is approximately two years. The dynamic development of the PV market led to a shortage of silicon, and the silicon industry reacted to that by building up capacity. As soon as this new capacity is operational, the availability of silicon will improve significantly.2. IS IT POSSIBLE TO RECYCLE PHOTOVOLTAIC MODULES?Yes, this is possible. All components of a solar module can be recycled. The most valuable part are the solar cells itself, which can be recycled into new wafers, that are again the basis for new solar cells. But the aluminium frames, the glass and the cables can also be recycled.
3. WHEN DO YOU EXPECT PV TO BE COST COMPETITIVE?In many cases solar electricity is already cost competitive, especially for stand-alone applications where no access to the public grid is avail-able. In southern Europe solar electricity will be cost competitive with peak power from conventional energy sources before 2010.4. DO PV SYSTEMS GENERATE MORE ENERGY OVER THEIR LIFETIME THAN IS NEEDED FOR THEIR PRODUCTION?Yes they do. After approximately three years a PV system in southern Europe based on crystalline technology will have generated enough energy necessary to have produced and installed all its components. All energy produced after these three years is a surplus. Over the PV sys-tem’s lifetime of up to 30 years, it produces far more than the energy used to produce it.For a thin film system this value is even lower at approximately two years. It is expected that crystalline systems will also achieve equiva-lent energy production at two years, and that thin film systems will reduce the time further to one year.

14
the fossil fuels because it produces roughly half the quantity of carbon dioxide than coal, and less of other polluting gases. Nu-clear power produces very little COc, but has other major safety, security, proliferation and pollution problems associated with its operation and waste products.
The consequences of climate change are already apparent today.• The proportion of COc in the atmosphere has risen by about one third since
industrialisation began.• The number of natural disasters caused by the planet’s extreme weather has
trebled since the 1960s. According to insurance company Munich Re the re-sulting economic damage has increased by a factor of nine.
• Since 1875 recording has shown that the eight warmest years have been in the past 11 years.
• The mass of inland glaciers has been halved since industrialisation began.• Rainfall in temperate and northern latitudes has increased by 5% since 1950. • According to a UN study, the economic damage of climate change will reach
an annual figure of Ð300 billion by 2050. • Sea levels have risen by 10-20 centimetres in the last 100 years, 9-12 cm of this
in the last fifty years.• According to a WHO study, as many as 160,000 people are dying each year as
a result of climate change.• According to a study published in Nature (January 2004), a mid-range level of
warming could result in the extinction of 1,000,000 terrestrial species by the middle of this century.
Because of the time lapse between emissions and their effects, the full consequences of the climate change to which we have already committed the planet still have to emerge over the coming decades, bringing increased danger to the stability of the world’s economy and lifestyle. To effectively stem the green-house effect, emissions of COc must therefore be greatly re-duced. Scientists believe that, of the fossil energy reserves that
can be developed commercially today, only a quarter should be permitted to be burnt if ecosystems are not to go beyond the point at which they are unable to adapt.
ENABLING ECONOMIC DEVELOPMENTPV offers important social benefits in terms of job creation, en-ergy independence and rural development. Significantly, much of the employment creation is at the installation point (install-ers and service engineers), giving a boost to local economies.
Solar power can be easily installed in remote and rural areas, places that may not be targeted for grid connection for many years. Installations of transmission and distribution lines are avoided and remote communities can reduce reliance on ener-gy imports.
ENERGY PAYBACK A popular belief still persists that PV systems cannot “pay back” their energy investment within the expected lifetime of a solar generator, about 25 years. This is because the energy used, espe-cially during the production of solar cells, is seen to far out-weigh the electricity eventually generated.
Data from recent studies shows, however, that present-day sys-tems already have an energy payback time (EPBT) – the time taken for power generation to compensate for the energy used in production – of three to four years, well below their expected lifetime. With increased cell efficiency and a decrease in cell thickness, as well as optimised production procedures, it is fea-sible that the EPBT for grid-connected PV will decrease to two years or less for crystalline silicon modules and to one year or less for thin film modules.
PART ONE: SOLAR BASICS
THE CLIMATE CHANGE IMPERATIVEThe growing threat of global climate change resulting from the build-up of greenhouse gases in the earth’s atmosphere has forced national and international bodies into action. Starting from the Rio Earth Sum-mit in 1992, a series of targets have been set both for reducing green-house gas emissions and increasing the take-up of renewable energy, including solar power. Ten years later, however, the World Summit for Sustainable Development in Johannesburg still failed to agree on le-gally binding targets for renewables, prompting the setting up of a “coalition of the willing”. The European Union and more than a dozen nations from around the world expressed their disappointment with the Summit’s inaction by issuing a joint statement called The Way For-ward on Renewable Energy“. Later renamed the Johannesburg Renew-able Energy Coalition, more than 85 countries had joined by the time of the Renewables 2004 conference in Bonn and in Bejing at the end of 2005.The 1997 KYOTO PROTOCOL, now ratified by more than 150 nations, has meanwhile committed the world’s industrialised countries to reducing their emissions of greenhouse gases by an average of 5% from their 1990 levels. Kyoto could not come into force unless it was ratified by countries responsible for 55% of the industrialised nations’ greenhouse gas emissions. In June 2004 the proportion had reached 44%, with Russia’s 17% waiting to tip the balance. In October 2004, the Russian government ratified the Kyoto Protocol, which came into force on 16 February 2005. The first historic meeting of the Parties under the en-forced Kyoto Protocol took place in December 2005 in Montreal, Cana-da. This conference has acknowledged the urgency of the threat that climate change poses to the world’s poorest people, and eventually, to
all of us. The decisions made here have cleared the way for long-term action. The meeting agreed to do the following.• To start urgent negotiations on a new round of emission reduction
targets for the second commitment period of the Kyoto Protocol (2013-2017). A special group has been established to ensure that these negotiations are concluded “as soon as possible”. This is neces-sary to ensure the continuity of carbon markets, and to allow gov-ernments to put policies and measures in place to ensure that the new emission reduction targets are met.
• o start now to review and improve the Kyoto Protocol. Mandated under the existing treaty, this review will formally begin at next year’s meeting.
• A Five Year Plan of Action on Adaptation, to assist least developed countries to cope with the impacts of climate change. This pro-gramme will begin to address the fact that climate change already impacts the world’s poorest people, and that it will get much worse in the coming decades. It is the ethical, political, and legal responsi-bility of the industrialised countries to provide for this.
OTHER COMMITMENTS PROMPTED BY CLIMATE CHANGE INCLUDE:• The EUROPEAN UNION has set a target to double the proportion of
energy in the 15 Member States (before the 2004 enlargement) pro-vided from renewable sources. The aim is to achieve 12% renewable energy by 2010. This includes a specific target to achieve 3 GWp of PV capacity.
• The EU also has a target for 1 million solar roofs as part of its renew-able energy “Campaign for Take-Off” by 2010. Other countries around the world have similar targets for large numbers of grid-integrated PV systems (see “The Solar Race”).

PART TWO
THE SOLAR POWER MARKET

16
Solar power is booming. By the end of 2005 the cumulative in-stalled capacity of all PV systems around the world had reached the landmark figure of 5000MWp. This compares with a figure of 1,200MWp at the end of 2000, reflecting a more than quadru-pling of the total installed capacity in just five years. Shipments of PV cells and modules around the world have been growing at an average annual rate of more than 35% since 1998.
Such has been the growth in the solar electricity industry that business only of the European PV industry in 2005 was worth more than Ð 5 billion. Competition among the major manufac-turers has become increasingly intense, with new players en-tering the market as the potential for PV opens up. Although the expansion in recent years has been primarily in the grid-connected sector, the international PV demand side market di-vides up into four clear sectors. These market categories are used throughout this report.
DEMAND-SIDE MARKET SECTORS
CONSUMER GOODS AND SERVICES
APPLICATIONSSolar cells or modules are used in a wide range of consumer products and small electrical appliances, including watches, calculators and toys, and to provide power for services such as water sprinklers, road signs, lighting and phone boxes.
Typical of a new development is the use of PV to control AIR CON-DITIONING IN CARS. A small system integrated in the roof keeps the temperature inside at a constant level by operating a venti-lator when the car is parked, especially in the sun during sum-mertime. This results in lower peak temperatures inside the car and a much cheaper air conditioning system due to a lower re-quirement for power. Manufacturers may also be able to save on the cost of expensive heat-resistant materials in the vehicle’s interior.
MARKET DEVELOPMENTAs demand for a mobile electricity supply increases, it is likely to continue to grow, especially with the attraction of innovative low-cost solar electricity technologies such as organic solar cells.
GRID-CONNECTED SYSTEMS
APPLICATIONSPV can be installed on top of a roof or integrated into the roofs and facades of houses, offices and public buildings. Private houses are a major growth area for roof systems as well as for Building Integrated PV (BIPV). A 3 kWp solar electricity system in southern Germany delivers more than 2,700 kWh/year, suf-ficient to supply up to 100% of the electricity needs of an ener-gy-conscious household.
PV is also used increasingly as a design feature by architects, replacing elements in a building’s envelope. SOLAR ROOF TILES OR SLATES can replace conventional materials, for instance. Flexible thin film modules can even be integrated into vaulted roofs, while semi-transparent modules allow for an interesting mix-
ture of shading and daylight. PV can also be used to supply peak power to the building on hot summer days when air condition-ing systems need most energy, thus helping to reduce the max-imum electricity load.
If a solar electricity system is recognised as an integral part of a building, then the money spent on decorative materials for fa-cades, such as marble, can instead be invested in solar modules. Solar power doubles up as both an energy producer and a build-ing material. For prominent businesses it can provide the pub-lic face of their environmental commitment.
Distributed generation using solar facades or roofs can also pro-vide benefits to a power utility by avoiding grid replacement or by strengthening and potentially reducing maximum demand for conventional electricity, especially in countries with a high cooling load.
Large-scale grid-connected PV arrays have not so far become a major part of the market, mainly because of the difficulty in finding enough space in built-up areas. In Europe, however, it was estimated in 1998 that the potential for integrating PV into noise barriers then planned for construction alongside motor-ways and railways was as high as 1,100MWp. Sun-drenched desert regions present good opportunities in the longer term, especially as module prices continue to fall, for instance in the south west United States, Africa and Mongolia.
In Germany, large-scale ground-based systems in the megawatt class have become a new market in recent years. This offers a new source of income for farmers, who can rent their land to investors in large PV systems, with the advantage of secure rev-enue for at least 20 years.
MARKET DEVELOPMENTThis sector is the current motor of the PV boom, with most de-velopment taking place in the OECD countries. More and more national governments see PV as an important technology for the future and have already established, or are in the process of establishing, support programmes. While in 1994 only 20% of new capacity was grid-connected, this had grown to over 80% by 2005.
Examples of market stimulation programmes include Japan’s 70,000 rooftop proposal, the 100,000 roofs initiative in Germa-ny, the current Renewable Energy Law in Germany, and the mil-lion solar roofs programme in the United States, which includes both PV and solar thermal applications. These support pro-grammes will continue to provide an impetus for market growth for some years to come, and are likely to be followed by similar initiatives in other countries (see The Solar Race).
The other side of the grid-connected domestic market is the control which PV systems allow the consumer over their power supply. Not only is electricity generated at the point of demand but the consumer is effectively transformed into the operator of his or her own power station. As international power markets steadily liberalise this is likely to have increasingly important market implications.
PART TWO: THE SOLAR POWER MARKET

17
OFF-GRID ELECTRIFICATION
APPLICATIONSPV provides vital power for communities in the developing world who have no access to mains electricity. About 1.7 billion people around the world currently live without basic energy services.
PV can provide electricity to both consumption and production uses, where the majority of applications directly contribute to achieving the Millennium Development Goals. Domestic ener-gy systems provide high quality lighting and communication (radio/TV/internet) and productive energy systems such as for cooling, water pumping or powering tools are crucial motors for local development. PV has the potential to deliver much more than just electricity for lighting or improved health care, however. By providing the POWER SUPPLY FOR COMPUTERS, for ex-ample, it can enable people not just to have access to informa-tion through the internet, but to improve their economic situa-tion through better marketing of products or buying goods at more reasonable prices.
MARKET DEVELOPMENTApart from its clear social advantages, the economic justifica-tion for using PV is through the avoided fuel costs, usually ex-pensive diesel, or by comparison with the cost of extending the grid. For subsistence-level communities the initial stumbling block is often the capital cost of the system. But although nu-merous rural development programmes have been initiated in developing countries, supported both by multi- and bilateral assistance programmes, the impact has so far been relatively small.
There is also a powerful need to provide clean drinking water in the developing world. The World Health Organisation estimates that 10,000 children die each day from water-borne diseases. Solar-powered water purification systems and pumps are easily transportable, easy to maintain and simple to use and, as part of rural health initiatives, could be an important tool in the fight against disease.
OFF-GRID INDUSTRIAL
APPLICATIONSIndustrial uses for off-grid solar power are mainly in the tele-communications field, especially for linking remote rural areas to the rest of the country. In India, for example, more than a third of the PV capacity is devoted to the telecommunications sector. REPEATER STATIONS FOR MOBILE PHONES powered by PV or hy-brid systems (PV/diesel) also have a large potential.
Other applications include traffic signals, marine navigation aids, security phones, weather or pollution monitors, remote lighting, highway signs and waste water treatment plants.
MARKET DEVELOPMENTApart from avoided fuel costs, for example by totally or partly replacing a diesel engine, industrial PV systems offer high reli-ability and minimal maintenance. This can dramatically reduce operation and maintenance costs, particularly in very remote or inaccessible locations.
The demand for off-grid industrial PV systems is expected to continue to expand over the next decade and beyond, especially in response to the continued growth of the telecommunications industry. Mobile telephone masts and repeater stations offer a particularly large potential, especially in countries with low population densities. Providing communications services to ru-ral areas in developing countries as part of social and economic development packages will also be a major future market op-portunity for photovoltaics.
SUPPLY SIDE MANUFACTURE
SOLAR GRADE SILICON Silicon is the basic material needed today for the production of solar cells based on crystalline technology. Solar cells based on crystalline technology cover more than 90% of the world mar-ket, therefore the availability of sufficient silicon at reasonable prices is an essential precondition for a dynamic PV industry. Until recently the silicon industry produced electronic grade silicon exclusively for the semiconductor industry, according to its needs. Only a small fraction of the annual silicon supply was delivered to he PV industry, which represented a good way to level out the significant demand fluctuations from the semi-conductor industry. But the production of the electronic grade silicon never aimed at satisfying the demand from the PV in-dustry. With the dynamic growth of the PV industry in recent years the situation has changed. By now one third of the world-wide production of electronic grade silicon is used to produce solar cells. It is very obvious that this growing demand has changed the identity of the PV industry into a highly interest-
Figure 2.1: Ingots / Wafer Thickness and Cell Efficiencyin g/Wp depending on potential module production [MWp]
320300
180 170 160 150
200
240
17,517,016,516,0
15,014,514,0
2003 2004 2005 2006 2007 2008 2009 20101011121314151617181920
320
270
220
170
120
15,5
Cell Efficiency [%]Ingots/Wafer thickness [µm]
Source: EPIA, 2005
Figure 2.2: Estimated Silicon consumption in g/Wp and potential Module Production [MWp]
Estimated Silicon consumption [g/Wp]potential Module Production [MWp]
7441.200 1.318 1.600 1.889
3.125
4.000
2.588
14,012,0 11,0 10,0 9,0 8,0 7,5
8,5
0
4
8
12
16
2003 2004 2005 2006 2007 2008 2009 20100
5001.0001.500
2.0002.5003.0003.500
4.0004.500
Source: EPIA, 2005

18
ing client for the silicon industry. Several companies have be-gun to develop processes for producing solar grade silicon. Solar grade silicon is of lower quality than electronic grade silicon, since solar cells do not require as high a quality of silicon as semiconductor elements in the computer industry do. There-fore solar grade silicon can be produced at lower cost. But the development of the solar grade silicon production process and the construction of the first factories still needs time. The sili-con industry is currently building up capacity to produce solar grade silicon which will be exclusively available to the PV in-dustry.. But until all the new planned production facilities for solar grade silicon are operational the PV industry is competing with the semiconductor industry for the currently limited sili-con available on the market.
It is expected that in 2008 the availability of solar grade silicon for the PV industry will lead to a much more relaxed situation on the silicon market.
SOLAR CELL AND MODULE PRODUCTIONIn 2005 the investment in new plant in order to manufacture solar cells and modules exceeded Ð800 million. Also in 2005, the PV industry raised more than Ð1.5 billion on capital markets over 27 recorded financial transactions (source: Marketbuzz 2006 .
These numbers underline the clear dynamic which the PV in-dustry is developing in order to quickly expand supply in this world market.
In previous years the manufacture of solar cells and modules was concentrated in three key areas – Europe, Japan and the United States. The most recent leading player is China.
The shipment numbers presented in this chapter are based on the Photon International survey published in March 2006. In their introduction the authors admit that the data they received from the producers in many cases seemed to be too optimistic. The EPIA estimation for 2005 solar cell shipment is1400MWp, which corresponds to 77% of the total world shipment of 1818MWp stated by Photon International. For this reason all data with the unit MWp given in the following market survey correspond to 77% of the data published by Photon Internation-al. The evident drawback of this procedure is that the market share of those companies and countries/regions that contrib-uted correct numbers to the survey has been underestimated.
Japan still leads the world, with solar cell shipments reaching 635MWp in 2005. This corresponds to 45.3% of total world pro-duction. Europe came second in 2005 with 397MWp, corre-sponding to 28.3% of world production. Production in the United States reached 119MWp, corresponding to 8.5% of world produc-tion. The new player China reached 116MWp, corresponding to 8.3% of world production. The rest of the world, with its key players in other Asian countries (e.g. Motech in Taiwan with 46MWp in 2005) and India, produced 133MWp in 2005. It is strik-ing that in 2005 India dramatically lost half of its market share compared to 2004 and was the only country to experience a de-
crease in solar cell production in 2005. Overall, the growth of global PV shipments since 1995 can be seen in Table 2.1.
The leading manufacturers of solar cells can be seen in Table 2.2. Although until a few years ago the market was dominated by BP Solar, a subsidiary of the multinational oil company, this situation has radically changed with the entry of new Japanese and European players. In 2005, the two leading producers of PV cells/modules were Sharp (Japan) and Q-Cells (Germany). Com-pared to the previous year Sharp has lost roughly 2% of its mar-ket share (23.5% in 2005) while Q-cells, the new number two in the ranking, increased its market share by more than 50% and in 2005 produced about 9% of the world’s total cell shipments. A breakdown of the main companies’ involvement in regional and country markets can be seen in Table 2.2.
Europe has seen an expansion in production from traditional cell producers such as Schott Solar, which increased its cell pro-duction from 44MWp in 2003 to 63MWp in 2005, and Isofoton, which increased from 35MWp in 2003 to 40.8MWp in 2005. New players in the market are also showing impressive growth rates. The German company Q-Cells, for example, expanded its production from 28MWp (2003) to 127MWp (2005), while Deutsche Cell expanded from 17MWp (2003) to 29MWp (2005).
An important issue for manufacturers, especially smaller com-panies who do not have the backing of a multinational parent, is being able to match the opening of new production capacity with expected demand. Investors need a planning horizon that goes beyond a typical factory’s write-off period of five to seven years. Some smaller companies have nonetheless been able to obtain investment from public share ownership, often through one of the increasing number of green investment funds. This is why the relative stability of systems like the German renew-able energy law (see Part Three: The Solar Race) has proved cru-cial to business commitment. In anticipation of a flourishing market, Germany has seen a steady increase in both solar cell and module manufacture from 1995 onwards. During the peri-od of the 100,000 roofs programme, from 1999 to 2003, more than Ð1 billion was invested in new production facilities. Fur-ther encouraged by the Renewable Energy Law, updated in 2004, production of PV cells increased from 32MWp (2001) to 312MWp (2005) (Source: BSW) and it is anticipated that cell pro-duction capacity will increase to 500MWp by the end of 2006.
This reducing factor was introduced by EPIA in order to level out the sometimes over-optimistic shipment data provided by some of the cell producers. However it is evident that by this method that the production of those companies that provided correct shipment data to the survey has been underestimated.
MANUFACTURING AND OPERATING COSTS
The cost of manufacturing both solar cells and modules and other components has been falling steadily. As a result, the price of PV systems has fallen by an average of 5% per annum over the last 20 years. It is expected that this rate of price de-crease can be maintained in the future when as the shortage of silicon is over. The shortage of silicon and its consequence of
PART TWO: THE SOLAR POWER MARKET

19
Table 2.1: PV cell manufacture – leading producers by region
Total shipments in 2005 Growth from 2003 Leading producers Shipments in 2005
Europe 397 MWp 96% Q-Cells (Germany) 127.6 MWp
Schott Solar(Germany) 63.1 MWp
Isofoton (Spain) 40.8 MWp
Deutsche Cell (Germany) 28.9 MWp
Photowatt (France) 25.1 MWp
Ersol (Germany) 15.4 MWp
Scancell (Norway) 15.4 MWp
Shell (Germany) 13.1 MWp
BP Solar (Spain) 13.0 MWp
Sunways (Germany) 12.3 MWp
Japan 635 MWp 73.8% Sharp 292 MWp
Kyocera 109.3 MWp
Mitsubishi Electric 77 MWp
Kaneka 16 MWp
Sanyo 96.3 MWp
United States 119 MWp 23.6% Shell Solar 32.3 MWp
United Solar 16.9 MWp
First Solar 16.2 MWp
BP Solar 15.8 MWp
GE 13.9 MWp
Evergreen 10.8 MWp
Schott Solar 10.0 MWp
China 116 MWp 1200% Ningbo Solar Cell Factory 19.25 MWp
Shenzhen Topray Solar 15.4 MWp
Suntech Power 63.1 MWp
Rest of the World 133 MWp Motech (Taiwan) 46.2 MWp
BP Solar (Australia) 27.1 MWp
E-Ton Dynamics 10.8 MWp
BP Solar (India) 10.2 MWp
Note: This table includes manufacturers with shipments over 10MWp in 2005 Source: Photon 03/2006 Note: all data given in the table represent 77% of the value given in the Photon International Survey.
Table 2.2: Growth in world PV cell production 1996-2005 (MWp)
Region 1996 1997 1998 1999 2000 2001 2002 2003 2004 2005
Japan 21.20 35.00 49.00 80.00 128.60 171.22 251.07 363.91 604 635
Europe 18.80 30.40 33.50 40.00 60.66 86.38 135.05 193.35 329 397
US 38.85 51.00 53.70 60.80 74.97 100.32 120.60 103.02 138 119
China 116
ROW 9.75 9.40 18.70 20.50 23.42 32.62 55.05 83.80 38 133
Total 88.60 125.80 154.90 201.30 287.65 390.54 561.70 744.08 1100 1400
Source: PV News, Photon International, IEA PVPS (except 2005)

20
the rise in material costs has the effect that at present the 5% price decrease per annum is not being realised. Prices for PV systems vary between countries and according to the level of market development in different regions of the world, but an average price estimate for a turnkey solar electricity system of a few kWp capacity would be Ð6000/kWp for grid-connected systems and about Ð8,500 for stand-alone systems. This would result in life-cycle running costs for solar electricity ranging from Ð0.19/kWh up to Ð1/kWh, depending on the available in-solation and financial assumptions. These costs make PV an economically advantageous choice in a large variety of applica-tions where no mains electricity is available.
By contrast, the grid-connected market must still depend for the moment on government incentive programmes. In Japan, how-ever, where subsidies were cut dramatically by 50% in March 2004 and to almost zero in 2006, the level of applications for PV systems to the New Energy Foundation continued to remain at the same level in the immediate aftermath of the cut. This sug-gests that the market has already reached a substantial level of sustainability as a result of the former incentive programmes, a pattern that can be expected to repeat itself in other countries with expanding markets.
As with any technology, the development of a learning curve leads to cost reductions. In the case of PV the cost decrease is expected to be around 20% every time the total installed capac-ity is doubled.
TECHNOLOGY IMPROVEMENTS
The production of PV cells is constantly improving as a result of both technology advances and changing industrial processes. About 70% of installation costs are represented by the module, 15% by the inverter and 15% by balance of system components and assembly of the unit.
As larger PV cell and module factories come into operation, the degree of AUTOMATION IN THE PRODUCTION PROCESS is increasing. A number of European solar cell producers have developed high-ly automated solar cell plants since 2001. The fact that the 1999 cell production capacity in Europe was just 80MW, while at the end of 2005 production capacity in Germany alone was up to 500MWp clearly indicates the potential for automation and ma-jor improvements in the production process.
Conventional methods of CELL PRODUCTION produce a wafer from bulk silicon crystal through a cost-intensive and material-ineffi-cient sawing process. Losses during the transition from ingot to solar cell reach about 50%, mainly in the form of saw slurry. One way of eliminating the sawing step is to grow ribbons of multi-crystalline silicon that are already wafer thin and the correct width for use as PV cells. This method is being pioneered by Schott Solar at one of its factories. EPIA has adopted the following tech-nological aims in this field for 2010 (with its projection for 2020):• Material (Si) consumption for mono-crystalline silicon from 16
gram per Watt peak [g/Wp] to 10 g/Wp (continuing to 8 g/Wp)• Ribbons from 10 g/Wp to 6 g/Wp (continuing to 5 g/Wp)• Wafer thickness from 300 mm to 150 mm (continuing to 100 mm)• Kerf loss in the sawing process from 250 mm to 160 mm (con-
tinuing to 150 mm)
Since the first solar cell was developed 50 years ago MAJOR IMPROVEMENTS IN EFFICIENCY have been achieved. With much po-tential still to be exploited, EPIA has defined the following aims for the European PV industry up to 2010 (2020):• Efficiency increase for mono-crystalline silicon from 16.5% to
20% (continuing to 22%)• Efficiency increase for multi-crystalline silicon from 14.5% to
18% (continuing to 20%)• Ribbon efficiency from 14% to 17% (continuing to 19%)
Improvement in the LIFETIME OF SOLAR MODULES is another road to further reducing solar electricity prices. EPIA’s aim is to expand their lifetime to 35 years, for example by longer lifetime encapsu-lation material or new module architectures.
THIN FILM CELLS, constructed by depositing extremely thin layers of photosensitive materials on a low-cost backing, offer the po-tential for significant cost reductions. Firstly, material and energy costs should be lower because much less semiconductor material is required and much lower temperatures are needed during manufacture. Secondly, labour costs are reduced and mass pro-duction prospects improved because, unlike thick crystalline technologies where individual cells have to be mounted in frames and wired together, thin films are produced as large, complete modules.EPIA has defined two targets for thin film technology up to 2010 (2020):• Thin film aiming at efficiencies between 10% and 12% (a-Si/
mc-Si, CIS and CdTe) (continuing to 15%)• Building integrated PV (BIPV) with low cost per m2, price re-
duction of 50% (continuing an additional 50%)
PART TWO: THE SOLAR POWER MARKET

PART THREE
THE SOLAR RACE
22
As the vast potential of solar power as a clean energy source begins to emerge, national governments around the world have started to support its development through research and mar-ket support. Pursuing their regional and international commit-ments to combat the effects of climate change, a number of countries have given strong backing to an emerging solar mar-ket. Importantly, they have also persuaded their general public that there are important social and environmental benefits to be captured.
The argument in countries like Japan, Germany and the USA is straightforward: by offering market incentives for the installa-tion and operation of solar arrays, a dynamic relationship is cre-ated between market promotion and industrial growth, even-tually encouraging a flourishing manufacturing base and export potential. The environmental dividend is a cleaner plan-et. These are the leaders in a solar race that will soon see others joining the pursuit.
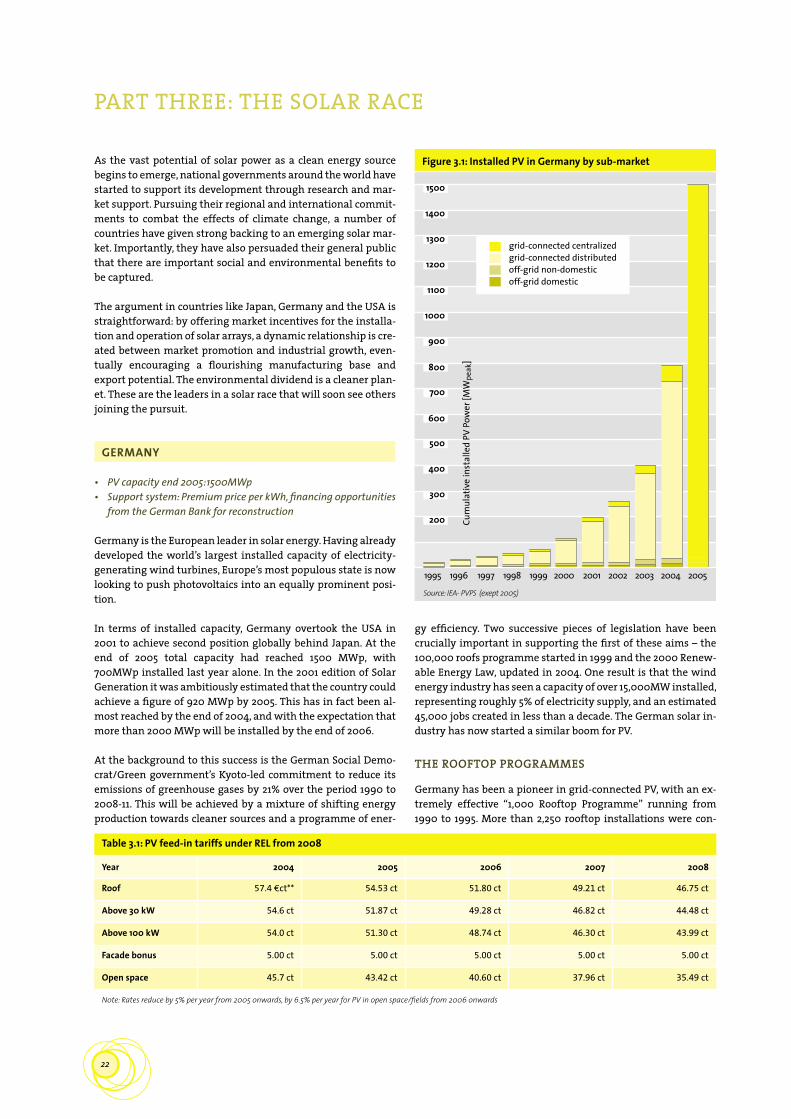
GERMANY
• PV capacity end 2005:1500MWp • Support system: Premium price per kWh, financing opportunities
from the German Bank for reconstruction
Germany is the European leader in solar energy. Having already developed the world’s largest installed capacity of electricity-generating wind turbines, Europe’s most populous state is now looking to push photovoltaics into an equally prominent posi-tion.
In terms of installed capacity, Germany overtook the USA in 2001 to achieve second position globally behind Japan. At the end of 2005 total capacity had reached 1500 MWp, with 700MWp installed last year alone. In the 2001 edition of Solar Generation it was ambitiously estimated that the country could achieve a figure of 920 MWp by 2005. This has in fact been al-most reached by the end of 2004, and with the expectation that more than 2000 MWp will be installed by the end of 2006.
At the background to this success is the German Social Demo-crat/Green government’s Kyoto-led commitment to reduce its emissions of greenhouse gases by 21% over the period 1990 to 2008-11. This will be achieved by a mixture of shifting energy production towards cleaner sources and a programme of ener-
gy efficiency. Two successive pieces of legislation have been crucially important in supporting the first of these aims – the 100,000 roofs programme started in 1999 and the 2000 Renew-able Energy Law, updated in 2004. One result is that the wind energy industry has seen a capacity of over 15,000MW installed, representing roughly 5% of electricity supply, and an estimated 45,000 jobs created in less than a decade. The German solar in-dustry has now started a similar boom for PV.
THE ROOFTOP PROGRAMMES
Germany has been a pioneer in grid-connected PV, with an ex-tremely effective “1,000 Rooftop Programme” running from 1990 to 1995. More than 2,250 rooftop installations were con-
PART THREE: THE SOLAR RACE
Table 3.1: PV feed-in tariffs under REL from 2008
Year 2004 2005 2006 2007 2008
Roof 57.4 Ðct** 54.53 ct 51.80 ct 49.21 ct 46.75 ct
Above 30 kW 54.6 ct 51.87 ct 49.28 ct 46.82 ct 44.48 ct
Above 100 kW 54.0 ct 51.30 ct 48.74 ct 46.30 ct 43.99 ct
Facade bonus 5.00 ct 5.00 ct 5.00 ct 5.00 ct 5.00 ct
Open space 45.7 ct 43.42 ct 40.60 ct 37.96 ct 35.49 ct
Note: Rates reduce by 5% per year from 2005 onwards, by 6.5% per year for PV in open space/fields from 2006 onwards
Figure 3.1: Installed PV in Germany by sub-market
200
300
400
500
700
900
1000
1100
1200
1300
1400
1500
Source: IEA- PVPS (exept 2005)
Cum
ulat
ive
inst
alle
d PV
Pow
er [M
Wpe
ak]
grid-connected centralizedgrid-connected distributedoff-grid non-domesticoff-grid domestic
1996 1997 1998 1999 2000 2001 2002 2003 2004 20051995
800
600

23
nected to the grid during this period, with an average capacity of 2.6 kW per roof. In 1995, total system costs averaged Ð12.27/W and produced an average 700 kWh per kW installed over the year. At the end of this programme the German PV market suf-fered a significant breakdown, however, and Greenpeace and other organisations started extensive lobbying work to encour-age a follow-up. Greenpeace launched a solar pioneer pro-gramme in 1995 and has continued since then with extensive information work in favour of solar PV. Between 1995 and 1999 about 40 cities and towns also implemented their own “rate based” incentive schemes. These allowed residential customers to sell electricity from their rooftop PV systems to the utility for up to Ð1.02/kWh. The purchase price was usually supported by a 1% levy on electricity sales, mostly introduced after a vote among local electricity customers. This support was eventually superceded by the national Renewable Energy Law.
In 1999, a new five-year programme was launched to promote the installation of PV on 100,000 German roofs, with a budget of Ð460m. The aim was to develop a total generating capacity of 300MWp. For both private households and businesses the in-centive came through a guaranteed ten-year low interest loan (1.9% per annum), with no repayments in the first two years. Such loans were considered a proven method of avoiding PV’s currently high start-up investment costs.
Although initial reaction to the “100,000 Roofs” programme was disappointing, the new Renewable Energy Law (REL) intro-duced in April 2000 accelerated the market dramatically. Under the REL, anyone who installed a solar electricity system received a buy-back rate of Ð0.5 per kWh over 20 years. This payment then reduced by 5% each year from 2001 onwards for newly in-stalled systems, a fall intended to mirror the anticipated reduc-tion in the price of PV.
This combination of the solar roof programme and the REL has proved a potent mix. Such was the overwhelming response that the 2000 PV loans budget of Ð92m was already used up by the almost 4,000 applications approved during the first quarter of the year. Thousands more applications had to be postponed due to lack of funds. During 2000 alone more than 8,000 systems were approved, with a total capacity of 41.66MW. The average size also increased to 5.18 kWp, with over 100 plants in the 50 to 120 kWp range – a sign that the market was moving into the business/industrial sector. With the ending of the 100,000 roofs programme the Renewable Energy Law was revised (see Table 3.1). Even after the end of the 100,000 roofs programme there are possibilities for loans at low interest rates for investing in a PV system, e.g. the COc abatement programme.
The outcome of the 100,000 roofs programme (1999-2003) with sup-port from the Renewable Energy Law from 2000 - is impressive:
• 345.5MWp installed • Total investment by customers Ð1.77 billion• Market volume increase from 12MWp in 1999 to 130MWp in 2003• PV system price reduction of 20%• Investment by the PV industry of Ð1 billion
FUTURE PROSPECTSThe German government, strongly supported by public opin-ion, clearly considers PV to be a viable long-term option for pro-duction of carbon-free power. Public funding of R&D, about Ð17.25 million in 2003, is therefore likely to continue. Its focus will be firstly on reducing the costs of solar cell and module pro-duction, and secondly on improving the efficiency and reliabil-ity of systems. Most importantly, the Renewable Energy Law has provided a secure, medium-term planning base for invest-ment, at the same time helping to move the technology forward from small-scale manufacturing for niche markets to mass pro-duction for a broad range of applications.
THE REST OF EUROPE • SPAIN has an overall target to double its proportion of renew-
able energy to 12% by 2010. The 1998 feed-in law was revised in March 2004, with some significant changes and new condi-tions that should be excellent tools for getting the PV market moving. These include:
- 44 Ðcents/kWh (valid for 2006) up to system sizes of 100 kWp (until 400MWp installed, then new calculation of the tariff for further systems)
- 22.9 Ðcents/kWh for system sizes above 100 kWp (until 200MWp installed, then new calculation of the tariff for further systems)
- payment period fixed at 25 years, after that the tariff is re-duced to 80%. As a consequence the market size grew from approximately10MWp in 2004 to 20MWp in 2005.
- the objective of the government is to reach 400 MW installed PV capacity by 2010
• ITALY has introduced a feed-in tariff for solar electricity in summer 2005. In the first application slot at the end of September the ap-plications for more than 100MWp were over-subscribed. This clear-ly states the huge interest in solar electricity. In 2006 Italy will probably become the second largest PV market in Europe behind Germany.
• The UNITED KINGDOM had 5.9MWp of capacity installed by the
end of 2003, mostly the result of capital grants totalling Ð56 million offered by the government.
• After several years of regional programmes Austria had a na-tional feed-in tariff at the beginning of 2003. Due to the very limited installed capacity (15MWp) that applied to this law ap-plications were only accepted for less than one month. At the moment there is no national regulation.
• In GREECE In GREECE according to the new renewable energy law that was voted in June 2006, there is a feed in tariff for electricity produced renewable energy technologies. Sale prices of “solar electricity” vary between Ð 0.40 - 0.50/kWh depend-ing on the installed capacity of the pv system and the area where this system is installed. Prices that are guaranteed for twenty years are increasing annually according to the annual increase of electricity prices.
The new law is expected to trigger massive investments in solar technologies during the next years. • OTHER EUROPEAN COUNTRIES are also pursuing solar programmes,
mainly targeted at the grid-connected sector.
24
USA
• PV capacity end 2005: 470MWp (approximately)• Support system: Federal tax credit plus separate state incentives
Since 1995 the US PV industry has been growing at an average annual rate in excess of 20%. Both the industry and the govern-ment’s Department of Energy see this trend continuing or ac-celerating in the future as PV becomes more established as a preferred technology in key markets. The manufacturing in-dustry’s goal is to sustain 30 to 35% annual growth over the next 20 years. In terms of installations, PV has reached a level of 470MWp. We estimate that 90MWp were installed in 2004 and 105 were installed in 2005.
The past few years have brought big and mostly positive changes for the US solar industry. With the passage of a much-expanded federal investment tax credit and expanding state solar pro-grammes, solar power is now cost-competitive with retail elec-tricity in a growing number of states. The state programmes, which require over seven gigawatts (GWp) of solar installations by 2020, are providing substantial long-term support to this fast-growing industry. If the federal tax credit can be extended, and the current silicon shortage is eliminated as expected, the future of solar energy in the United States will be brighter than ever.
FEDERAL POLICIES, FINALLY!
ENERGY POLICY ACT OF 2005, TAX CREDITAlthough the Energy Policy Act of 2005 was a big step backward for the United States energy policy, it did include some positive elements. The most important sections were the tax credits for renewable energy. On the solar side, the act included a 30% tax credit for individuals and businesses that install solar energy systems, with a $2,000 cap on residential solar installations.
The credit is scheduled to return to 10% for commercial installa-tions, while the residential credit will expire at the end of 2007,
just when the solar panel shortage in the United States will be-gin to ease. The prospects for an early extension of the tax cred-it are strong. Several legislative vehicles have been introduced in the House and Senate already, including some that have strong bipartisan support.
THE PRESIDENT’S SOLAR AMERICA INITIATIVE
The Department of Energy has released details of the “Presi-dent’s Solar America” initiative, proposing a large funding in-crease for solar energy research. First announced during Presi-dent Bush’s State of the Union address in 2006, the initiative aims to make solar power competitive with existing sources of electricity in 10 years. The programme aims to deploy five to ten GWp of capacity, which is in line with the growth projected by industry and promoted by state incentives. The president has proposed a 78% budget increase to $148 million for solar re-search and development budget. The initiative will place em-phasis on funding industry-led partnerships to accelerate mar-ket-ready photovoltaics with a new focus on manufacturing and production.
STATE POLICIES
In the last couple of years a handful of states have passed laws promoting the large-scale adoption of solar power. Led by Cali-fornia, New Jersey, Pennsylvania and Arizona, the states have currently committed to fund the installation of over 7 GWp of solar electricity in the next 15 years. These programmes will de-liver billions of dollars in subsidies to residential and commer-cial solar projects and represent significant long-term incen-tives to the solar industry in the United States.
Table 3.2: Summary of State Solar Goals
State Status of Programme Commitment by 2020*
Arizona Commitment under review 900
California Passed programme (2006) 3,000
Connecticut Existing 15
Colorado Passed RPS (2004) 50
District of Columbia Passed RPS (2005) 30
Hawaii Existing 15
Nevada Existing 500
New Jersey Passed RPS (2006) 1,500
New York Passed RPS (2004) 25
North Carolina Existing 10
Pennsylvania Passed RPS (2004) 860
Rhode Island Existing 5
Texas (Austin) Existing 100
Other States* Programmes in varying states 300
Total 7,310
* Other states: AK, DE, FL, IL, MA, MD, MN, OH, MI, ME, MA, MT, NM, OR, and VT.
PART THREE: THE SOLAR RACE
Figure 3.3: Installed PV in the United States by sub-market
200
300
400
500
600
700
800
Source: IEA- PVPS (except 2005)
Cum
ulat
ive
inst
alle
d PV
Pow
er [M
Wpe
ak]
grid-connected centralizedgrid-connected distributedoff-grid non-domesticoff-grid domestic
1996 1997 1998 1999 2000 2001 2002 2003 2004 20051995
25
STATE POLICIES ADD UP…
CALIFORNIA In 2005 California consolidated its place as the leading solar state with the adoption of the California Solar Initiative (CSI) by the California Public Utilities Commission. The CSI is the largest solar power programme in the country, committing a combined $3.2 billion in funds to provide incentives for a million solar in-stallations over the next 11 years. The programme provides re-bates for homeowners, businesses, farms and government proj-ects investing in solar power systems. The goal is to install 3,000MW of solar power and in so doing regain California’s po-sition as a world leader in solar power while also lowering pric-es to the point at which government rebates are no longer needed to drive demand.
NEW JERSEYIn April 2006, the New Jersey Board of Public Utilities (BPU) ap-proved a major expansion of the state’s Renewable Portfolio Standard (RPS). The rule requires that 2% of electricity comes from solar electric resources - about 1,500MW. Overall, the stan-dard requires that 20% of the state’s electricity comes from new renewable energy sources by 2020.
PENNSYLVANIAIn November 2004, Pennsylvania passed a Renewable Portfolio Standard that requires 0.5% or 860MW of solar power to be pro-duced in the state by 2020. The law requires 8% of the state’s electricity to come from renewable resources.
ARIZONAOn Feb 27, 2006, the Arizona Corporation Commission approved a revised Environmental Portfolio Standard, which is currently under review by the Arizona Attorney General’s office. The new Standard increases the renewable energy requirement to 15% by 2025, of that 900MW (30%) would come from distributed generation resources, most of which is expected to be solar elec-tricity. A final decision is expected in summer 2006.
NEW MEXICOIn February 2006, Governor Bill Richardson signed Senate Bill 269, which creates a 30% tax credit, up to $9,000 for each sys-tem, for residential and agricultural solar systems. The bill ex-pands the federal tax credit, which is limited to $2,000 and adds certainty by extending it for 10 years.
The state’s largest electric utility, Public Service of New Mexico, has agreed to pay customers $0.13 per kWh of solar power they generate, regardless of whether the electricity goes into the home. This amounts to a $0.21 subsidy to customers who install solar panels and is America’s first feed-in tariff, modelled after a highly successful programme in the relatively more cloudy Germany. The utility plans to develop a commercial incentive programme soon.
COLORADOIn 2004 Colorado citizens passed the first Renewable Portfolio Standard by citizen ballot initiative in the United States. The RPS requires 15% renewable energy by 2015, 4% of which must
be solar. The state’s largest utility company, Xcel Energy, recent-ly initiated a $4.50 per watt residential rebate programme.
NEVADALast year, Nevada increased the state renewable energy stan-dard to 20% by 2015, where of that 5% must come from solar PV. To meet the goal, SunEdison, a solar company that leased office space from Greenpeace when it was starting out, announced this year that it would develop the world’s largest solar project in Nevada. The 18 megawatt project almost doubles what is cur-rently the world’s largest PV project, a 10-megawatt facility in Germany. In addition, SolarGenix is developing the first concen-trated solar power plant in Nevada as a result of the RPS, a 65MW plant that will be the first solar thermal power plant built in the United States since the mid-1980s.
WESTERN GOVERNORS ASSOCIATIONThe Western Governors have committed their states to develop-ing 30,000MW of clean and diversified energy by 2015. The So-lar Task Force made recommendations to the governors on spe-cific policies to facilitate the development of 4,000MW of concentrating solar power, 4,000MW of distributed photovolta-ics and 2,000MW of solar hot water.
CITY AND LOCAL COMMITMENTS
SAN FRANCISCO COMMUNITY CHOICE ENERGYFor years Greenpeace has been working with San Francisco to make the dream of large-scale renewable energy a reality. In 2004, the San Francisco Board of Supervisors unanimously passed an Energy Independence Ordinance, bringing the city one step closer to this goal. The stated purpose of the ordinance is to provide “clean, reasonably priced and reliable electricity” to its customers and to fulfill the “public mandate” for “rapid and large-scale development of renewable energy and conser-vation resources” in San Francisco. If successful, the city would create one of the world’s largest urban solar facilities and 360 megawatts of renewable energy, enough to power half the city’s needs.
OTHER CITIESThe City of Austin has a goal of installing 100 megawatts of so-lar power to help meet 15% of its generation needs through re-newable energy by 2020. After several years of pressure from Greenpeace, San Diego set a goal of 50 megawatts of solar en-ergy in 2003. The city recently signed a deal to install the first five megawatts of solar on city facilities this year.
UNIVERSITY COMMITMENTS
Students in California and across the country have successfully lobbied their universities to go solar. Last year California State University became the last of the three big California Universi-ty systems to agree to install solar panels on campus. California State University joined the University of California and Los An-geles Community College District in pledging to install signifi-cant onsite renewable energy. Greenpeace has been working with students in California and on other campuses to bring this to fruition.

26
JAPAN
• PV capacity end 2005: 1423MWp (1132MWp at the end of 2004)• Support system: Various government programmes, including
grants for domestic PV roofs, support for R&D for industrial mass application, and net metering support provided by utilities
Renewable energy is seen as an indispensable part of Japanese climate change policy and carbon reduction targets, as well as an emerging technology to be exploited. Various supportive policies to encourage growth in the renewables market have been introduced by the government, including significant solar research and development programmes from the 1970s on-wards. These policies have received backing from across the spectrum of public bodies, academics, NGOs and the business community. Japan now has PV systems on thousands of schools, hospitals, factories, warehouses, offices, houses and railway sta-tions.
By the end of 2005 a total of 1423 (rough estimate)MWp had been installed in Japan, with government plans for 4.82 GWp by 2010, an ambitious target requiring an annual growth rate of 30%. The annual growth rate since 1998 has been up to 45%, however. If the current trend continues, 70 to 80% of installa-tions in Japan will be rooftop systems with an average size of 3.8 kWp, and the government is seeking to increase the share of industrial application by shifting its support to that end.
The national Japanese programme is shifting its aim from rapid expansion in the number of units in home application sector coupled with a decreasing percentage of subsidies, to the vol-ume of units in the industrial sector. The overall goal is to stim-ulate production, bring prices down, create market awareness and leave Japanese industry with a fully economic market that will encourage competitive exports to the rest of the world. In pursuit of these objectives, the budget for the residential PV system dissemination programme was continuously cut by 50%, from $223 million in 2002 to $50 million in 2004, and came to an end at the end of the 2005 fiscal year. This reduced the subsidy per kWp from $862/kWp in 2003 to $181/kWp in 2005, and no governmental financial support is available for home application now. Even so, the market has continued to grow, the number of subsidy applications increased during 2003, while the price for PV installed capacity has continued to fall to a present level of about $6,000/kWp. One specific result is that the Metropolitan Government of Tokyo and Tokyo Waterworks installed PV facilities amounting to 1.2MWp. This is the first mega-watt class installation in Japan, providing about 1GWh-clean electricity and COc reduction of 450 tons annually. The waterworks is planning to install large PV systems at eight fa-cilities by the end of the 2006 fiscal year. When this is complet-ed, the total installed capacity is expected to be 5.2MWp.
GOVERNMENT SUPPORT
The Japanese government has focused large financial resources on the PV market in order to establish internationally competi-tive mass production. Comprehensive financial, tax and system
support measures are being used to promote solar and other “new energy” (renewable) technologies that are already estab-lished but not yet commercially competitive.
Most of this funding - for a mixture of R&D, demonstration pro-grammes and market incentives - has been made available since 1980 through NEDO, the New Energy and Industrial Tech-nology Development Organisation and the New Energy Foun-dation. Japanese PV budgets grew almost linearly from $20 mil-lion in 1980 to $240 million in 2004. But the government ended the subsidy for home application at the end of the 2005 fiscal year, which still accounts for a major part of all installed capac-
Figure 3.1: Installed PV in Japan by sub-market
200
300
400
500
600
700
800
900
1000
1100
1200
1300
1400
1500
Source: IEA- PVPS (except 2005)
Cum
ulat
ive
inst
alle
d PV
Pow
er [M
Wpe
ak]
grid-connected centralizedgrid-connected distributedoff-grid non-domesticoff-grid domestic
1996 1997 1998 1999 2000 2001 2002 2003 2004 20051995
PART THREE: THE SOLAR RACE

27
ity in Japan. Together with the insufficient RPS policy, this has cast a cloud on the future prospect of the PV market in Japan.
The programmes included in the budget for the 2006 fiscal year are in Table 3.3.
Table 3.3: Japanese PV support programmes
Programme Budget for 2006 in $ million
R&D for future PV technologies 18
Field test projects on new technologies of PV power generation 107
R&D for accelerating commercialisation of PV systems 7.2
Study of demonstration of improving grid safety for PV system for mass power production and supply 6.3
Community model project for integration of environment and economy (Ministry of Environment) 24
Super Solar Project (Ministry of Environment) 40
Total 202.5
While most of the budgets had been cut compared to the previ-ous year, the two programmes covering future PV power gen-eration technologies and improvement of grid safety have seen newly introduced. Japan’s national programmes for renewables during 2004
include:
• RPS Law obliges electric utilities to achieve a target for 1.35% of their electricity supply to come from renewable energy sources, including solar, by 2010.
• The Regional New Energy Introduction Project aims to accelerate the introduction of new energy (renewable) technologies by sup-porting regional government projects. Half of system installation costs are subsidised.
• The Subsidy Programme for New Energy Developers supports businesses that plan to introduce new energy, including PV.
• The programme for development of regional new energy visions helps local government and related bodies to create visions for facilitating promotion of renewable energy at local levels.
ECONOMICS Japan has had an aggressive PV R&D programme since the late 1970s, with virtually all funds directed at developing an indus-try capable of competing in the world market, and with cost reductions that would also serve the domestic market.
In the past five years PV system costs have reduced by another 33%. In the future it is expected that the average price of a resi-dential PV system will fall even further, to below $4,000/kWp. Even so, the cost of PV electricity is still presently more than twice the price of conventional domestic power, which is excep-tionally expensive in Japan. If the added value of solar systems in environmental terms were monetised for customers, how-ever, PV would be able to compete much earlier than expected.
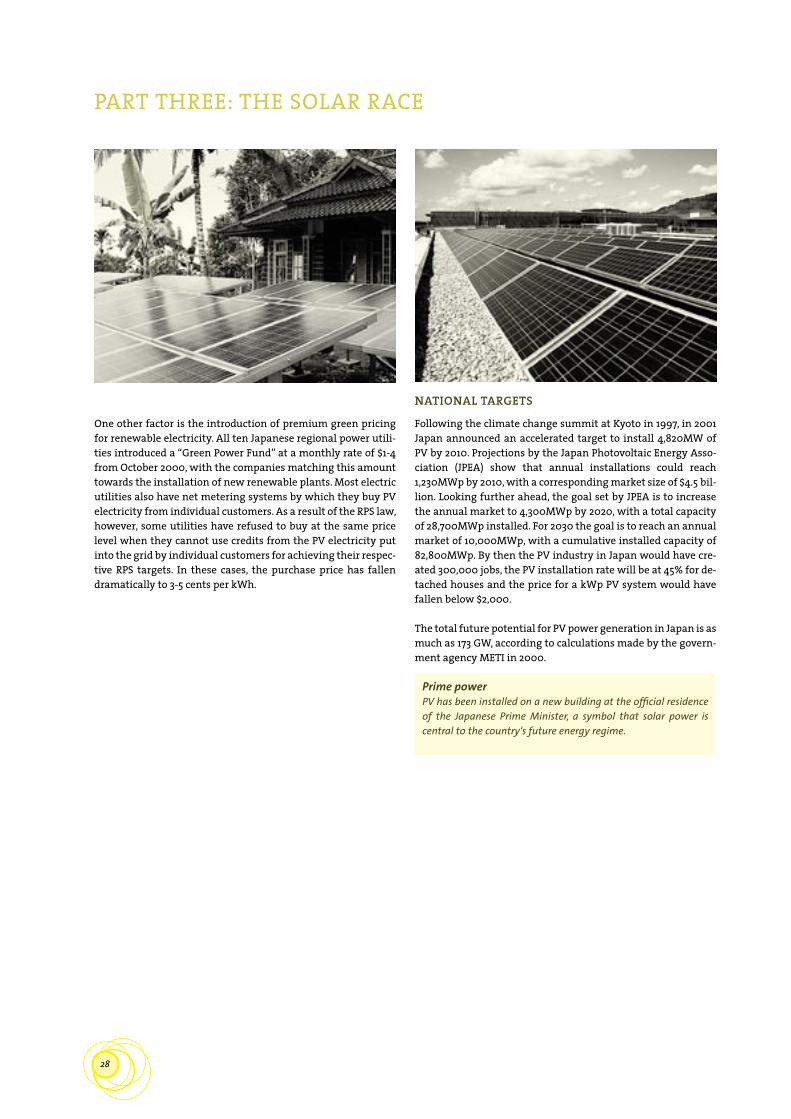
28
One other factor is the introduction of premium green pricing for renewable electricity. All ten Japanese regional power utili-ties introduced a “Green Power Fund” at a monthly rate of $1-4 from October 2000, with the companies matching this amount towards the installation of new renewable plants. Most electric utilities also have net metering systems by which they buy PV electricity from individual customers. As a result of the RPS law, however, some utilities have refused to buy at the same price level when they cannot use credits from the PV electricity put into the grid by individual customers for achieving their respec-tive RPS targets. In these cases, the purchase price has fallen dramatically to 3-5 cents per kWh.
NATIONAL TARGETS
Following the climate change summit at Kyoto in 1997, in 2001 Japan announced an accelerated target to install 4,820MW of PV by 2010. Projections by the Japan Photovoltaic Energy Asso-ciation (JPEA) show that annual installations could reach 1,230MWp by 2010, with a corresponding market size of $4.5 bil-lion. Looking further ahead, the goal set by JPEA is to increase the annual market to 4,300MWp by 2020, with a total capacity of 28,700MWp installed. For 2030 the goal is to reach an annual market of 10,000MWp, with a cumulative installed capacity of 82,800MWp. By then the PV industry in Japan would have cre-ated 300,000 jobs, the PV installation rate will be at 45% for de-tached houses and the price for a kWp PV system would have fallen below $2,000.
The total future potential for PV power generation in Japan is as much as 173 GW, according to calculations made by the govern-ment agency METI in 2000.
Prime power PV has been installed on a new building at the official residence of the Japanese Prime Minister, a symbol that solar power is central to the country‘s future energy regime.
PART THREE: THE SOLAR RACE

PART FOUR
THE SOLAR FUTURE

30
THE GREENPEACE/EPIA “SOLAR GENERATION” SCENARIO
METHODOLOGY AND ASSUMPTIONSIf PV is to have a promising future as a major energy source it must build on the experiences of those countries that have al-ready led the way in stimulating the solar energy market. In this section we look forward to what solar power could achieve - given the right market conditions and an anticipated fall in costs - over the first two decades of the twenty-first century. As well as projections for installed capacity and energy output we also make assessments of the level of investment required, the number of jobs that would be created and the crucial effect that an increased input from solar electricity will have on green-house gas emissions.
This scenario for 2025, together with an extended projection forwards to 2040, is based on the following core inputs.
• PV market development over recent years both globally and in specific regions
• national and regional market support programmes• national targets for PV installations and manufacturing
capacity• the potential for PV in terms of solar irradiation, the availability
of suitable roof space and the demand for electricity in areas not connected to the grid.
The following assumptions have been employed:
MARKET GROWTH RATES: For Europe, Japan and the USA, growth rates have been based on market development over the last few years and on targets laid down by some countries for installed PV capacity by 2010. For other countries the market expecta-tions are based on their likely take-off as the technology spreads. The average annual growth rate worldwide up to 2009 is projected to be 35%, and 26% between 2010 and 2015. Between 2016 and 2025 market remains on a high level, however the an-nual market growth drops to 19% till 2020 and 11% in 2025.
Initial growth is expected to be fastest in the grid-connected sector, by 2010 the growth rates of the emerging off-grid rural sector are expected to overtake the ones from the grid-connect-ed sector, due to a significant reduction in costs and the likeli-hood of competitive electricity production prices.
ELECTRICITY GENERATION: Figures for the growth in global electric-ity demand up to 2025, on which comparisons with expected PV development are based, are taken from projections by the Inter-national Energy Agency. These show total world demand for power increasing from 13,400 TWh in 2003 to 16,250 TWh in 2010 and 23,250 TWh by 2025. DLR has been asked by Green-peace International and EREC to conduct a study on global sus-tainable energy pathways up to 2050. The scenarios are based on the reference scenario from IEA World Energy Outlook (2004). The energy demand is split up in electricity and fuels. A low energy demand scenario has been developed based on the IEA reference scenario: For the year 2025, the energy efficiency scenario estimates a global electricity demand of 16.845 TWh in 2025.
CARBON DIOXIDE SAVINGS: An off-grid solar system which replaces an average diesel unit will save about 1 kg COc per kilowatt hour of output. The amount of COc saved by grid-connected PV sys-tems depends on electricity production in different countries. The world average figure is 0.6 kg COc per kilowatt-hour. For the whole scenario period it has therefore been assumed that PV installations will save on average 0.6 kg COc per kilowatt-hour.
PROJECTION TO 2040: For the period 2025-2040 a very conservative lifetime of 20 years has been assumed for PV modules. As a re-sult, the capacity installed in the first year of the scenario has been subtracted from the figure for cumulative installed capac-ity reached after 20 years. This methodology has then been ap-plied to all subsequent years.
The scenario is also divided in two ways; into the four global market divisions (consumer applications, grid-connected, re-mote industrial and off-grid rural), and into the regions of the world as defined in projections of future electricity demand made by the International Energy Agency. These regions are OECD Europe, OECD Pacific, OECD North America, Latin Ameri-ca, East Asia, South Asia, China, the Middle East, Africa and the Rest of the World.
THE GREENPEACE/EPIA “SOLAR GENERATION” SCENARIO
KEY RESULTS The findings of the Greenpeace/EPIA “Solar Generation” scenario show clearly that, even from a relatively low baseline, PV electric-ity has the potential to make a major contribution to both future electricity supply and the mitigation of climate change.
1. POWER GENERATION
The Greenpeace/EPIA scenario shows that by 2025 PV systems could be generating approximately 589 terawatt hours of elec-tricity around the world. This means that enough solar power would be produced globally in twenty years’ time to satisfy the current electricity needs of nearly 20% of the expanded Euro-pean Community (EU 25).
The global installed capacity of solar power systems would reach 433 GWp by 2025. About two thirds of this would be in the grid-connected market, mainly in industrialised countries. As-suming that 80% of these systems are installed on residential buildings, and their average size is 3 kWp, each serving the needs of three people, the total number of people by then gen-erating their own electricity from a grid-connected solar sys-tem would reach 290 million. In Europe alone there would be roughly 41 million people receiving their supply from grid-con-nected solar electricity1.
In the non-industrialised world approximately 40 GWp of solar capacity is expected to have been installed by 2020 in the rural electrification sector. Here the assumption is that on average a 100 Wp stand-alone system will cover the basic electricity needs of 3-4 persons per dwelling. Since system sizes are much smaller and the population density greater, this means that UP TO 950 MILLION PEOPLE IN THE DEVELOPING COUNTRIES WOULD BY THEN BE USING SOLAR ELECTRICITY. By 2025, more than 1.6 billion people
PART FOUR: THE SOLAR FUTURE
1. Average European household: 2.5 people with a consumption of 3,800 kWh per year
31
Table 4.1: The Greenpeace/EPIA “Solar Generation” Scenario
2025 2020
Global Solar Electricity Output in 2025: 589 TWh 276 TWh
Global electricity demand in 2025 / 2020 (IEA projection) 2,5 % 1,3 %
Global electricity demand in 2025/20 with moderate energy efficiency (Greenpeace International Projection)
3,5 % 1,7 %
Global Solar Electricity Output in 2040: 4890 TWh
Global electricity demand in 2040 (IEA projection) 16 %
Global electricity demand in 2040 with moderate energy efficiency (Greenpeace International Projection)
24 %
Detailed Projections for 2025:
PV systems capacity 433 GWp 205 GWp
Grid-connected consumers world wide 290 million 135 million
Off-grid consumers 1.6 billion 900 million
Employment potential, full-time jobs world wide
3,2 million 1,9 million
Investment value
Average annual investment value 2005 - 2025 45,2 billion Ð 30,9 billion Ð
Investment value in 2025 102,5 billion Ð 76,1 billion Ð
Prices for grid connected PV systems; Reduction down to 2 ¤ per Wp
Cumulative carbon savings 2.204 million ton.COc 851,5 million ton.
COc
Annual COc savings 353 million ton.COc 165,4 million ton.
COc

32
could get electricity from offgrid photovoltaics systems. This would represent a major breakthrough for the technology from its present emerging status.
By 2040, the penetration of solar generation would be even deeper. Assuming that overall global power consumption had by then increased from 23.228 TWh in 2025 to 36,500 TWh, THE SOLAR CONTRIBUTION WOULD EQUAL 16% OF THE WORLD’S ELECTRICITY OUTPUT. Combined with energy efficiency measures, this share could be reached several years earlier. This would place solar power firmly on the map as an established energy source.
2. EMPLOYMENT
More jobs are created in the installation and servicing of PV systems than in their manufacture. Based on information pro-vided by the industry, it has been assumed that, up to 2010, 20 jobs will be created per MW of capacity during manufacture, decreasing to 10 jobs per MW between 2010 and 2020. About 30 jobs per MW will be created during the process of installation, retailing and providing other local services up to 2010, reducing to 27 jobs per MW between 2010 and 2020.
As far as maintenance is concerned it is assumed that with the more efficient business structures and larger systems in the in-dustrialised world, about one job will be created per installed MW. Since developing world markets will play a more signifi-cant role beyond 2010, however, the proportion of maintenance work is assumed to steadily increase up to two jobs per MW by 2020. The result is that by 2025, AN ESTIMATED 3.2 MILLION FULL-TIME JOBS WOULD HAVE BEEN CREATED BY THE DEVELOPMENT OF SOLAR POWER around the world. Over half of those would be in the installa-tion and marketing of systems.
3. COSTS AND INVESTMENT
The rapid rise in the price of crude oil in previous years and its subsequent knock-on effect on conventional energy costs across the domestic and industrial sectors worldwide, has once again highlighted the urgent need for both industrialised and less de-veloped economies to rebalance their energy mix. This hike in the oil price is not just the result of concerns about security of supply, but also of rapidly rising demand in the emerging econ-omies in Asia, particularly China. Oil production can no longer expand at the same rate as the rise in demand. As such, higher oil prices – and subsequently, higher energy prices in general - are here to stay and world economies will have to adjust to meet this challenge in order to grow.
It is in this climate of runaway energy pricing that those econo-mies that have committed themselves to promoting the uptake of solar electricity are starting to differentiate themselves from those countries that have relied heavily or almost exclusively on conventional energy sources. There are clear signs that the next decade will see numerous countries having to rapidly re-duce their dependence on imported oil and gas. This abrupt transition will be felt in particular in those countries that have paid little attention so far to the role that solar electricity can play. However – on the positive side – there is still time for these economies to catch up if they rapidly introduce innovative poli-cies to promote solar electricity use.
The speed with which the solar electricity sector is increasing its market share in those economies that have committed themselves to promote this clean power source, coupled with the transformation of its customers from power recipients to power generators, represents a revolution comparable to that in the telecommunications market over the past decade. Such in-dustrial revolutions produce winners and losers.
The undisputed winners in such industrial revolutions are the customers who have access to greater choice. Other winners in-clude the market players who recognise the potential of such an expanding market, and those who have committed them-selves to investment in the sector.
One of the main arguments heard from critics of solar electric-ity is that its costs are not yet competitive with those of conven-tional power sources. Clearly it is an essential goal for the solar industry to ensure that prices fall dramatically over the coming years and decades. However, there are many examples of inno-vative products and services where offering customer choice has led to their popular uptake at a price considerably higher than that previously available.
Two examples of such innovative market entrants are mobile phones, offering a service at a far higher price than conventional fixed line networks, and bottled mineral water, a product which in the middle and higher price ranges costs more per litre than petrol. With the right product, therefore - offering customers the type of added value they are looking for, coupled with innovative marketing - technologies such as solar electricity should be able to compete with grid power in industrialised countries.
PART FOUR: THE SOLAR FUTURE
Figure 4.1: Growth in world solar market by application
2015 2020 202520102005
10.000
20.000
30.000
40.000
50.000
60.000
70.000 [MWpeak]
Grid connectedRemote IndustrialOff-grid rural (mainly DC)Consumer Appl.

33
Tab. 4.2: Projected growth of world solar power market untill 2025
Year Annual Installed Capacity [MW]
Annual Growth Rate [%]
Estimated Annual Electricity Production
[MWh]
Estimated Reduction of COc [COc]
Estimated Jobs
1995 79 12,3 122.800 73.680 2.399
1996 89 13,5 211.900 127.140 2.752
1997 126 41,6 338.000 202.800 3.872
1998 153 21,1 464.100 278.460 4.710
1999 201 31,9 665.500 399.300 6.195
2000 259 38,0 341.140 1.017.480 13.665
2001 334 28,9 2.214.220 1.328.532 16.778
2002 439 31,4 2.802.000 1.681.200 22.472
2003 594 35,3 3.582.897 2.149.738 27.949
2004 815 37,0 4.471.497 2.682.898 34.702
2005 1.397 6.479.382 3.887.629 53.683
2006 1.877 27,0 8.754.036 5.252.421 73.974
2007 2.537 27,0 11.841.330 7.104.798 99.695
2008 3.433 27,0 16.035.409 9.621.245 137.635
2009 4.647 27,0 21.738.499 13.043.099 190.179
2010 5.609 36,0 28.746.819 17.248.092 228.714
2011 6.839 36,0 37.444.366 22.466.620 281.747
2012 8.425 36,0 48.344.329 29.006.597 347.162
2013 10.489 36,0 62.135.606 37.281.363 427.878
2014 13.194 36,0 79.746.741 47.848.045 527.524
2015 16.765 36,0 102.433.996 61.460.398 650.629
2016 18.784 22,0 127.944.386 76.766.632 802.853
2017 21.312 22,0 156.955.610 94.173.366 991.289
2018 24.525 22,0 190.369.868 114.221.921 1.224.842
2019 28.666 22,0 229.399.819 137.639.891 1.514.723
2020 34.079 22,0 275.689.801 165.413.881 1.892.736
2021 37.162 12,0 326.360.393 195.816.236 2.083.060
2022 40.743 12,0 382.126.590 229.275.954 2.334.287
2023 44.902 12,0 443.818.149 266.290.890 2.610.636
2024 49.732 12,0 512.400.242 307.440.145 2.914.621
2025 55.343 12,0 588.997.967 353.398.780 3.249.004
Total 2000 till 2025 433.067 2.203.696.207
Market datas from EPIA, all other figures calculated

34
PART FOUR: THE SOLAR FUTURE
0,2
0,4
0,6
0,8
1,0
1990 2000 2010 2020 2030 2040
PhotovoltaicsUtility peak powerBulk power
[?/kWh]
Figure 4.3: PV Competitiveness
Source: RWE SCHOTT Solar GmbH
900 h/a: 0,60 ?/kWh
0,2
0,4
0,6
0,8
1,0
1990 2000 2010 2020 2030 2040
1800 h/a: 0,30 ?/kWh
Figure 4.2: Employment in PV related jobs world wide
500.000
1.000.000
1.500.000
2.000.000
2.500.000
3.000.000
3.500.000
2015 2020 202520102005
Jobs in productionJobs in installation, retailingJobs in maintenance
Table 4.3: Fall in price of PV electricity in selected cities up to 2025
2005 2010 2015 2020 2025
kWh/(year*kWp) [Ðcents/kWh] [Ðcents/kWh] [Ðcents/kWh] [Ðcents/kWh] [Ðcents/kWh]
Berlin - 850 kWh/a 850 0,39 0,31 0,26 0,23 0,21
Paris - 1000 kWh/a 1000 0,33 0,26 0,22 0,19 0,18
Washington - 1200 kWh/a 1200 0,28 0,22 0,19 0,16 0,15
Hongkong - 1300 kWh/a 1300 0,26 0,20 0,17 0,15 0,14
Buenos Aires / Sydney - 1400 kWh/a 1400 0,24 0,19 0,16 0,14 0,13
Bombay - 1400 kWh/a 1400 0,24 0,19 0,16 0,14 0,13
Bangkok - 1600 kWh/a 1600 0,21 0,16 0,14 0,12 0,11
Los Angeles - 1800 kWh/a 1800 0,19 0,15 0,12 0,11 0,10
Dubai - 1800 kWh/a 1800 0,19 0,15 0,12 0,11 0,10
Table 4.4: Value of regional PV market in Million Ð
Year OECD-Europe
OECD N. America
OECD-Pacific
Latin America
East Asia South Asia
China Middle East
Africa ROW Total
2005 4.200 616 1.674 389 293 308 306 64 213 34 8.100
2010 10.983 2.710 5.125 1.103 1.083 979 1.087 346 732 87 24.245
2015 13.401 9.208 11.851 3.388 3.972 3.194 4.753 1.516 2.984 357 54.628
2020 11.361 11670 11.903 7.234 4.475 5.056 21.312 3.937 5.734 1.211 83.898
2025 10.226 15.704 7.695 15.040 5.368 8.497 28.678 8.186 11.921 2.518 113.839

35
The extension of customer choice in the electricity sector to em-brace solar power, however, requires a commitment to creating an appropriate framework to allow consumers to access solar power in an efficient and cost-effective way.
The falling cost of PV cells and modules has been a crucial fac-tor in the recent development of the technology. An indication of the potential for increased efficiency in the production of cells has been given in Part two, together with the likely shift in favour of cheaper thin film technologies.
In this scenario it is projected that the price per Wp for addi-tional production sites will drop to Ð1.12 by 2010. Between 2010 and 2020 a further price decrease is anticipated. On the basis that the current progress ratio is maintained, an EX-WORKS PRICE OF Ð2/WP FOR CRYSTALLINE MODULES WILL BE ACHIEVED BY 2010.
DEVELOPMENT OF SOLAR ELECTRICITY COSTS
The graph “PV Competitiveness” shows the previous and the expected development of solar electricity costs. The falling curves show the reduction of solar electricity costs in the geo-graphical area between central Europe (upper line of the corri-dor, e.g. Berlin, Germany) and Southern Europe (lower bound-
ary line of the corridor, e.g. Sevilla, Spain). In contrast to the falling costs for solar electricity the prices for conventional elec-tricity will rise. The utility prices for electricity are differenti-ated into peak power prices (usually applicable at peak demand hours around midday) and bulk power. In southern Europe so-lar electricity will become price competitive with peak power already before 2010. Areas with less solar irradiation such as central Europe will follow this path in the period up to 2020.
The following map shows the regional solar electricity costs for a PV system price level of 4 Ð/Wp, which will be feasible within the next few years. This graph underlines that solar electricity at these system costs will be competitive with electricity prices for end users.
In terms of delivered electricity, it is possible to make predic-tions for the output from grid-connected systems. The results are given for an average consumer in some of the major cities of the world (see Table 4.1). These show that by 2020 the cost of solar electricity in the most insolated or sunny regions – the Middle East, Asia , South America and Australasia – will have more than halved to as little as 10-13 ¤ cents/kWh in the best conditions. This would make PV power competitive with typi-cal electricity prices paid by end consumer households.
Figure 4.4: Regional PV-Generation Cost
Source: EC Joint Research Centre, Ispra
36
Of equal importance in relation to falling costs is the level of in-vestment in manufacturing capacity. Here the scenario shows that the global value of the solar power market will have reached Ð113 billion by the end of the scenario period. Investment in new production facilities will reach Ð6.2 billion by 2025. The overall market volume for PV systems will increase to Ð126 billion. Just over Ð10 billion of that value will be located in Europe, Ð15.7 bil-lion in OECD North America and Ð5.4 billion in East Asia.
4. CARBON DIOXIDE REDUCTIONS
A reduction in the levels of carbon dioxide being emitted into the world’s atmosphere is the most important environmental bene-fit from solar power generation. Carbon dioxide is the gas largely responsible for exacerbating the greenhouse effect, leading to the disastrous consequences of global climate change.
As the world’s solar electricity production increases, there will be equivalent reductions in the amount of carbon dioxide thrown out into the atmosphere. As already explained, PV systems pro-duce none of the harmful emissions resulting from fossil fuel power generation. Every solar system installed will therefore re-sult in the avoidance of generation from a polluting source.
At the same time, modern solar photovoltaic installations have a very good energy balance. The COc emissions resulting from the manufacture, installation and servicing over the life-cycle of solar generators are “paid back” within the first three to four years of operation for crystalline technology. According to PV manufacturers this will further decrease for thin film technolo-gies energy pay back times of less than one year are realistic.
The benefit to be obtained from carbon dioxide reductions in a country’s energy mix is dependent on which other generation method or energy use solar power is replacing. Where off-grid systems replace diesel generators, they will achieve COc sav-ings of about 1 kg per kilowatt-hour. Due to their tremendous inefficiency, the replacement of a kerosene lamp will lead to even larger savings, up to 350 kg per year from a single 40Wp
module, equal to 25 kg COc per kWh. In the consumer applica-tions and remote industrial markets, on the other hand, it is very difficult to identify exact COc savings per kilowatt-hour. As already explained, over the whole scenario period it was there-fore estimated that an average of 0.6 kg COc would be saved per kilowatt-hour of output from a solar generator. This approach is quite conservative, so higher COc savings may well be possible.
By 2025 solar PV would also have one other important effect. In environmental terms, it would have reduced annual COc emis-sions by 353 million tonnes. This reduction is equivalent to the emissions from Australia and New Zealand, or 150 coal-fired power plants. Cumulative COc savings from solar electricity generation between 2005 and 2025 will have reached a level of 2.2 billion tonnes.
EXTERNAL COSTS OF ELECTRICITY GENERATIONThe external costs to society incurred from burning fossil fuels or from nuclear generation are not included in most electricity prices. These costs have both a local and a global component, the latter mainly related to the eventual consequences of climate change. There is an uncertainly, however, about the magnitude of such costs, and they are difficult to identify. A respected Euro-pean study, the “Extern E” project, has assessed these costs for fossil fuels within a wide range, consisting of three levels:• Low: $4.3/tonne COc• Medium $20.7 – 52.9/tonne COc• High: $160/tonne COcTaking a conservative approach, a value for the external costs of carbon dioxide emissions from fossil fuels could therefore be in the range of $10–20/tonne COc. The assessment above concludes that solar power reduces emis-sions of COc by an average of 0.6 kg/kWh. The resulting average cost avoided for every kWh produced by solar energy will there-fore be in the range of 0.25 – 9.6 US cents/kWh. These external costs must be taken into account when comparing solar systems with other energy sources.
PART FOUR: THE SOLAR FUTURE
Figure 4.7: Annual global COc savings in millions of tonnes
2015 2020 202520102005
50
100
200
150
250
300
350
400
Figure 4.6: Global Investment in new PV production facilities
20.000
40.000
60.000
80.000
120.000
140.000
100.000
20.000
40.000
60.000
80.000
Module Shipment worldwide [MW]Additional production capacity needed [MW]Investment production facilities [¤mio]
Investment Market Volume [¤mio]Total investment [¤mio]
Source: PV 2010
2015 2020 20252005 2010
[¤mio]
[MW]

37
5. REGIONAL DEVELOPMENT
The development of the PV market is expected to vary from re-gion to region around the world. The overall pattern of the sce-nario is that while the OECD regions, especially the USA, Japan and Europe, will dominate the global market up to 2010, after that much faster development is expected to take place in other regions, especially South Asia and Africa. By 2025 installed PV capacity in the OECD regions will have fallen to less than half the world total (see Figures 4.6-4.8).
The major driving forces behind the future growth of PV capac-ity in each of the most important regions is described below, together with the conclusions reached in the scenario.
OECD EUROPE
The European Union’s current target, part of a broader strategy for renewable energy, is to reach at least 3 GWp of installed PV power by 2010. This scenario demonstrates that this goal can be exceeded, and that a capacity of 5 GWp in Europe by 2010 is pos-sible.
Reasons for this optimism include the fact that the PV market in Germany grew by more than 700% between 2002 and 2005. This demonstrates the impressive growth rates that can be trig-gered by clearly defined and attractive support mechanisms such as the German “feed-in tariff” offering fixed premium prices for renewable energy output.
PREMIUM FEED-IN TARIFFS
Since the first issue of Solar Generation in 2001 other European countries have also implemented various incentive pro-grammes, mostly based on premium tariffs and in some cases combined with investment subsidies. Spain, Austria, Italy and Luxembourg have all introduced incentive schemes for solar electricity, some more successfully than others. Spain revised its support scheme for solar electricity, which is mainly based on a premium feed-in tariff, and Italy introduced a feed-in tariff for solar electricity in mid 2005. Luxembourg has a combina-tion of feed-in tariff and investment support, resulting in the highest per capita installed PV capacity in the world. In June 2006 Greece followed with a system of premium tariffs for solar electricity.
The situation in Europe differs from Japan, which has experi-enced a similar solar boom to that in Germany. PV systems in Japan are mainly sold as part of new houses, offering the ad-vantage that the costs can become part of the home mortgage. This system is also possible because the Japanese construction industry is dominated by a very few large companies offering standardised houses with standardised PV systems. By contrast, the construction industry in Germany and other European countries is much more diverse and the houses more customer tailored.
Looking at the growth in different European markets over the past few years it has become evident that premium feed-in tar-
Figure 4.8: World solar power market by region 2005
Latin America 4%East Asia 3%
South Asia 3%China 3%
Middle East 1%Africa 2%ROW 0%
OECDEurope
54%OECDN-America 8%
OECDPacific22%
2005
Latin America 4%
East Asia 4%
SouthAsia 4%
China 4%
MiddleEast 1%
Africa 3%ROW 0%
OECD Europe 47%
OECDN-America12%
OECDPacific21%
Figure 4.9: World solar power market by region 2010
2010
Figure 4.10: World solar power market by region 2025
Latin America 18%
EastAsia5%
SouthAsia8%
China 23%Middle East 6%
Africa 9%
ROW 2%
OECDEurope8%
OECDN-America15%
OECD Pacific 6%
2025

38
iffs are the most appropriate tool for creating an eventual self-sustaining solar electricity market. The development of a large number of substantial solar electricity markets will be essential for the long-term stability of the European solar electricity mar-ket and for lowering the risk attached to today’s focus on the German market. A strong demand side in the European PV mar-ket is crucial in order to provide the basis for a strong and ex-panding industry. If an installed capacity of 4.7 GWp by the end of 2010 is to be achieved, it must therefore be a strategic goal to establish a feed-in tariff (full cost rates) for solar electricity at a European Union level.
The EPIA road mapThe European Photovoltaic Industry Association (EPIA), repre-senting the majority of the European PV industry, published a new “road map” in 2004. This manifesto outlines the European PV industry’s priorities for achieving the objectives of the Euro-pean Union in relation to installed PV capacities. EPIA has de-vised a programme of specific actions that the European indus-try, in collaboration with other key stakeholders from the research, policy, finance, electricity, construction and other sec-tors, should adopt in order for Europe to capitalise on the global PV market. The EPIA road map highlights the key obstacles and issues that must be resolved before PV can contribute substantially both to European and global energy supply. It is intended to serve as a guide for the European industry, including research priorities, up to 2010 and beyond, and as a framework for political action to help realise solar electricity’s potential to become a major con-tributor to electricity generation during this century.(www.epia.org)
CASE STUDY: SOLAR GENERATION IN GERMANY
Germany is currently the key player in the European PV market. As a result of the support provided by the Renewable Energy Law, together with the 100,000 roofs programme (available un-til mid 2003), the average annual growth rate between 2000 and 2005 was well over 40%. In fact after the 100,000 roofs pro-gramme ended in 2003, and the feed-in tariffs was increased – which enabled investor to operate PV installations economi-cally, the market volume tripled between 2003 and 2004 and almost doubled between 2004 and 2005. The annual market in Germany 2005 was approx. 700MW – a market volume which the first issue of Solar Generation in 2001 expected in 2013. Ac-cording to our first estimate Germany is almost 10 years “ahead of schedule”.
Table 4.2 summarises the findings of a case study on Germany in which we looked at the potential increase (at five year inter-vals) in installed capacity, as well as electricity generation, car-bon savings, jobs created and the total value of the PV market. The results show that the electricity output from PV generation could reach 6.5 TWh by 2010. This is equivalent to the output of two centralised coal-fired power plants. By 2015 solar electricity would cover more than 2.4% of Germany’s electricity demand and by 2025 more than 5%. The cumulative installed capacity would reach 26,380MW by 2025.
Within the next 20 years the German PV industry could create 80,000 jobs in installation, service and maintenance alone. If all the modules were manufactured in Germany itself this would create up to 12.000 additional jobs. THIS DOES NOT TAKE INTO ACCOUNT ANY MANUFACTURING ACTIVITIES FOR THE EXPORT OF PV MODULES AND OTHER COMPONENTS. TAKING THIS INTO ACCOUNT THE LEVEL OF 100,000 JOBS IN THE PV INDUSTRY IN GERMANY IS A REALISTIC TARGET.
GOVERNMENT POLICY AND PROGRAMMES
By itself, the 100,000 roofs programme had a limited success, and the solar boom in Germany only started with the introduc-tion of the Renewable Energy Law in April 2000, which provid-ed premium tariffs for solar electricity. Until mid 2003 the 100,000 roofs programme and the premium tariff system oper-ated in parallel. After the ending of the 100,000 roofs pro-gramme, the feed-in tariff was revised at the beginning of 2004 in order to compensate for the fact that low interest loans were no longer available. These new and higher premium feed-in tariffs triggered an even stronger solar electricity boom in Ger-many. Estimates for new capacity expected to be installed dur-ing 2004 range up to 300MWp.
Apart from the attractive feed-in tariff payments there are sev-eral factors responsible for the success of this support scheme.
• The level of the feed-in tariff is high enough to make solar elec-tricity a viable choice for the investor.
• The utility is obliged to buy solar electricity at the fixed tariff.• The extra costs for solar electricity are not paid by the state but
by all electricity customers, resulting in a very limited additional financial burden (in 2003 the extra cost per household was Ð12).
• The system favours the installation of high quality solar electric-ity units and the owner has a strong incentive to both maintain the system and maximise energy output for at least 20 years.
PART FOUR: THE SOLAR FUTURE
Table 4.5: Solar market in Germany to 2025
MW MWh tCO2 Market Volume in Mio.Ð Jobs
2003 139 434.950 260.970 579 4.2652004 450 884.950 530.970 537 13.6392005 700 1.584.950 950.970 3.920 21.4502010 1.200 6.531.943 3.919.166 4.955 37.1012015 1.293 12.807.404 7.684.443 4.044 50.3982020 1.359 19.467.624 11.680.575 3.345 76.0732025 1.428 26.467.583 15.880.550 2.937 79.953
Total 2000 till 2025 26.380 237.059.660
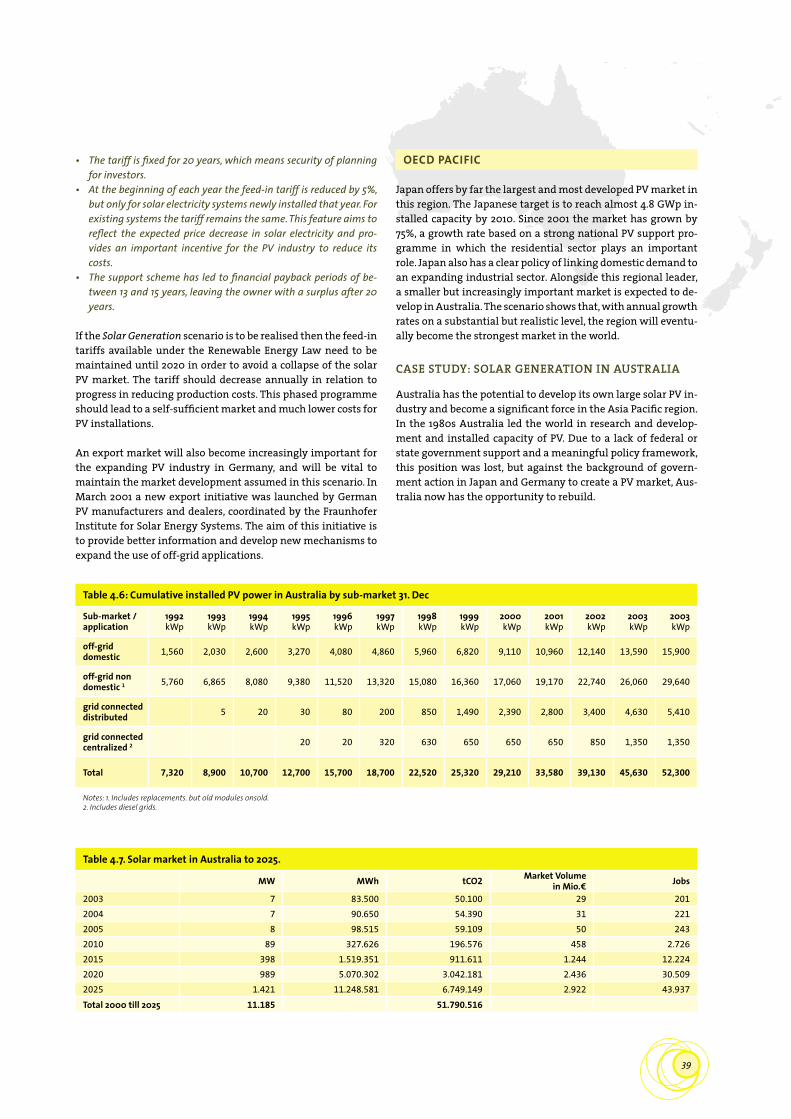
39
• The tariff is fixed for 20 years, which means security of planning for investors.
• At the beginning of each year the feed-in tariff is reduced by 5%, but only for solar electricity systems newly installed that year. For existing systems the tariff remains the same. This feature aims to reflect the expected price decrease in solar electricity and pro-vides an important incentive for the PV industry to reduce its costs.
• The support scheme has led to financial payback periods of be-tween 13 and 15 years, leaving the owner with a surplus after 20 years.
If the Solar Generation scenario is to be realised then the feed-in tariffs available under the Renewable Energy Law need to be maintained until 2020 in order to avoid a collapse of the solar PV market. The tariff should decrease annually in relation to progress in reducing production costs. This phased programme should lead to a self-sufficient market and much lower costs for PV installations.
An export market will also become increasingly important for the expanding PV industry in Germany, and will be vital to maintain the market development assumed in this scenario. In March 2001 a new export initiative was launched by German PV manufacturers and dealers, coordinated by the Fraunhofer Institute for Solar Energy Systems. The aim of this initiative is to provide better information and develop new mechanisms to expand the use of off-grid applications.
OECD PACIFIC
Japan offers by far the largest and most developed PV market in this region. The Japanese target is to reach almost 4.8 GWp in-stalled capacity by 2010. Since 2001 the market has grown by 75%, a growth rate based on a strong national PV support pro-gramme in which the residential sector plays an important role. Japan also has a clear policy of linking domestic demand to an expanding industrial sector. Alongside this regional leader, a smaller but increasingly important market is expected to de-velop in Australia. The scenario shows that, with annual growth rates on a substantial but realistic level, the region will eventu-ally become the strongest market in the world.
CASE STUDY: SOLAR GENERATION IN AUSTRALIA
Australia has the potential to develop its own large solar PV in-dustry and become a significant force in the Asia Pacific region. In the 1980s Australia led the world in research and develop-ment and installed capacity of PV. Due to a lack of federal or state government support and a meaningful policy framework, this position was lost, but against the background of govern-ment action in Japan and Germany to create a PV market, Aus-tralia now has the opportunity to rebuild.
Table 4.6: Cumulative installed PV power in Australia by sub-market 31. Dec
Sub-market /application
1992kWp
1993kWp
1994kWp
1995kWp
1996kWp
1997kWp
1998kWp
1999kWp
2000kWp
2001kWp
2002kWp
2003kWp
2003kWp
off-grid domestic 1,560 2,030 2,600 3,270 4,080 4,860 5,960 6,820 9,110 10,960 12,140 13,590 15,900
off-grid non domestic 1 5,760 6,865 8,080 9,380 11,520 13,320 15,080 16,360 17,060 19,170 22,740 26,060 29,640
grid connected distributed 5 20 30 80 200 850 1,490 2,390 2,800 3,400 4,630 5,410
grid connected centralized 2 20 20 320 630 650 650 650 850 1,350 1,350
Total 7,320 8,900 10,700 12,700 15,700 18,700 22,520 25,320 29,210 33,580 39,130 45,630 52,300
Notes: 1. Includes replacements. but old modules onsold. 2. Includes diesel grids.
Table 4.7. Solar market in Australia to 2025.
MW MWh tCO2 Market Volume in Mio.Ð Jobs
2003 7 83.500 50.100 29 2012004 7 90.650 54.390 31 2212005 8 98.515 59.109 50 2432010 89 327.626 196.576 458 2.7262015 398 1.519.351 911.611 1.244 12.2242020 989 5.070.302 3.042.181 2.436 30.5092025 1.421 11.248.581 6.749.149 2.922 43.937Total 2000 till 2025 11.185 51.790.516

40
PART FOUR: THE SOLAR FUTURE
3/4/5. Australian PV Power Systems Consortium, Task 1, National Survey Report of PV Power Applications in Australia 2005, Muriel Watt, University of NSW, Sydney Australia, May 2006
RENEWABLE REMOTE POWER GENERATION PROGRAMME3
The Renewable Remote Power Generation programme was estab-lished to support a reduction in diesel-based electricity generation by providing up to 50% of the capital costs of off-grid renewable energy installations. Recently it was extended to ‘fringe-of-grid’. 2.08 MWp of PV was installed under RRPGP in 2005, bringing the total installed capacity to 5.35 MWp under this programme, of which 0.81 MWp is installed in large utility run diesel grid systems. The latter includes 0.43 MWp of solar concentrating dishes com-missioned in the NT, with an additional 0.29 MWp to be commis-sioned in early 2006. Although it is not PV specific, over 95% of small systems installed under the RRPGP include some PV. The overall programme has funds of around AU$ 205 million allocated to it, of which around AU$ 141 million had been allocated by end 2005. In addition, AU$ 7.5 million has been allocated to industry support activities, including test facilities, standards development, training, feasibility studies and demonstration projects. A specific allocation of AU$ 8 million has been made for the Bushlight pro-gramme to assist with the development of industry capability and local understanding of renewable energy systems in small indige-nous communities and to install household and community sys-tems.
A total of approximately AU$ 16.7 million was paid towards PV based renewable energy systems during 2005. Around 69% of the systems installed in 2005 were for residential purposes and 31% for agricultural / industrial uses, including water pumping systems. Under the Bushlight programme, 80 communities have been through an energy planning process and 65 PV powered house-hold systems have been installed
PHOTOVOLTAIC REBATE PROGRAMME4
Australian Government funded, with administration by the State Governments. The programme commenced in 2000 and is cur-rently funded until 2007. Householders are eligible for a rebate of 4 AU$/W capped at 4,000 AU$ per residential system. Rebates will be reduced in stages to AU$ 3,50/Wp over 2006-2007. Smaller re-bates are also paid for extensions to an existing system. Commu-nity buildings attract an AU$ 4/Wp rebate but have had a higher cap of AU$ 8,000. This cap will be reduced to AU$ 4,000 from 2006. As part of the Programme, the Australian Government has made available one million Australian dollars to fund projects by residential housing developers and display home builders. A rebate of AU$ 3,50/Wp, reducing to AU$ 3/Wp by end 2007, is available to developers in AU$ 50 000 blocks.
In 2005, 1,042 systems (1.553MWp) were installed, with AU$4.02 mil-lion allocated in rebates. This brought the programme total to more than 6,700 systems (8.2 MWp), with rebates of AU$35 mil-lion.
MANDATORY RENEWABLE ENERGY TARGETA national review of the MRET was conducted in 2003 and among its recommendations were the following most relevant to PV:• that the 9,500 GWh target for 2010, maintained until 2020, be
changed to increase to 20,000 GWh by 2020• that the shortfall charge be indexed to the Consumer Price In-
dex from 2010 onwards• that the deeming time for PV systems with a rating not more
than 10 kW be extended from 5 to 15 years• that the eligible threshold for PV generation eligible for deem-
ing be increased from 10 kW to 100 kW• that a review to be undertaken to determine how further con-
sideration can be given to special assistance for the Australian PV industry, either through enhancement of MRET or other measures.
However, in its 2004 Energy White Paper the government ruled out any increases to the size or duration of the target. The two PV deeming recommendations have been adopted..
SOLAR CITIES5
The Australian Government’s Solar Cities initiative has stimulated interest in PV, and sustainable energy options more generally, from sectors which have not previously been especially active in the area, such as financial services and local government or, in the case of utilities, which have been active in the past but not been able to pursue useful deployment recently. Consortia were formed to bid for the Solar City funding and comprise a mix of PV compa-nies, banks, local governments, utilities and research groups. The Commonwealth Government is currently evaluating 11 bids from which 4 Solar Cities will be chosen. They will share AU$75 million over 7 years and are expected to include new PV deployment strat-egies.
THE ROLE OF UTILITIESThe rapid growth in electricity demand, and particularly in peak load demand, is dominating utility planning in Australia at pres-ent. Increased air conditioner use is the major contributor to both these trends, but particularly to the increase in peak demand. These developments have an indirect bearing on utility attitudes to PV. At substations where PV can be shown to generate during times of peak demand, there is likely to be utility interest. Never-theless, PV remains a high cost option and there has been no dis-cussion so far on possible utility incentives for PV installation. At the same time, plans are underway for a national energy regula-tor to replace the 7 State and Territory regulators. This would en-courage more consistent approaches to energy sector regulation in future, and hence to standardisation of procedures, but may not see any direct benefits for PV. Plans are also underway to progres-sively roll out interval meters across all customer groups. This would allow utilities to introduce time of use tariffs which may place a higher value on daytime power generation. At present PV’s daytime generation profile is not rewarded in the market.
THE AUSTRALIAN PV INDUSTRYCell production in 2005 was 35.54 MWp and module production 6.72MWp. BP Solar is the major PV manufacturer in Australia and expects to maintain its current production capacity of 50 MW for the immediate future. Origin Energy expects to begin pilot pro-duction of its Sliver® cell technology and will consider large scale manufacture in future. In 2005 it released prototype 40, 70 and 140 W modules and received an AU$ 5 million grant from the Com-monwealth Government’s Renewable Energy Development Initia-tive to continue its commercialisation trials.
Australia remains a leader in research and development of PV technologies. In 2006, a crystalline thin film technology developed in Australia is to enter commercial production by CSG Solar in Ger-many and the Sliver® cell technology is to enter pilot production by Origin Energy in Adelaide. Patents for a number of new and improved technologies and production processes continue to be developed and licensed to Australian and international compa-nies. Chinese based PV manufacturer, Suntech Power, which is a joint Chinese - Australian company, continues to improve its pro-duction processes in cooperation with Australian researchers. Sun-tech Power floated on the New York stock exchange in December 2005 and its stock price is currently about twice the listing price. The company has been awarded the contract to supply 130 kW of PV for the Beijing Olympic Stadium. With a weak local market, Australian companies and researchers are likely to continue to look internationally for commercialisation of their technologies.

41
AUSTRALIAN PV MARKET STATUS
Installations of PV in Australia grew at a steady rate of 15% over last year and totalled 8.3 MWp in 2005. The largest PV market, accounting for 3.4 MWp in 2005, is in off-grid systems for indus-trial, agricultural and telecommunications applications. Off-grid residential systems comprise the next largest market at 2.9 MWp, followed by grid connected (main grid and diesel grid) residential systems with 1.4 MWp. Australia has many small diesel grid systems in remote towns and 0.5 MWp of PV was connected in centralised systems to the main power stations, in addition to distributed systems connected via individual homes which receive power from diesel grids.
PV module prices remained steady in 2005 at around AU$ 8 per Wp. Prices are largely set on the international market, but are influenced by exchange rates and local delivery costs. System prices vary by location and application but have also remained reasonably steady in 2005. Residential rooftop systems aver-aged AU$ 12-14 per Wp and stand-alone systems for off grid ap-plications AU$ 19-22 per Wp, although system types and inclu-sions vary widely.
In the Greenpeace/EPIA scenario, concerted action by industry and government would lead to a strong solar PV industry in Australia, with an increase of the overall installed capacity of approximately 100MWp by 2010. By 2025 the market volume would reach 1,400MWp. About 43,000 jobs could be created in the Australian PV industry. This figure could be even higher if the manufacturers also focused on exports.
In August 2004 the Australian PV industry released its own PV Road Map. This includes targets and strategies for the different PV market sectors, and with overall targets for 2010 and 2020 in terms of installed capacity, employment, market value and CO2 abatement. These differ somewhat from the global Green-peace/EPIA Scenario, for example where specific Australian as-sumptions have been taken for the level of carbon reduction.
GOVERNMENT POLICY AND PROGRAMMES3
There are currently two main market development programmes provided by the government for PV in Australia: the Renewable Remote Power Generation Programme (RRPGP) and the Photo-voltaic Rebate Programme (PVRP). Some regional authorities provide top-up funds. In addition, the Mandatory Renewable Energy Target (MRET) sets a national requirement for power companies to source an increasing proportion of their electricity from renewable energy. The current MRET has not been a par-ticularly strong driver for PV. Nevertheless, increased utility up-take of renewables, and the improved public awareness which accompanies this, provides benefits to all technology groups.
The Jurisdictional Regulators in the states of New South Wales, Victoria and South Australia1 have released rulings stating that new meters on non-market generators2 must be able to mea-sure positive and negative flows of electricity separately. How-ever, despite this regulation, net metering may still be legal where all parties agree.
If a system owner wishes to be rewarded for network support and reduced exposure to peak prices, they must be able to mea-sure the gross flow of electricity to the grid at specific times, especially during peak demand. Net metering does not have this capability, and either interval metering or an inverter with separate monitoring or data download is required.
Most retailers currently pay the same tariff for imported and exported electricity, except for Australian Inland Energy, which pays one cent more for export. Some retailers may only pay the wholesale rate for net export. Many of the retailers and Distrib-uted Network Service Providers (DNSPs) are currently review-ing their grid-connect arrangements
1. Independent Pricing and Regulatory Tribunal (IPART) in NSW; Victorian Essential Services Commission (VESC); Essential Services Commission (ESCOSA) of South Australia.2. Non-market generators must have their entire output purchased directly by the local retailer or by a customer located at the same connection point. Residential-scale renewable energy systems are classified as non-market generators.

42
CASE STUDY: SOLAR GENERATION IN JAPAN
Japan is currently the world leader in PV applications and the EPIA/Greenpeace scenario expects this position to be main-tained for a further 15 years. The success of Japan has been largely attributable to a focus on support for home applications, accounting for over 70% of the total installed capacity. If strengthened policies are put in place, the annual growth rate between 2005 and 2010 is expected to be 30%.
Table 4.5 summarises the findings of the scenario for Japan, showing future prospects for installed capacity, electricity gen-erated, avoided COc emissions, the total value of the PV market and job creation. Installed capacity is projected to reach 3.2 GWp by 2010, with electricity output of about 3.2 TWh. By 2025 it will have exceeded almost 43 TWh, covering 3.5%% of Japan’s electricity demand and with an installed capacity of 30 GWp. Over the next 15 years the number of jobs created by the PV in-dustry in installation and maintenance services could be more than 92,000.
GOVERNMENT POLICY AND PROGRAMMES
In order for the ambitious target of 4.82 GWp by 2010 to be re-alised, appropriate policies must be put in place. The current market growth rate slowed down, and without any additional measure, the target will not be achieved. Rapid expansion of PV
installations in Japan has been made possible by a set of efforts by the government, PV manufacturers and utilities, including net metering schemes. Home applications have been playing an important role in the PV market in Japan, representing 90% of installations in Japan last year. The subsidy for home appli-cations, however, ceased at the end of 2005.If the promising home application market is to continue to flourish, either the subsidy for home application should be restarted or a replace-ment devised.
One significant issue is that consumers currently pay a month-ly figure of about $20 to support the programme, and further efforts must be made to reduce the cost of PV systems. Reaching a level of $5,000 per kWp would make the price acceptable to PV installers and could lead to a rapid expansion in home ap-plications.
The Renewable Portfolio Standard enacted by the government in 2003 should be expanded from its current target of 1.35% by 2010 in order to provide an incentive for increased use of solar energy. It should also differentiate between (more expensive) solar generation and other renewable sources such as biomass and wind.
Overall, energy policy in Japan continues to focus on fossil fuels and nuclear energy. More attention needs to be given to the use of renewable energies, including solar, and clearer commit-ments made by the government for further expansion.
PART FOUR: THE SOLAR FUTURE
Table 4.8: Solar market in Japan to 2025
MW MWh tCO2 Market Volume in Mio.¤ Jobs
2003 223 801.400 480.840 926 6.8682004 267 1.068.760 641.256 1.030 8.2442005 291 1.359.760 815.856 1.630 8.9972010 1.038 4.614.170 2.768.502 4.287 31.9142015 2.451 14.063.795 8.438.277 7.668 75.6702020 3.129 28.285.898 16.971.539 7.702 96.8352025 2.975 43.465.437 26.079.262 6.120 92.261Total 2000 till 2025 43.193 307.611.647

43
OECD NORTH AMERICA
Growth rates envisaged in this scenario for the North American PV market have been the most moderate in the industrialized world, but much has changed over the past couple of years in the United States. With the adoption of the federal tax credit and state incentives the market is expected to grow substan-tially over the next decade. By comparison, Canada does not play a significant role as yet, with a total installed capacity of 7MWp and a growth in 2000 of just 1.3MWp.
The US market is increasing significantly, as evidenced by Ger-man and Japanese solar companies moving into the US market. The United States also has more sun and higher electric rates in many jurisdictions. As a result solar power will be cost-effective in a number of localities by around 2015 without state subsi-dies. The US market will need to grow about 20% annually over the next decade to meet the state requirements with annual installed capacity around 2 GWp in 2020. By comparison, the annual solar power markets in OECD Europe and OECD Pacific is expected to grow by 30% per year and exceed 8 GWp by 2020.
CASE STUDY: SOLAR GENERATION IN THE UNITED STATES
If the US government decided to establish a more aggressive long-term support scheme similar to those operating in Ger-many or Japan, then a different market development would be possible (see Table 4.6). This scenario assumes that the US do-mestic market will develop along the lines of Europe, with an ambitious target for 2,500MWp of cumulative capacity by 2010. To achieve this, strong market growth is required, with the as-sumption that after 2010 the annual growth rate would be the same as in Europe. This dramatic development would have a serious impact on the world PV market. It would mean that half of the estimated world market volume would be installed in the United States, and the industry would create more than 175,000 jobs.
GOVERNMENT POLICY AND PROGRAMMES
The conclusion of the scenario for US federal and state energy planners is that if Congress extends the federal tax and redou-bles its commitment to solar power with expanded research and development funding, and improved interconnection and net metering standards, the market growth could be equal to Japan and Germany. The US PV industry would then be among the world leaders. If the United States continues on its current path, the growth is likely to be about half as large.
Table 4.9: Solar market in the US to 2025
MW MWh tCO2 Market Volume in Mio.US$ Jobs
2003 63 514.440 296.676 262 1.9342004 94 690.840 398.196 362 2.8832005 105 888.840 511.596 588 3.2442010 603 4.252.724 2.413.120 2.491 18.5662015 2.240 20.131.573 10.074.184 7.009 68.9352020 3.608 55.713.157 26.323.334 8.883 111.5252025 5.811 113.017.654 52.492.752 11.953 179.612Total 2000 till 2025 48.618 461.923.322

44
SOUTH ASIA
The solar market in South Asia is dominated by India, both on the supply and demand side. A flourishing domestic PV indus-try has developed in the large Indian market, and there is long-term experience of the technology. The high level of demand for electricity in those areas of the region that are not connect-ed to the grid, coupled with a domestic PV industry and favour-able operating conditions, offer excellent opportunities to tap the vast solar electricity potential. The most difficult issue is about how adequate financing can be made available for PV systems to be installed in rural areas where per capita income is very low.
CASE STUDY: SOLAR GENERATION IN INDIA
The only country in Asia with a government department solely devoted to the promotion and support of renewable energy, In-dia’s national energy policy is to achieve a 10% share of electric-ity from renewables by 2012. India offers a 100% subsidy on so-lar PV systems for remote village electrification. This means that every village which does not have electricity connection can go in for community solar PV systems for which the govern-ment has 100% subsidies. For other villages which are electri-fied, the government offers a 60% subsidy especially for solar pumping systems. For urban solar PV systems, while there is no subsidy offered, the banks and financial institutions offer loans for such systems on a subsidised rate of interest. The rate of in-terest for such loans is 2% per annum.
The Greenpeace/EPIA scenario is based on an average growth rate between 2000 and 2020 of 35%. By 2025, the Indian PV mar-ket would have a market volume of about Ð4 billion a year. If all the systems installed were manufactured in India itself this would add a further roughly 80,000 jobs to the 108,000 expect-ed to result from work on installation and maintenance.
GOVERNMENT POLICY AND PROGRAMMES
The Indian government needs to continue demonstrating its commitment to mainstream PV by providing incentives to de-velopers and manufacturers of the technology. It should estab-lish a nationwide support scheme with the aim of achieving equal market conditions throughout the country. The national agencies should also look towards attracting foreign invest-ment, either through independent power projects or public sec-tor programmes designed specifically for PV. One further incen-tive would be the removal of all subsidies for fossil fuel technologies.
EAST ASIA
The East Asian market, currently quite small, is still expected to be one of the key markets over the coming decades. Thailand will be an important player in this region.
CASE STUDY: SOLAR GENERATION IN THAILAND
The Thai government supports the development of renewables through its Energy Conservation Programme. Financial incen-tives are provided through subsidy schemes, including a 50% grant towards the capital cost of rooftop PV systems during a pilot phase. The National Energy Policy Office and the Depart-ment of Energy Development and Promotion are also in the process of preparing a National Renewable Energy Policy that specifies priorities and further support measures. Incentives and an obligation on power producers are expected to deliver an additional 214MW of PV by 2011. A separate project is already underway to provide 120W solar home systems to 300,000 households within the next years. The two measures would to-gether put the nationwide installed capacity at over 250MW by 2011.
PART FOUR: THE SOLAR FUTURE
Table 4.10: Solar market in India to 2025
MW MWh tCO2 Market Volume in Mio.¤ Jobs
2003 11 139.944 83.966 48 3442004 13 158.693 95.216 54 4132005 16 181.191 108.715 94 4962010 180 656.953 394.172 929 5.4622015 968 4.518.561 2.711.136 3.407 29.7342020 1.947 15.027.330 9.016.398 4.794 60.1082025 3.509 34.704.579 20.822.748 7.218 108.384Total 2000 till 2025 24.729 55.387.251 154.446.573
Table 4.11: Solar market in Thailand to 2025
MW MWh tCO2 Market Volume in Mio.¤ Jobs
2003 3 22.263 13.358 18 1042004 5 28.844 17.306 24 1552005 8 38.716 23.229 53 2332010 82 322.165 193.299 383 2.5372015 306 1.582.249 949.349 958 9.4202020 762 5.136.131 3.081.678 1.875 23.4882025 1.227 11.786.521 7.071.913 2.524 37.920Total 2000 till 2025 9.058 18.916.888 53.267.693

45
Total installed capacity of PV in Thailand is currently about 24.9MW, with approximately 8MW installed during 2005. The two new solar PV programmes could build up a stable and self-supporting network by 2010. The Greenpeace/EPIA scenario is based on a target for 250MW installed capacity by 2010. With a market growth rate of 30% between 2010 and 2015, decreasing to 20% and 10% towards the end of the scenario period, Thai-land could become one of the most important PV markets in the East Asia region. Within ten years, this level of market develop-ment would create more than 2,000 jobs in installation and maintenance. By 2025 more than 37,000 jobs could be expected in installation and maintenance, with additional potential in manufacture and development.
GOVERNMENT POLICY AND PROGRAMMESThe Thai government should continue to demonstrate its com-mitment to PV by providing incentives for developers and man-ufacturers. An essential element of this would be a law similar to India‘s which removes all institutional, market and policy barriers to the operation of renewable projects, including PV. The Thai authorities should also investigate tapping foreign in-vestment through private or public sector projects. One simple step would be to capitalise on the flourishing overseas tourism industry by ensuring that all resorts and hotels are supplied by solar electricity.
LATIN AMERICA
CASE STUDY: SOLAR GENERATION IN BRAZIL
Presently Brazil’s participation in actual the PV world market is very poor, considering the country’s potential - which is huge. Side conditions are excellent, high irradiance with low seasonal variations between 1,400 kWh/m_a and 2,200 kWh/m_a and a large amount of possible applications such as substitution of diesel generators in numerous off-grid applications, the obliga-tion of the concessionaries to bring electricity to the whole population until 2008, and general increasing electricity con-sumption. There are still about 12 million people and 25,000 schools without electricity in Brazil.
GOVERNMENT POLICY AND PROGRAMMESThe largest effort to apply PV was the PRODEEM Programme, which was planned to bring electricity to 6,000 rural locations in Brazil, principally for communal use: schools, health posts,
public street lighting, and water pumping. The total installed PV capacity of PRODEEM is 5.2MW, divided into 8,700 systems. These systems have been installed in 26 Brazilian states, princi-pally in the north-eastern semi-arid regions and in the Ama-zon. It was considered as the largest rural electrification pro-gramme in developing countries.
While the planning and purchase phase or PRODEEM was car-ried out thoroughly, the installation, operation and mainte-nance phase was a failure due to inadequate locations, incom-petent installers, lack of spare batteries, equipment and tools. This gave PV technology a bad reputation in the rural popula-tion. After a reconstruction phase, PRODEEM, including PV, was integrated in the large “Luz para todos” (Light/Electricity for all) Programme, which is designed to bring electricity to the entire Brazilian population until 2008.
While there is still no PV feed-in legislation in Brazil, only nine grid connected installations could be identified, mainly set up and operated by research centres, universities and schools. The largest is a 40 kW system at the research centre of Petrobras, the second largest is a 16.5 kW system at CEPEL, the research centre of the national electricity supplier Eletrobras, both lo-cated in Rio de Janeiro.
INSTALLED CAPACITY AND ACTUAL MARKETAccording to the Ministry of Mines and Energy the present in-stalled PV capacity in Brazil is 9MW. Another study by Professor Zilles from the Electrical Engineering Department at the Uni-versity of Sao Paulo (USP), considering more international NGO activities, gives a figure of 15MW. Due to the lack of detailed sta-tistics, annual installation rates are not known exactly, but are approximately 3MW for 2005. After the termination of the PRODEEM Programme PV installation has been mainly carried out by NGOs, a couple of projects by Petrobras and Eletrobras, and some private house projects in the kW range.
The Greenpeace/EPIA scenario is based on a target for 150MW installed capacity by 2010. With a average market growth rate of 35% between 2010 and the end of the scenario period, Brazil could become one of the PV market drivers in Latin America. Within ten years, this level of market development would cre-ate more than 10,000 jobs in installation and maintenance. By 2025 more than 60,000 jobs could be expected in installation and maintenance, with additional potential in manufacture and development
Table 4.12: Solar market in Brazil to 2025
MW MWh tCO2 Market Volume in Mio.¤ Jobs
2003 2 27.672 16.603 10 602004 2 31.090 18.654 12 752005 3 35.362 21.217 21 942010 62 239.881 143.928 319 1.8972015 332 1.565.175 939.105 1.039 10.2052020 827 5.718.848 3.431.309 2.035 25.4912025 2.057 16.054.516 9.632.710 4.232 63.429Total 2000 till 2025 11.454 23.672.543 61.417.048

46
In order to achieve the Greenpeace/EPIA scenario the following measures are required:
• For the private user an effective financing instrument has to be set up. Currently private bank loans are as high as 42% per year: this makes PV investments impossible, even with high grid com-pensation. A special PV loan for about 8% per year would be needed, such as BNDES for PROINFA.
• Import federal taxes are 25% for modules and 20% for cells: these should be reduced by at least 10%.
• Import of PV production equipment and raw materials should be tax-free. If all that is fulfilled, a grid-feed compensation of 0.70 R$ (Ð0.27)
per kWh of PV electricity would be viable. There are many isolated locations which are designated for the set-up
of additional diesel power plants. This should be avoided by applying a COc tax (at international market prices), and cut existing subsidies for remote diesel power supply. PV would be very competitive there.
A visible showcase project would very helpful for the promotion of solar energy in Brazil and Latin America. A suggestion is the PV power supply for the Island of Fernando de Noronha in the South Atlantic, 300 km away from Natal. This most famous and very beautiful natural sanctuary of Brazil is frequently visited by ce-lebrities and often appears in the media. The island is currently supplied by electricity from several diesel generators and an el-derly 75 kW wind generator, and its grid condition is instable. While there is already control of tourist access along with an con-siderable environmental tax to be charged from every tourist, this instrument may be used to raise PV funds.
CHINA
CASE STUDY: SOLAR GENERATION IN CHINA
As a major fossil fuel generator, China has made a serious com-mitment towards exploiting its renewable energy resources. On 1st January 2006, the Chinese Renewable Energy Law came into effect, which provides a legal framework for the development of renewable energies in China. The new law includes three mecha-nisms - supportive tariff, guaranteed grid access and a renewable energy fund. In its following implementing rules, it says that the tariffs for grid-connected solar power projects are decided by the government on the principle of reasonable costs plus reasonable profits. According to the long-term planning proposed by the government, the installed capacity of solar power in China would reach 2,000MW by 2020. By the end of 2005, China had installed a generation capacity of 70MWp, distributed as follows:
Table 4.14: PV in China by Application Installed capacity by end of 2005
Rural electrification 40MWpTelecommunications 20MWpConsumer goods 8MWpGrid-connected systems 2MWp
In the meanwhile, solar power has played an important role in the rural development of China. Over 60% of the Chinese popu-lation lives in rural areas, and 12 million people still had no ac-cess to electricity by the end of 2005. The Chinese government introduced the programme “Song Dian Dao Xiang” (sending electricity to villages), which plans to install 100-150MWp of so-lar power over 2005 to 2010. However, compared to the modesty of Chinese governmental ambition in solar energy, the real per-formance of Chinese solar industry has been far more encour-aging. 2005 witnessed the booming of the Chinese solar PV manufacturer Suntech Power, who sold 1,200MW of its products and successfully launched its IPO on NYSE. Founded in 2001, Suntech has grown into one of the world‘s top 10 manufactur-ers within years. The story of Suntech has demonstrated the rapid growth of the Chinese solar PV industry, as well as the huge potential of this market. In the Greenpeace/EPIA scenario, China is expected to produce a growth rate of about 30% over the next decade. This will rise to 45% between 2010 and 2020.
In 2025 the Chinese solar PV market could be the third largest in the world, creating nearly 430,000 jobs in installation alone. The total energy output in 2025 would be 112 TWh, the equiva-lent of more than 100 coal-fired power plants. This market de-velopment needs a strong and long-term support programme.
POLICY RECOMMENDATIONS
Setting bold targets is an important first step for a successful solar energy market. If the target is set too low, like the current target set by the Chinese government for 2020, the required commitment for local manufacture and price reduction will not materialize. On the other hand, supportive policies, especially supportive tariff policies, have to be in place in order to help achieve the ambitious targets. There is still much ambiguity in the current tariff regulations for solar energy projects in China. It is believed that a more easy-to-operate supportive tariff, such as a fixed price feed-in-tariff system similar to those operating in Europe, could give a tremendous further boost to the Chinese domestic market, also for grid-connected PV.
PART FOUR: THE SOLAR FUTURE
Table 4.13. Solar market in China to 2025.
MW MWh tCO2 Market Volume in Mio.© Jobs
2003 25 141.000 84.600 130 7702004 35 183.000 109.800 169 1.0752005 44 235.500 141.300 306 1.3482010 211 958.455 575.073 1.088 6.4672015 1.351 5.365.970 3.219.582 4.753 41.4492020 8.657 33.616.968 20.170.181 21.313 265.6772025 13.942 103.380.405 62.028.243 28.679 430.934Total 2000 till 2025 86.100 347.056.589

PART FIVE
THE RIGHT POLICY FOR THE SOLAR GENERATION

48
FEED-IN TARIFF: THE DRIVER OF THE SOLAR SUCCESS STORY IN EUROPE
It is evident that without the support of suitable instruments the expansion of the solar electricity markets worldwide will not happen at a sufficient speed. In order to accelerate the re-construction of our electricity supply it is necessary to imple-ment powerful and efficient tools supporting the use of solar electricity. The premium feed-in tariff has proved its power and efficiency during the previous years.
Worldwide people are surprised by the fact that Germany, a country which is not one of the sunniest places in the world, has developed the most dynamic solar electricity market and PV industry. How could this happen? Many different kind of programmes in many countries have been started in the past in order to accelerate the PV markets, but none has been as suc-cessful in such a short period of time as the feed-in tariff in Ger-many. The idea of the feed-in tariff has been adapted in several European states and of course each country adjusted it to its specific needs. The basic idea behind it is very simple.
Producers of solar electricity: have the right to feed solar electricity into the public grid• receive a premium tariff per generated kWh reflecting the bene-
fits of solar electricity compared to electricity generated from fossil fuels or nuclear power
• receive the premium tariff over a fixed period of time.
All three aspects are simple but it took significant effort to es-tablish them. For many years the utilities did not allow the feeding in of solar electricity into their grid and this is still the case in many countries even today. Therefore that right cannot be taken for granted and in most countries the utilities fight this idea forcefully once it comes up.
FEED-IN TARIFF: WHO PAYS FOR IT?
In the past in order to push solar electricity many programmes were financed through a ministry’s budget. Obviously this im-plies the big disadvantage that if state money ran out, the pro-gramme could be stopped. Therefore the feed-in tariff model takes a completely different approach.
In Germany in 2006 the utilities pay a premium tariff of Ð0.51/kWh for solar electricity from newly- installed PV systems. Therefore they have higher costs from the premium tariff. The utilities are authorised to pass this extra cost, spread equally, to all electricity consumers via their usual electricity bill. With this system the feed-in programme works independently from the state economy. The extra cost that each electricity consum-er has to pay in order to increase the share of renewable energy in the national electricity portfolio is very small. In Germany the monthly extra costs per household due to the feed-in tariff for solar electricity was less than Ð0.30. If ALL renewable energy sources are taken into account it was Ð1.5. In this way every electricity consumer contributes to the restructuring of the na-tional electricity supply structure from a fossil-based one to-wards a sustainable and independent electricity supply struc-ture.
FEED-IN TARIFF: THE DRIVER OF COST REDUCTION
The costs for solar electricity have been reduced constantly since the technology was introduced to the market. But it is evi-dent that today in most cases solar electricity cannot yet com-pete with grid electricity generated from fossil fuels. While it is expected that prices for electricity generated from fossil fuels will keep rising constantly, at the same time it is very impor-tant to keep a high pace in bringing the costs for solar electrici-ty down. For this reason the feed-in tariff in Germany is reduced each year by 5%, but only for newly installed PV systems. Once
PART FIVE: THE RIGHT POLICY FOR THE SOLAR GENERATION

49
a PV system is connected to the grid the feed-in tariff remains constant over the complete period of 20 years. By this feature of the reduction by 5% each year there is a constant pressure on the PV industry to bring the costs for solar electricity down by 5% each year in order to keep the market alive. At the same time the customer can very easily calculate the return of investment for the PV system. This planning security is an essential ele-ment of the success story for the feed-in tariff.
FEED-IN TARIFF: THE DRIVER OF HIGH-QUALITY SOLAR ELECTRICITY SYSTEMS
Many solar electricity programmes are based on an investment subsidy in order to reduce the barrier of high up-front invest-ment for PV systems. The drawback of such an approach is the missing incentive to invest in high-quality solar electricity sys-tems and also to invest in the maintenance of the system dur-ing its lifetime. If the customer receives a fixed payment per installed capacity unit, there is no incentive to go for high-qual-ity products that usually mean a higher price.
With the investment subsidy approach there is also little incen-tive to maintain the system properly over its whole lifetime. Maintenance is linked to a moderate degree of investment, but if the customer received the complete financial incentive up-front, there is no incentive to operate the system at the highest possible level.
With the feed-in tariff the return of investment for the custom-er is heavily dependent on the performance of the PV system. High performance means high return of investment. The cus-tomer gets his return of investment with each kWh that is fed into the grid. Therefore the maximising of the power output of the PV system over its whole lifetime is essential to the custom-er, and for this reason it is assured that the PV system will be well operated and maintained over its lifetime.
The feed-in tariff is the only system that rewards the genera-tion of solar electricity appropriately and not simply the instal-lation of such a system, which by itself does not have any ben-efit. Benefits arise only when solar electricity is generated. For this reason one could say that the feed-in tariff is a Solar Gen-eration reward system.
FEED-IN TARIFF: THE DRIVER OF EASIER FINANCING The up-front cost for solar electricity systems are a clear barrier to a wider market penetration. As explained in the previous paragraph, investment subsidies were implemented in many programmes in order to overcome this barrier. As pointed out this approach has significant disadvantages.
A feed-in tariff guaranteed by law over a sufficient period of time serves as an excellent security for the customer’s bank in order to finance the system. The PV system itself combined with the guaranteed feed-in tariff over 20 years in Germany is usually sufficient to receive a loan from the bank to buy a PV system. Of course it took some time until banks became famil-iar with PV systems and the implications of the feed-in tariff, but in the meantime the financing of PV systems via a bank loan in Germany is no longer a rare and time-consuming thing but very common and straight-forward.
THE FEED-IN TARIFF NEEDS A STRONG CO-DRIVER: SIMPLE AND QUICK ADMINISTRATION
There are countries in Europe with a good feed-in tariff in place but without a viable PV market in existence. How can this hap-pen? The feed-in tariff needs a strong partner in order to be able to unfold its full power and this is a simple and quick approval process from the administration. Even if an excellent feed-in tariff is in place, but the procedures for the approval of the in-stallation of the PV system and for its connection to the grid takes many months, perhaps even more than a year, the num-ber of potential customers will remain very limited. Therefore the customer’s effort to deal with administrative and licensing issues needs to be kept at a minimum in order to deter potential customers. A complex and time-consuming administration and licensing process is a clear indication for a electricity market that has not yet made substantial progress on the way to a lib-eralised energy market.

50
PREMIUM FEED-IN TARIFF FOR SOLAR ELECTRICITY
On the support side, customers must not be penalised finan-cially for making a choice to be supplied by solar electricity. In most industrial countries, conventional electricity is heavily subsidised, and the negative environmental impacts of its pro-duction are not reflected in the cost to end-users. Changes to this system appear to be some way off and other mechanisms for supporting solar power must meanwhile be promoted.
The German national feed-in tariff offers customers an attrac-tive price for selling their produced electricity to the utility grid. A crucial element of the German feed-in law is the fact that the tariff is set at the point of connection to the grid and this level is guaranteed for 20 years. The fact that the lifetime of this tariff is clearly defined at the outset offers customers planning secu-rity that makes the installation of a solar electricity system so attractive. A crucial aspect of the German approach is that the cost of the feed-in tariff is not paid by the government through a subsidy, but is rather financed by a small surcharge. This en-sures that such a scheme – once introduced with political sup-port – is less likely to become a political football during times of budget reductions at the government level.
The success of the German feed-in tariff model – which has re-sulted in the creation of a large number of new jobs in the solar electricity industry – is now being adopted in other countries in Europe. Extending such feed-in tariff mechanisms beyond Ger-many is a cornerstone of the European Photovoltaic Industry Association’s strategy for promoting the uptake of solar elec-tricity in Europe. The simplicity of the feed-in tariff concept and its low administrative costs means that it is a highly effective and efficient tool for boosting the role of solar electricity in na-tional energy mixes.
GUARANTEED GRID ACCESS
Given its major advantages for modern society, solar electricity should be given priority and guaranteed access to the grid. In many countries there is an enormous over-capacity in conven-tional electricity generation, with a range of power sources – from fossil fuels through to renewables – all jostling for the right to be fed into the grid. Solar electricity generators must be guaranteed automatic access, otherwise there is a risk that they will be squeezed out of the market completely. While instru-ments such as the European Union’s Directive on Renewable Electricity provide for priority access for solar power, this does not guarantee that solar generators will be able to sell the pow-er that they produce. Given the still developing structure of the industry, it is crucial, if we are to achieve a sustainable market in solar electricity in the industrialised world, that such access guarantees are a foregone consideration.
NEW MARKET OPPORTUNITIES
Clearly, just as with other emerging technology markets, deci-sions are not without their associated financial risks. The clear upward trend of current market developments, however, points to major opportunities for both existing and new players in the solar electricity sector. The expanding list of companies and consortia currently formulating strategies for exploiting the so-lar market is evidence of this.
For the market really to take off, however, the pioneers of yes-terday who have evolved into the market leaders of today must be joined by a widening industrial base so that the whole sector can secure the business successes of tomorrow, the potential for which has been mapped out in this report.
PART FIVE: THE RIGHT POLICY FOR THE SOLAR GENERATION

51
Entry into the solar electricity market is not the preserve of companies only active in the clean energy sector. Many of the leaders in the solar electricity industry were, and still are, lead-ing lights in the “old” energy economy. These global players have taken on board the challenge to integrate a solar electrici-ty business into a traditional energy production and retail structure. The sustained commitment of these companies will be appropriately rewarded if we create the right climate to en-sure that the whole solar electricity business sector moves rap-idly ahead.
Against this, there are also potential losers in the energy indus-try. Among these are those companies that have continued to focus solely on conventional energy technologies. With no base or limited expertise available to them in the solar sector, it will become increasingly difficult for these companies to benefit from the expanding photovoltaics market. Its expected growth over the next few decades will rapidly enhance the role that this technology will play in the energy mix. For any organisa-tion missing the boat, the consequences could be similar to those for data processing companies that failed to predict the impact that personal computers would have on every aspect of business and domestic life in the 1980s. Even once mighty blue chip companies such as IBM are still trying to recover from a lack of vision at a critical moment.
GOVERNMENT AND INDUSTRY COMMITMENT
Governments that have taken steps to broaden their energy sup-ply base with an abundant clean technology such as photovoltaics will also be able to count themselves among the winners. Such di-versification not only brings benefits in terms of greater security of energy supply but also leads to wider environmental benefits though the deployment of zero-emission technologies that, ac-cording to the predictions presented here, will make a significant impact on global COc emissions over the coming decades.
At present, the nations of the industrialised world vary greatly in their commitment to solar electricity. While countries such as Germany and Japan, as well as others in Europe, have moved forward from discussion to implementing the necessary sup-port schemes, others have actually cut back their solar electric-ity programmes. In the United States in particular, this could severely affect the ability of the national solar electricity indus-try to fulfil its promise as a global exporter providing for sus-tainable employment at home.
Both industry and governments, however, will have to extend their differing commitments to the solar sector if the potential identified in this report is to be fully exploited. On the industry side, continuing and accelerated investment in the expansion of production facilities is needed in order to meet the demands of the market and to ensure that the cost, and ultimately the price of the technology, is brought down through production up-scaling and introduction of new manufacturing techniques and materials. On the government side, the commitment to the solar electricity sector in many countries needs to be extended. Besides the introduction of net metering and premium tariffs, building regulations need to be adapted to provide a greater in-centive for the deployment of solar electricity systems in the built environment.
Like every other industry, the solar electricity sector will only move forward if sufficient investment is committed to provide for its expansion. New sources of equity and debt financing need to be tapped. Such investment opportunities must attract new entrants to the sector from financial institutions that have been made aware of the potential of the solar electricity busi-ness. It is significant, for example, that investment in solar pro-duction and supply companies is being taken increasingly seri-ously by international investment analysts, while the influential Economist magazine has portrayed solar cells as part of a new “micropower” revolution.
In summary, there is no doubt that the global electricity busi-ness will undergo a significant expansion over the next few decades. All indicators point in that direction. Solar power will certainly play an ever more significant role in the supply mix. However, the extent to which solar electricity will make its im-pact on that market will depend very much on ensuring that the potential winners in this business are made fully aware of the opportunities available.
Those opportunities will only be realised if both industry and governments continue to strengthen their commitment to broadening the energy supply base and, through the deploy-ment of solar electricity technologies, offering greater choice to customers. This will have the added effect of demystifying the energy process, offering individuals greater control over the provision of their electricity needs. This in itself constitutes a revolution in the energy market.

CreditsResearcher and scenario analyst Johannes StierstorferEditor Kate Mc DonaldGreenpeace Co-ordinator and scenario analyst Sven TeskeEPIA Co-ordinator Murray Cameron, Johannes StierstorferDesign Bitter Grafik & Illustration, Hamburg
With participation of:Masaaki Nakajima – Greenpeace JapanSamantha Rodgers, John Coequyt – Greenpeace USAAthena Ronquillo Ballesteros – Greenpeace International /South East AsiaTara Buakamsri – Greenpeace South East AsiaK. Srinivas – Greenpeace IndiaMarcelo Furtado, Dr. Stefan Krauter – Greenpeace Latin AmericaCatherine Fitzpatrick, Mark Wakeham – Greenpeace Australia PacificDr. Muriel Watt – School of PV & RE Engineering, University of New South WalesAilun Yang – Greenpeace China Dr. Winfried Hoffmann – Schott Solar
Printed on recycled paper
European Photovoltalic Industry AssociationAvenue Charles Quint 124B-1083 BrusselsBelgiumT: +32-2-465 3884F: +32-2-468 2430Email: [email protected]
Greenpeace InternationalOttho Heldringstraat 51066 AZ AmsterdamThe NetherlandsT: +31 20 514 81 50F: +31 20 514 81 51Email: [email protected]