
Solar Energy IV
36
Solar Energy IV Solar Energy IV Hydroelectricity Hydroelectricity and and OTEC OTEC
-
Upload
cadence-fidel -
Category
Documents
-
view
26 -
download
0
description
Solar Energy IV. Hydroelectricity and OTEC. Hydro power has a very long history with watermills appearing as early as 100 BC. By 1200 it was used to operate hammers in ironworks. By 1500 it was the primary source of industrial power. - PowerPoint PPT Presentation
Transcript of Solar Energy IV
Solar Energy IVSolar Energy IV
HydroelectricityHydroelectricity
and and
OTEC OTEC

Hydro power has a Hydro power has a very long history very long history with watermills with watermills appearing as early appearing as early as 100 BC.as 100 BC.
By 1200 it was By 1200 it was used to operate used to operate hammers in hammers in ironworksironworks

By 1500 it was By 1500 it was the primary the primary source of source of industrial power.industrial power.
Rivers and Rivers and streams were a streams were a critical source of critical source of power and power and transportation in transportation in the settling of the settling of America.America.
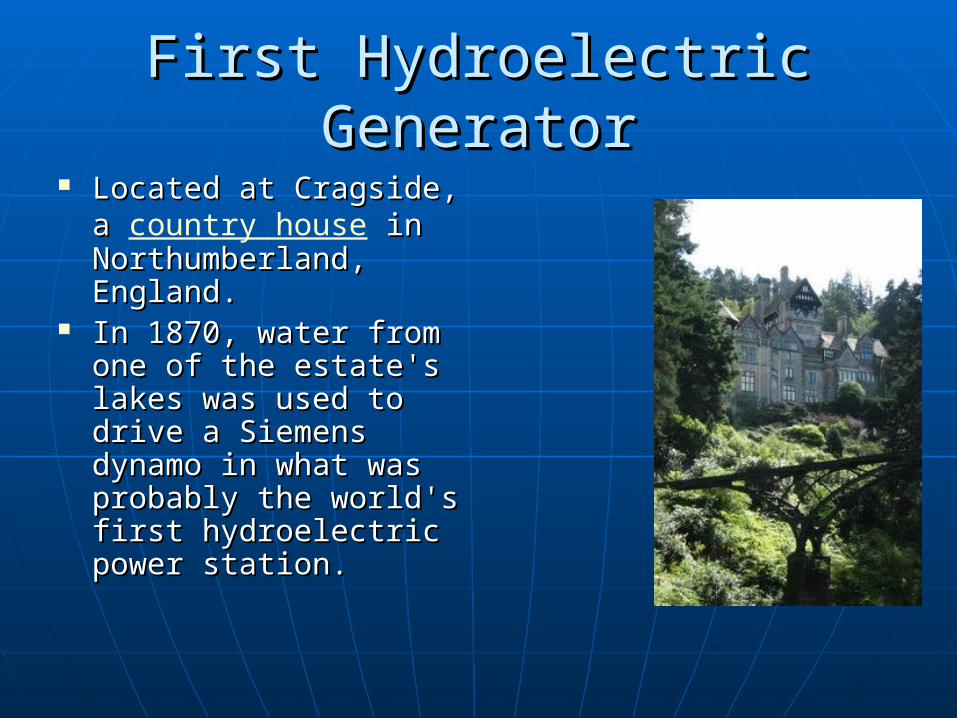
First Hydroelectric GeneratorFirst Hydroelectric Generator Located at Cragside, a Located at Cragside, a
country house in in Northumberland, Northumberland, England. England.
In 1870, water from In 1870, water from one of the estate's one of the estate's lakes was used to lakes was used to drive a Siemens drive a Siemens dynamo in what was dynamo in what was probably the world's probably the world's first hydroelectric first hydroelectric power station. power station.

Today Hydropower is used mainly Today Hydropower is used mainly for generating electricityfor generating electricity

Water cycle as a great big heat Water cycle as a great big heat engineengine


Generators inside Hoover DamGenerators inside Hoover Dam

Convert Potential Energy of Water Convert Potential Energy of Water Into Kinetic Energy to Run a Into Kinetic Energy to Run a
GeneratorGenerator
mgh=mvmgh=mv22/2/2
h is called the “head” of the damh is called the “head” of the dam
Modern hydroelectric plants convert Modern hydroelectric plants convert ~90% of PE into electricity~90% of PE into electricity

High Head DamsHigh Head Dams
h is up to 1000ft.h is up to 1000ft. A lot of energy per A lot of energy per
liter of water that liter of water that flows through.flows through.
Can get by with Can get by with smaller flows.smaller flows.

Low Head DamsLow Head Dams
As low as 10 ft.As low as 10 ft. Not much energy Not much energy
per liter of water.per liter of water. Need a higher flow Need a higher flow
rate to get as much rate to get as much electricityelectricity

Sample CalculationSample Calculation
Useful information: 1 liter of HUseful information: 1 liter of H22O has O has a mass of 1kg.a mass of 1kg.
Height of Hoover Dam = 221 mHeight of Hoover Dam = 221 m Power rating of Hoover Dam is 2,451 Power rating of Hoover Dam is 2,451
MW.MW. Find the amount of water that flows Find the amount of water that flows
through the dam per second if it is through the dam per second if it is 90% efficient.90% efficient.
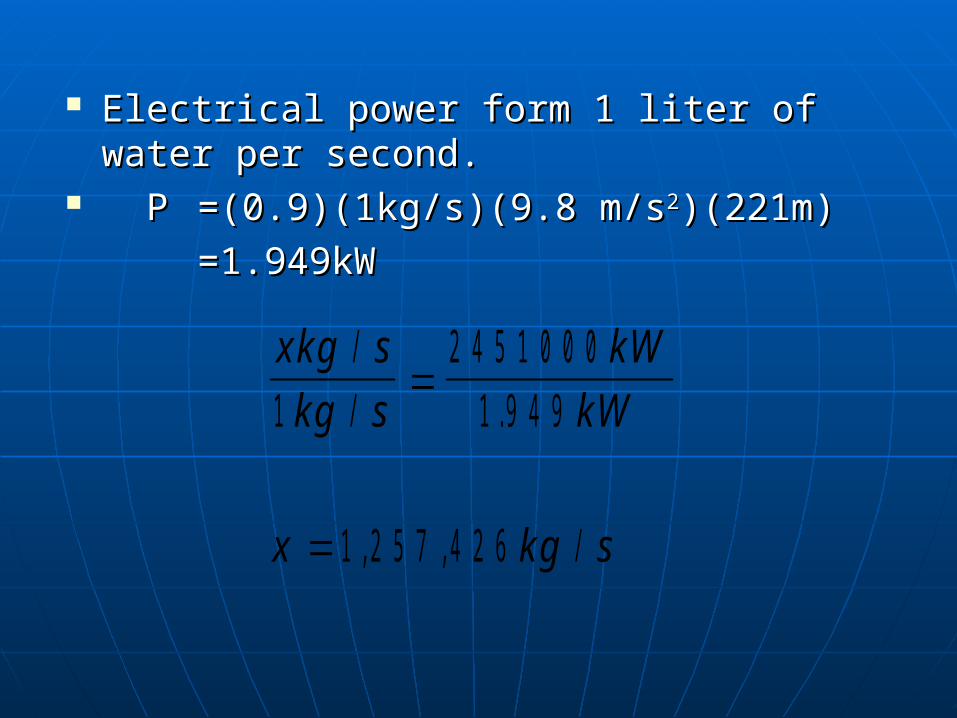
Electrical power form 1 liter of water per Electrical power form 1 liter of water per second.second.
PP =(0.9)(1kg/s)(9.8 m/s=(0.9)(1kg/s)(9.8 m/s22)(221m))(221m)
=1.949kW=1.949kW
xkg s
kg s
kW
kW
x kg s
/
/ .
, , /
1
2451000
1 949
1 257 426

US Hydroelectric Production

Existing hydroelectric plants (yellow) and potential high head/low power energy sites (orange)


Principal Dams in the USPrincipal Dams in the US


Top Ten Countries for Top Ten Countries for Hydroelectricity Hydroelectricity
Country Annual Hydroelectric Production (TWh)
Installed Capacity
Capacity Factor
Percent of all electricity
China 652.05 196.79 0.37 22.25
Canada 369.5 99.974 0.59 61.12
Brasil 363.8 69.080 0.56 85.56
United States 250.6 79.511 0.42 5.74
Russia 167.0 45.000 0.42 17.64
Norway 140.4 27.528 0.49 98.25
India 115.6 33.600 0.43 15.8
Venezuela 86.8 67.17
Japan 69.2 27.229 0.37 7.21
Sweden 65.5 16.209 0.46 44.34

Top Ten Largest Hydroelectric Top Ten Largest Hydroelectric PlantsPlants
Dam Country Completed Power (GW)
Three Gorges Dam China 2008/11 18.3/22.5
Itaipu Brazil/Paraguay 1984/91/03 14.0
Guri (Simon Bolivar) Venezuela 1986 10.2
Tucurui Brazil 1984 8.37
Grand Coulee United States 1942/80 6.81
Sayano Shushenskaya Russia 1985/89 6.4
krasnoyarskaya Russia 1972 6.0
Robert-Bourassa Canada 1981 5.62
Churchill Falls Canada 1971 5.43
Longtan Dam China 2009 4.9/6.3

Three Gorges DamThree Gorges Dam(World’s Largest)(World’s Largest)

Ten largest Dams Under Ten largest Dams Under ConstructionConstruction
Project Country Capacity (GW) Completion
Xiluodu Dam China 12.6 2015
Siang Upper HE Project
India 11.0 2024
TaSang Dam Burma 7.1 2022
Xiangjiaba Dam China 6.4 2015
Nuozhadu Dam China 5.9 2017
Jinping 2 HP Station
China 4.8 2014
Laxiwa Dam China 4.2 2010
Xiaowan Dam China 4.2 2012
Jinping 2 HP Station
China 3.6 2014
Pubugou Dam China 3.3 2010
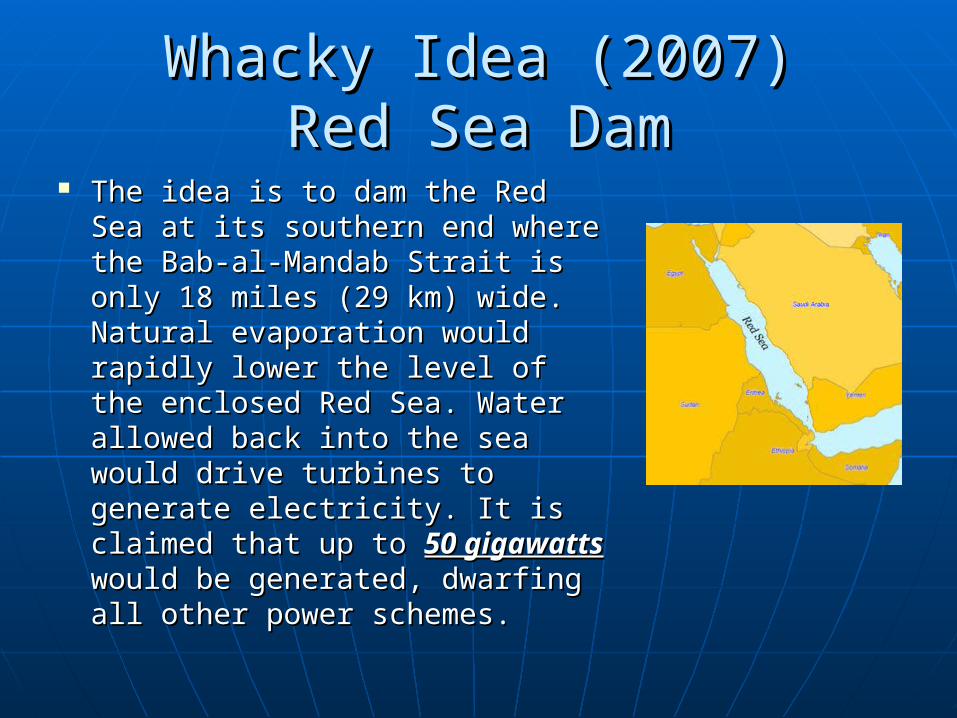
Whacky Idea (2007)Whacky Idea (2007)Red Sea DamRed Sea Dam
The idea is to dam the Red Sea The idea is to dam the Red Sea at its southern end where the at its southern end where the Bab-al-Mandab Strait is only Bab-al-Mandab Strait is only 18 miles (29 km) wide. Natural 18 miles (29 km) wide. Natural evaporation would rapidly evaporation would rapidly lower the level of the enclosed lower the level of the enclosed Red Sea. Water allowed back Red Sea. Water allowed back into the sea would drive into the sea would drive turbines to generate electricity. turbines to generate electricity. It is claimed that up to It is claimed that up to 50 50 gigawatts gigawatts would be would be generated, dwarfing all other generated, dwarfing all other power schemes.power schemes.

Advantages to hydroelectric powerAdvantages to hydroelectric power::
Fuel is not burned so there is minimal pollution.
Water to run the power plant is provided free by nature.
Hydropower plays a major role in reducing greenhouse
gas emissions.
Relatively low operations and maintenance costs.
The technology is reliable and proven over time
It's renewable - rainfall renews the water in the reservoir,
so the fuel is almost always there.

Reservoirs can be used for other Reservoirs can be used for other purposes such as irrigation, purposes such as irrigation, recreation, flood controlrecreation, flood control

DisadvantagesDisadvantages
Lifetime of 50 to 200 years because Lifetime of 50 to 200 years because of silting.of silting.
Large environmental changes Large environmental changes downstream.downstream.
Loss of free flowing water.Loss of free flowing water. Loss of land flooded by reservoir.Loss of land flooded by reservoir. Often upstream from large Often upstream from large
population centers (Huge population centers (Huge catastrophe if dam fails.)catastrophe if dam fails.)

High investment costsHigh investment costs Hydrology dependent (precipitation)Hydrology dependent (precipitation) Inundation of land and wildlife habitatInundation of land and wildlife habitat Loss or modification of fish habitatLoss or modification of fish habitat Fish entrainment or passage restrictionFish entrainment or passage restriction Changes in reservoir and stream water Changes in reservoir and stream water
qualityquality Displacement of local populationsDisplacement of local populations

Dam FailuresDam Failures
From 1918-58 there were 33 dam From 1918-58 there were 33 dam failures in the US resulting in 1680 failures in the US resulting in 1680 deaths.deaths.
Between 1959 and 65 there were 9 Between 1959 and 65 there were 9 large failures worldwide.large failures worldwide.
It is unusual, but a significant hazard.It is unusual, but a significant hazard. Terrorists?Terrorists?

Water pouring out of the reservoir of the Teton Dam in Idaho following its catastrophic failure on June 5, 1976.
Teton Dam Failure

Ocean Thermo Electric ConversionOcean Thermo Electric Conversion
Use temperature difference between Use temperature difference between the surface and deep water to drive the surface and deep water to drive a heat engine.a heat engine.
Typically very low efficiency, but no Typically very low efficiency, but no cost for fuel.cost for fuel.
Typically Typically TT 20K and T 20K and Thh20K, thus20K, thus
eecc==T/TT/Thh 20/300=6.7%20/300=6.7%
Real efficiency more like 2-3%Real efficiency more like 2-3%


Requires a huge flow of water.Requires a huge flow of water. A 100 MW plant would require A 100 MW plant would require
approximately 25,000,000 liters per approximately 25,000,000 liters per second of both warm and cold water.second of both warm and cold water.
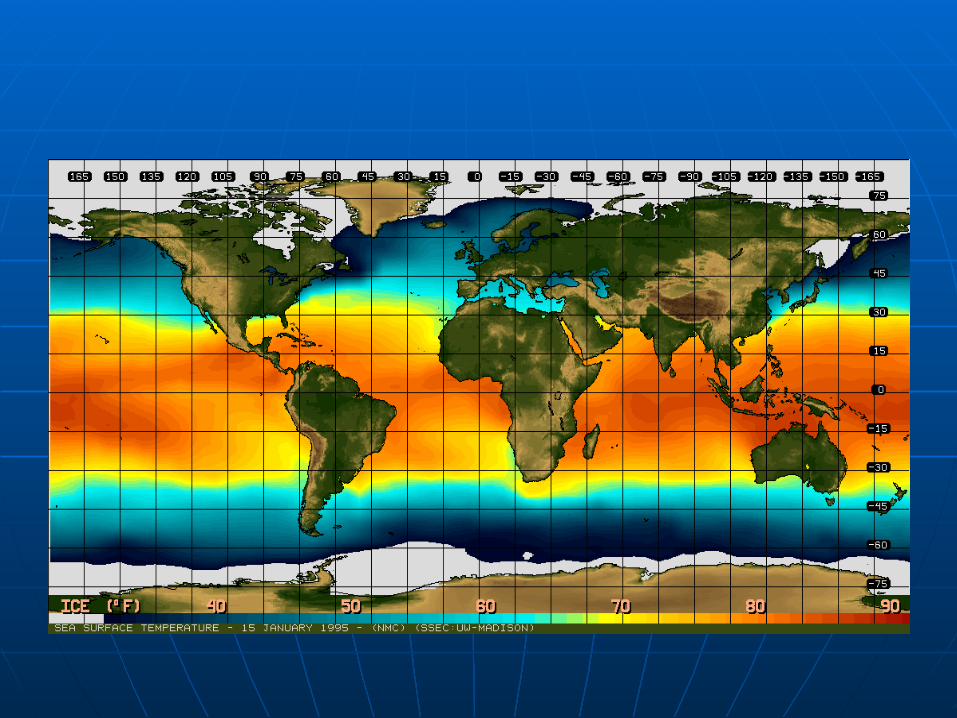
Use in locations with warm surface Use in locations with warm surface waters. waters. T>17T>17CC
Predictable power output since Predictable power output since T is T is very stable over the course of a day.very stable over the course of a day.

Not a whole lot currently being Not a whole lot currently being developed.developed.
1930’s : concept plant built near 1930’s : concept plant built near Cuba generated 22kW of power, but Cuba generated 22kW of power, but used more than it generated.used more than it generated.
1970’s : small test plant built in 1970’s : small test plant built in Hawaii.Hawaii.
No government support since the No government support since the 1980’s.1980’s.

Other IdeasOther Ideas
Large underwater turbines anchored Large underwater turbines anchored to the sea floor.to the sea floor.
Ex: Gulf stream has a steady flow Ex: Gulf stream has a steady flow that is 1000 time larger than the that is 1000 time larger than the Mississippi River with a maximum Mississippi River with a maximum velocity of 4mph.velocity of 4mph.