Solar activity correlation with NAO and ENSO - ISSI · Solar activity correlation with NAO and ENSO...
29
Solar activity correlation with NAO and ENSO Simeon Asenovski, Boian Kirov, Yana Asenovska
Transcript of Solar activity correlation with NAO and ENSO - ISSI · Solar activity correlation with NAO and ENSO...

Solar activity correlation with NAO and ENSO
Simeon Asenovski, Boian Kirov, Yana Asenovska
NAO
ENSO
ENSO
AO/NAM
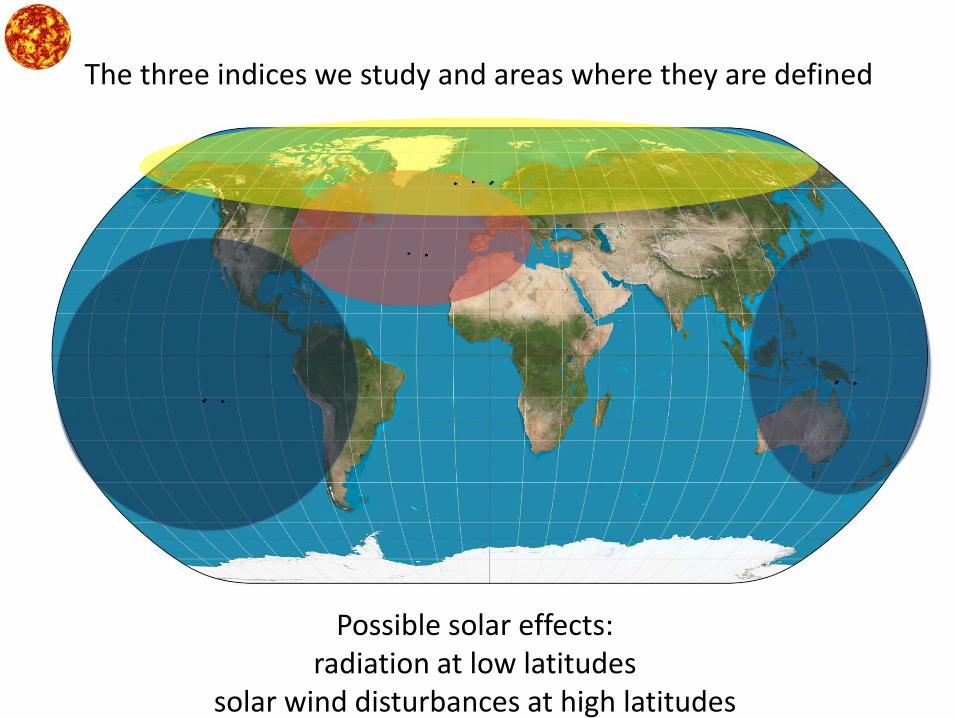
The three indices we study and areas where they are defined
Possible solar effects: radiation at low latitudes
solar wind disturbances at high latitudes

Atmospheric circulation: the system of the large-scale atmospheric motions over the Earth
If the Earth didn’t rotate:
• heated air at the equator rises• proceeds south and north
toward the poles• descends there• returns to the equator.
=> 2-cell circulation (one in each hemisphere)
due to the differential heating of the Earth’s surface
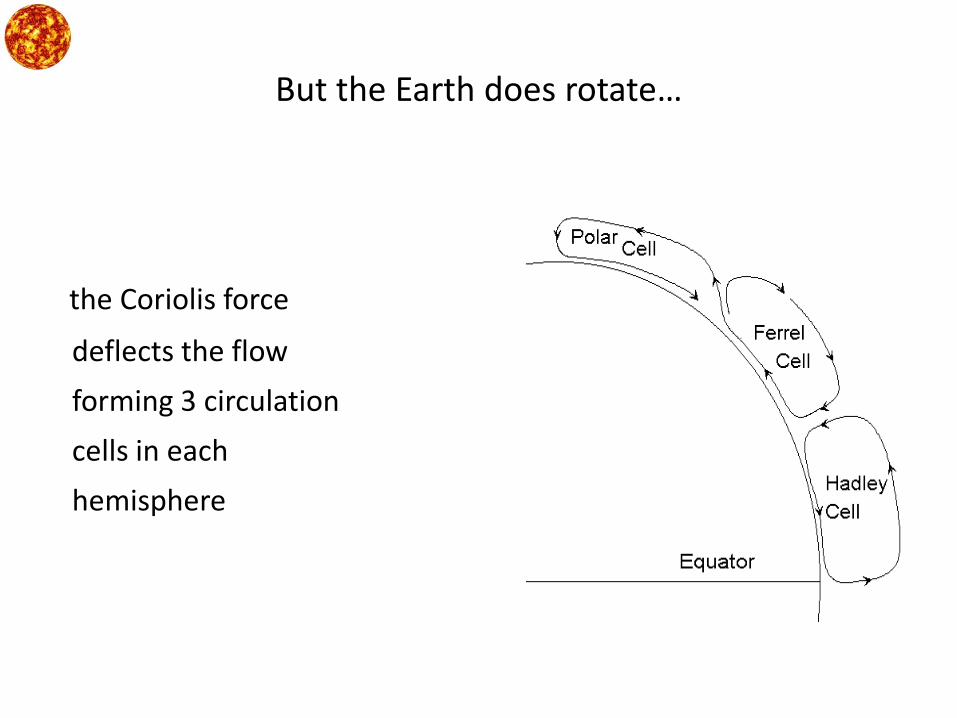
But the Earth does rotate…
the Coriolis force
deflects the flow
forming 3 circulation
cells in each
hemisphere


Normal situation in Pacific Ocean
• Trade winds blow westwardand push warm surface watertowards Australia and NewGuinea.
• Sea level in New Guinea isabout 0.5 m higher than inPeru.
• Cold water wells up off SouthAmerica's western coast.
• Upwelling of nutrient-richcold water fosters marineproductivity.
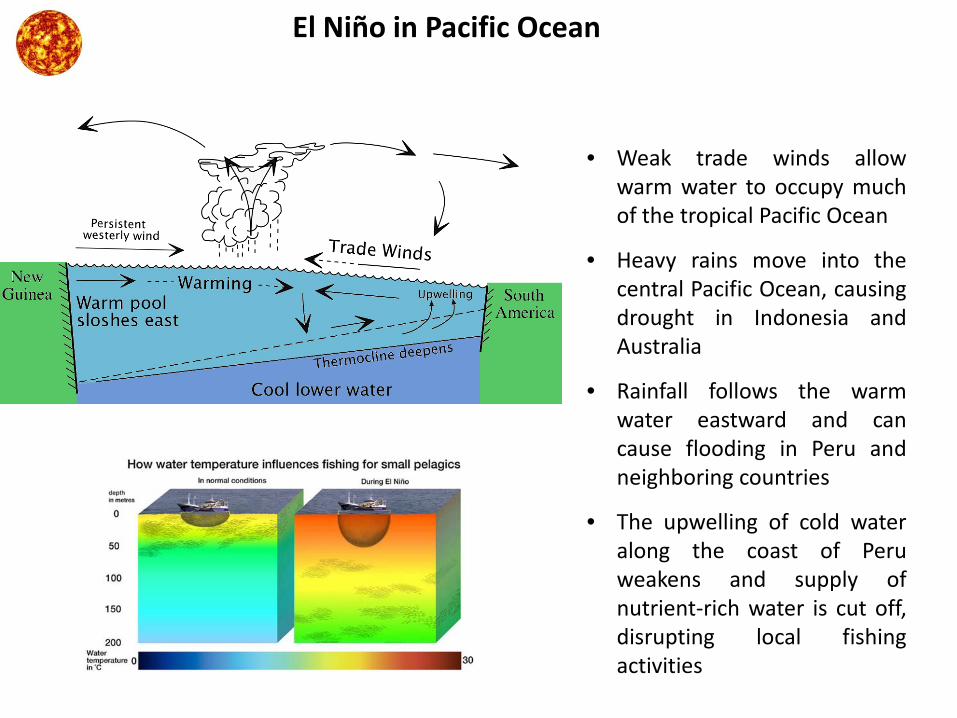
El Niño in Pacific Ocean
• Weak trade winds allowwarm water to occupy muchof the tropical Pacific Ocean
• Heavy rains move into thecentral Pacific Ocean, causingdrought in Indonesia andAustralia
• Rainfall follows the warmwater eastward and cancause flooding in Peru andneighboring countries
• The upwelling of cold wateralong the coast of Peruweakens and supply ofnutrient-rich water is cut off,disrupting local fishingactivities

La Niña in Pacific Ocean
• The trade winds intensify and stack the warm surface water in the west even more than in normal years
• The waters near Australia are often 1,5 m higher than the ocean surface in the east during La Niña episodes
• The area of intense rainfall is dragged back toward Australia
• Upwelling of nutrient-rich cold water fosters marine productivity.
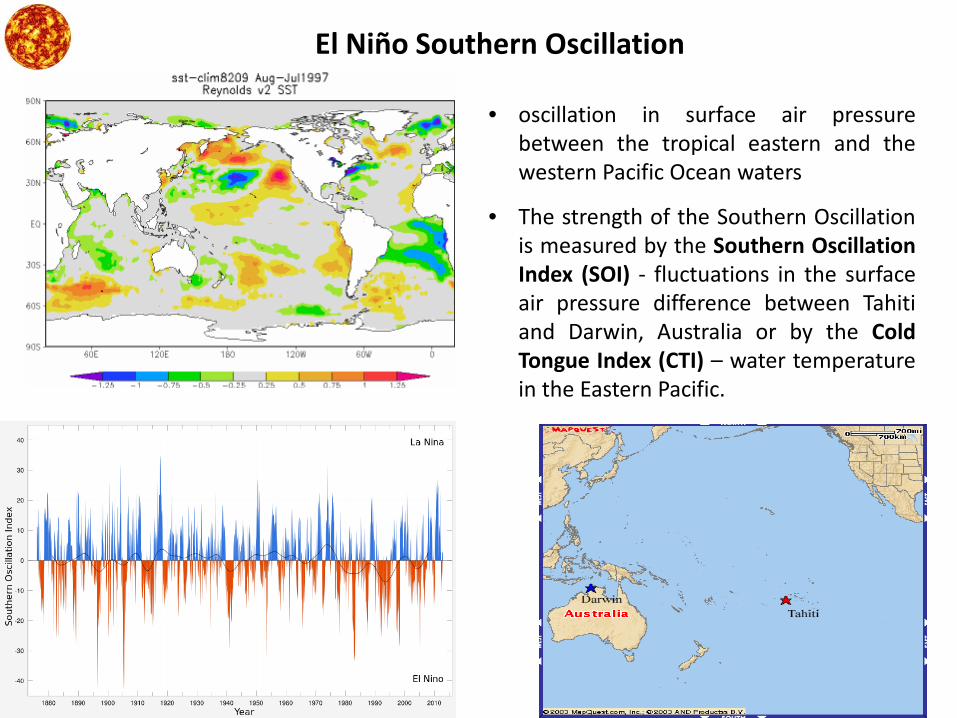
El Niño Southern Oscillation
• oscillation in surface air pressurebetween the tropical eastern and thewestern Pacific Ocean waters
• The strength of the Southern Oscillationis measured by the Southern OscillationIndex (SOI) - fluctuations in the surfaceair pressure difference between Tahitiand Darwin, Australia or by the ColdTongue Index (CTI) – water temperaturein the Eastern Pacific.

El Niño effect during December through February El Niño effect during June through August
La Niña effect during December through February La Niña effect during June through August
The Effects of El Niño and La Niña

Long-term relations of ENSO and Solar activity
The dependence of ENSO on solar activity with a correlation coefficient of -0.76.
Higher solar activity - weaker and less frequent El Nino
Comparison between El Niño and solar activity: Quinn’s El Niño index (Quinn et al., 1987) – thin solid line and Cold Tongue Index (CTI) – thick solid line; the grouped sunspot numbers Rg – thin broken line and international sunspot numbers – thick broken line, in units of standard deviations, 30-year averages, detrended.
El N
iño
inde
x

ENSO and solar activity in the 11-year sunspot cycle
Superposed method analysis of El Nino intensity relative to sunspot maximum in the 11-year solar cycle (dotted vertical line).
• A clearly expressed minimum is observed one year before solar maximum.
• The statistical significance is evaluated with Student’s t-criterion, and it better than 99% with t = 3,62 for 74 degrees of freedom.
• The same behavior is seen when we compare not the intensity but the cases of occurrence of El Nino.
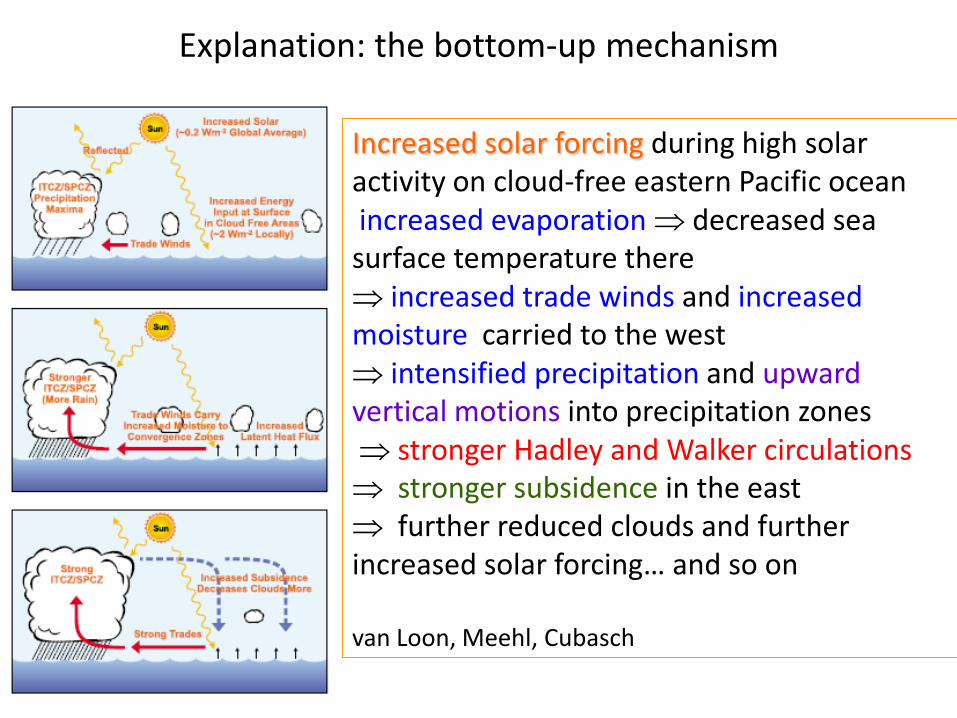
Explanation: the bottom-up mechanism
Increased solar forcing during high solar activity on cloud-free eastern Pacific oceanincreased evaporation ⇒ decreased sea surface temperature there⇒ increased trade winds and increased moisture carried to the west⇒ intensified precipitation and upward vertical motions into precipitation zones⇒ stronger Hadley and Walker circulations⇒ stronger subsidence in the east⇒ further reduced clouds and furtherincreased solar forcing… and so on
van Loon, Meehl, Cubasch
Comments
• ENSO long-term variation is closely related to the secularsolar activity variations
• Both the intensity and occurrence frequency of El Nino arelow at secular solar maximum and high at secular solarminimum
• In the 11-year solar cycle, El Nino has a statisticallysignificant minimum one year before solar activitymaximum
• Whatever factors drive El Nino, the conditions in solar maxare more unfavorable for its occurrence
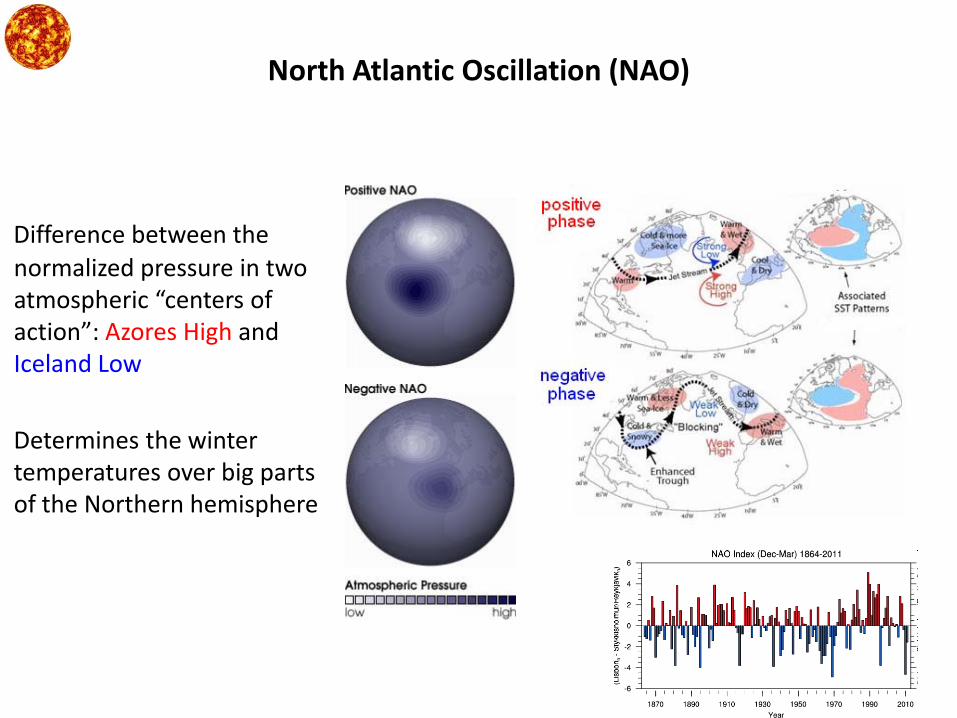
North Atlantic Oscillation (NAO)
Difference between the normalized pressure in two atmospheric “centers of action”: Azores High and Iceland Low
Determines the winter temperatures over big parts of the Northern hemisphere
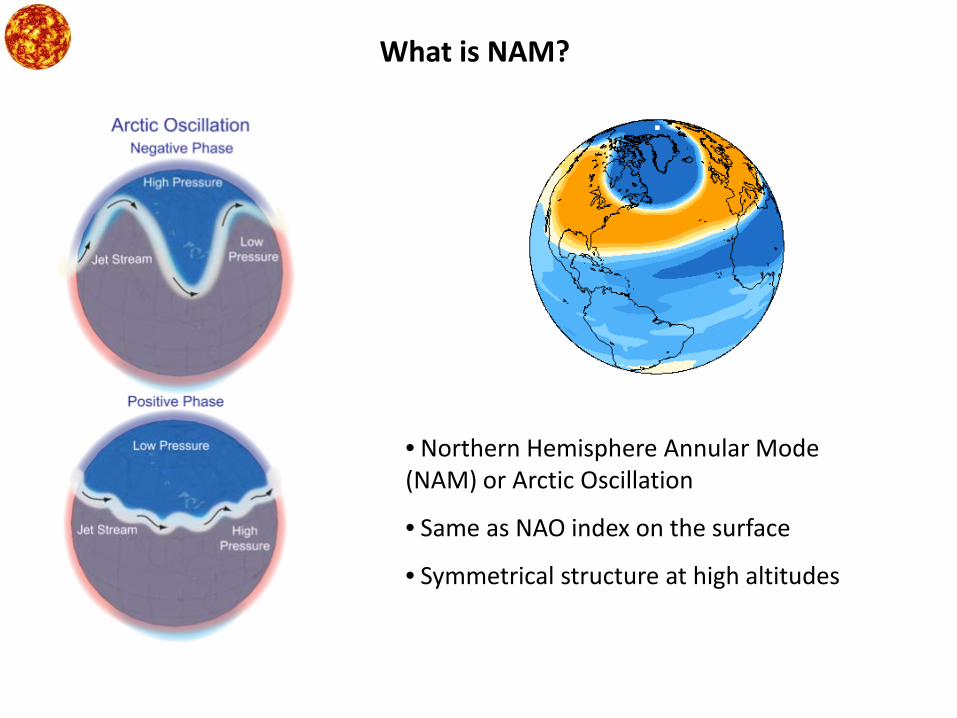
• Northern Hemisphere Annular Mode (NAM) or Arctic Oscillation
• Same as NAO index on the surface
• Symmetrical structure at high altitudes
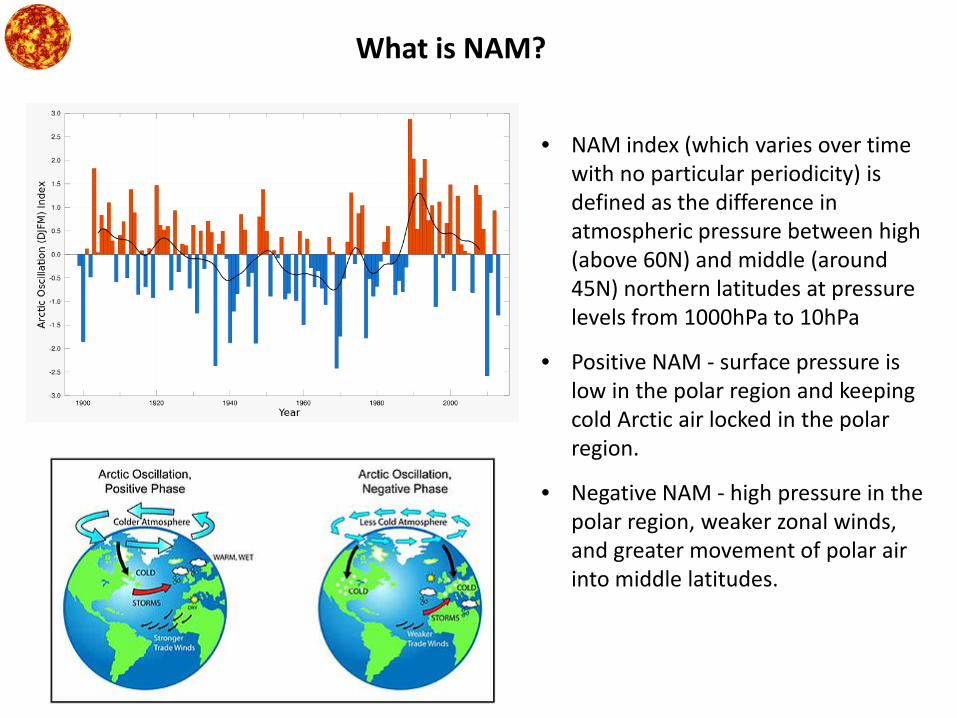
What is NAM?
What is NAM?
• NAM index (which varies over time with no particular periodicity) is defined as the difference in atmospheric pressure between high (above 60N) and middle (around 45N) northern latitudes at pressure levels from 1000hPa to 10hPa
• Positive NAM - surface pressure is low in the polar region and keeping cold Arctic air locked in the polar region.
• Negative NAM - high pressure in the polar region, weaker zonal winds, and greater movement of polar air into middle latitudes.
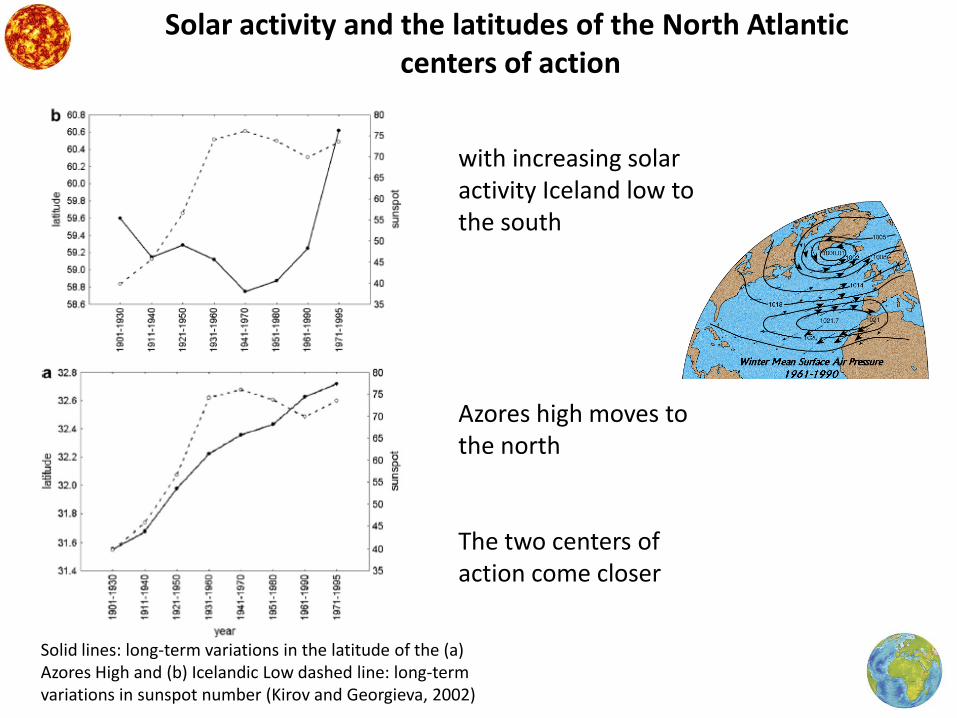
Solar activity and the latitudes of the North Atlantic centers of action
Solid lines: long-term variations in the latitude of the (a) Azores High and (b) Icelandic Low dashed line: long-term variations in sunspot number (Kirov and Georgieva, 2002)
with increasing solar activity Iceland low to the south
Azores high moves to the north
The two centers of action come closer

Solar activity and the longitudes of the North Atlantic centers of action
With increasing solar activity Iceland low moves to the East
Much smaller effect on the Azores high
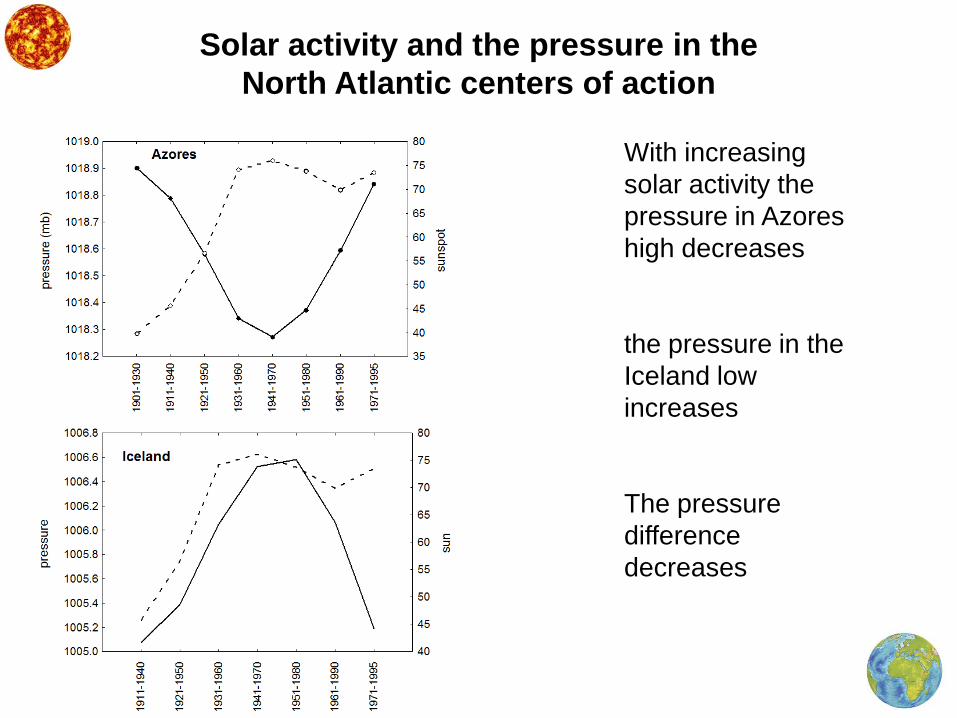
Solar activity and the pressure in the North Atlantic centers of action
With increasing solar activity the pressure in Azores high decreases
the pressure in the Iceland low increases
The pressure difference decreases
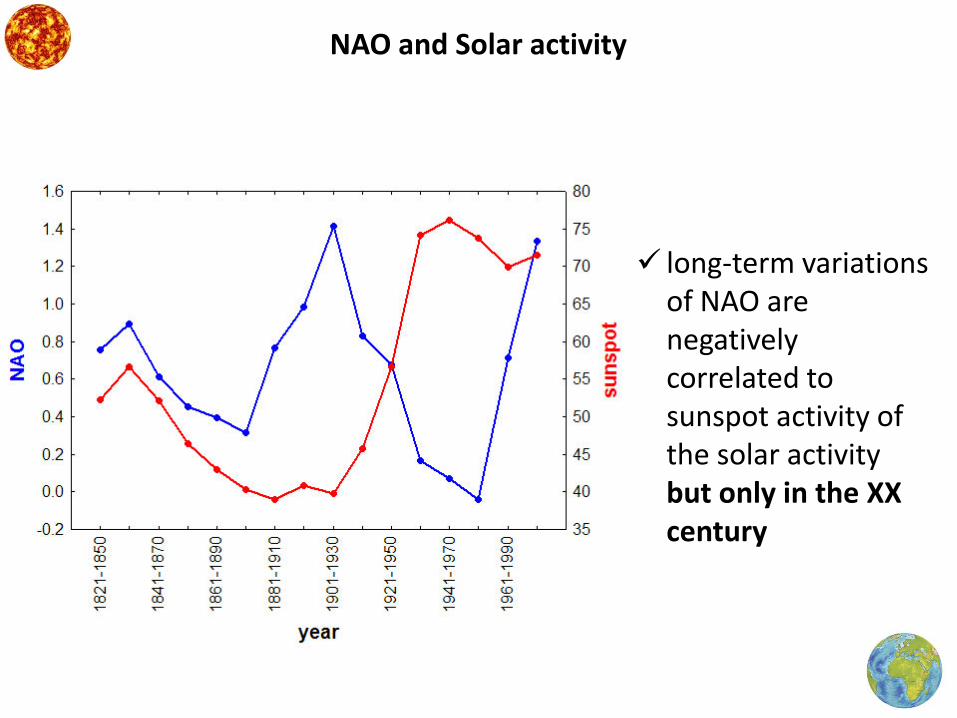
NAO and Solar activity
long-term variations of NAO are negatively correlated to sunspot activity of the solar activity but only in the XX century

NAO and Solar activity
Percentage of meteorological stations (grey bars) measuring positive (along the positive y-axis) or negative (along the negative y-axis) correlations in the 11 year sunspot cycle between solar activity and surface air temperature; secular sunspot cycle (solid line); north–south solar activity asymmetry, A = (SN - SS)/(SN+SS) (white bars)
positive and negative correlations between the longer-term variations of NAO (back to 1611) and solar activity
positive and negative correlations between the solar activity and surface air temperature

• At all altitudes, the winter NAM-index is on the average higher for high aa-index, low F10.7, and lower for low aa-index, high F10.7
• The differences are higher with increasing pressure levels—closer to the surface.
Geomagnetic activity, solar radiation and NAM index
NAM index at levels from 1000 to 10 hPa for: high aa-index, low F10.7 (full circles, solid line) and high F10.7, low aa-index (open circles, dashed line), together with their error bars

Histograms of theNAM-index values for high aa-index, low F10.7 (solidline) and highF10.7,low aa-index (dashedline) at (a)1000hPa, (b)500hPa, (c)250hPa, (d)100hPa, (e)50hPaand (f)10hPa.
Geomagnetic activity, solar radiation and NAM index

Geomagnetic activity, solar radiation and NAM index
Composites of time-height development of the NAM for the 11winters of high aa-index and low F10.7 (a), and the 9 winters of high F10.7 and low aa-index (b).The horizontal line denotes the approximate altitude of the tropopause.
• NAM-index is on the average positive for high geomagnetic activity, low irradiance
• Negative for low geomagnetic activity, high irradiance

comments
• The correlation between solar activity and NAO changes in consecutive 100-year solar cycles
• Solar irradiance and geomagnetic activity have opposite effects on NAO
• The changing correlation between solar activity and NAO may be due to changing relative influence of different solar drivers.
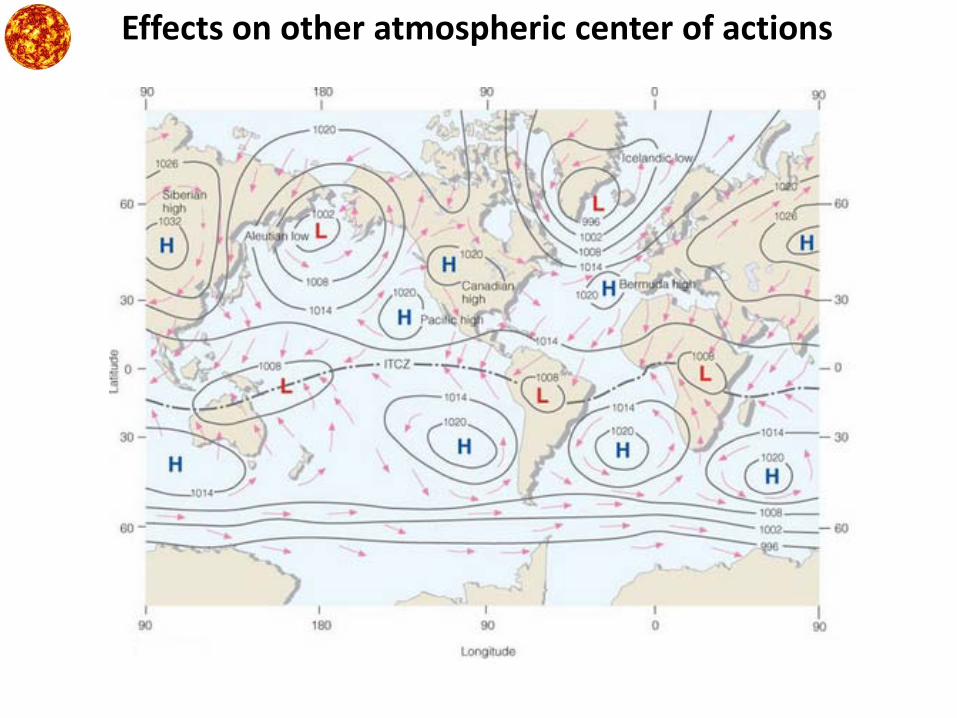
Effects on other atmospheric center of actions

Solar activity and Southern Hemisphere center of action
Solar activity in four consecutive 11-year cycles maxima (broken line) and average pressure anomalies (solid line) from December to February – Pdjf – in the Indian Ocean High, top panel, and from September to November – Pson – in the Southern Pacific High, bottom panel.
• The pressure in the Indian Ocean High (west of the Date line, 77.5E, 31.2S) is inversely related to solar activity, with r = -0.80 for the ‘‘winter’’ months (December to January) – top panel.
• The pressure is in phase with solar activity to the east of the Date line, in the Southern Pacific High (117W, 31.4S) – bottom panel
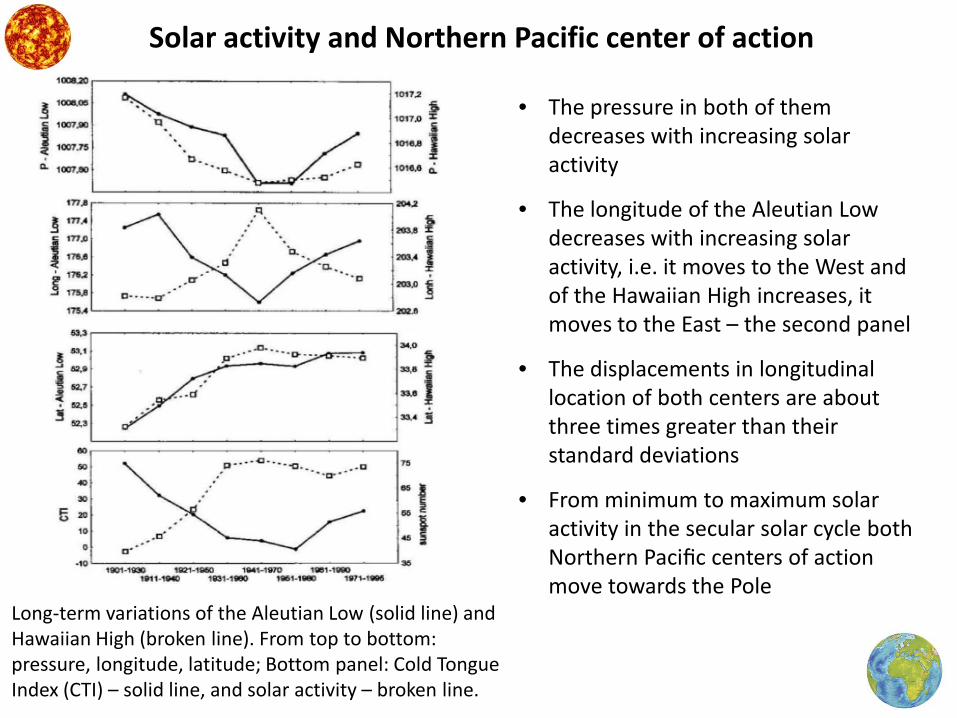
Solar activity and Northern Pacific center of action
Long-term variations of the Aleutian Low (solid line) and Hawaiian High (broken line). From top to bottom: pressure, longitude, latitude; Bottom panel: Cold Tongue Index (CTI) – solid line, and solar activity – broken line.
• The pressure in both of them decreases with increasing solar activity
• The longitude of the Aleutian Low decreases with increasing solar activity, i.e. it moves to the West and of the Hawaiian High increases, it moves to the East – the second panel
• The displacements in longitudinal location of both centers are about three times greater than their standard deviations
• From minimum to maximum solar activity in the secular solar cycle both Northern Pacific centers of action move towards the Pole