Soils of the Gulf Islands - British Columbia
136
Transcript of Soils of the Gulf Islands - British Columbia


Soils of the Gulf Islands of British Columbia Volume 5 Soils of Sidney, James, Moresby, Portland, and lesser islands
Report No. 43 British Columbia Soi1 Survey
L.J.P. van Vliet, E.A. Kenney, and A.J. Green B.C. Land Resource Unit Land Resource Research Centre Vancouver, B.C.
Land Resource Research Centre Contribution No. 87-3 1
(Accompanying map sheet from Soils ofthe Gulflslands ofBritish Columbia series: Sidney, James, Moresby, Portland, and lesser islands)
Research Branch Agriculture Canada 1991

Copies of this publication are available from Maps B.C. Ministry of Environment Parliament Buildings Victoria, B.C. vsv IX5
Produced by Kesearch Program Service
0 .Minister of Supply and Services Canada 1991 Cat. No. A5T-426/5E ISBS O-662-18510-2
Coverphoto James Island, looking north (courtesy of A.J. Green)
Staff editor Jane T. Buckley

CONTENTS
Page
ACKNOWLEDGMENTS . . . . . . . . . . . . . . . . . . . . . . . . . . . . . . . . . . . . . . . . . . . . . . . . . . . . . . . . vi
PREFACE . . . . . . . . . . . . . . . . . . . . . . . . . . . . . . . . . . . . . . . . . . . . . . . . . . . . . . . . . . . . . . . . vii
PART 1. INTRODUCTION . . . . . . . . . . . . . . . . . . . . . . . . . . . . . . . . . . . . . . . . . . . . . . . . . . 1
PART 2. GENERAL DESCRIPTION OF THE AREA . . ..*..........................
Location and extent ................................................. 2 History and development ............................................. 4 Climate ............................................................. 6 Natural vegetation .................................................. 8 Geology ............................................................. 12 Physiography ........................................................ 13 Soi1 parent materials ............................................... 13
PART 3. SURVEY AND MAPPING PROCEDURES . . . . . . . . . . . . . . . . . . . . . . . . . ...*.... 17
How the soils were mapped ........................................... 17 Data handling ....................................................... 18 Reliability of mapping .............................................. 19 Soi1 series ......................................................... 19 Map units ........................................................... 20
PART 4. DESCRIPTION OF SOILS AND MAP UNITS . . . . . . . . . . . . . . . . . . . . . . . . . . . . 23
Description of soils ................................................... Description of map units ............................................... Baynes soils and map units ............................................. Beddis soils and map units ............................................. Bellhouse soils and map units .......................................... Brigantine soils and map units ......................................... Denman Island soils and map units ...................................... Galiano soils and map units ............................................ Haslam soi1 complex and map units ...................................... Mexicana soils and map units ........................................... Musgrave soils and map units ........................................... Parksville soils and map units ......................................... Qualicum soils and map units ........................................... Rock as nonsoil and map units .......................................... Rumsley soils and map units ............................................ Salalakim soils and map units .......................................... Saturna soils and map units ............................................ St. Mary soils and map units ........................................... Tolmie soils and map units ............................................. Trincomali soils and map units ......................................... Summary of areal extent of map units in survey area ....................
23 24 25 27 30
3’5 39 41 44 47 50 54 57 60 63 65 68 71 74 78
iii

Page
PART 5. LAND USE INTERPRETATIONS ...................................... 79 Land constraints for septic tank effluent absorption ................... 79 Land capability for agriculture ........................................ 85
PART 6. DERIVED AND INTERPRETIVE MAPS . . . . . . . . . . . . . . . . . . . . . . . . . . . . . . . . . 92
REFERENCES . . . . . . . . . . . . . . . . . . . . . . . . . . . . . . . . . . . . . . . . . . . . . . . . . . . . . . . . . . . . . 93-96
APPENDIXES
Appendix 1. Profile descriptions and analytical data of the soils . . . . . . . . . . . . . . . . . . . . . . . . . . . . . . . . . . . . . . . . . . . . . . . . . 98
Appendix 2. Soi1 moisture data for the soi1 profiles.................. 120
iv

LIST OF TABLES AND ILLUSTRATIONS
TABLES Page
1. 2. 3.
4.
5.
6. 7.
8.
Size of the surveyed islands, islets, and rocks................. Summary of climatic data for the southern Gulf Islands.......... Mean temperatures, precipitation, rainfall, and snowfall for James and Piers islands . . . . . . . . . . . . . . . . . . . . . . . . . . . . . . . . . . . . . Dates for last spring frost and first fa11 frost, frost-free period, and annual degree days for James Island and at selected stations surrounding the survey area................... Number of delineations and areal extent of each map unit and land type for the survey àrea . . . . . . . . . . . . . . . . . . . . . . . . . . . . . . . . . . . Distribution of map units in survey area by parent materials.... Constraint classes and soi.1 and landscape limitations for septic tank effluent absorption . . . . . . . . . . . . . . . . . . . . . . . . . . . . . . . . . Land capability ratings for agriculture.........................
2 7
9
10
22 78
81-84 87-90
FIGURES
1. Locations of Sidney, James, Moresby, Portland, and lesser islands in relation to the Gulf Islands and the Province of British Columbia . . . . . . . . . . . . . . . . . . . . . . . . . . . . . . . . . . . . . . . . . . . . . . . . 3
2. Mean monthly precipitation for James Island..................... 11 3. Mean monthly precipitation for Piers Island..................... 11 4. Generalized cross section of soi1 parent materials and
typical soils in relation to landscape position................. 14
PLATES Facing page
1 (a) pasture for sheep and deer grazing, (b) field planted with trees, (c) Beddis soil, (d) Beddis landscape, (e) grave1 pit, (f) St. Mary landscape and soi1 profile . . . . . . . . . . . . . . . . . . . . . . . . . . . . 4
II (a) Parksville soil, (b) Parksville landscape, (c) Musgrave soil, (d) Musgrave landscape, (e) Rumsley soil, (f) Rumsley landscape.... 16
ACKNOWLEDGMENTS
Assistance and support were provided by the following agencies and individuals: D.M. Moon, Head, B.C. Soi1 Survey Unit, Agriculture Canada, Vancouver, who directed the soi1 survey; G. Clark, who assisted in the field mapping; L. Chan who conducted the laboratory analyses; J. Melzer who typed the manuscript; Cartography Section, Land Resource Research Centre, Agriculture Canada, Ottawa, who provided base maps, drafted figures, and prepared the final soi1 maps; R. Muir and B. Porteous, Surveys and Resource Mapping Branch, B.C. Ministry of Environment, Victoria, who digitized the soi1 lines and prepared a plot with soi1 lines and symbols; and C. Tarnocai, Land Resource Research Centre, Agriculture Canada, Ottawa, who kindly reviewed the manuscript and the map legend. We are also grateful to the many land owners and caretakers who allowed us access to the islands.
vi

PREFACE
Sidney, James, Moresby, Portland, and lesser islands caver a total area of 2628 ha in the Gulf Islands of British Columbia shown on map sheet 92B/ll of the National Topographie Series. The aim of this report is to provide detailed soils information at a scale of 1:20 000 for local planning purposes, and to emphasize the soi1 limitations that are important to residential development and agriculture.
The accompanying soi1 map shows the distribution and extent of the soi1 map units. The map legend identifies each map unit by color and symbol. It gives the proportion of dominant, subdominant, or minor soi1 components, the origin and texture of the parent materials, the soi1 depth, the soi1 drainage, and the landscape characteristics for each map unit. The report and map are complementary; therefore, it is necessary to use both to fully understand the soils. An interim soi1 map with extended legend has also been produced at a scale of 1:20 000 and has been made available from the Map Library, Maps B.C., Ministry of Environment, Victoria, B.C.
Note: This publication is the last in a series of five volumes on Soils of the Gulf Islands of British Columbia, Report No. 43 of the British Columbia Soi1 Survey. The other publications are entitled:
Volume 1 Soils of Saltspring Island; Volume 2 Soils of North Pender, South Pender, Prevost, Mayne, Saturna, and lesser islands; Volume 3 Soils of Galiano, Valdes, Thetis, Kuper, and lesser islands; Volume 4 Soils of Gabriola Island and lesser islands.
The correct citation for this report is as follows:
Van Vliet, L.J.P.; Kenney, E.A.; Green, A.J. 1991. Soils of the Gulf Islands of British Columbia: Volume 5 Soils of Sidney, James, Moresby, Portland, and lesser islands. Report No. 43, British Columbia Soi1 Survey. Research Branch, Agriculture Canada, Ottawa, Ont. 123 pp.
vii

PART 1. INTRODUCTION
The first soi1 survey that included the Gulf Islands was completed in the late 1950s (Day et al. 1959). This survey at a scale of ~63 360 (2.5 cm to 1 km) served a useful purpose for land planners and agriculturists over the years. During the Canada Land Inventory mapping program in the 1960s more soils information was obtained for the Gulf Islands to produce soi1 capability maps for agriculture and other uses (1:50 000). Since then, some of the Gulf Islands have been surveyed in more detail by different agencies in response to requests from the Islands Trust of the British Columbia Ministry of Municipal Affairs and Regional Districts. The soi1 maps have been used by planners to draft officia1 community plans for the islands. However, no published soi1 survey reports accompanied these maps.
With increasing population pressures on the Gulf Islands (Barr 19'781, the Islands Trust identified the need for more detailed resource information for land use planning. In 1978, the Islands Trust requested the Terrestrial Studies Section of the Surveys and Resource Mapping Branch, British Columbia Ministry of Environment, to undertake a comprehensive and detailed mapping program covering the Gulf Islands, from Newcastle Island opposite the city of Nanaimo to D'Arcy Island off Victoria, which are'under the jurisdiction of the Islands Trust. It was decided to produce a biophysical data base by means of resource folios for each of the southern Gulf Islands at a scale of 1:20 000. The soi1 inventory part of these folios became the responsibility of British Columbia Soi1 Survey Unit, Agriculture Canada, Vancouver, under a program called the Gulf Islands soi1 survey. In addition to the islands under the jurisdiction of the Islands Trust, this soi1 survey program included a11 other southern Gulf Islands from Nanaimo to Victoria.
The objectives of the Gulf Islands soi1 survey are as follows: - to produce an updated soi1 inventory for a11 the southern Gulf Islands at a
scale of 1:20 000, using the latest techniques for soi1 survey, data handling, and map production;
- to produce soi1 maps and legends for the Islands Trust through the British Columbia Ministry of Environment;
- to produce interpretive soi1 ratings for the Islands Trust and other users; and
- to publish the soi1 maps and soi1 survey reports for each island or group of islands.
Fieldwork for the Gulf Islands soi1 survey commenced during the summer of 1979. It concluded during the summer of 1986 with the field mapping of Sidney, James, Moresby, Portland, and lesser islands east of the Saanich Peninsula on Vancouver Island. Interim soi1 maps and extended legends for the Gulf Islands were prepared by the British Columbia Soi1 Survey Unit in Vancouver, published by the Surveys and Resource Mapping Branch, British Columbia Ministry of Environment, and made available through Maps B.C.

PART 2. GENERAL DESCRIPTION OF THE AREA
Location and extent
This report, No. 5 for the Gulf Islands of British Columbia, covers a group of islands lying between longitudes 123O15' and 123026' W and between latitudes 48O33' and 48O44' N. These islands lie in the Haro Strait between the southeastern toast of Vancouver Island (Saanich Peninsula) and the San Juan Islands of the United States (Fig. 1). The main islands discussed in this report are Sidney, James, Moresby, and Portland islands. Also included are a number of small islands and islets such as D'Arcy, Little D'Arcy, Gooch, Forrest, Domville, Brethour, Coal, Piers, Goudge, Fernie, Knapp, and Little Group islands. The survey area covers a total of 37 named islands and islets and 2 named rocks, which are a11 listed in Table 1. The size of the named islands, islets, and rocks are also included in Table 1. They caver a total area of 2578 ha. The total mapped area, including unnamed islets, rocks, and reefs is 2628 ha.
Several named, but very small rocky islands and islets (Greig Island, Musclow Islet, and Patrol Island), named rocks (Canoe, Graham, Joan, John, and Munroe), and named reefs (Arachne, Peck, South Cod, and Turnbull) were not mapped because of their small size (CO.4 ha). Therefore, they do not appear on the soi1 map and are not included in Table 1.
Table 1. Size of the surveyed islands, islets, and rocks
Name of island Area Name of island Area or islet (ha) or islet (ha)
Arbutus Island Brackman Island Brethour Island Chads Island Clive Island Coal Island Cornet Island D'Arcy Island Dock Island Domville Island Fernie Island Forrest Island and
lesser islands Gooch Island Goudge Island Halibut Island Hood Island Imrie Island James Island Johnson Islet Ker Island Knapp Island
0.4 4.8
18.4 3.7 0.4
141.3 3.9
79.5 1.0
29.6 4.8
23.0
44.2 14.4
3.1 2.0
33zl 0.5 3.6
13.2
Kolb Islet 2.1 Little D'Arcy Island 9.2 Little Group Islands 1.1
(excluding Little Shell, Ker, and Dock islands)
Little Shell Island 0.5 Mandarte Island 9.3 Moresby Island 595.5 Pellow Islets 1.2 Piers Island 99.6 Portland Island 219.6 Pym Island 2.8 Reay Island 1.1 Rubly Island 2.4 Rum Island 5.0 Ship Island 3.5 Sidney Island 894.7 Tortoise Islets 3.7
Sallas Rocks 1.9 Unit Rocks 0.4
2

49Q
4p30
1;
00’ 123’30’ 123”m
cHEMAINUS >y s
VANCOUVER
ISLAND
0 Report Area
Kilometres
/\ SALTSPRIN(
i/-, 1 ISLAI.,
I I I
Figure 1. Locations of Sidney, James, Moresby, Portland andlesser islands in re- lation to the Gulf Islands andprovince of British Columbia (inset map).
3

History and development
European explorers noted the area towards the end of the 18th Century. A few of the island place names originate from the Spanish explorations of 1790-1792. Most of the waters and island place names were assigned by the British surveyor, Captain Richards, during 1858-1859. He named places after his ship and crew, after the naval ships and crew in service on the toast at that time, and also after the ships and crew of earlier Spanish explorers. James Island is an exception. It was named by early settlers in 1853 after Sir James Douglas, the first governor of British Columbia (Anon. 1930). A history of Gulf Island place names is given by Akrigg and Akrigg (1973).
Population
The southern Gulf Islands were used seasonally as a fishing, hunting, and a shellfish gathering base by the Coast Salish Indians (Duff 19,611, who claimed to be the first inhabitants of the area. They regarded the islands as summer camps and stopover sites during long trips up the Fraser River. Borden (1968) suggested that during the period 1000-100 B.C. the Indians had their main centres on the Gulf Islands and visited the Fraser Valley seasonally.
Early white settlement came slowly and spread from Victoria to Saltspring Island and to the lesser islands. In 1860 the Hudson's Bay Company put up 2000 lots on Sidney Island for sale by auction, without much success, as only one or two lots sold (Gibbs 1973). The first recorded purchase for land on Moresby Island was in 1863 (Freeman 1961). Deeds for James Island date from the early 1870s (Bond 1979). The group of islands covered by this report never had the same settlement and population pressures that the other Gulf Islands experienced, probably because these smaller islands were predominantly privately owned. The most densely populated island is Piers Island, which has been subdivided around the shoreline into many small lots.
Ownership and land use
The nonaboriginal settlers and the subsequent early population were principally homesteaders and farmers (Plate Ia) who, besides supplying local needs, sold their products to the Vancouver Island and mainland markets (Boyes 1960; B.C. Min. Agric. 1978; Bond 1979). The apple orchard on James Island was reputed to be one of the best in British Columbia in 1913 (Bond 1979). Racehorses were once raised and trained on James Island; dogs were also raised there (Anon. 1930). The agriculture land reserve has a total of 980 ha of land on Sidney (494 ha), James (269 ha), Moresby (122 ha), Coal (83 ha), and Brethour (12 ha) islands, which is 38% of the map area.
During the 1890s James Island was owned by a group of wealthy Victorians (including the then-premier of British Columbia) who established a private hunting reserve on the island (Dickason 1949; Bond 1979). In 1897 the syndicate imported a herd of fallow deer from Britain (Hinkens 1982). "These deer were purchased from Chatsworth Park, one of the estates of the Duke of Devonshire" (Bond 1979). These deer became established and many descendants still live on the island. The group also imported other game animals including mountain sheep, pheasants, partridge, grouse, and quai1 (Bond 1979).
4

PLATE 1

PLATE 1
(a)
(b)
(cl
(dl
Ce)
(f)
Permanent pasture for sheep and deer on Sidney Island, on poorly drained Parksville and Tolmie soils; stonepiles (foreground) attest to times when farmers picked and piled up stones that hindered operations. Field on Sidney Island, traditionally used for agriculture, now planted with sitka spruce; cages protect trees from browsing deer. Deep coarse-textured marine, fluvial, or eolian materials are the parent materials of the rapidly to moderately well drained Beddis soi1 (low grave1 content). Soi1 landscape of Beddis soil, on the Upper part of the steeply sloping cliffs, east side of Sidney Island. Grave1 pit on James Island; deep gravelly sandy deposits form parent materials of rapidly to well-drained Qualicum soils; similar but shallower deposits over compact till form parent materials of Trincomali soils. Soi1 landscape and profile of St. Mary soi1 on Sidney Island; 60 cm of moderately coarse textured marine or fluvial deposits overlie medium-textured marine deposits over compact glacial till at 95 cm.

Canadian Industries Limited (CIL) purchased James Island in 1913 and established a powder (explosives) plant there as well as a village for the workers and their families (MacRae 1970). During World War 1, one-twelfth of a11 the TNT produced in the British Empire was manufactured on James Island
' (Anon. 1930), including the TNT that was onboard the French ship, Mont Blanc, which was involved in the Halifax explosion of 1917 (MacRae 1970). The village, which had an average population of 350 people (Anon. 1930), was closed down in 1961, and the workers in the plant commuted from Vancouver Island via a company-run ferry (MacRae 1970). The explosives plant was closed in 1978 (Bond 1979).
Sidney Island was sold in 1902 to Mr. Courtney (Gibbs 1973) who established the Sidney Island Brick and Tile Company in 1906 (Anon. 1981). Bricks manufactured from the clay deposits on the island were used in the construction of the Empress Hotel in Victoria, the original Hotel Vancouver, and the old CPR depot in Vancouver. The crown foreclosed on the company in 1925 (Anon. 1981).
In 1915, two-thirds of Sidney Island were sold to a syndicate of wealthy Victorians who used it as a private hunting reserve (Hinkens 1982). Gradually the syndicate broke up and control was gained by one individual (Mr. Todd) who raised sheep on the island. He also introduced pheasants, peacocks, wild turkeys, and blacktail deer. Fallow deer also became established, after swimming across from James Island, and it has been estimated that up to 900 of these deer now inhabit the island.
In 1981, Mr. Todd sold his holding on Sidney Island to the Sallas Forest Limited Partnership, an organization formed by 33 people in 1981. The Sallas Forest company established a tree farm and intends to practice modern forest management to maintain a substained-yield tree farm (Plate Ib). These practices include selective logging, thinning, and managing the deer herds to decrease the damage done to the trees by wildlife (Green 1982; Hinkens 1982). The company ++hopes to make the island a show piece of good forest management++ (Pearse 1982).
Second-growth timber provides a basis for a small logging industry run by local operators on the islands. The commercial tree species are toast Douglas fir, western hemlock, western red cedar, and grand fir (Islands Trust 1982). On Sidney Island the virgin timber was eut more than 60 years ago (Green 1982) and on James Island clearcutting occurred during the construction of the powder plant (Bond 1979). More logging occurred during the 1930s and 1940s and the second-growth timber was not well tended (Green 1982; Hinkens 1982).
Most of the land in the islands covered by this report is privately owned. There are four provincial marine parks in the report area: Princess Margaret on Portland Island (194 ha), Sidney Spit at the northern end of Sidney Island (400 ha), D'Arcy Island (84 ha), and Isle-de-Lis on Rum Island (5 ha) (B.C. Min. Lands, Parks, and Housing 1983). It is interesting to note how Princess Margaret Provincial Marine Park got its name. In 1958 the Province of British Columbia gave her Royal Highness, Princess Margaret, Portland Island as a commemorative gift for her visit to the province during the province's centennial year. She returned the island to the province a few years later, at which time the island was designated a marine park and named in her honor.
5

The only Indian reserve in the survey area is the Bare Island Indian Reserve 9 on Mandarte Island (8.3 ha), east of Sidney Island.
Transportation and energy
During the summer months a foot-passenger ferry operates between Sidney on Vancouver Island and Sidney Island SO that people may use the provincial Park. Al1 other islands are accessed by private boats. When CIL was operating the explosives plant on James Island, the company provided ferry transportation for its workers to Vancouver Island. The company also operated a narrow-gauge railway to connect the various buildings of their operations (Anon. 1930; Ingham 1952). Grave1 roads or vehicle tracks exist on Sidney, James, Portland, Moresby, Piers, and Coal islands.
Electricity for James Island was brought in from Vancouver Island by CIL via an underwater table, which was laid in 1915 and is still in place (Bond 1979). Coal Island is the only other island known to have electricity from Vancouver Island.
Water supplies and drainage
Freshwater supplies on these islands are limited. Water supply is primarily from Wells as there are only a few short intermittent streams and very few lakes. The limited groundwater storage is found in the faults and fractures in the bedrock and at contact zones between shale and sandstone bedrock. Al1 recharge to the potable groundwater cornes from precipitation,which falls during the late fa11 and winter months (Foweraker 1974).
No information about water quality and quantity is available for the islands in the survey area, p robably because of the low population pressure. Water conservation is being encouraged by the Islands Trust (1984).
Most of the surface drainage is controlled by the sandstone ridges or by glacially formed relief. Excess rainwater in the winter finds its way to the sea through sluggish channels, often as groundwater flow. Seasonal streams,which flow vigorously during the winter months, dry up completely during the summer.
Climate
The climate of the southern Gulf Islands has been well described by Kerr (1951), Chilton (1975), and Coligado (1979). The climate is strongly influenced by the rain-shadow effects of the Olympic Mountains to the south in Washington State and the Ynsular Mountains" of Vancouver Island to the west (Holland, 1976) and is moderated by the ocean. Kerr (1951) referred to the climate of the Gulf Islands as a "Transitiona Cool Mediterranean Climate." The climate is characterized by warm and generally dry summers and humid, mild Winters. January mean temperature is 3.4OC (2.9-3.8O) with a mean minimum temperature of just below freezing (Table 2). Most of the mean annual precipitation (80-85%) occurs during the months of October to April. Mean temperature in July is 16.8OC (16.3-1'7.3OC) with a mean maximum of 23.0°C
6

Table 2. Summary of climatic data for the southern Gulf Islands
Temperature
January mean temperature January mean minimum temperature Extreme low winter temperature July mean temperature July mean maximum temperature Extreme high summer temperature
Precipitation
Average annual rainfall* Average annual snowfall* July and August (driest months) November-January (wettest months) October-April
Miscellaneous
Freeze-free period
Hours with bright sunshine May-September Annual
Fog occurrence (average)
Windiest period Least windy period
3.4oc -0.5oc
-16Oc (Vesuvius, November 1970) 16.8OC 230~ 38OC (Ganges, July 1966)
807 mm (715-990 mm> 35 cm (21-75 cm) .<5$ of annual precipitation almost 50% of annual precipitation 80-85s of annual precipitation
>200 days (longest growing season in Canada)
1300-1400 >1900 30 days of the year
(mainly September-February) November-January May-September
Source: after Coligado (1979). * after Atmospheric Environment Service (1982a).

(22.0-24.OOC). Less than 5% of the mean annual precipitation falls during July and August. Also, during May-September the southern Gulf Islands are considered to be one of the sunniest places in Canada with 1300-1400 hrs of bright sunshine. These summer climatic conditions result both in deficits in soi1 moisture for trop production, particularly on coarse-textured soils, and in a high fire-hazard for forests.
Some of the more important climatic data pertaining to the southern Gulf Islands are summarized in Table 2. Specific long-term climatic data for James Island and shorter-term data ((10 years) for Piers Island are presented in Tables 3 and 4 and in Figs. 2 and 3 (Atmospheric Environment Service 1982 a,b,c).
Natural vegetation
The Gulf Islands occur in the drier maritime subzone of the coastal Douglas-fir (CDF) biogeoclimatic zone (Krajina 1969) and the Georgia Strait section of the Coast Forest region of Rowe's (1977) classification. The CDF zone ranges in elevation from sea level to 450 m in the southern portion, including southern Gulf Islands, and to 150 m in the northern portion (Klinka et al. 1979). The characteristic tree species of the CDF zone, and therefore of James, Sidney, Portland, Moresby, and lesser islands, is toast Douglas fir (Pseudotsuga menziesii var. menziesii). Spelling of a11 botanical names is according to Taylor and MacBryde (1977). Within the drier subzone, on drier, open sites where the soils are shallow over bedrock, Garry oak (Quercus
garryana) and Pacifie madrone (Arbutus menziesii) occur. The Garry oak generally forms pure stands and is of limited occurrence, Pacifie madrone occurs more frequently than Garry oak, commonly in association with toast Douglas fir. Other coniferous tree species that occur are grand fir (Abies grandis), western red cedar (Thu'a plicata), shore pine (Pinus COntOrta),
Sitka spruce (Picea sitchensis , -Y- and western hemlock (Tsuga heterophylla). The deciduous trees occurring in the report area are red aider (Alnus rubra), -- bigleaf maple (Acer macrophyllum), northern black cottonwood (Populus balsamifera ssp. trichocarpa), western flowering dogwood (Cornus nuttallii), and bitter cherry (Prunus emarginata).
The shrub layer is dominated by sala1 (Gaultheria shallon) and, to a lesser extent, by du11 Oregon-grape (Mahonia nervosa), red huckleberry (Vaccinium parvifolium), and evergreen huckleberry (Vaccinium ovatum). Salmonberry (Rubus spectabilis) is common in moist areas. Herbs and mosses have a low presence, although a variety of ferns commonly occurs along with northern twinflower (Linnaea borealis) and American vanilla leaf (Achlys triphylla). Many species of spring flowers occur, especially in pockets of shallow soils on bedrock outcrops. The Gulf Island flora is likely one of the most varied in British Columbia (Krajina 1969; Lyons 1976; Klinka et al. 1979).
Species such as fireweed (Epilobium angustifolium), common gorse (Ulex europaeus), Scotch broom (Cytisus scoparius), American stinging nettle (Urtica dioica ssp. gracilis), western fescue (Festuca occidentalis), and orchard grass (Dactylis glomerata) occur on disturbed sites (Hirvonen et al. 1974).
8

Table 3. Mean temperatures, precipitation, rainfall, and snowfall for James and Piers islands
Climatic parameter James Island
Piers Island
Temperature
January mean minimum ("Cl 1.9 July mean maximum (OC> 21.7 Annual mean temperature (OC> 10.0 Lowest minimum recorded (OC) -13.9 Highest maximum recorded (OC) 35.0
Precipitation
Annual (mm) May-September (mm) Extreme 24 hr (mm) Number of days with precipitation
Rainfall
Annual (mm> May-September (mm) Extreme 24 hour (mm) Number of days with rain
748 824 122 155 102 57 147 153
715 802 122 155
77 57 142 152
Snowfall
Annual (cm) 21 Extreme 24 hour (cm) 14 Number of days with snow 6 5
Source: after Atmospheric Environment Service (1982a).

Table 4. Dates for last spring and first fa11 frosts, frost-free period, and annual degree- days for James Island and at selected stations surrounding the survey area
Climate station
Last spring frost First fa11 frost Average Annual frost-free degree-
Average Earliest Latest Average Earliest Latest period days (dws > (above SOC)
James Island Saltspring
Island (Vesuvius)
South Pender Island
Apr 23 No frost Apr 23 oct 19 oct 19 No frost 266 1969 Mar 28 Feb 17 May 12 Nov 8 Sept 23 Dec 4 224 2038
Apr 7 Mar 15 May 3 Nov 7 Oct 27 Nov 26 213 1951
0 Saanichton Apr 12 Mar 1 May 30 Nov 17 Oct 26 Dec 13 218 1887 CDA
Source: after Atmospheric Environment Service (1982b,c). Table 4

100
Ê 90
g 60
5 - 70 s :c ki
60
à 50
40
30
20
10
0 JFMAMJJASOND
Month
Figure 2. Mean monthly precipitation for James Island (after Atmospheric Environment Service 1982).
JFMAMJJASOND Month
Figure 3. Mean monthlyprecipitation for Piers Island (after Atmospheric Environment Service 1982).
11

Geology The islands in the report area are entirely underlain by the sedimentary
formations of Upper Cretaceous age belonging to the Nanaimo Group. The Nanaimo Group is a conformable sequence of marine and nonmarine sediments for which five major depositional periods have been recognized (Muller 1977). These cycles show "a gradation from deltaic sandstones and/or conglomerates through marine rhythmic beds of siltstone, sandstone, and shale either into pure shale and mudstone or interbedded units richer in shale and mudstoneV1 (Winsby 1973). These sequences are considered to be a series of transgressive cycles. Each cycle shows a progression from fluvial to deltaic and or lagoonal to nearshore marine and offshore marine (Muller and Jeletsky 1970).
The seaward Nanaimo formations suffered folding, faulting, and thrusting toward the northeast during Late Tertiary mountain building when the Cascades and Olympic Mountains were formed in Washington State. In the report area, the northeast folding is more gentle and regular with axes more widely spaced. Faulting is less common.
The Nanaimo Group is the main bedrock group to occur in the survey area and consists of the following sedimentary bedrock types: sandstone, shale, siltstone, conglomerate, and, very rarely, coal. The older, underlying formations representing the Triassic-Jurassic metamorphics and volcanics and the Jura-Cretaceous batholithic rocks outcrop on south Saltspring Island. In the report area, they outcrop on Portland, Moresby, Sidney, D'Arcy, Little D'Arcy, and Little Group (Little Shell, Ker, and Dock) islands (Muller 1977).
The Tyee intrusion of Triassic-Jurassic metamorphosed igneous rocks has formations primarily of altered granitoids and sericite schists consisting of the following major rock types: metagranodiorites, metaquartzdiorite, and metaquartz porphyry. The other bedrock type.is Paleozoic metamorphosed sedimentary rock belonging to the graywacke-argillite formation of the Sicker Group. The principal rock types are metagraywacke, argillite-schist, and marble (Muller 1977).
Differential erosion of the bedrock by wave action has produced some interesting features. Concretions up to 1 m across are richer in carbonate than the surrounding rock and more resistant. Carbonate-filled networks of cracks also weather out in relief to produce a llhoneycombl' weathering surface. Wave-tut llgalleriest' formed by undercutting of the sandstone at the high tidemark also occur. A "strongly ribbed" appearance is produced by differential erosion from wave action on thin bands of interbedded sandstone and shale (Muller and Jeletzky 1970).
The sedimentary bedrock strata dip gently towards the northeast. They dip steeply only in narrow fault zones (Muller and Jeletzky 1970). The bedrock on Coal, Gooch, and Domville islands is thick-bedded sandstones with steep dips and as a result there is little difference in the opposite slopes of these islands (Clapp 1913).
James Island is composed entirely of Quaternary sediments (Clapp 1913; Muller 1970). It is the only island of the southern Gulf Islands without any bedrock outcrops. A large portion of Sidney Island, i.e., the narrow-shaped part, is also composed of Quarternary sediments. These sediments are often referred to as Quadra Sand, pointing to an interglacial deposit (Armstrong and Clague 1977). 12

Physiography
James, Sidney, Portland, Moresby, and the lesser islands are situated in the Nanaimo Lowland subdivision of the Georgia Depression physiographic unit of British Columbia (Holland 1976). Differential erosion of the Nanaimo Group bedrock has resulted in the dominant landform pattern of the Nanaimo Lowland, which is characterized by ridges or hills with steep descents on one side and gentle slopes on the other side. These ridges are separated by narrow valleys. The ridges are capped by the more resistant sandstones and conglomerates whereas the valleys have been eroded out of the least resistant shales and mudstones, often along fault lines. The steep descents on the ridges face easterly or westerly depending on the dip of the rock formation. The relief was further modified by glacial erosion and the deposition of a fairly thick mantle of glacial and glaciofluvial materials (Williams and Pillsbury 1958; Holland 1976).
The highest point in the survey area is in the upland area on Moresby Island (148 m). The other islands have much lower elevations. The high point on Sidney Island is 77 m. Both Coal and Portland islands have high points of 59 m. The highest elevation for James Island is 58 m and 57 m for Piers Island (NTS map sheet 92 B/U).
There are sea cliffs along the eastern, western, and southern shores of James Island (caver photo). The southern cliffs are the highest and the wave action on these cliffs is particularly powerful, which results in a near-vertical shoreline. These sea cliffs are eroding at an average annual rate of about 30 cm. The eroded materials are transported northward by currents and deposited forming sandspits (caver photo). Active erosion by wind of the sea cliffs results in a buildup of sand at the soi1 surface on the southerly part of James Island. On the eastern shore of the Saanich Peninsula there is a similar sandspit and as these two spits grow in size they may eventually form a tombolo, joining James Island to the Saanich Peninsula. At present, these two spits represent an uncompleted tombolo. Long spits also extend northward from Sidney Island (Clapp 1913). Sidney and James islands have more sand on their beaches and islands than a11 the other southern Gulf Islands (Anon. 1930).
Soi1 parent materials
The soils of these southeasterly Gulf Islands are developed on many kinds of unconsolidated materials. Most of the soi1 parent materials found today were once transported and deposited by glaciers, rivers, lakes, and the sea since the last glaciation, On sloping topography, the soils have developed on colluvial and glacial till deposits. Fig. 4 shows a generalized cross section of soi1 parent materials and typical soils in relation to landscape position.
On James and Sidney islands there are extensive deposits of Quadra Sand. These sediments are well sorted sands with minor silts and gravels that were deposited by streams and rivers as outwash aprons, in front and along the margins of glaciers advancing down the Georgia Depression during the early phases of the Fraser Glaciation during the Late Wisconsinan. The Quadra Sand is overlain unconformably by Vashon tills and related glacial sediments. The Quadra Sand deposits are exposed in the cliffs of James and Sidney islands
13

.++++++++ +++++++++
;. ++++++++++
:i:+++++++++++
Y. G ,++++++++++++
d + .: + + + + + + + + + + + +
L+++++++++++++++ ++++++++c*+++++++
++++++++++++++++++ N/+++++++I
+++++++g+++++++ +++++++(C+++++c+ +++++++w*++++++ +++++++m
+++++++ +c+++++“+++++++
++++++++y*++++++ ++++++++a+++++++ ++++++++g+++++++ ++++++++>+++++++
+++++++z+++++++ +++++++w+++++++ +++++++I+++++++ +++++++++++++++ +++++t+++++++++ +++++++++++++++ +++++++++++++++ +++++++++++++++
+++++++++ +++++++++ +++++++++ +++++++++

(Armstrong and Clague 1977; Clague 1977). These materials form the parent materials of the Baynes, Beddis (Plate Ic), and Denman Island soils.
Al1 the Gulf Islands were glaciated several times during the Pleistocene. The last major ice sheet, which occurred during the Vashon stage of the Fraser Glaciation, reached the Gulf Islands some time later than 25 000 years ago and attained a climax about 15 000 years ago (Mathews et al. 1970). The weight of ice depressed the land relative to the sea (Clague 1975). During and after the retreat of the Vashon ice, which was completed about 12 000 years ago (Mathews et al. 1970), the sea entered depressional areas and covered a large part of the present lowlands of the Gulf Islands, including James, Sidney, Moresby, Portland, and the lessser islands (Halstead 1968). Since the retreat of the glaciers, the islands have rebounded isostatically relative to the sea, SO that now the highest marine deposits on the Gulf Islands are found at about 100 m elevation above mean sea level. The deep, fine to moderately fine-textured marine materials were deposited in depressional areas and basins, well protected from wave action. These deposits form the parent materials of the Tolmie soils. Similar deep, fine-textured materials occurring at elevations of >lOO m above mean sea level are said to be of lacustrine origin (B. Thomson, persona1 communication 1980). When encountered, these lacustrine materials were SO similar to the fine-textured marine materials that they were not mapped separately but wereincluded with the soils developed on fine to moderately fine textured marine parent materials. Deep, coarse to moderately coarse textured marine materials that were deposited in the sea or modified by the sea became the parent materials of the Baynes, Beddis (Plate Ic), and Denman Island soils (low grave1 content), and Qualicum soils (high grave1 content; Plate Ie). They occur as shoreline deposits, bars, and terraces. In many places they form shallow deposits over compact, glacial till (Trincomali soils) or over fine to moderately fine textured'marine materials (Brigantine and Parksville soils; Plate IIa) or over moderately fine textured marine materials overlaying glacial till (St. Mary soils; Plate If).
The thick mantle of till that was deposited during the last glaciation was subsequently eroded. In many upland areas, these till deposits have been eroded down to the underlying bedrock, except for small pockets on protected side slopes. Deeper till deposits occur in the lowland areas, but are commonly covered by shallow, coarse-, and fine-textured marine deposits (Trincomali and St. Mary soils). The only till material recognized on these islands is a coarse to moderately coarse textured, stony (gravelly), compact till, which is the parent material of the Mexicana soil, usually occurring on mid- to lower-valley slopes.
During glacial retreat, meltwater streams deposited coarse-textured materials as terraces or deltas. These glaciofluvial deposits form the parent materials of the Baynes, Beddis (Plate Ic), and Denman Island soils (low in grave1 content) and the Qualicum soils (high in grave1 content; Plate Ie). During climatic drying after the last glacial retreat, coarse-textured nongravelly deposits were subjected to strong winds. Windblown or eolian deposits form the parent materials of the Baynes, Beddis (Plate Ic), and Denman Island soils.
The soils that have developed on shallow colluvial and glacial drift materials over bedrock are Saturna and Bellhouse (over sandstone bedrock),
15

Galiano (over shale bedrock), Haslam soi1 complex (over sandstone, siltstone, and shale bedrock intermixed), Musgrave (Plate IIe) and Rumsley (Plate IIe) (over metamorphic bedrock), and Salalakim (over conglomerate bedrock).
Organic soils, occurring in tiny, closed depressions too small to be mapped, are indicated by an on-site symbol.
Old Indian middens, containing abundant fragments of clam shells in the dark-colored, gravelly sandy soi1 and occuping tiny but distinct areas of land too small to be mapped, are indicated by an on-site symbol.
A summary of the soils grouped by parent materials is provided in the legend to the accompanying soi1 map.
16

PLATE II

PLATE II
(a) Profile of poorly drained Parksville soi1 developed on a shallow deposit of coarse-textured gravelly marine materials overlying deep deposits of fine-textured marine materials at 60 cm.
(b) Landscape associated with Parksville soi1 on gentle slopes of Portland Island; note remnants of an orchard from earlier homesteading days.
(c) Profile of well-drained Musgrave soil; shallow, lithic, moderately coarse textured soi1 developed in a thin deposit of colluvium over metamorphosed sedimentary bedrock at about 50 cm.
(d) Landscape associated with Musgrave soi1 on moderately sloping terrain covered with moss, salal, and toast Douglas fir, on Portland Island.
(e) Profile of well-drained Rumsley soil; shallow, lithic, moderately coarse textured soi1 developed in a thin deposit of colluvium over metamorphosed intrusive bedrock at about 65 cm.
(f) Landscape associated with Rumsley soil, and typical for the Rock-Rumsley map unit, on ridged and rocky terrain covered with grasses and few, scattered, stunted trees on Sidney Island.
PART 3. SURVEY AND MAPPING PROCEDURES
Hou the soils were mapped
Before field mapping began, preliminary plotting of soi1 boundaries and areas assumed to have similar soils were marked on aerial photographs in the office. Boundaries between contrasting soils were mapped, using changes in visible landscape features and other indicators, such as slope, bedrock exposures and shallow soils, vegetation, landform (for example, terraces, ridge crests, and escarpments) , peatlands containing Organic soils, and color tone indicating different drainage. Fieldwork involved checking these areas to determine the types of soils within them. Location of boundaries between contrasting soils were also checked either by visual examination or by digging and augering holes systematically on either side of them. They were then adjusted, if necessary, and finalized on the aerial photographs. Color aerial photographs at a scale of 1:20 000 were used for the field mapping of the islands during 1986.
At each inspection or observation site (a ground examination to identify or to verify the soil) of a given area, soi1 properties were recorded. External features such as site position, slope, aspect, elevation, stoniness, percentage bedrock exposed, and vegetation were noted and recorded. Then such properties as texture, drainage, depth to bedrock, root- and water-restricted layers, sequence of layers, and coarse fragment content were recorded from soi1 pits, auger holes, or road cuts. The control section for both minera1 and Organic soils was 160 cm. Consequently, where bedrock was absent, the depth to bedrock was recorded as 160 cm. Where deep roadcuts were available for examination, the properties occurring below 160 cm were recorded as notes. For data-recording purposes during mapping, soi1 layers, not soi1 horizons, were recognized. Soi1 layers are differentiated primarily on the basis of significant changes in textures that would affect interpretations (for example, sandy loam to clay loam, loamy sand to loam, loam to silty clay loam), or of significant changes in coarse fragment content (for example, 10 to 25%), or of size distribution of coarse fragments (for example, cobbles to gravels). Consequently, one soi1 layer may be made up of one or more genetic soi1 horizons (for example, layer one might include Ap and Bm horizons if no significant change in soi1 texture were found). However, when soi1 profiles were described and sampled in detail, it was done on the basis of genetic soi1 horizons (Appendix 1). The total number of inspections made during the fieldwork in the survey area is 257.
This type of survey procedure is appropriate to a survey intensity of level 2, called detailed (Valentine and Lidstone 1985), having the following specifications: "At least one inspection in over 80% of delineations. One inspection per 4-25 ha. Boundaries checked along about 25% of total length in open country (15% in woodland). Other boundaries inferred from aerial photographs. Traverses less than 1 km apart. Inspection spacing about 200 m. Traverses mainly by foot and some by vehicle." The average area represented by one inspection (inspection density) in the survey area was 10.2 ha.
An existing list of soils based on the soi1 legend for the Gulf Islands and east Vancouver Island from previous surveys was used, modified, and updated. Several new soils were added to this list. The soils were given
17

names from the areas where they were first found, plus symbols to denote the names on the aerial photographs. The final list of soils became the legend on the soi.1 map. The soils were classified according to The Canadian System of Soi1 Classification (Agriculture Canada Expert Committee on Soi1 Survey 1987). At the end of each field season, typical profiles of the major soils were described and sampled in detail. Once fieldwork was completed and the soils were named, described, classified, and delineated on aerial photographs, production of the final map and legend was begun. The soi1 map accompanying this report is at a scale of 1:20 000.
Data handling
During the 1986 field season (survey of Sidney, James, Moresby, Portland, and lesser islands), data collected at each inspection site were entered on a Radioshack TRS 80 (Mode1 100) portable computer. Back-up capabilities included a printer to produce hard copies of the data on a daily basis and recording of the data on magnetic tape because of limited storage space in the computer. The properties (data variables) recorded for each inspection were recorded directly as measured numeric values (for example, as actual depths in centimetres or percent slope) or as letter (character) codes (for example, soi1 textures or classification), following specified coding guidelines. At the end of the field season the data were transferred to a MSDOS-based microcomputer. Data were entered into Aladin data base management (Advanced Data Institute America Incorporated 1983) and were exported to a commercial spreadsheet (Lotus Development Corporation 1983) for statistical evaluation. Summary statistics (mean, minimum, and maximum values) were generated for numeric data (for example, coarse fragment content), and frequencies (counts) were generated for character data (for example, textures and classification). Data for a11 257 inspections were analyzed.
A polygon information form was filled out for each mapped delineation (polygon). Recorded information includes the map unit symbol and slope classes; the symbol, slope class, and proportion of the dominant, subdominant, and minor soils (inclusions) that occurred in the delineation; and the number of inspections (observations) per delineation. The data were entered into a MSDOS-based microcomputer. Computerized data handling of the polygon information occurred in the same way as for the daily records. Summary statistics include mean, minimum, and maximum percentage of soils in each map unit. During the field season, a total of 374 polygon forms were filled out,processed, and statistically analyzed.
Standardized forms and computerized data handling for large data sets have several advantages. Improvement in the detail, uniformity, and quality of description is usually found. If properties are described consistently and in a set order, the user cari find the desired information more readily and also the collecter records the required data more accurately and consistently. A standard format greatly facilitates data entry for computer processing. Computerized data handling allows for more efficient processing of the data, and statistical evaluations, such as frequency distributions, are readily done (Smeck et al. 1980).
18

Reliability of mapping
Al1 the islands and islets in the survey area were visited for field mapping using an inflatable zodiac boat. Field mapping involved traversing the islands and islets by foot, making use of existing trails and old logging roads when available. Islands without a network of trails were traversed using compass bearings. Several steep, inaccessible areas on Portland and Sidney islands were not checked.
On average, 0.7 inspections per delineation were made in the survey area. Ten or more inspections per delineation were not uncommon for large delineations and for areas with complex soi1 materials or topography. Therefore, symbols within any delineation on the map do not describe accurately 100% of what is in that area. Mapping accuracy varies with access and complexity of soi1 parent materials, topography, depth to bedrock, and soi1 drainage. For example, because of the former influence of the sea between 0 and 100 m above mean sea level, complex depositional sequences took place that are reflected in intimatély intermixed soi1 materials over very short distances. Generally, a higher inspection density took place in these areas, compared to that needed for the less complex patterns of soi1 landscape at higher elevations.
The soi1 map shows different areas of map units that have certain ranges of soils and soi1 properties. The reliability or accuracy of these ranges varies from one location of the map to another; it is never 100%. Therefore, to determine the qualities of a soi1 at a particular location, a site inspection must be made.
Soi1 series
The soils are recognized, named, and classified in The Canadian System of Soi1 Classification (Agriculture Canada Expert Committee on Soi1 Survey 1987) at the series level. Each named series consists of soils that have developed on similar parent materials and that are essentially alike in a11 major characteristics of their profile except for texture of the surface. Soi1 properties that are definitive for the soi1 series are texture, drainage, coarse fragment content, contrasting materials, thickness and degree of expression of horizons (for example, Ah and Bt horizon), and lithology. On these islands, 16 different soi1 series and one soi1 complex are recognized (sec map legend). In addition, one nonsoil unit is recognized and mapped that consists dominantly of Rock (RO).
A soi1 complex is used where two defined soi1 units are SO intimately intermixed geographically that it is impractical, because of the scale of mapping, to separate them. The Haslam soi1 complex includes Galiano and Saturna soils.
Variability in one or more soi1 properties is common. Where this variability is common and consistent enough to be mapped and where it affects the use interpretations and management of the soil, it is expressed as a soi1 phase in the map symbol. For example, an area with Saturna soi1 in which bedrock occurs consistently within 50 cm from the surface is mapped as a very shallow lithic phase (STsl). Soi1 variants are properties of soils believed
19

to be sufficiently different from other known soils but occurring at too limited an aerial extent to justify a new soi1 (for example, sombric variant). Al1 soi1 phases and variants used in the surveyed area are listed in the accompanying map legend and are expressed in the map symbol as one or two lowercase letter symbols attached to the soi1 symbol. A maximum of two soi1 phases or variants were recorded and mapped for a soil.
Map units
Soils are shown on the soi1 map either singly or grouped in map units. A map unit represents mappable portions of the soi1 landscape. Both soi1 and nonsoil (ROI, called mapping individuals, occur as components in each map unit. A map unit contains one (called simple map unit) or more than one (called compound map unit) soi1 or nonsoil individual, plus a small proportion of a minor soi1 or nonsoil individual, called inclusions. The proportion of each of the component soils, nonsoil, and inclusions varies within defined limits for the map unit from one delineation to another. The map unit reflects the combined total variation of a11 delineations that contain the same symbol (Mapping Systems Working Group 1981). The dominant soi.1 of the map unit is the most common soil, occupying between 50 and 100% of the map unit. The subdominant soi1 of the map unit is the less common soil, occupying between 25 and 50% of the map unit if limiting, or between 35 and 50% of the map unit if nonlimiting in the use interpretations. Minor soils or inclusions of the map occupy up to 25% of the map unit if limiting, or up to 35% of the map unit if nonlimiting in the use interpretations. For example, O-25$ bedrock exposures in the Saturna (ST) map unit is a limiting inclusion. However, an example of a nonlimiting minor soi1 or inclusion is O-35% of an imperfectly drained Brigantine (BE) soi1 in the poorly drained Parksville (PA) map unit. Consequently, the proportion of the map unit with limiting inclusions is always lower (usually between 0 and 25%) compared to the nonlimiting inclusions (usually between 0 and 35%). A soi1 cari be simultaneously the dominant component of one map unit, the subdominant component of another map unit, and a minor component or inclusion in a third map unit. An example of such a soi1 is Tolmie (TL); dominant soi1 in TL simple map unit, subdominant soi1 in BE-TL and PA-TL map units, and mentioned as minor components (inclusions) in the CO map unit. Also, many map units (both simple and compound) have inclusions of one or more minor soils (see "Part 4”).
The map units are described in the legend to the accompanying map sheet and are identified by specific colors on the map according to parent materials of the dominant soil. Simple map units with dominant soils developed on moderately fine to fine textured marine materials are colored shades of blue (Brigantine, Parksville, and Tolmie). Map units with dominant soils developed on coarse to moderately coarse textured morainal or fluvial parent materials are colored shades of red (Baynes, Beddis, Denman Island, and Qualicum). Shades of yellow and light orange are used for simple map units with soils developed on colluvial materials (Galiano, Haslam soi1 complex, Musgrave, Rumsley, Salalakim, and Saturna). Shades of bright green are used for map units the dominant soils of which have compact till in the subsoil (Mexicana, St. Mary, and Trincomali). The Rock-dominated simple map unit is colored gray-brown. Colors for compound map units are composed of a combination of the color for the dominant and the subdominant soils in the map unit.
20

Each of the 23 different map units recognized on the islands are listed in Table 5 with the total number of delineations and aerial extent. Table 5 also lists land types that are recognized on the islands; coastal beach, made land, tidal flat, and small lakes (sec also map legend). Land types are distinguished from map units by lacking a slope symbol.
Some areas on the map (delineations) are too small to be mapped separately. These areas are indicated by on-site symbols. They have been used for small areas in Rock (RO), Organic soils in marshes or swamps, and for small areas with native Indian middens (kitchen dumping grounds consisting of clam and oyster shells and organic debris). Other on-site symbols are used on the map to indicate site-specific information such as grave1 pits, escarpments, gullies, rock or stone piles, marshes or swamps, and water (ponds or dugouts). A list of on-site symbols is shown on the map legend.
21

Table 5. Number of delineations and areal extent of each map unit and land type for the survey area
Map unit Number of Areal Proportion of Symbol Name delineations extent total area
(ha) (Il
BD BE BE-TL BY DA GA HA ME MG PA PA-TL QU RO RO-BH RO-MG RO-RY RO-ST RY SL SM ST TL TR
Land type Symbol Name
CB MD TF W
Beddis 28 336.1. Brigantine 34 221.3 Brigantine-Tolmie 4 7.3 Baynes 3 23.8 Denman Island 10 33.5 Galiano 10 60.0 Haslam 7 39.3 Mexicana 5 6.2 Musgrave 15 103.9 Parksville 6 55.3 Parksville-Tolmie 3 11.6 Qualicum 12 57.3 Rock 80 231.4 Rock-Bellhouse 3 6.6 Rock-Musgrave 15 172.3 Rock-Rumsley 16 106.7 Rock-Saturna 19 45.3 Rumsley 13 85.3 Salalakim 4 10.6 St. Mary 6 38.2 Saturna 48 227.8 Tolmie 26 244.7 Trincomali 24 410.5
Coastal beach 5 16.0 0.6 Made land 2 4.6 0.2 Tidal flat 3 59.2 2.3 Small lakes, ponds 12 12.9 0.5
12.8 8.4 0.3 0.9 1.3 2.3 1.5 0.2 3.9 2.1 0.4 2.2 8.8
6:6 4.1 1.7 3.2 0.4
81:; 9.3
15.6
22

PART 4. DESCRIPTION OF SOILS AND MAP UNITS
This section describes the properties of the soils and map units. It describes how the basic units, the soils, are related and grouped together to form map units, which are then related to landscape properties. Each soi1 description is followed by map unit descriptions for which that soi1 is a dominant component.
DESCRIPTION OF SOILS
Descriptions for each of the 16 different soils, 1 soi1 complex, and 1 nonsoil unit occurring in the survey area include sections on soi1 characteristics, water regime, variability in soi1 properties, similar soils to the one described, natural vegetation, land use of the soil, and in what map units the soi1 occurs.
After a description of each soi1 regarding the range in soi1 textures and coarse fragment content, the drainage, and the depth that are definitive characteristics, the section on soi1 characteristics also includes data on observed ranges and calculated mean values for soi1 properties that relate to depth, thickness, and coarse fragment content, and frequency of occurrence data for soi1 properties such as texture, drainage class, and classification. Detailed profile descriptions for soils occurring most commonly are provided in Appendix 1.
Soi1 characteristics
Conventions used for the soi1 characteristics are as follows: For numeric data (for example, thickness of surface layer or cobble content of surface layer), the first three columns indicate mean, minimum, and maximum values for that property followed by the number of observations. A value of 160 cm corresponds with the depth of the control section (depth to which soi1 data were recorded) and indicates no value observed (for example, depth to bedrock or depth to mottles). For character data (for example, texture or drainage), the frequency of occurrence in percent of different classes of that property are presented (for example, texture of subsurface layer: SL 568, LS 25%, S 1911, followed by the number of observations. LS, SL, L, and SO on are the short forms for soi1 textures, explained in the map legend. CF is the short form for coarse fragments. Fine gravels range in size from 2 mm to 2.5 cm. Coarse gravels range in size from 2.5 to 7.5 cm. PSD is the short form for particle size discontinuity, which is used when Gnificant changes in particle sizes occur between soi1 layers (horizons) as a result of material deposition. These changes have to be greater than one textural class on the texture triangle (for example, S-SL, SL-CL, L-C). Water movement is often impaired by particle size discontinuities (Miller 1973). PSD is used with Brigantine, Parksville, and St. Mary soils.
23

Variability
Conventions used to describe soi1 variability are as follows:
Frequency of occurrence, expressed both as the number of observations and as the percentage of total number of soi1 observations, is presented for each soi1 phase or variant symbol in alphabetical sequence. As some soi1 phases or variants occur in conjunction with others, the numbers may overlap, hence the total percentage frequency may be greater than 100. When soi1 variability is frequent and consistent enough to be mapped, it is expressed in the map symbols as a soi1 phase or variant for the delineation. Consequently, it is tnentioned in the distribution and extent section.
Mean, followed by the range in values in parenthesis for numeric soi1 data, is presented in the variability column of this section (for example, coarse fragment content for very gravelly phase), after an explanation of the soi1 phase or variant symbol.
Further conventions used for soi1 descriptions, or the class limits for characteristics such as slope, cari be found in The Canadian System of Soi1 Classification (Agriculture Canada Expert Committee on Soi1 Survey 1987) or in the map legend. Definitions of soi1 terms not explained in this report cari be round in the Glossary of Terms in Soi1 Science (Canadian Society of Soi1 Science 1976).
DESCRIPTION OF MAP UNITS
Following each soi1 description are descriptions of map units for which that soi1 is a dominant component.
Each map unit description reports, based on a11 delineations of the map unit, the mean proportion in percent, followed in parentheses by the range (minimum and maximum proportion in percent) occupied by the dominant, the subdominant, and the minor soils (inclusions) in the map unit, calculated from the delineation (polygon) data. A minor soi1 does not occur in a11 delineations of the map unit. One that occurs in more than 20% of the delineations of the map unit is identified and listed. A minor soi1 that occurs in less than 20% of the delineations is not identified or listed, but collectively these minor soils are called unmentioned inclusions. Two minor soils occur in some delineations of the map unit.
Under landform and occurrence is described the landscape position, the surface form, and the dominant slopes for each map unit.
Under distribution and extent is described the geographic location of the map unit, the number and approximate size and shape of its delineations, and the areal extent of the map unit.
In the following sections soils and map units are described alphabetically. Detailed profile descriptions and analyses for the soils occurring most commonly are presented in alphabetical order in Appendixes 1 and 2.
24

BAYNES SOILS AND MAP UNITS
Baynes soils (BY)
Baynes soils are imperfectly drained soils that have developed on deep (>150 cm) fluvial, marine, or eolian materials of sandy loam to sand texture. Coarse fragment content is <20%. The profile description and analyses of a selected Baynes soi1 are given in Appendixes 1 and 2.
Soi1 characteristics
Characteristic No. of
Mean Minimum Maximum observations
Thickness of surface layer (cm) 37 25 50 Depth to bedrock (cm) 160 160 160 Depth to restricting layer (cm) 160 160 160 Depth to mottles (cm) 54 35 90 CF content surface layer (%) 10 4 20 Fine grave1 content surface layer (%) 9 2 20 Coarse grave1 content surface layer (%) 1 0 2 Cobble content surface layer (%) 0 0 0 CF content subsurface layer (%) 10 0 20 Fine grave1 content subsurface layer (%) 9 5 20 Coarse grave1 content subsurface layer (%) 1 0 5 Cobble content subsurface layer (%) 0 0 0
7 7 7 7 5 5 5 5 5 5 5 5
Frequency of occurrence (%) No. of
observations
Texture of surface layer SL(71), LS(14), L(14) 7 Texture of subsurface layer LS(57), S(29), SL(l4) 7 Drainage class Imperfect(100) 7 Soi1 classification GL.DYB(57), GL.SB(43) 7
Type of restricting layer Absent Perviousness Rapid to moderate
Water regime
Baynes soils are imperfectly drained soils with distinct to prominant mottles between 35 and 90 cm, caused by seasonal fluctuations in the water table. They are saturated to about 45 cm from the surface during winter months. Where seepage water occurs the subsoil may be moist throughout the rest of the year. Droughty conditions may occur during the summer when the water table drops to below 75 cm of the surface. The C horizon in some places has a massive structure of compact sand that is less permeable than the overlying materials, which results in perched water table conditions.
25

Variability
Soi1 phase Frequency or variant (no.> (Il
Description of variability
BYa 2 29 Sombric variant: Ah or Ap horizon >lO cm; classified as Gleyed Sombric Brunisol (GL.SB); also in conjunction with shallow (s) and strongly mottled or wetter (w) phases
BYg 2 29 Gravelly phase: coarse fragment content in surface layer between 20 and 50%; mean CF 23% (20-25%); also in conjunction with strongly mottled or wetter (w) phase
BYw 4 58 Strongly mottled phase: wetter moisture regime by mottling within 50 cm of surface; not a Gleysolic type landscape; also in conjunction with sombric (a) variant and gravelly (g) phase
Note: Other phases of the Baynes soi1 with very limited occurrence are 1Oam (10) and shallow (s) phases.
Similar soils
Baynes soils are similiar to the Beddis soils that are rapid to moderately well drained and to poorly drained Denman Island soils. Baynes soils are also similar to the Qualicum soils that have a higher (>20%) coarse fragment content throughout the profile and are rapidly to well drained.
Natural vegetation
The natural vegetation is characterized by western red cedar, red alder, and toast Douglas fir. The understory consists predominately of western sword fern (Polystichum munitum).
Land use
Most Baynes soils are tree covered. Some small areas of Baynes soi1 have been cleared for agriculture, primarily for pasture. The soils are droughty, fertility is low, soi1 reaction is strongly acid, and the base exchange is also low. With improvements, such as drainage, irrigation, and high inputs of fertilizer, these soils have good potential for producing a range of annual crops. At present, forestry represents their most common use.
Map units
Only one Baynes map unit is recognized, a simple map unit (BY) in which Baynes is the dominant soil. In addition, the Baynes soi1 occurs as a minor soi1 or unmentioned inclusion in some delineations of the Beddis (BD), Brigantine (BE), Denman Island (DA), Parksville (PA), Qualicum (QU), and Trincomali (TR) map units.
26

Baynes map unit (BY)
The Baynes map unit consists dominantly (70%) of the imperfectly drained Baynes soil. The map unit includes on average 30% of other soils, which may be one or a combination of the following minor soils: Beddis (BD), Denman Island (DA), or Brigantine (BE). In addition, unmentioned inclusions of other (poorly drained) soils do occur in each delineation.
The inclusions of poorly drained soils somewhat limit the land use possibilities and use interpretations for this map unit. Beddis and Brigantine minor soils are nonlimiting inclusions.
Landform and occurrence
Soils of the Baynes map unit occur on lower side-slope positions along drainageways or in flatter depressional areas as deep sandy deposits. The topography is very gently to moderately sloping (2-15s) and, in some places, strongly sloping (16-30s). Minor soils are scattered in some Baynes delineations.
Distribution and extent
Baynes is a very minor map unit that appears as three small- to medium-sized delineations on Sidney and Moresby islands only. On Sidney Island one delineation was mapped as BYw, and the one delineation on Moresby Island was mapped as BYg. This map unit represents an area of 23.8 ha (0.9% of total map area).
BEDDIS SOILS AND MAP UNITS
Beddis soils (BD)
Beddis soils are rapid to moderately well drained soils that have developed on deep (>150 cm) fluvial, marine, or eolian materials of sandy loam to sand texture. Coarse fragment content is <20%. The profile description and analyses of a selected Beddis soi1 are given in Appendixes 1 and 2.
27
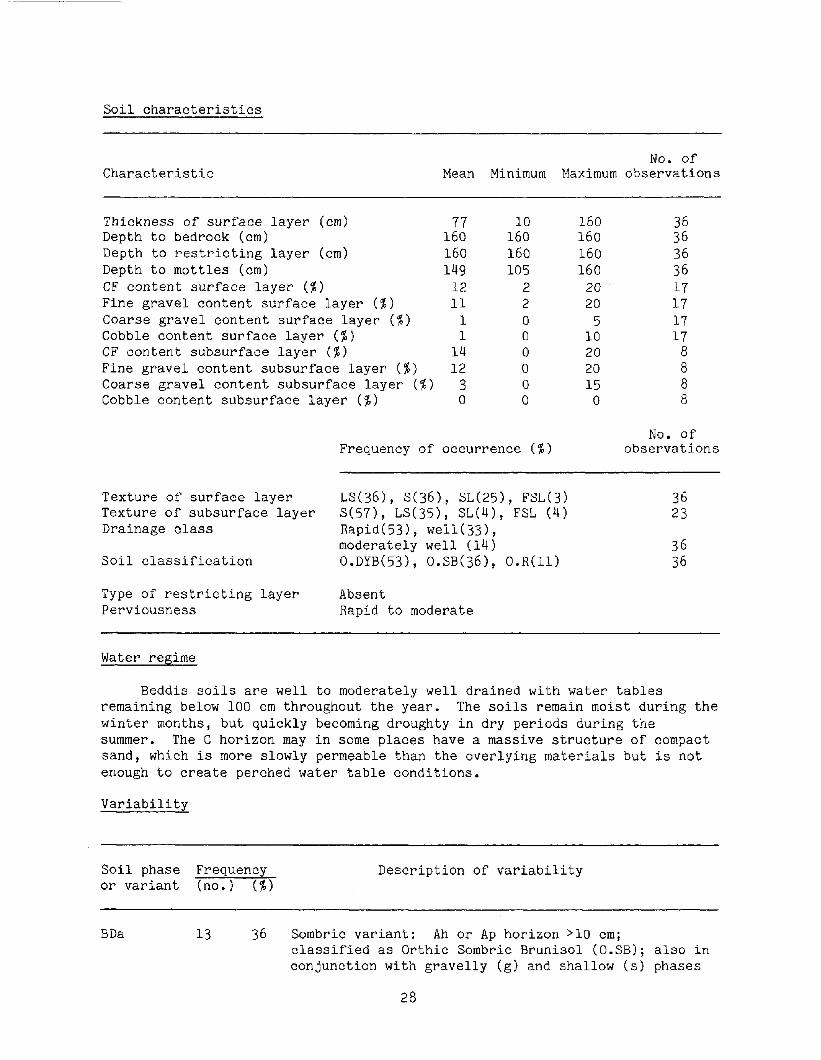
Soi1 characteristics
Characteristic No. of
Mean Minimum Maximum observations
Thickness of surface layer (cm) 77 10 160 36 Depth to bedrock (cm) 160 160 160 36 Depth to restricting layer (cm) 160 160 160 36 Depth to mottles (cm) 149 105 160 36 CF content surface layer (%) 12 2 20 17 Fine grave1 content surface layer (%) 11 2 20 17 Coarse grave1 content surface layer (%) 1 0 5 17 Cobble content surface layer (%) 1 0 10 17 CF content subsurface layer (%) 14 0 20 8 Fine grave1 content subsurface layer (4%) 12 0 20 8 Coarse grave1 content subsurface layer (%) 3 0 15 8 Cobble content subsurface layer (%) 0 0 0 8
Frequency of occurrence (%) No. of
observations
Texture of surface layer os, S(36), SL(25), PSL(3) 36 Texture of subsurface layer S(57), LS(35), SL(4), FSL (4) 23 Drainage class Rapid(53), well(33),
moderately well (14) 36 Soi1 classification O.DYB(53), O.SB(36), O.R(ll) 36
Type of restricting layer Absent Perviousness Rapid to moderate
Water regime
Beddis soils are well to moderately well drained with water tables remaining below 100 cm throughout the year. The soils remain moist during the winter months, but quickly becoming droughty in dry periods during the summer. The C horizon may in some places have a massive structure of compact Sand, which is more slowly permeable than the overlying materials but is not enough to create perched water table conditions.
Variability
Soi1 phase Frequency or variant (no.1 (%>
Description of variability
BDa 13 36 Sombric variant: Ah or Ap horizon >lO cm; classified as Orthic Sombric Brunisol (O.SB); also in conjunction with gravelly (g) and shallow (s) phases
28

BM
BDt
22 61 Gravelly phase: coarse fragment content in surface layer between 20 and 50%; mean CF 33% (25~40%); also in conjunction with sombric variant (a) and moderately cemented (me) phase
4 11 Taxonomy change variant: taxonomy differs from specified classification (GL.DYB or GL.SB) into Orthic Regosol (0.R) for Beddis soils that have no profile development (located on sandspits)
Note: Other phases of the Beddis soi1 with very limited occurrence are shallow lithic (l), moderately cemented (me), deep (d), shallow (s), and very shallow (vs) phases.
Similar soils
Beddis soils are similar to Qualicum soils, which have a higher (>20%) coarse fragment content throughout the profile. Beddis soils are similar to the Baynes soils that are imperfectly drained, and to the poorly drained Denman Island soils.
Natural vegetation
The natural vegetation is characterized by toast Douglas fir, grand fir, some shore pine, and scattered Pacifie madrone. The understory consists of salai, western bracken (Pteridium aquilinum), and du11 Oregon-grape. Western hemlock occurs on some sites with a northerly aspect.
Land use
Most Beddis soils support a tree caver. Some small areas have been cleared over the years for agricultural purposes, mainly for pasture and hay crops. The soils are very droughty, fertility is low, and soi1 reactions are strongly acid (pH 5.1-5.5); the base exchange is low as well. With improvements, such as irrigation and high inputs of fertilizer, these soils have good potential for producing a range of annual crops and tree fruits. Currently, forestry represents their most common use.
Map units
Only one Beddis map unit is recognized, a simple map unit in which Beddis is the dominant soil. In addition, Beddis soils occur as a minor soi1 or unmentioned inclusion in some delineations of the Baynes (BY), Brigantine (BE), Qualicum (QV), and Trincomali (TR) map units.
Beddis map unit (BD)
The Beddis map unit consists dominantly (83%; 60-100%) of the well to moderately well drained Beddis soils. The Beddis map unit includes on average 17% (up to 40%) of other soils. These other soils may be one or a combination of the following soils: Qualicum (QU), Trincomali (TR), or Baynes (BY), of which the Qualicum and Trincomali soils occur most widely (in more than half
29

the number of delineations). Unmentioned inclusions of other soils occur in very few places.
Qualicum and Trincomali soils somewhat limit the land use possibilities and use interpretations for this map unit because of the higher coarse fragment content. The imperfectly drained Baynes (BY) soils limit the land use possibilities and use interpretations because they are wetter soils than Beddis.
Landform and occurrence
The Beddis map unit occurs both as narrow, discontinuous terraces along drainageways, as old beach deposits or as interglacial Quadra sand deposits, on very gently to moderately sloping (2-l5%), and on some steeper sloping (i6-30%) terrain. Three areas on James Island occurred on very steep bluff slopes (46-100%). Inclusions of other soils occur at random.
Distribution and extent
The Beddis map unit covers 28 variable-sized delineations throughout the survey area. Thirteen delineations were mapped on James Island and seven on Sidney Island, including some large and very large delineations. Fifteen of the Beddis delineations were mapped without soi1 phases as BD, eleven as BDg or BDg,a, one each as BD1 and BDvs. This major map unit represents an area of 336.1 ha (12.8% of total map area).
BELLHOUSE SOILS AND MAP UNITS
Bellhouse soiis (BH)
The well-drained Bellhouse soi.1 has developed on shallow colluvial and glacial drift materials of channery and flaggy, sandy loam texture over fractured or smooth, unweathered sandstone bedrock within 100 cm. Coarse fragment content varies between 20 and 50%. The soi1 has a dark-colored Ah horizon of at least 10 cm thick that is high in organic matter content. The profile description and analyses of a selected Bellhouse soi1 are given in Appendixes 1 and 2.
30

Soi1 characteristics
Characteristic No. of
Mean Minimum Maximum observations
Thickness of surface layer (cm) 20 20 20 1 Depth to bedrock (cm) 20 20 20 1 Depth to restricting layer (cm) 20 20 20 1 Depth to mottles (cm) 160 160 160 1 CF content surface layer (%) 45 45 45 1 Fine grave1 (channery) content
surface layer (%) 15 15 15 1 Coarse grave1 (channery) content
surface layer (%) 30 30 30 1 Cobble content (flaggy) surface
layer (%> 0 0 0 1
No. of Frequency of occurrence (%) observations
Texture of surface layer Texture of subsurface layer Drainage class Soi1 classification
SL(100)
Well(100) O.SB(lOO)
Type of restricting layer Sandstone bedrock Perviousness Rapid to moderate
Water regime
Bellhouse soils are well drained. The soi1 remains moist throughout the winter months but is droughty from late spring to late fall. After infiltration, excess water drains freely and rapidly on top of the underlying sloping bedrock to lower areas.
Variability
Soi1 phase Frequency Description of variability or variant ho.> CI>
BHsl 1 100 Very shallow lithic phase: depth to bedrock between 10 and 50 cm; mean depth 20 cm (20-20 cm)
31

Similar soils
Bellhouse soils are similar to Saturna soils, which have thinner Ah or Ap horizons (O-10 cm). Saturna soils are found on a11 aspects, whereas the Bellhouse soils are more restricted to southerly and southwesterly aspects.
Natural vegetation
The natural vegetation is quite distinctive and consists of scattered clumps of Garry oak, toast Douglas fir, and Pacifie madrone. Garry oak is a unique species, restricted to the warm and dry southerly and southwesterly aspects. Tree growth is often stunted from lack of moisture. The ground caver is predominantly grasses, spring flowers, common gorse, and Scotch broom.
Land use
Because of the shallow soi1 to bedrock, topographie limitations, and droughtiness, uses of the Bellhouse soi1 are restricted mainly to its natural vegetation and to limited grazing by wild sheep and deer.
Map units
Bellhouse soils only occur as the subdominant soi1 in one compound map unit in the survey area, the Rock-Bellhouse (RO-BH) map unit, which is described under Rock (ROI. In addition, the Bellhouse soi1 may occur as a minor soi1 or unmentioned inclusion in some delineations of the Rock (ROI and Rock-Saturna (RO-ST) map units.
BRIGANTINE SOILS AND MAP UNITS
Brigantine soils (BE)
Brigantine soils are imperfectly drained soils that have usually between 30 and 100 cm of a sandy loam to loamy sand of marine or fluvial origin overlying deep (>lOO cm), silty clay loam to loam deposits, that are usually stone free. In some places, overlay materials were shallower than 30 cm. Coarse fragment content of overlay materials (20%. The profile description and analyses of a selected Brigantine soi1 are given in Appendixes 1 and 2.
32

Soi1 characteristics
Characteristic No. of
Mean Minimum Maximum observations
Thickness of surface layer (cm> 45 10 90 33 Thickness of 2nd layer (cm) 39 10 100 33 Depth to bedrock (cm) 160 160 160 33 Depth to restricting layer (cm> 67 40 100 26 Depth to mottles (cm> 58 40 85 26 Depth to PSD (cm) 63 11 100 26 CF content surface layer (8) 10 2 15 10 Fine grave1 content surface layer (%> 7 0 15 10 Coarse grave1 content surface layer (%> 3 0 10 10 Cobble content surface layer (8) 0 0 2 10 CF content 2nd layer (%> l3 0 50 33 Fine grave1 content 2nd layer (%> 9 0 35 33 Coarse grave1 content 2nd layer (%> 3 0 25 33 Cobble content 2nd layer (%) 1 0 10 33 CF content 3rd layer (%) 2 0 15 23 Fine grave1 content 3rd layer ($1 2 0 10 23 Coarse grave1 content 3rd layer (8) 0 0 5 23 Cobble content 3rd layer (%) 0 0 0 23
Frequency of occurrence (%) No. of
observations
Texture of surface layer ~~(581, ~~(151, L(12), FSL(9), S (6) 33 Texture of 2nd layer LS(33), SICL(24), L(12), .X(9), FSL(9),
s(6), scL(3), CL(31 Texture of 3rd layer Drainage class Soi1 classification
SICL(70), SCL(l3), CL(g), SL(4), L(4) 2"3 Imperfect(97), moderately well(3) 33 GL.DYB(55), GL.SB(421, OaDYB(3) 33
Type of restricting layer Fine-textured subsoil, often massive structured Perviousness Slow
Water regime
Brigantine soils are imperfectly drained with seasonal fluctuations in the water table. They are saturated to within 60 cm of the surface during the winter months. Seepage water maintains the subsoil in a moist condition throughout the rest of the year. Droughty conditions may occur during the summer when the water table drops to below 75 cm from the surface. Perched water table conditions may occur above the fine-textured subsoil.
33

Variability
Soi1 phase Frequency or variant (no.) (%>
Description of variability
BEa 14 42 Sombric variant: Ah or Ap horizon '10 cm; classified as Gleyed Sombric Brunisol (GL.SB); also in conjunction with gravelly (g) and strongly mottled or wetter (w) phases
BEd 7 21 Deep phase: depth to fine-textured subsoil between 100 and 150 cm; mean depth 114 cm (105-130 cm); alS0 in conjunction with gravelly (g) phase
BEg 23 70 Gravelly phase: coarse fragment content in surface layer between 20 and 50%; mean CF 32% (20-50%); also in conjunction with sombric (a) variant, deep (dl, and strongly mottled or wetter (w> phases
BEw 7 21 Strongly mottled phase: wetter moisture regime as evidenced by mottling within 50 cm of the surface; not a Gleysolic type landscape; also in conjunction with sombric (a) variant and gravelly (g) phase
Note: No other soi1 phases or variants of the Brigantine soi1 occur.
Similar soils
Brigantine soils are similar to the poorly drained Parksville soils. Shallow Brigantine soils over compact till materials within 100 cm of the surface have been mapped as St. Mary soils. Brigantine soils with coarse to moderately coarse textured overlays thicker than 150 cm have been classified and mapped as the better-drained Beddis or Qualicum soils, depending on the coarse fragment content.
Natural vegetation
The natural vegetation consists of western red cedar, red alder, and toast Douglas fir. The understory includes western sword fern, salal, and western bracken.
Land use
Brigantine soils in the survey area are used for pasture and hay crops and for growing trees. For agricultural purposes, the soi1 remains cold till late spring and is strongly acid (pH 5.1-5.5). The Upper horizons have a moderately low moisture-holding capacity. The soi1 has low inherent fertility, SO large amounts of fertilizer are required to produce a good trop. Brigantine soils cari be itnproved with irrigation and subsurface drainage to some of the better agricultural soils, producing a wide range of crops and tree fruits.
34
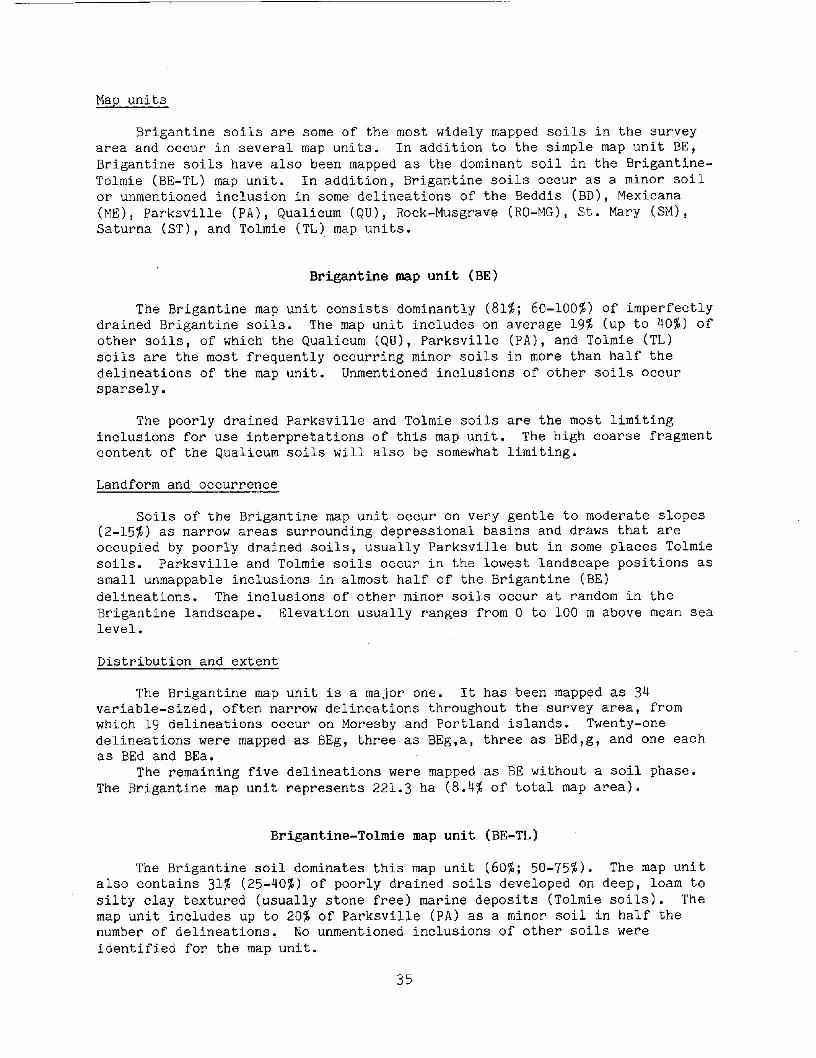
Map units
Brigantine soils are some of the most widely mapped soils in the survey area and occur in several map units. In addition to the simple map unit BE, Brigantine soils have also been mapped as the dominant soi1 in the Brigantine- Tolmie (BE-TL) map unit. In addition, Brigantine soils occur as a minor soi1 or unmentioned inclusion in some delineations of the Beddis (BD), Mexicana (ME), Parksville (PA), Qualicum (QV), Rock-Musgrave (RO-MG), St. Mary (SM), Saturna (ST), and Tolmie (TL) map units.
Brigantine map unit (BE)
The Brigantine map unit consists dominantly (81%; ~CI-100%) of imperfectly drained Brigantine soils. The map unit includes on average 19% (up to 40%) of other soils, of which the Qualicum (QU), Parksville (PA), and Tolmie (TL) soils are the most frequently occurring minor soils in more than half the delineations of the map unit. Unmentioned inclusions of other soils occur sparsely.
The poorly drained Parksville and Tolmie soils are the most limiting inclusions for use interpretations of this map unit. The high coarse fragment content of the Qualicum soils Will also be somewhat limiting.
Landform and occurrence
Soils of the Brigantine map unit occur on very gentle to moderate slopes (2-15%) as narrow areas surrounding depressional basins and draws that are occupied by poorly drained soils, usually Parksville but in some places Tolmie soils. Parksville and Tolmie soils occur in the lowest landscape positions as small unmappable inclusions in almost half of the Brigantine (BE) delineations. The inclusions of other minor soils occur at random in the Brigantine landscape. Elevation usually ranges from 0 to 100 m above mean sea level.
Distribution and extent
The Brigantine map unit is a major one. It has been mapped as 34 variable-sized, often narrow delineations throughout the survey area, from which 19 delineations occur on Moresby and Portland islands. Twenty-one delineations were mapped as BEg, three as BEg,a, three as BEd,g, and one each as BEd and BEa.
The remaining five delineations were mapped as BE without a soi1 phase. The Brigantine map unit represents 221.3 ha (8.4% of total map area).
Brigantine-Tolmie map unit (BE-TL)
The Brigantine soi1 dominates this map unit (60%; 50-752). The map unit also contains 31% (25-40%) of poorly drained soils developed on deep, loam to silty clay textured (usually stone free) marine deposits (Tolmie soils). The map unit includes up to 20% of Parksville (PA) as a minor soi1 in half the number of delineations. No unmentioned inclusions of other soils were identified for the map unit.
35

Landform and occurrence
Soils of the Brigantine-Tolmie (BE-TL) map unit occur on very gentle to moderate (2-15%) slopes in narrow areas surrounding depressional basins and draws that are occupied by poorly drained Tolmie soils. Tolmie and Parksville soils occupy the lowest landscape positions, with Tolmie soils making up significant portions (25-40%) of the map unit. Elevation usually ranges between 0 and 100 m above mean sea level.
Distribution and extent
The Brigantine-Tolmie map unit has been mapped very widely as four relatively small delineations on Moresby and Piers islands. Two of the delineations were mapped as BEg-TL, one as BEa-TL, one as BE-TL. This map unit represents an area of 7.3 ha (0.3% of total map area).
DENMAN ISLAND SOILS AND MAP UNITS
Denman Island soils (DA)
Denman Island soils are poorly to very poorly drained soils that have developed on deep (>150 cm) fluvial, marine, or eolian materials of sandy loam to loamy Sand texture. Coarse fragment content is <20%.
Soi1 characteristics
Characteristic No. of
Mean Minimum Maximum observations
Thickness of surface layer (cm) 23 20 25 2 Depth to bedrock (cm) 160 160 160 1 Depth to restricting layer (cm) 160 160 160 1 Depth to mottles (cm) 15 5 25 2 CF content surface layer (%> 4 0 8 2 Fine grave1 content surface layer (%) 3 0 5 2 Coarse grave1 content surface layer (%) 2 0 3 2 Cobble content surface layer (%> 0 0 0 2 CF content subsurface layer (%) 8 0 15 2 Fine grave1 content subsurface layer ($1 5 0 10 2 Coarse grave1 content subsurface layer (%) 3 0 5 2 Cobble content subsurface layer (%) 0 0 0 2
36

Frequency of occurrence (%) No. of
observations
Texture of surface layer L(501, PEAT(50) 2 Texture of subsurface layer SL(50), LS(50) 2 Drainage class Poor(SO), very poor(50) 2 Soi1 classification O.HG(50), O.G(50) 2
Type of restricting layer Absent Perviousness Rapid to moderate
Water regime
The Denman Island soils are poorly to very poorly drained and have distinct to prominent mottles within 50 cm of the surface. They are wet for long periods throughout the year with water tables at or within 30 cm of the surface during the winter (December to March). The water table drops quickly below 60 cm from the surface in early April and remains there until early November. Water tables in the Denman Island soils fluctuate rapidly over short periods after rainfall or drought. The C horizon may have a massive structure of compact Sand, which is more slowly permeable than the overlying materials, resulting in a perched water table. Because of their low landscape position, Denman Island soils receive runoff water from the surrounding landscape.
Variability
Soi1 phase Frequency or variant (no.) (%>
Description of variability
DApt 1 50 Peaty phase: (40 cm of mesic organic materials over minera1 soil; mean thickness 20 cm (20-20 cm)
DAl 1 50 Shallow lithic phase: depth to bedrock between 50 and 100 cm; mean depth 75 cm (75-75 cm); also in conjunction with loam (10) phase
DAlo 1 50 Loam phase: surface texture is loam; mean thickness _,- 25 cm (25-25 cm) also in conjunction with shallow
lithic (1) phase
Note: Denman Island soils that are periodically inundated by seawater at very high tides are mapped as saline phases (sn>.
Similar soils
Denman Island soils are similar to the Beddis soils that are rapidly to moderately well drained and to the Baynes soils that are imperfectly drained.
37

Denman Island soils are somewhat similar to the Qualicum soils that have a higher (>20%) coarse fragment content throughout the profile and that are rapidly to well drained.
Natural vegetation
The natural vegetation is characterized by western red cedar, red alder, and bigleaf maple. The understory consists predominantly of western sword fern, sedges, and rushes.
Land use
Denman Island soils are either tree covered or support Salt-tolerant grasses in areas periodically inundated by seawater at very high tides.
Map units
Only one Denman Island map unit is recognized, a simple map unit (DA) in which Denman Island is the dominant soil. In addition, the Denman Island soi1 occurs as a minor soi1 or unmentioned inclusion in some delineations of the Baynes (BY) and Parksville (PA) map units.
Denman Island map unit (DA)
The Denman Island map unit consists dominantly (97%; 75-100s) of poorly to very poorly drained Denman Island soils. The map unit includes on average 3% (up to 25%) of other soils. Besides one delineation with 25% inclusions of Baynes and Saturna soils, no minor soils or inclusions were identified for the Denman Island map unit. The inclusion of Saturna soi1 limits most use interpretations for that delineation.
Landform and occurrence
Soils of the Denman Island map unit occur in narrow drainageways, draws, and depressions as deep sandy deposits. Some areas (three on James Island and one on Sidney Island) are periodically inundated by seawater at very high tides. The topography varies from depressional to level to very gently sloping (O-51).
Distribution and extent
Denman Island is a minor map unit that has been mapped as 10 very small- to medium-sized delineations, of which 5 occur on James Island, 4 on Sidney Island, and 1 on Coal Island. Four delineations (two each on James and Sidney islands) were mapped as DApt, and the one on Coal Island as DAl,lo. The remaining five delineations did not have any soi1 phases. This map unit represents an area of 33.5 ha (1.3% of total map area).
38
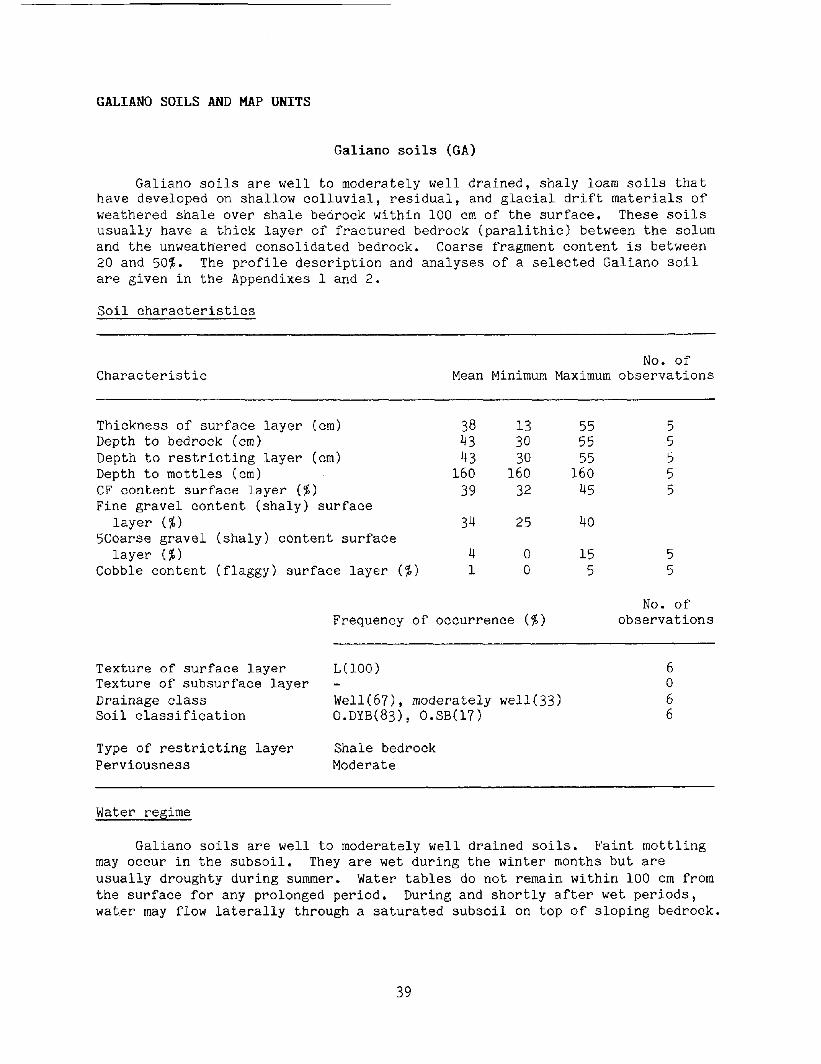
GALIANO SOILS AND MAP UNITS
Galiano soils (GA)
Galiano soils are well to moderately well drained, shaly loam soils that have developed on shallow colluvial, residual, and glacial drift materials of weathered shale over shale bedrock within 100 cm of the surface. These soils usually have a thick layer of fractured bedrock (paralithic) between the solum and the unweathered consolidated bedrock. Coarse fragment content is between 20 and 50%. The profile description and analyses of a selected Galiano soi1 are given in the Appendixes 1 and 2.
Soi1 characteristics
Characteristic No. of
Mean Minimum Maximum observations
Thickness of surface layer (cm) 38 13 55 5 Depth to bedrock (cm) 43 30 55 5 Depth to restricting layer (cm> 43 30 55 5 Depth to mottles (cm) 160 160 160 5 CF content surface layer ($) 39 32 45 5 Fine grave1 content (shaly) surface
layer C%l 34 25 40 5Coarse grave1 (shaly) content surface
layer C%l 4 0 15 5 Cobble content (flaggy) surface layer (%> 1 0 5 5
Frequency of occurrence (%> No. of
observations
Texture of surface layer L(100) Texture of subsurface layer - Drainage class We11(67), moderately well(33) Soi1 classification O.DYB(83), O.SB(17)
6 0
Type of restricting layer Shale bedrock Perviousness Moderate
Water regime
Galiano soils are well to moderately well drained soils. Faint mottling may occur in the subsoil. They are wet during the winter months but are usually droughty during summer. Water tables do not remain within 100 cm from the surface for any prolonged period. During and shortly after wet periods, water may flow laterally through a saturated subsoil on top of sloping bedrock.
39

Variability
Soi1 phase Frequency or variant (no.) (%>
Description of variability
GAd 1 17 Deep phase: depth to bedrock between 100 and 150 cm; mean depth 125 cm (125-125 cm)
GA1 1 17 Shallow lithic phase: depth to bedrock between 50 and 100 cm; mean depth 55 cm (55-55 cm)
Gasl 4 67 Very shallow lithic phase: depth to bedrock between 10 and 50 cm; mean depth 40 cm (30-45 cm); also in conjunction with very gravelly (vg> phase
GAvg 1 17 Very gravelly phase: coarse fragment content in surface layer >50%; mean CF 60% (60-601); only in conjunction with very shallow lithic (sl) phase
Note: No other soi1 phases or variants of the Galiano soi1 occur.
Similar soils
Galiano soils are commonly found together with the well-drained, channery and flaggy, sandy loam to fine sandy loam textured Saturna soils that have developed on colluvial and glacial drift materials over sandstone bedrock within 100 cm of the surface. Both soils occur on similar slopes and in similar landscape positions. Galiano and Saturna soils commonly occur SO closely together in the landscape, because of the intermixing of bedrock types, that they cannot be reasonably separated. Where this occurs, both soils are identified and mapped as Haslam soi1 complex (HA).
Natural vegetation
The natural vegetation consists of toast Douglas fir, some scattered Pacifie madrone, and, in a few places, some western red cedar. The ground caver includes short salal, grasses, and moss.
Land use
Al1 Galiano soils in the report area have a tree caver. Galiano soils are generally not suitable for agriculture because of steep topography, stoniness, shallow to bedrock, droughtiness, low fertility, and the many bedrock outcrops. The best use for Galiano soils is for growing coniferous trees.
40

Map units
Galiano soils occur as the dominant soi.1 in the Galiano (GA) simple map unit. They are also a major component of the Haslam (HA) soi1 complex. In addition, Galiano soils occur as a minor soi1 or unmentioned inclusion in some delineations of the Beddis (BD), Rock (RO), Rock-Saturna (RO-St), Saturna (ST), and Tolmie (TL) map units.
Galiano map unit (GA)
The Galiano map unit consists dominantly (82%; 50-90%) of the well to moderately well drained Galiano soils. The Galiano map unit includes on average 18% (up to 50%) of other soils, of which bedrock outcrops of shale (RO) are the most widely occurring minor component in more than half the delineations. Unmentioned inclusions of other soils occur sporadically.
Bedrock exposures are usually associated with the very shallow lithic Galiano soils (GAsl) and limit the use interpretations. Inclusions of other soils are nonlimiting and are most commonly associated with the GA delineations.
Landform and occurrence
Soils of this map unit occur in areas of shallow soils over sedimentary bedrock, elongated parallel ridges and knolls with gentle to moderate (6-15%) slopes and in some places on very strong (31-458) slopes. Soils in this map unit are commonly represented as long, narrow delineations. Inclusions of Rock and soils occur randomly as small areas.
Distribution and extent
The Galiano map unit is a minor one with 10 small- to medium-sized delineations on Piers, Knapp, Pym, Domville, and Coal islands. GAsl delineations, including two GAsl,vg delineations, occur more widely (70%) than GA delineations. The Galiano map unit represents an area of 60 ha (2.3% of total map area).
HASLAM SOIL COMPLEX AND MAP UNITS
Haslam soi1 complex (HA)
The Haslam soi1 complex consists of well-drained soils ranging in texture from channery and shaly sandy loam to channery and shaly loam colluvial, residual, and glacial drift materials over sandstone, siltstone, or shale bedrock within 100 cm of the surface. The soi1 materials usually have a layer of fractured bedrock (paralithic) between the solum and the unweathered solid bedrock. Coarse fragment content is between 20 and 50%. The different bedrock types that are the parent materials for Galiano and Saturna soils occur either sequentially or intermixed; consequently, Haslam is a complex of these soils.
41

Soi1 characteristics
Characteristic No. of
Mean Minimum Maximum observations
Thickness of surface layer (cm) 48 Depth to bedrock (cm) 48 Depth to restricting layer (cm) 48 Depth to mottles (cm) 160 CF content surface layer (%) 45 Fine grave1 (shaly and channery) content
surface layer (%> 20 Coarse grave1 (shaly and channery) content
surface layer (%> 23 Cobble content (flaggy) surface layer (%) 8
30 160
40
10
15 25 4 0 20 4
70 70 70
160 50
35
Texture of surface layer Texture of subsurface layer Drainage class Soi1 classification
L(50), SL(50)
Well (100) O.DYB(lOO)
6 0
Type of restricting layer Sandstone, siltstone, or shale bedrock Perviousness Rapid to moderate
Frequency of occurrence ($1 No. of
observations
Water regime
Haslam soi1 complex consists of well-drained soils. They are moist and occasionally wet during the winter months but droughty during the summer. Water tables do not remain within 100 cm of the surface for any prolonged time. During and shortly after wet periods, water may flow laterally through the saturated subsoil on top of sloping bedrock. The fractured bedrock materials on top of the unweathered, consolidated bedrock does not impede the movement of water.
42

Variability
Soi1 phase Frequency or variant (no.) (%>
Description of variability
HA1 2 25 Shallow lithic phase: depth to bedrock between 50 and 100 cm; mean depth 68 cm (65-70 cm); also in conjunction with very gravelly (vg) phase
HAsl 5 63 Very shallow lithic phase: depth to bedrock between 10 and 50 cm; mean depth 39 cm (30-50 cm); also in conjunction with very gravelly (vg) phase
HAvg 5 63 Very gravelly phase: coarse fragment content in surface layers >50%; mean CF 58% (55-60%); only in conjunction with shallow lithic (1) and very shallow lithic (sl) phases
Note : There is also a very limited occurrence of the deep (d) phase of the Haslam soi1 complex.
Similar soils
Haslam is a complex of Galiano and Saturna bedrock types are SO intimately intermixed that separately.
Natural vegetation
soils where their respective it is impractical to map them
The natural vegetation on the Haslam soi1 complex consists of toast Douglas fir, Pacifie madrone, and, in some places, western red cedar, western hemlock, and grand fir. The ground caver consists of short salal, western bracken, du11 Oregon-grape, and grasses.
Land use
The Haslam soi1 complex is rarely used for agriculture because of many limiting factors, such as steep topography, stoniness, shallow to bedrock, droughtiness, low fertility, and the frequency of rock outcrops. The best use for these soils is for growing coniferous trees.
Map units
The Haslam soi1 complex is dominant in the simple Haslam (HA) map unit.
43

Haslam map unit (HA)
The Haslam map unit consists dominantly 84% (TO-90%) of the well-drained Haslam complex with up to 20% of bedrock exposures (Rock). Unmentioned inclusions of another soi1 only occur in one delineation. The inclusions of bedrock exposures are a limiting factor in use interpretations for this map unit.
Landform and occurrence
Soils of the Haslam tnap unit occur in areas with shallow soils over sedimentary bedrock on elongated parallel ridges, knolls, and bench-like landscape positions having a wide variety of slopes ranging in steepness from 6 to 45%. The different types of bedrock (sandstone, shale, and siltstone) occur either sequentially or intermixed. The bedrock inclusions outcrop on the ridge and knoll crests.
Distribution and extent
The Haslam map unit is a minor one. It has been mapped as seven small- to medium-sized delineations on Goudge and Coal islands only. Although several soi1 phases were recognized for the Haslam soi1 complex, no soi1 phases were mapped for the Haslatn map unit. The Haslam map unit represents an area of 39.3 ha (1.5% of total map area).
MEXICANA SOILS AND MAP UNITS
Mexicana soils (ME)
Mexicana soils are to moderately well to imperfectly drained soils that have developed on gravelly loam to gravelly sandy loam textured morainal deposits over deep, compact, unweathered till within 100 cm from the surface. Coarse fragment content is generally between 20 and 50%. The unweathered till materials have generally less than 20% clay content (loam texture) and usually occur below 50 cm in depth. These materials are the only till recognized in the survey area. Mexicana soils may have a coarse-textured marine or fluvial capping from 0 to 30 cm thick with a coarse fragment content of between 20 and 50%. The profile description and analyses of a selected Mexicana profile are presented in Appendixes 1 and 2.
44

Soi1 characteristics
Characteristic No. of
Mean Minimum Maximum observations
Thickness of surface layer (cm) 44 15 Depth to bedrock (cm) 160 160 Depth to restricting layer (cm) 60 22 Depth to mottles (cm) 88 20 CF content surface layer (%) 27 7 Fine grave1 content surface layer (%) 20 5 Coarse grave1 content surface layer (%> 5 2 Cobble content surface layer (%) 2 0 CF content subsurface layer (%) 18 5 Fine grave1 content subsurface layer (%> 14 5 Coarse grave1 content subsurface layer (%) 2 0 Cobble content subsurface layer (%) 2 0
80 160
80 160
4'0" 10 5
45 35
5 7
6 6 6 6 6 6 6 6 4 4 4 4
Frequency of occurrence (%) No. of
observations
Texture of surface layer L(66), SL(17), FSL(17) 6 Texture of subsurface layer (till) L(751, FSL(25) 4 Drainage class Imperfect(50), moderately we11(33),
poor(l7) 6 Soi1 classification GL.DYB(50), O.DYB(17), O.SB(17), O.HG(16) 6
Type of restricting layer Compact till Perviousness Slow
Water regime
The Mexicana soils are generally moderately well to imperfectly drained soils with faint mottling throughout the solum, commonly increasing to distinct mottles below 50 cm from the surface. They are wet during the winter months but are dry and droughty during the summer. Perched water table conditions often occur on top of the compact till and seepage water is common. Water moves laterally over the compact till during the winter or after heavy rainfall. The till, when dry, is impervious to water and root growth. During the wetter part of the year, the top 10-15 cm of the unweathered till becomes somewhat pervious. The imperfectly drained Mexicana soils are mapped as an imperfectly drained phase (MEid).
45
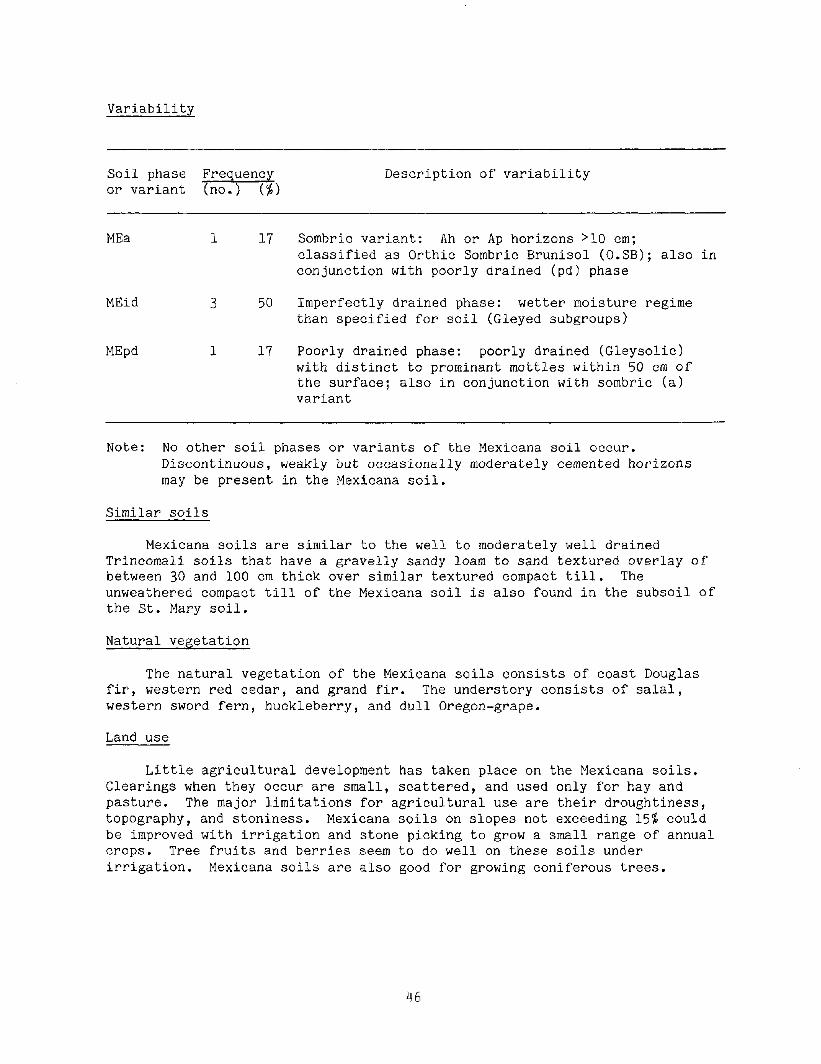
Variability
Soi1 phase Frequency or variant (no.) (%>
Description of variability
MEa 1 17 Sombric variant: Ah or Ap horizons >lO cm; classified as Orthic Sombric Brunisol (O.SB); also in conjunction with poorly drained (pd) phase
MEid
MEpd
3 50 Imperfectly drained phase: wetter moisture regime than specified for soi1 (Gleyed subgroups)
1 17 Poorly drained phase: poorly drained (Gleysolic) with distinct to prominant mottles within 50 cm of the surface; also in conjunction with sombric (a> variant
Note: No other soi1 phases or variants of the Mexicana soi1 occur. Discontinuous, weakly but occasionally moderately cemented horizons may be present in the Mexicana soil.
Similar soils
Mexicana soils are similar to the well to moderately well drained Trincomali soils that have a gravelly sandy loam to sand textured overlay of between 30 and 100 cm thick over similar textured compact till. The unweathered compact till of the Mexicana soi1 is also found in the subsoil of the St. Mary soil.
Natural vegetation
The natural vegetation of the Mexicana soils consists of toast Douglas fir, western red cedar, and grand fir. The understory consists of salai, western sword fern, huckleberry, and du11 Oregon-grape.
Land use
Little agricultural development has taken place on the Mexicana soils. Clearings when they occur are small, scattered, and used only for hay and pasture. The major limitations for agricultural use are their droughtiness, Www@v, and stoniness. Mexicana soils on slopes not exceeding 15% could be improved with irrigation and stone picking to grow a small range of annual crops. Tree fruits and berries seem to do well on these soils under irrigation. Mexicana soils are also good for growing coniferous trees.
46

Map units
Mexicana soils are the dominant soils in the Mexicana (ME) map unit. In addition, Mexicana soils occur as a minor soi1 or unmentioned inclusion in some delineations of the Galiano (GA), Rock-Saturna (RO-ST), Saturna (ST), and Trincomali (TR) map uni&.
Mexicana map unit (ME)
The Mexicana map unit consists dominantly (76%; 7040%) of the moderately well to imperfectly drained Mexicana soils. The map unit includes on average 23% (10-301) of other soi&, of which the Trincomali (TR) soi1 is the most widely occurring minor soil. Unmentioned inclusions of other soils do occur. The higher coarse fragment content of the Trincomali soi1 may adversly influence some use interpretations for this map unit.
Landform and occurrence
Soils of the Mexicana map unit occur on very gently to moderately sloping (2-15s) subdued topography. They usually occur on side-slope positions in depressions and hollows where till deposits have been protected from erosional processes since last glaciation. Marine or fluvial cappings on top of the till (Trincomali soils) occur scattered in some delineations.
Distribution and extent
The Mexicana map unit occurs only as a minor map unit on Goudge, Moresby, James, and Sidney islands with five small delineations. The only delineation on Sidney Island was mapped as MEid. Although two more soi1 phases were recognized for the Mexicana soils, no other soi1 phases were mapped for the Mexicana map unit. The Mexicana map unit represents an area of 6.2 ha (0.2% of total map area).
MUSGRAVE SOILS AND MAP UNITS
Musgrave soils (MG)
Musgrave soils are well-drained soils that have developed on shallow deposits of gravelly sandy loam to silt loam textured colluvial and glacial drift materials over dominantly metamorphosed sedimentary bedrock within 100 cm of the surface. Coarse fragment content is between 20 and 50%. The profile description and analyses of a selected Musgrave soi1 are given in Appendixes 1 and 2.
47

Soi1 characteristics
Characteristic No. of
Mean Minimum Maximum observations
Thickness of surface layer (cm) 74 55 100 Depth to bedrock (cm) 63 55 70 Depth to restricting layer (cm) 63 55 70 Depth to mottles (cm) 160 160 160 CF content surface layer (%) 30 30 30 Fine grave1 content surface layer (%) 10 10 10 Coarse grave1 content surface layer (%) 15 15 15 Cobble content surface layer (%) 5 5 5 CF content subsurface layer (%) 25 25 25 Fine grave1 content subsurface layer (%) 20 20 20 Coarse grave1 content subsurface layer (%) 5 5 5 Cobble content subsurface layer (%> 0 0 0
Frequency of occurrence (%)
4 3 3 4 1 1 1 1 1 1 1 1
No. of observations
Texture of surface layer SL(50), FSL(25), SIL(25) 4 Texture of subsurface layer L(100) 1 Drainage class We11(75), moderately well(25) 4 Soi1 classification O.DYB(75), O.HFP(25) 4
Type of restricting layer Bedrock Perviousness Rapid to moderate
Water regime
Musgrave soils are well drained without evidence of mottling within 100 cm of the surface. They are moist throughout the winter months but quickly become droughty in dry periods during the summer. During and shortly after wet periods, water may flow laterally through the saturated subsoil on top of sloping bedrock.
48

Variability
Soi1 phase Frequency or variant (no.) (%)
Description of variability
MG1 2 50 Shallow lithic phase: depth to bedrock between 50 and 100 cm; mean depth 68 cm (65-70 cm); also in conjunction with very gravelly (vg) phase and taxonomy change (t) variant
MGvg 2 50 Very gravelly phase: coarse fragment content in surface layer >50%; mean CF 65% (50-75%); only in conjunction with shallow lithic (1) and paralithic (pl) phases
Note: Other phases of the Musgrave soi1 with very limited occurrence are paralithic (pl) phase and taxonomy change (t) variant, from Orthic Dystric Brunisol (O.DYB) into Orthic Humo-Ferric Podzol (O.HFP).
Similar soils
The Musgrave soils resemble other well-drained, shallow upland soils that have developed on similar-textured colluvium and glacial drift materials but overlie coarse-grained metamorphosed igneous bedrock (Rumsley). The main difference is in the rock type, but the morphology and soi1 characteristics are much the same.
Natural vegetation
The natural vegetation consists of toast Douglas fir, scattered Pacifie madrone, some grand fir, and western hemlock with an understory of short salal, western bracken, du11 Oregon-grape, and grasses.
Land use
The Musgrave soils are best left in their original vegetation. The soils are often too shallow, too steep, too stony, and too droughty for agricultural development. Occasionally, wild sheep and fallow deer are roaming free in areas where the vegetation consists dominantly of grasses.
Map units
Musgrave soils are the dominant soils in the Musgrave (MG) simple map unit. They also occur as subdominant soils in the Rock-Musgrave (RO-MG) map unit, which is described under Rock (RO). In addition, the Musgrave soi1 occurs as an unmentioned inclusion in one delineation of the Brigantine (BE) map unit.
49

Musgrave map unit (MG)
The Musgrave map unit consists dominantly (72%; 55-90%) of the well-drained Musgrave soils. The map unit includes on average 28% (10-458) of other soils, of which metamorphosed sedimentary bedrock exposures (Rock), Qualicum soils, or both, occur in almost a11 the delineations of the map unit. The bedrock exposures limit the use interpretations of this map unit.
Landform and occurrence
Soils of the Musgrave map unit occur in areas with shallow soils over metamorphosed sedimentary bedrock. The soi1 landscape is undulating, hummocky, and ridged with gently to strongly sloping (6-30%) topography and, in some places, steeper slopes (31-45%). Bedrock exposures occur scattered.
Distribution and extent
The Musgrave map unit has 15 small- to medium-sized delineations, of which 9 were mapped on Moresby Island and 6 on Portland Island. Four delineations had bedrock within 50 cm from the surface (MGsl), whereas the remaining 11 delineations had no soi1 phases. The Musgrave map unit represents an area of 103.9 ha (3.9% of total map area).
PARKSVILLE SOILS AND MAP UNITS
Parksville soils (PA)
Parksville soils are poorly drained soils that have between 30 and 100 cm of a sandy loam to sand overlay of marine or fluvial origin over deep (>lOO cm), silty clay loam, clay loam, and silty clay textured marine deposits that are usually stonefree. Coarse fragment content of overlay materials is (20%. The profile description and analyses of a selected Parksville soi1 are given in Appendixes 1 and 2.
50

Soi1 characteristics
Characteristic No. of
Mean Minimum Maximum observations
Thickness of surface layer (cm) 30 10 Thickness of 2nd layer (cm) 40 5 Depth to bedrock (cm) 160 160 Depth to restricting layer (cm) 68 30 Depth to mottles (cm) 26 19 Depth to PSD (cm) 48 15 CF content surface layer (%) 6 0 Fine grave1 content surface layer (%) 5 0 Coarse grave1 content surface layer (%) 1 0 Cobble content surface layer (%) 0 0 CF content 2nd layer (%) 7 0 Fine grave1 content 2nd layer (%) 5 0 Coarse grave1 content 2nd layer (%) 2 0 Cobble content 2nd layer (%) 1 0 CF content 3rd layer (%) 1 0 Fine grave1 content 3rd layer (%) 1 0 Coarse grave1 content 3rd layer (8) 0 0 Cobble content 3rd layer (%) 0 0
95 95
160 100
35 95 17 15
5 0
20 20 10 10 20 20
0 0
27 27 27 21 21 21 23 23 23 23 26 26 26 26 23 23 23 23
Frequency of occurrence (%) No. of
observations
Texture of surface layer L(U), SL(37), SIL(7), FSL(4), FLS(4) 27 Texture of 2nd layer SL(26), LS(26), FSL(lS), S(U),
SiCL(ll), CL(7), L(4) 27 Texture of 3rd layer SICL(Gl), CL(13), SL(9), Sic(g),
SCL(4), FSL(4) 23 Texture of 4th layer (occurs when layer 3 is SL) SICL(50), SCL(25), L(25) 4 Drainage class Poor(lOO) 27 Soi1 classification O.HG(96), O.G(4) 27
Type of restricting layer Fine-textured subsoil, commonly massive structured
Perviousness Slow
Water regime
Parksville soils are poorly drained and have distinct to prominent mottles within 50 cm of the surface. They are saturated with water to within 30 cm of the surface from late fa11 to spring. During summer, the water table drops to below 60 cm, allowing the surface horizons to become dry. Perched water tables occur on top of the fine-textured, massive-structured subsoil. As a result of their low landscape position, Parksville soils receive seepage and runoff water from surrounding areas, which keeps the subsoil in a moist condition during dry periods.
51

Variability
Soi.1 phase Frequency or variant (no.) (Il
Description of variability
PAd 5 19 Deep phase: depth to finer-textured subsoil between 100 and 150 cm; mean depth 121 cm (110-145 cm); also in conjunction with loam (lo), gravelly (g), and silt loam (si) phases
PU 4 15 Gravelly phase: coarse fragment content in surface layer between 20 and 50%; mean CF 24% (20-30%); also in conjunction with deep (d), loam (lo), and silt loam (si) phases
PAlo 12 44 Loam phase: surface textured is loam; mean thickness 23 cm (12-35 cm); also in conjunction with deep (d) and gravelly (g) phases
PAsi 3 11 Silt loam phase: surface texture is silt loam; mean thickness 22 cm (15-30 cm); also in conjunction with deep (d) and gravelly (g) phases
Note : Another variant of the Parksville soi1 with very limited occurrence is a change in taxonomy (t), from Orthic Humic Gleysol (O.HG) into Orthic Gleysol (0.G).
Similar soils
The imperfectly drained member of the Parksville soils is similar to Brigantine soils. Parksville soils differ from the poorly drained Tolmie soils in having coarse-textured overlay materials thicker than 30 cm. Also Tolmie soils are usually saturated with water for a longer period during the year. Where the Parksville soils have a loam or silt loam texture (PAlo, PAsi), a layer of coarse-textured materials thicker than 30 cm overlies the finer-textured materials.
Natural vegetation
The natural vegetation on Parksville soils consists of western red cedar, red aider, hardhack, and some willow. The understory consists of western sword fern, common horsetail, and American vanilla leaf. American skunk cabbage commonly occurs in the wettest portions that have an organic surface layer (Oh).
Land use
Many Parksville soils in the survey area have been cleared for agriculture , primarily for pasture and hay production. The major limitation for growing a wider range of crops is the wetness in the late spring caused by
52

high water tables, which could be overcome using artificial drainage. The Upper, coarse-textured horizons have a moderately low moisture-holding capacity and would benefit from irrigation during the summer months. The soils are strongly acid (pH 5.1-5.5) at the surface and moderately acid (pH 5.6-6.0) in the subsurface.
Map units
Two map units occur in the survey area in which Parksville soils are dominant. They are the simple map unit Parksville (PA) and the compound map unit Parksville-Tolmie (PA-TL). In addition, Parksville soils also occur as a minor soi1 or unmentioned inclusion in some delineations of the Baynes (BY), Brigantine (BE), Brigantine-Tolmie (BE-TL), and Tolmie (TL) map units.
Parksville map unit
The Parksville map unit consists dominantly (86%; 70-100%) of poorly drained Parksville soils. The Parksville map unit includes on average 14% (up to 30%) of other soils, of which the poorly drained Tolmie (TL) soi1 is the most widely occurring minor soil. Unmentioned inclusions of other soils occur sporadically. The minor soi1 and inclusions do not limit the use interpretations for the map unit.
Landform and occurrence
Soils of the Parksville map unit occur on nearly level to very gently sloping (0.5-51) topography in depressional areas, swales, and drainageways. Parksville soils usually occur around the periphery of marine basins where sandy materials have been deposited on top of fine-textured marine materials, or as fluvial deposits in drainageways. Tolmie soils occur as unmappable inclusions in the Parksville map unit in similar landscape positions. These soils are also found in depressions between bedrock ridges. Elevation is usually between 0 and 100 m above mean sea level.
Distribution and extent
The Parksville map unit has been mapped on Sidney, Moresby, and Piers islands as six small- to medium-sized, sometimes narrow delineations. From the two delineations on Moresby Island, one was mapped as a deep phase (PAd) and the other one with a loam textured surface horizon (PAlo). One delineation on Sidney Island was mapped as PAsi. This map unit represents an area of 55.3 ha (2.1% of total map area).
Parksville-Tolmie map unit (PA-TL)
The Parksville-Tolmie map unit consists dominantly (52%; 45-60%) of the poorly drained Parksville soils with a subdominant proportion (48%; 40-55%) of poorly drained Tolmie soils developed on deep (>lOO cm) loam to silty clay textured, usually stonefree, marine deposits. In one place, the Tolmie soi1 is dominant whereas the Parksville soi1 is the subdominant one. No minor soils or unmentioned inclusions were identified for the map unit. Tolmie soils do not adversely affect the use interpretations for the PA-TL map unit.
53

Landform and occurrence
Soils of the Parksville-Tolmie (PA-TL) map unit occur on nearly level to gently sloping (0.5-g%) topography in depressions, swales, and drainageways at elevations between 0 and 100 m above mean sea level. The subdominant Tolmie soils commonly occupy the lowest landscape positions. However, although they caver significant portions of the map unit, they occur scattered in such a way that they cannot be mapped separately.
Distribution and extent
The Parksville-Tolmie map unit occurs as three small and narrow delineations on Moresby, Sidney, and Forest islands. This map unit represents an area of 11.6 ha (0.4% of total map area).
QUALICUM SOILS AND MAP UNITS
Qualicum soils (QU)
Qualicum soils are rapidly to well drained soils developed on deep (>150 cm) deposits of gravelly and cobbly sandy loam to gravelly sand textured glaciofluvial, fluvial, or marine deposits. Coarse fragment content throughout the profile is between 10 and 50%. The profile description and analyses of a selected Qualicum soi1 are given in Appendixes 1 and 2.
Soi1 characteristics
Characteristic No. of
Mean Minimum Maximum observations
Thickness of surface layer (cm> 70 12 Depth to bedrock (cm) 160 160 Depth to restricting layer (cm) 160 160 Depth to mottles (cm) 155 105 CF content surface layer ($1 39 10 Fine grave1 content surface layer (%> 27 10 Coarse grave1 content surface layer (o&> 0 Cobble content surface layer (%> 4 0 CF content subsurface layer (%> 45 15 Fine grave1 content subsurface layer (%) 29 10 Coarse grave1 content subsurface layer ($1 11 0 Cobble content subsurface layer ($) 6 0
150 160 160 160
4’5 15 7
;5 40 15
18 18 18 18 10 10 10 10
7 7 7 7
54

Texture of surface layer LS(39), S(331, SL(28) 18 Texture of subsurface layer S(70), LS(20), SL(10) 10 Drainage class Rapid(56), well(391, moderately well(5) 18 Soi1 classification O.DYB(67), O.SB(33) 18
Type of restricting layer Perviousness
Absent Rapid
Frequency of occurrence (%> No. of
observations
QUs
Water regime
Qualicum soils are rapidly to well drained. They are moist from the late fa11 until spring but quickly become very droughty during the summer. The water table remains well below 100 cm throughout the year.
Variability
Soi1 phase Frequency or variant (no.> (%>
Description of variability
Qua 6 33 Sombric variant: Ah or Ap horizon >lO cm; classification is Orthic Sombric Brunisol (O.SB); also in conjunction with shallow (s) and very gravelly (vg) phases
5 28 Shallow phase: less deep (50-100 cm) than specified over similar materials but with coarse fragment content ~20%; mean depth 81 cm (60-95 cm); mean total CF 24% (15-35%); mean fine grave& 20% (lO-30%); mean coarse gravels and cobbles 4% (2-5%); also in conjunction with sombric (a) variant and very gravelly (vg) phase
QUvg 8 44 Very gravelly phase: coarse fragment content in surface layer >50%; mean CF 57% (50-70%); also in conjunction with sombric (a) variant and shallow (s) phase
Note: Another phase of the Qualicum soi1 with very limited occurrence is bedrock between 100 and 150 cm (deep phase, d).
Similar soils
Qualicum soils commonly occur together with soils of similar drainage and texture but which have a much lower (<20%) coarse fragment content (Beddis soils). Qualicum soils also occur with similar textured but moderately
55

well drained and shallow ((100 cm) soils over compact, unweathered till (Trincomali soils). Qualicum soils are better drained and have a much greater coarse fragment content than the Baynes and Denman Island soils.
Natural vegetation
The natural vegetation on the Qualicum soils is toast Douglas fir and grand fir, with some shore pine and scattered Pacifie madrone. Shore pine is the dominant species after fires have occurred. The groundcover consists mainly of short sala1 and western bracken.
Land use
No known areas of Qualicum soils in the survey area are used for agriculture. The major limitations that preclude agricultural development on these soils are the topography, droughtiness, and stoniness. Also, it is an infertile soil, low in nutrients and organic matter. However, with irrigation these soils could grow productive fruit trees. Qualicum soils are most extensively used as sources of Sand and grave1 for road building and construction purposes (for example, concrete). Al1 abandoned and currently active grave1 pits occur in areas with Qualicum soils. The location of these grave1 pits are indicated as@on the soi1 map. The present use is restricted to its natural vegetation.
Map units
Qualicum soils occur as the dominant soi1 in the Qualicum (QU) map unit. In addition, Qualicum soils occur as a minor soi1 or unmentioned inclusion in some delineations of the Beddis (BD), Brigantine (BE), Haslam (HA), Mexicana (ME), Musgrave (MG), Rock (RO), Rock-Musgrave (RO-MG), Rock-Rumsley (RO-RY), Rock-Saturna (RO-ST), Rumsley (RY), Saturna (ST), and Trincomali (TR) map units.
Qualicum map unit (QU)
The Qualicum map unit consists dominantly (75%; 60-902) of the rapidly to well-drained Qualicum soils. The Qualicum map unit includes on average 25% (lO-40%) of other soils. One or two of the following minor soils occur in most delineations of the Qualicum map unit: Trincomali (TRI, Rumsley (RY), Saturna (ST), or Beddis (BD). Unmentioned inclusions of other soils do occur in very few places. Except for Beddis, the minor soils and unmentioned inclusions are limiting most use interpretations for the map unit.
Landform and occurrence
Soils of the Qualicum map unit occur as deep outwash (deltaic) and terraces associated with old drainageways and as beach deposits on very gently to moderately (2-15%) sloping landscape positions. The inclusions of other soils occur scattered in areas where bedrock or till are within 1 m of the surface.
56
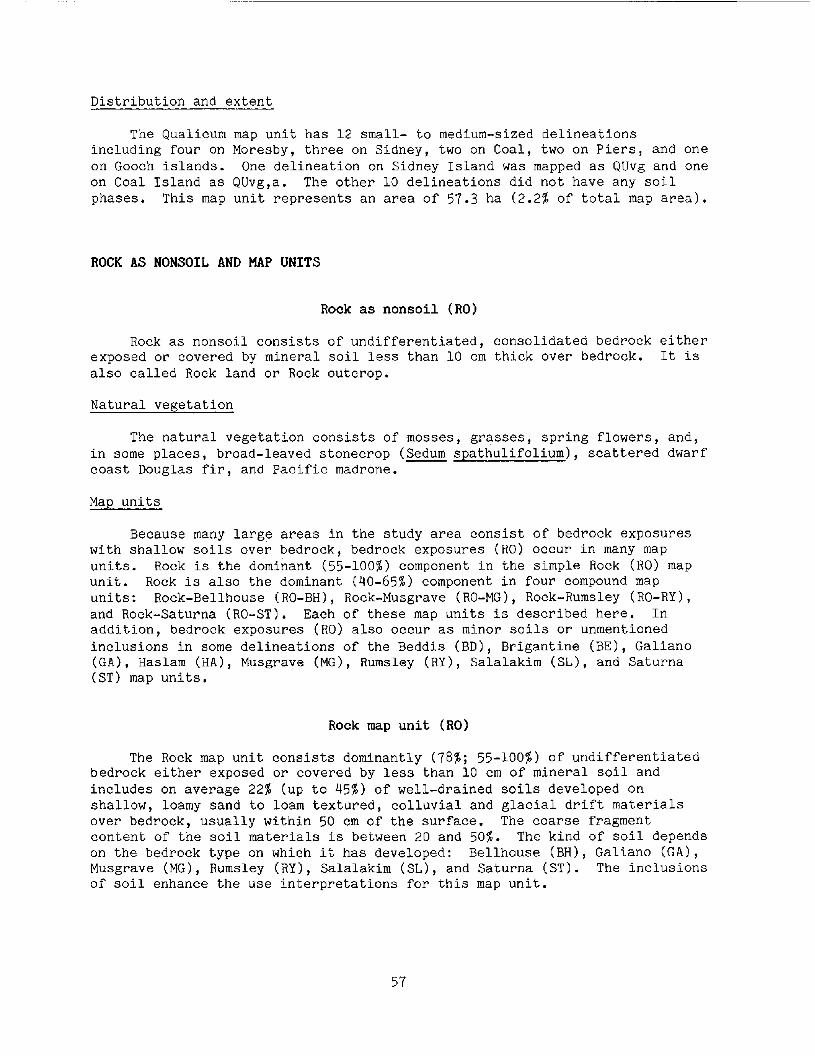
Distribution and extent
The Qualicum map unit has 12 small- to medium-sized delineations including four on Moresby, three on Sidney, two on Coal, two on Piers, and one on Gooch islands. One delineation on Sidney Island was mapped as QUvg and one on Coal Island as QUvg,a. The other 10 delineations did not have any soi.1 phases. This map unit represents an area of 57.3 ha (2.2% of total map area).
ROCK AS NONSOIL AND MAP UNITS
Rock as nonsoil (ROI
Rock as nonsoil consists of undifferentiated, consolidated bedrock either exposed or covered by minera1 soi1 less than 10 cm thick over bedrock. It is also called Rock land or Rock outcrop.
Natural vegetation
The natural vegetation consists of mosses, grasses, spring flowers, and, in some places, broad-leaved stonecrop (Sedum spathulifolium), scattered dwarf toast Douglas fir, and Pacifie madrone.
Map units
Because many large areas in the study area consist of bedrock exposures with shallow soils over bedrock, bedrock exposures (RO) occur in many map units. Rock is the dominant (55-1001) component in the simple Rock (ROI map unit. Rock is also the dominant (40-65%) component in four compound map units: Rock-Bellhouse (RO-BH), Rock-Musgrave (RO-MG), Rock-Rumsley (RO-RY), and Rock-Saturna (RO-ST). Each of these map units is described here. In addition, bedrock exposures (RO) also occur as minor soils or unmentioned inclusions in some delineations of the Beddis (BD), Brigantine (BE), Galiano (GA), Haslam (HA), Musgrave (MG), Rumsley (RY), Salalakim (SL), and Saturna (ST) map units.
Rock map unit (RO)
The Rock map unit consists dominantly (78%; 55-1008) of undifferentiated bedrock either exposed or covered by less than 10 cm of minera1 soi1 and includes on average 22% (up to 45%) of well-drained soils developed on shallow, loamy sand to loam textured, colluvial and glacial drift materials over bedrock, usually within 50 cm of the surface. The coarse fragment content of the soi1 materials is between 20 and 50%. The kind of soi1 depends on the bedrock type on which it has developed: Bellhouse (BH), Galiano (GA), Musgrave (MG), Rumsley (RY), Salalakim (SL), and Saturna (ST). The inclusions of soi1 enhance the use interpretations for this map unit.
57

Landform and occurrence
The landscape represented by this map unit varies considerably in steepness and in surface expression. It includes areas with smooth, unweathered, sedimentary bedrock with very gentle to moderate slopes (2-15%) and strong to very strong slopes (16-45%), and rocky ridges and knolls (slopes lO-70%) of a11 rock types found on the islands. Minor areas of soi1 occur in places where the bedrock has been fractured and weathered, commonly indicated by clumps of tree growth. Rock occurs at a11 elevations and aspects.
Distribution and extent
Rock is a major map unit in the survey area. It occurs as 63 very small to medium sized delineations throughout the islands. This map unit includes many small islets. The Rock map unit represents an area of 231.4 ha (8.8% of total map area).
Rock-Bellhouse map unit (RO-BH)
The Rock-Bellhouse map unit consists dominantly (60%) of sandstone bedrock either exposed or covered by less than 10 cm of minera1 soil. This map unit also contains subdominant proportions (40%) of well-drained soils developed on very shallow (10-50 cm), channery, sandy loam textured, colluvial and glacial drift materials over sandstone bedrock. These soils have an Ah horizon >lO cm (very shallow lithic Bellhouse soil, BHsl). No unmentioned inclusions of other soils were identified for the map unit. Bellhouse soils enhance the use interpretations for this map unit.
Landform and occurrence
Materials of the Rock-Bellhouse map unit occur on south-facing rock ridges in hummocky terrain with gentle to strong slopes ranging from 6 to 30%. The Bellhouse soils occur on the colluvial side slopes and randomly in areas where the bedrock has been fractured and weathered.
Distribution and extent
This Rock-Bellhouse map unit is a very minor one and occurs as three small- to medium-sized delineations on Portland Island. Al1 delineations were mapped as RO-BHsl. This map unit represents 6.6 ha (0.2% of total map area).
Rock-Musgrave map unit (RO-MG)
This map unit consists dominantly (53%, 45-608) of metamorphosed sedimentary bedrock either exposed or covered by less than 10 cm of minera1 soil. A subdominant portion (40%; 35-55%) of well-drained soils has developed on gravelly sandy loam to silt loam textured, colluvial and glacial drift materials over metamorphosed sedimentary bedrock within 100 cm of the surface (Musgrave soil). The map unit includes Qualicum (QV) as a minor soi1 in about half the delineations. Unmentioned inclusions of other soils may occur in a few places. Musgrave soils and soi1 inclusions enhance the use interpretations for this map unit.
58

Landform and occurrence
Materials of this map unit occur on rocky ridges and in hummocky terrain,with slopes ranging from 6 to 45%. The Musgrave soi1 occurs on the colluvial side slopes and in areas where the bedrock is fractured and weathered. Isolated pockets of other soi1 inclusions occur scattered in some delineations.
Distribution and extent
The Rock-Musgrave map unit is not extensive. It occurs as 15 variable-sized delineations. Ten delineations, including a very large one, were mapped on Moresby Island and five on Portland Island. Four of the delineations on Portland Island and one on Moresby Island were mapped as RO-MGsl. No other soi1 phases were mapped for this map unit. The Rock-Musgrave map unit represents an area of 172.3 ha (6.6% of total map area).
Rock-Rumsley map unit (RO-RY)
This map unit consists dominantly (57%; 40-65%) of metamorphosed intrusive bedrock either exposed or covered by less than 10 cm of minera1 soil. The map unit also contains subdominant proportions (41%; 35-50%) Of
well-drained soils developed on gravelly sandy loam to loamy sand textured,colluvial and glacial drift materials over metamorphosed intrusive bedrock within 100 cm of the surface (Rumsley soil). The map unit includes Qualicum (QV) as a minor soi1 in some delineations. Unmentioned inclusions other soils occur in very few places. Rumsley soils and soi1 inclusions enhance the use interpretations for this map unit.
of
Landform and occurrence
Materials of the Rock-Rumsley map unit occur on rock ridges and in hummocky terrain with slopes ranging from 2-3O%, and occasionally steeper. Rumsley soils occupy the colluvial side slopes and occur in areas where bedrock has been fractured and weathered. The inclusions of other soils occur scattered in pockets in some delineations.
Distribution and extent
This map unit occurs as 16 small- to medium-sized delineations, of which 8 were mapped on Sidney Island, 4 on the Little Group Islands, 3 on Moresby Island, and 1 on D'Arcy Island. Al1 four RO-RYa delineations were mapped on the Little Group Islands (Little Shell, Ker, and Dock islands). No other soi1 phases were mapped. This map unit represents an area of 106.7 ha (4.1% of total map area).
59

Rock-Saturna mp unit (RO-ST)
This map unit consists dominantly (52%; 45-60%) of sandstone bedrock either exposed or covered by less than 10 cm of minera1 soil. This map unit also contains subdominant proportions (43%; 40-55%) of well-drained soils developed on shallow (10-50 cm), channery, sandy loam to fine sandy loam textured, colluvial and glacial drift materials over sandstone bedrock (Saturna soil). Soils have between 20 and 50% coarse fragments. Unmentioned inclusions of other soils may occur. Saturna and other soils enhance the use interpretations for this map unit.
Landform and occurrence
Materials of the Rock-Saturna map unit occur dominantly on rock ridges, knolls, and in areas with smooth, unweathered sandstone (slopes 6-45$), or in some places, on steeper landscape positions with slopes between 46 and 70%. Saturna soils occur on colluvial side slopes and in areas where bedrock has been fractured and weathered, commonly as pockets on top of or in between the ridges or knolls. Inclusions of other soils occur scattered on side slopes or in pockets.
Distribution and extent
Rock-Saturna has been mapped as 19 small- to medium-sized delineations throughout the survey area. Just over half of the delineations were mapped as RO-STsl. No other soi1 phases were mapped. This map unit represents an area of 45.3 ha, (1.7% of total map area).
RUMSLEY SOILS AND MAP UNITS
Rumsley soils (RY)
Rumsley soils are well-drained soils that have developed on shallow deposits of gravelly sandy loam to gravelly loamy sand textured, colluvial and glacial drift materials over coarse-grained, metamorphosed, intrusive bedrock within 100 cm of the surface. Coarse fragment content is between'20 and 50%. The profile description and analyses of a selected Rumsley soi1 are given in Appendixes 1 and 2.
60

Soi1 characteristics
Characteristic No. of
Mean Minimum Maximum observations
Thickness of surface layer (cm) Depth to bedrock (cm) Depth to restricting layer (cm) Depth to mottles (cm) CF content surface layer ($1 Fine grave1 content surface layer (%> Coarse grave1 content surface layer (%) Cobble content surface layer (%> CF content subsurface layer ($1 Fine grave1 content subsurface layer ($) Coarse grave1 content subsurface layer (%> Cobble content subsurface layer (%)
observations
61 40 85 7 64 40 85 5 64 40 85 5
160 160 160 40 35 45 ; 22 10 30 3 10 5 15 8 0 20 3
45 45 45 1 35 35 35 1 10 10 10 1 0 0 0 1
No. of Frequency of occurrence (%>
Texture of surface layer SL(71), SIL (29) 7 Texture of subsurface layer LS(100) 2 Drainage class Well(100) 7 Soi1 classification O.DYB(86), O.SB(14) 7
Type of restricting layer Bedrock Perviousness Rapid to moderate
Water regime
The Rumsley soils are well drained with no evidence of mottling within 100 cm from the surface. The soi1 is moist throughout the winter months but quickly becomes droughty in dry periods during summer. During and shortly after wet periods, water may flow laterally through the saturated subsoil on top of sloping bedrock.
61

Variability
Soi1 phase Frequency or variant (no.> (%>
Description of variability
RYl 3 43 Shallow lithic phase: depth to bedrock between 50 and 100 cm; mean depth 78 cm (75-85 cm); also in conjunction with very gravelly (vg) phase
RYsl 2 28 Very shallow lithic phase: depth to bedrock between 10 and 50 cm; mean depth 43 cm (40-45 cm); also in conjunction with sombric (a) variant and very gravelly (vg) phase
RYvg 4 57 Very gravelly phase: coarse fragment content in surface layer >5O%; mean CF 56% (50-60%); also in conjunction with deep (d), shallow lithic (11, and very shallow lithic (~1) phases
Note: Other variants and phases of the Qualicum soi1 with very limited occurrence are the sombric (a) variant and deep (d) phase with bedrock 100 and 150 cm.
Similar soils
The Rumsley soi1 is similar to the Musgrave soil; the main difference is the rock type, but the morphology and soi1 characteristics are alike.
Natural vegetation
The natural vegetation consists of toast Douglas fir, scattered Pacifie madrone, and some grand fir, with an understory of salal, western bracken, and du11 Oregon-grape.
Land use
No known areas with Rumsley soi1 are used for agricultural purposes. Steep slopes, stoniness, rockiness, and droughtiness preclude agricultural uses. In a few places, wild sheep and fallow deer roam free where the vegetation consists dominantly of grasses. These soils are best used for growing coniferous trees.
Map units
Rumsley soils occur in several map units. It is the dominant soi1 in the Rumsley (RY) simple map unit and a subdominant soi1 in the Rock-Rumsley (RO-RY) map unit, which was described earlier. In addition, Rumsley soils may occur as a minor soi1 or unmentioned inclusion in some delineations of the Brigantine (BE), Mexicana (ME), Qualicum (QV), Tolmie (TL), and Trincomali (TR) map units.
62

Rumsley map unit (RY)
The Rumsley map unit consists dominantly (72% 50-858) of the well-drained Rumsley soils with an average 21% (10-25s) of metamorphosed intrusve bedrock exposed (Rock). Besides bedrock exposures, Qualicum soils occur in 30% of the Rumsley delineations. Bedrock exposures are the limiting factor for the use interpretations for the RY map unit.
Landform and occurrence
Soils of the Rumsley map unit occur in areas with shallow soils over metamorphic bedrock on very gently to strongly sloping (2-308) topography in undulating, hummocky, and ridged landscape positions. Bedrock exposures occur scattered in most delineations. This map unit occurs at a11 elevations.
Distribution and extent
The Rumsley map unit consists of 13 small- to medium-sized delineations, of which 6 occur on D'Arcy and Little D'Arcy islands, 4 on Moresby Island, 2 on Sidney Island, and 1 on Kerr Island. Both delineations having bedrock within 50 cm from the surface (RYsl) occur on Moresby Island, and the one area mapped as RYvg occurs on D'Arcy Island. The remaining 10 delineations have no soi1 phases. This map unit represents an area of 85.3 ha (3.2% of total map area).
SALALAKIM SOILS AND MAP UNITS
Salalakim soils (SL)
Salalakim soils are well drained , gravelly sandy loam textured soils that have developed on shallow colluvial and glacial drift materials of weathered conglomerate over conglomerate bedrock. Depth to bedrock varies between 10 and 100 cm. Coarse fragment content is between 20 and 50%. The profile description and analyses of a selected Salalakim soi1 are given in Appendixes 1 and 2.
Soi1 characteristics
Characteristic No. of
Mean Minimum Maximum observations
Thickness of surface layer (cm) 49 28 70 2 Depth to bedrock (cm) 49 28 70 2 Depth to restricting layer (cm) 49 28 70 2 Depth to mottles (cm) 160 160 160 2 CF content surface layer (%) 25 25 25 1 Fine grave1 content surface layer (k) 25 25 25 1 Coarse grave1 content surface layer (%) 0 0 0 1 Cobble content surface layer (8) 0 0 0 1
63

Frequency of occurence (%) No. of
observations
Texture of surface layer SL(100) 2 Texture of subsurface layer - 0 Drainage class Well(100) 2 Soi1 classification O.DYB(lOO) 2
Type of restricting layer Conglomerate bedrock Perviousness Rapid
Water regime
Salalakim soils are well drained. They remain moist throughout the winter months but are droughty from late spring to late fall. During or shortly after wet periods water may move laterally through the subsoil on top of the sloping bedrock.
Variability
Soi1 phase Frequency or variant (no.) (Il
Description of variability
SLl 1 50 Shallow lithic phase: depth to bedrock between 50 and 100 cm; mean depth 70 cm (70-70 cm)
SLsl 1 50 Very shallow lithic phase: depth to bedrock between 10 and 50 cm; mean depth 28 cm (28-28 cm); also in conjunction with the very gravelly (vg) phase
SLvg 1 50 Very gravelly phase: coarse fragment content in surface layer >50%; mean CF 65% (65-651); in conjunction with the very shallow lithic (~1) phase
Note: No other soi1 variants and phases of the Salalakitn soi1 were encountered.
Similar soils
Salalakim soils are similar in drainage and texture to Qualicum soils, which are much deeper (>150 cm). Also, the coarse fragments (grave1 and cobbles) in the Salalakim soils are dominantly rounded (pebbles), whereas the coarse fragments in the Qualicum soils are rounded, subrounded, and in some places irregularly shaped.
Natural vegetation
The natural vegetation consists of toast Douglas fir, scattered Pacifie madrone, and some,grand fir. The understory consists of salal, common gorse, and grasses.
64

Land use
The use of the Salalakim soils in the survey area is restricted to theirnatural vegetation. The only potential agricultural use is for sheep-grazing in areas dominated by grass. Salalakim soils and conglomerate bedrock are occasionally used as sources of grave1 for road building and construction purposes.
Map units ---
Salalakim soils are dominant in the Salalakim (SL) simple map unit. In addition, Salalakim soils occur as a minor soi1 or unmentioned inclusion in some delineations of the Beddis (BD), Galiano (GA), and Rock (RO) map units.
Salalakim map unit (SL)
The Salalakim map unit consists dominantly (72%; 50-85s) of the well-drained Salalakim soil. The map unit includes on average 26% (lO-25%) bedrock exposures (Rock), which limits the use interpretations for this map unit. Nonlimiting inclusions of other minor soils also occur.
Landform and occurrence
The soi1 landscape consists of shallow soils over congolermate bedrock on gently to strongly sloping (6-309'0) topography in subdued to hummocky terrain. The Salalakim map unit has also been mapped on ridges and knolls. Salalakim soils occupy the colluvial side slopes, with bedrock exposures usually occurring on top of the ridges and knolls. The inclusions of other soils occur scattered in pockets.
Distribution and extent -- .- _^- __
The Salalakim map unit only occurs on Rubbly, Gooch, and Piers islands. St has been mapped as four long and narrow delineations. The only delineation with a soi1 phase (SLsl,vg) was mapped on Piers Island. This map unit represents 10.6 ha (0.4% of total map area).
SATURNA SOILS AND MAP UNITS
Saturna soils (ST)
Saturna soils are well-drained soils that have developed on shallow deposits of channery, sandy loam to fine sandy loam textured, colluvial and glacial drift materials over sandstone bedrock within 100 cm of the surface. Coarse fragment content varies between 20 and 50%. The profile description and analyses of a selected Saturna soi1 are given in Appendixes 1 and 2.
65

Soi1 characteristics
Characteristic No. of
Mean Minimum Maximum observations
Thickness of surface layer (cm> Depth to bedrock (cm). Depth to restricting layer (cm) Depth to mottles (cm) CF content surface layer (%) Fine grave1 (channery) content
51 20 85 51 20 85 51 20 85
160 160 160 34 27 45
surface layer ($1 25 Coarse grave1 (channery) content
surface layer ($1 8 Cobble content (flaggy) surface layer (%> 2
15 35 6
0 10 6 0 3 6
observations Frequency of occurrence (%>
No. of
Texture of surface layer SL(63), FSL(37) 8 Texture of subsurface layer - 0 Drainage class Well(100) 8 Soi1 classification O.DYB(lOO) 8
Type of restricting layer Sandstone bedrock Perviousness Rapid
Water regime
The Saturna soils are well drained. They are moist from late fa11 untilspring but are droughty during the summer months. During and shortly after wet periods, water flows laterally through the saturated subsoil on top of the sloping bedrock.
66

Variability
Soi1 phase Frequency or variant (no.1 (%>
Description of variability
ST1 3 38 Shallow lithic phase: depth to bedrock between 50 and 100 cm; mean depth 68 cm (55-85 cm); also in conjunction with paralithic (pl) phase
STpl 2 25 Paralithic phase: boundary of fracture sandstone rock between soi.1 and solid bedrock; mean depth to fractured rock 57 cm (48-65 cm); in conjunction with very shallow lithic (~1) and shallow lithic (1) phases
STsl 5 63 Very shallow lithic phase: depth to bedrock between 10 and 50 cm; mean depth 40 cm (20-48 cm); also in conjunction with paralithic (pl) and very gravelly (vg) phases
STvg 2 25 Very gravelly phase: coarse fragment content in surface layer >50%; mean CF 53% (50-55%); in conjunction with very shallow lithic (~1) phase
Note: No other soi1 variants and phases of the Saturna soi1 were encountered.
Similar soils
Saturna soils are similar to the Bellhouse soils, which have a thicker (>lO cm) Ah horizon. Saturna soils are found together with Galiano soils, both occurring on similar slopes and in similar landscape positions. When they cannot be separately mapped because of the intermixing of bedrock types, they have been identified as Haslam soi1 complex (HA).
Natural vegetation
The natural vegetation consists of toast Douglas fir, scattered Pacifie madrone, and some grand fir. The understory consists of salai, western bracken, and du11 Oregon-grape.
Land use
Generally, no agricultural development has taken place on Saturna soils. In areas where grass dominates the vegetation, they provide grazing for wild sheep and fallow deer. These soils are generally not suitable for the production of annual crops because of steep topography, stoniness, shallow soils over bedrock, droughtiness, low fertility, and the frequency of rock outcrops. Areas of Saturna soils remain in natural forest of toast Douglas fir and Pacifie madrone with an understory of short, scattered salal. Tree growth is slow because of the lack of moisture during the summer. Such areas provide browse and protection for the deer.
67
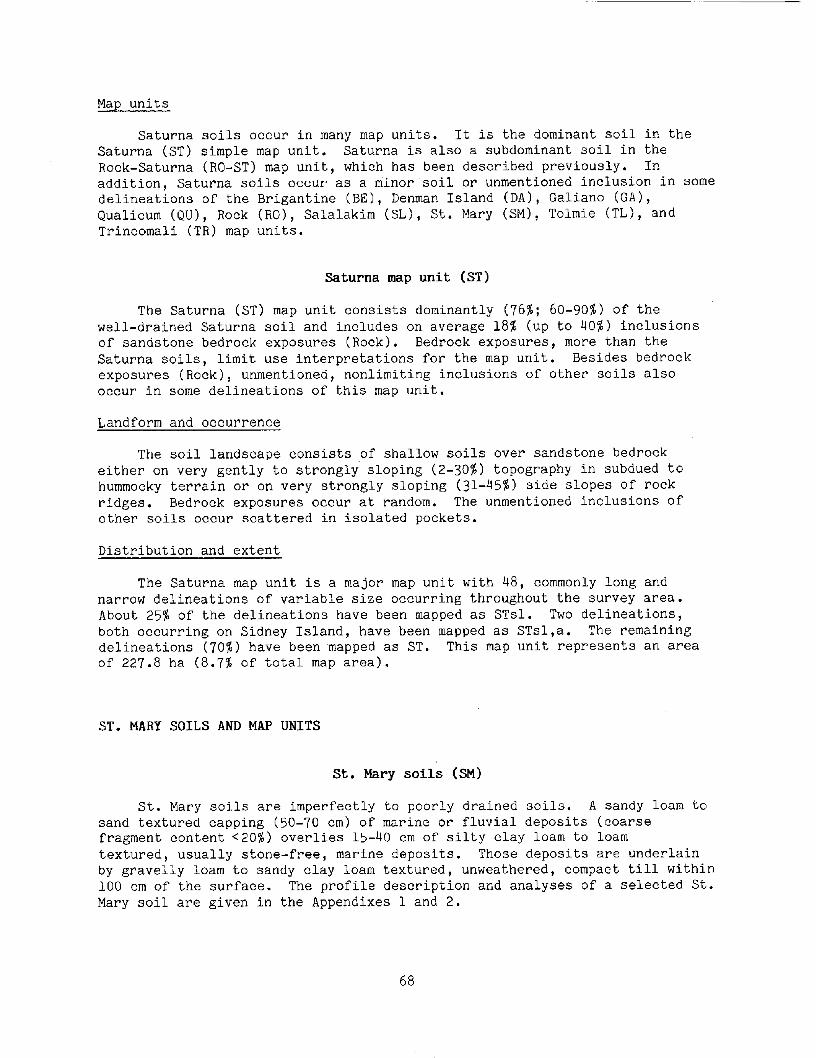
Map units
Saturna soils occur in many map units. It is the dominant soi1 in the Saturna (ST) simple map unit. Saturna is also a subdominant soi1 in the Rock-Saturna (RO-ST) map unit, which has been described previously. In addition, Saturna soils occur as a minor soi1 or unmentioned inclusion in some delineations of the Brigantine (BE), Denman Island (DA), Galiano (GA), Qualicum (QU), Rock (RO), Salalakim (SL), St. Mary (SM), Tolmie (TL), and Trincomali (TR) map units.
Saturna map unit (ST)
The Saturna (ST) map unit consists dominantly (76%; 6%90%) of the well-drained Saturna soi1 and includes on average 18% (up to 40%) inclusions of sandstone bedrock exposures (Rock). Bedrock exposures, more than the Saturna soils, limit use interpretations for the map unit. Besides bedrock exposures (Rock), unmentioned, nonlimiting inclusions of other soils also occur in some delineations of this map unit.
Landform and occurrence
The soi1 landscape consists ,of shallow soils over sandstone bedrock either on very gently to strongly sloping (Z-30%) topography in subdued to hummocky terrain or on very strongly sloping (31-45s) side slopes of rock ridges. Bedrock exposures occur at random. The unmentioned inclusions of other soils occur scattered in isolated pockets.
Distribution and extent
The Saturna map unit is a major map unit with 48, commonly long and narrow delineations of variable size occurring throughout the survey area. About 25% of the delineations have been mapped as STsl. Two delineations, both occurring on Sidney Island, have been mapped as STsl,a. The remaining delineations (70%) have been mapped as ST. This map unit represents an area of 227.8 ha (8.7% of total map area).
ST. MARY SOILS AND MAP UNITS
st. Mary soils (SM)
St. Mary soils are imperfectly to poorly drained soils. A sandy loam to sand textured capping (50-70 cm) of marine or fluvial deposits (coarse fragment content <20%) overlies 15-40 cm of silty clay loam to loam textured, usually stone-free, marine deposits. Those deposits are underlain by gravelly loam to sandy clay loam textured, unweathered, compact till within 100 cm of the surface. The profile description and analyses of a selected St. Mary soi1 are given in the Appendixes 1 and 2.
68

Soi.1 characteristics
Characteristic No. of
Mean Minimum Maximum observations
Thickness of surface layer (cm) Thickness of 2nd layer (cm) Depth to bedrock (cm) Depth to restricting layer (cm) Depth to mottles (cm) Depth to 1st PSD (cm) Depth to 2nd PSD (cm) CF content surface layer (%) Fine grave1 content surface layer (%) Coarse grave1 content surface layer (%) Cobble content surface layer (Z) CF content 2nd layer (%) Fine grave1 content 2nd layer (8) Coarse grave1 content 2nd layer ($) Cobble content 2nd layer (%) CF content 3rd layer (%) Fine grave1 content 3rd layer (%) Coarse grave1 content 3rd layer (%) Cobble content 3rd layer ($)
64 26
160 89 56 63 89
3 3 0
i 4 0 0
10 8 2 0
50 15
160 65 25 20 65
2 2 0 0 0 0 0 0 2 2 0 0
io” 160 100
90 90
100 3 3 0 0
10 10
3 0
15 10
5 0
10 10 10 12 13 13 12 2 2 2 2
12 12 12 12 13 13 13 13
No. of Frequency of occurrence ($) observations
Texture of surface layer SL(50), LS(301, S(20) 10 Texture of 2nd layer SICL(50), CL(30), SCL(lO), L(10) 10 Texture of 3rd layer (till) L(901, SCL(10) 10 Drainage class Imperfect(62), poor(311, well(7) 13 Soi1 classification GL.DYB(62), GL.SB(15), O.HG(15),
O.DYB(8) 13
Type of restricting layer Compact till Perviousness Slow
Water regime
St. Mary soils are imperfectly to poorly drained soils that are saturated to about 40 cm from the surface during winter and early spring. The soi1 receives seepage and runoff water from surrounding upland areas, which keeps the subsoil moist a11 summer. The downward movement of water may be restricted by the fine-textured, commonly massive-structured subsoil, and at a deeper level by the compact till, which creates perched water table conditions. Faint to distinct mottling occurs in the lower part of the solum, with distinct to prominent mottles below 50 cm from the surface. The poorly drained St. Mary soils, with a wetter water regime than for the imperfectly drained soils are recognized at the soi1 phase level (SMpd or SMw).
69

Variability
Soi1 phase Frequency or variant (no.> (8)
Description of variability
SMa 2
SMd 2
SMg 7
SMpd 2
SMvg 4
SMw 2
15
15
50
15
31
15
Sombric variant: Ah or Ap horizon >lO cm; classification as Gleyed Sombric Brunisol (GL.SB); also in conjunction with gravelly (g) phase
Deep phase: depth to compact till between 100 and 150 cm; mean depth 118 cm (105-130 cm); also in conjunction with gravelly (g) and very gravelly (vg) phases
Gravelly phase: coarse fragment content in surface layer between 20 and 50%; mean CF 39% (30-40%); also in conjunction with sombric (a) variant, deep (d) phase, and strongly mottled or wetter (w> phase
Poorly drained phase: poorly drained (Gleysolic) with distinct to prominent mottles within 50 cm of the surface; also in conjunction with silt loam (si) phase
Very gravelly phase: coarse fragment content in surface layer >50%; mean CF 59% (50-65%); also in conjunction with deep (d) and strongly mottled or wetter (w) phases
Strongly mottled phase: wetter moisture regime as evidenced by mottling within 50 cm of the surface; not a Gleysolic type landscape; also in conjuntion with gravelly (g) and very gravelly (vg) phases
Note: Another phase of the St. Mary soi1 with very limited occurrence is a silt loam capping (si) phase over the coarse-textured materials.
Similar soils
When the fine-textured marine subsoil is missing and the soi1 is slightly better drained and more gravelly, these soils are mapped as Trincomali (TRI. Similar imperfectly drained soils without compact till in the subsoil are mapped as Brigantine (BE) soils. The till materials in the subsoil is the Mexicana type till.
Natural vegetation
The natural vegetation consists of western red cedar, red alder, and, in some places, bigleaf maple and toast Douglas fir. The understory includes western sword fern, western bracken, and salal.
70

Land use
Very little of the St. Mary soils in the survey area has been cleared of their original vegetation for agricultural use, such as pasture and hay production. These soils are similar to the Brigantine soils, regarding most use interpretations. The St. Mary soils cari be improved with irrigation and fertilizer to produce a wide range of agricultural crops and tree fruits. Besides agriculture , growing deciduous trees is another good use for thesesoils.
Map units
St. Mary soils are the dominant component in the St. Mary (SM) simple map unit. In addition, St. Mary soils occur as a minor soi1 or unmentioned inclusion in some delineations of the Brigantine (BE), Parksville (PA), and Trincomali (TR) map units.
St. Mary map unit (SM)
The St. Mary map unit consists dominantly (77%; 65-100%) of imperfectly and poorly drained St. Mary soils. The map unit includes an average 23% of other soils. These other soils may be one or a combination of Trincomali (TR) soils and soils similar to St. Mary but without the sandy loam to loamy sand textured capping as minor soils. Unmentioned inclusions of other soils may also occur in some of the delineations. The minor soils and inclusions do not limit the use interpretations for this map unit.
Landform and occurrence
Soils of the St. Mary map unit occur on nearly level to gently sloping topography (0.5-g%). The nonlimiting inclusions and minor soils occur scattered in some delineations. Elevations are within 100 m above mean sea level.
Distribution and extent
St. Mary is a very minor map unit and occurs as six small- to medium-sized delinations on Sidney Island only; two were mapped as SMg, two as SMpd, one as SMpd,si, and one as SM. They represent an area of 38.2 ha (1.5% of total map area).
TOLMIE SOILS AND MAP UNITS
Tolmie soils (TL)
Tolmie soils are poorly drained soils that have developed on deep (>lOO cm), loam to silty clay textured, marine deposits that are usually stone free. Sandy loam, loamy Sand, and gravelly materials occur in pockets or in a thin layer or layers throughout the soi1 profile. The profile description and analyses of a selected Tolmie soi1 are given in Appendix 1 and 2.
71

Soi1 characteristics
Characteristic No. of
Mean Minimum Maximum observations
Thickness of surface layer (cm) 30 10 90 30 Depth to bedrock (cm) 1.60 160 160 30 Depth to restricting layer (cm) 42 13 160 30 Depth to mottles (cm) 23 5 42 30 CF content surface layer (%) 10 0 20 30 Fine grave1 content surface layer (%) 6 0 15 30 Coarse grave1 content surface layer (%) 3 0 10 30 Cobble content surface layer (%) 1 0 10 30 CF content subsurface layer (%) 5 0 20 29 Fine grave1 content subsurface layer ($) 4 0 10 29 Coarse grave1 content subsurface layer (%) 1 0 10 29 Cobble content subsurface layer (%) 1 0 10 29
Frequency of occurrence (%) No. of
observations
Texture of SUrfaCe layer
Texture of 2nd layer
Texture of 3rd layer Drainage class Soi1 classification
~(60), SIL (271, SICL(7), Peat(3), CL(3) SICL(46), SL(14), SCL(ll), CL(7), L(7), FSL(7), LS(4), SiC(4) SICL(79), SIC(l4), SL(7) Poor(93), very poor(7) O.HG(93), O.G(7)
30
28 14 30 30
Type of restricting layer Fine-textured subsoil, often massive structured Perviousness Slow
Tolmie soils are poorly drained soils that have distinct to prominent mottles within 50 cm of the surface. They are wet for long periods throughout the year, and water tables are within 30 cm of the surface from late November to early March. In the spring, water tables drop quickly and remain below 50 cm of the surface from May to October. Water tables fluctuate rapidly in response to wetness and dryness. Perched water tables cari occur temporarily on top of a massive-structured, fine-textured subsoil. As a result of their low landscape position, the Tolmie soils receive runoff water from their surroundings.
72

Variability
Soil'phase Frequency or variant (no.1 C%l
Description of variability
TLpt 2 6 Peaty phase: <40 cm of mesic or humic organic materials over minera1 soil; mean thickness 20 cm (10-40 cm)
Note: There is also a very limited occurrence of the gravelly (g), shallow lithic (l), and better-drained (id) phases, and taxonomy change (from Orthic Humic Gleysol to Orthic Gleysol) variant of the Tolmie soil. Commonly, a sandy loam to loamy sand layer of up to 20 cm thick occurs below the surface layer.
Similar soils
Tolmie soils are the only poorly drained, medium- to fine-textured soils in the map area. Therefore, no similar soils do occur. Where the coarse-textured layers below the surface layer are thicker than 20 cm, the soi1 was classified as a Parksville loam phase or silt loam phase, depending on the texture of the surface soil.
Natural vegetation
The natural vegetation on Tolmie soils consists of western red cedar, red alder, and bigleaf maple. The understory includes salmonberry, western sword fern, sedges, horsetail, western bracken, and, in the wettest landscape positions, commonly American skunk cabbage.
Land use
Many Tolmie soils in the survey area have been cleared for agricultural production. When their drainage is improved, they become some of the best agricultural soils. The surface soi1 is well supplied with organic matter and nitrogen. The soi1 is strongly to moderately acid (pH 5.1-6.0) and responds favorably to fertilizers. The unimproved agricultural land use is usually pasture and hay crops; spring planting of other crops is often impractical because of wet soi1 conditions.
Map units
Tolmie soils are dominant in the Tolmie (TL) simple map unit. Tolmie is a subdominant soi1 in the Brigantine-Tolmie (BE-TL) and Parksville-Tolmie (PA-TL) compound map units, which have already been described under Brigantine and Parksville. In addition, Tolmie soils occur as a minor soi1 or unmentioned inclusion in some delineations of the Baynes (BY), Brigantine (BE), Mexicana (ME), Musgrave (MG), Parksville (PA), Saturna (ST), and Trincomali (TR) map units.
73

Tolmie map unit (TL)
The Tolmie map unit consists dominantly (77%; 45-100%) of the poorly drained Tolmie soil. The unit includes an average 23% (up to 55%) of other soils. These other soils may be one or a combination of similar poorly drained soils with more uniform textures and Parksville (PA) soils as minor soils. Unmentioned inclusions of other soils occur sporadically. Although the minor soils do not limit the use interpretations, some of the unmentioned inclusions with shallow soils to bedrock do limit some use interpretations for the Tolmie map unit.
Landform and occurrence
The Tolmie landscape consists of depressions, basins, swales, and drainageways with nearly level to gently sloping (0.5-g%) topography, in which Parksville soils and inclusions of other soils occur scattered in some delineations.
Distribution and extent
The Tolmie map unit is extensive in the survey area, with 26 variable delineations; some are narrow and long. Some very large delineations occur on Portland, Moresby, and Sidney islands. Most (92%) of the delineations were mapped as TL. One delineation has peaty overlay materials (TLpt) and another has better drainage (TLid). The map unit represents an area of 244.7 ha (9.3% of total map area).
TRINCOMALI SOILS AND MAP UNITS
Trincomali soils (TR)
Trincomali soils are imperfectly to well-drained soils. They have developed on shallow (25-100 cm) deposits of gravelly sandy loam to sand textured, marine, fluvial, or glaciofluvial materials (10-508 gravels) that overlie gravelly loam to sandy loam textured, unweathered, compact till within 100 cm of the surface. The profile description and analyses of a selected Trincomali soi1 are given in Appendixes 1 and 2.
74
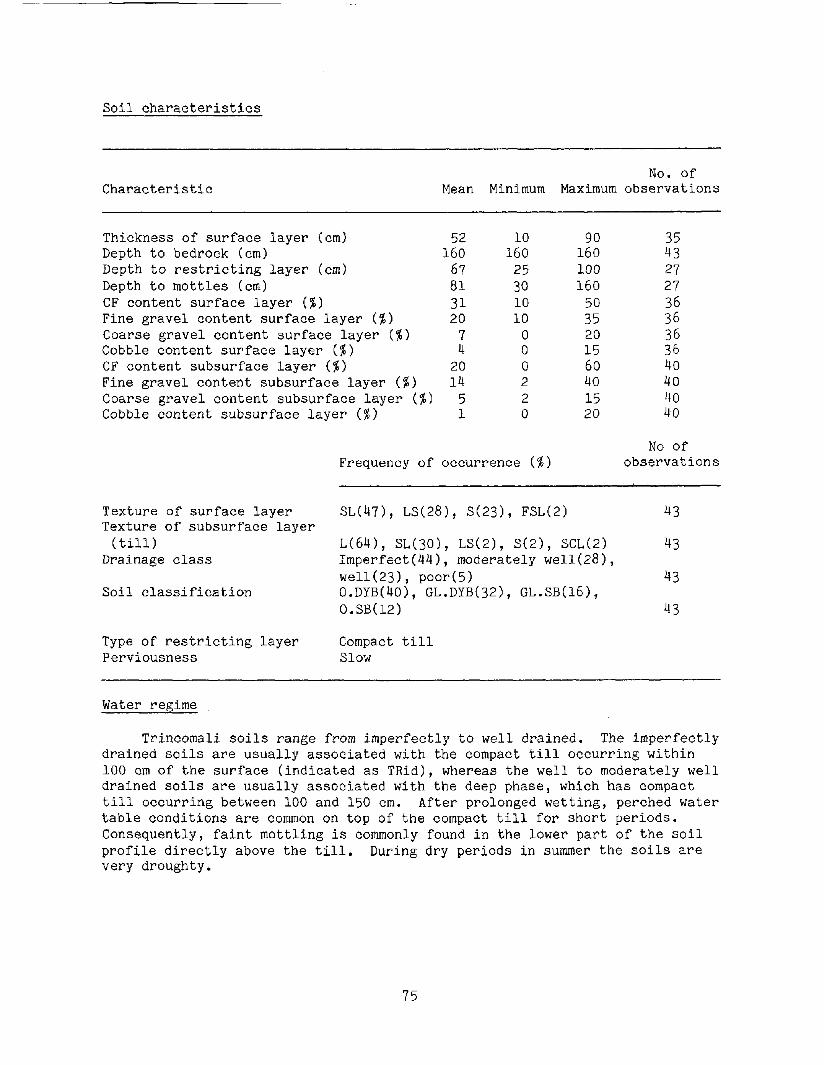
Soi1 characteristics
Characteristic No. of
Mean Minimum Maximum observations
Thickness of surface layer (cm> 52 10 90 Depth to bedrock (cm) 160 160 160 Depth to restricting layer (cm) 67 25 100 Depth to mottles (cm) 81 30 160 CF content surface layer (%> 31 10 50 Fine grave1 content surface layer ($1 20 10 35 Coarse grave1 content surface layer (%>
47 0 20
Cobble content surface layer (%) 0 15 CF content subsurface layer (%> 20 0 60 Fine grave1 content subsurface layer (%) 14 2 40 Coarse grave1 content subsurface layer (%) 5 2 15 Cobble content subsurface layer (%) 1 0 20
Frequency of occurrence ($1
z; 27 27 36 36 36 36 40 40 40 40
No of observations
Texture of surface layer SL(471, LS(281, S(23), FSL(2) 43 Texture of subsurface layer
(till) L(641, ~L(~OI, os, s(2), XL(21 43 Drainage class Imperfect(44), moderately well(281,
well(231, poor(5) 43 Soi1 classification O.DYB(40), GL.DYB(32), GL.SB(lG),
O.SB(12) 43
Type of restricting layer Compact till Perviousness Slow
Water regime
Trincomali soils range from imperfectly to well drained. The imperfectly drained soils are usually associated with the compact till occurring within 100 cm of the surface (indicated as TRid), whereas the well to moderately well drained soils are usually associated with the deep phase, which has compact till occurring between 100 and 150 cm. After prolonged wetting, perched water table conditions are common on top of the compact till for short periods. Consequently, faint mottling is commonly found in the lower part of the soi1 profile directly above the till. During dry periods in surmner the soils are very droughty.
75

Variability
Soi.1 phase Frequency or variant (no.> (%)
Description of variability
TRa 11 26
TRd 15 35
TRvg 5 12
TRw 7 16
TRid 13 30
Sombric variant: Ah or Ap horizon >lO cm; classified as Gleyed Sombric Brunisol (GL.SB) or asorthic Sombric Brunisol (O.SB); also in conjunction with deep (d), imperfectly drained (id), and strongly mottled (w) phases
Deep phase: depth to compact till between 100 and 150 cm; mean depth 124 cm (104-145 cm); also in conjunction with sombric (a) variant, imperfectly drained (id), moderately cemented (mc), and very gravelly (vg) phases
Imperfectly drained phase: wetter moisture regime than specified for soi1 (Gleyed subgroup); also in conjunction with sombric (a) variant, deep (d), and shallow lithic (1) phases
Very gravelly phase: coarse fragment content in surface layer >50%; mean CF 56% (50-60%); also in conjunction deep (d) and strongly mottled (w) phases
Strongly mottled phase: wetter moisture regime as evidenced by mottling within 50 cm of the surface; not a Gleysolic-type landscape; also in conjunction with sombric (a) variant and very gravelly (vg) phases
Note: There is also a limited occurrence of the gravelly (g), shallow lithic (l), moderately cemented (mc), and silt loam (si) phases for the Trincomali soil.
Similar soils
Trincomali soils commonly occur together with Qualicum soils, which are deeper and better drained. Soils with coarse-textured overlays thicker than 150 cm have been mapped as Qualicum soils. Trincomali soils occur in some places together with Mexicana soils that have developed on till without the somewhat coarser textured overlay materials. Inihen the sandy loam to loamy sand textured deposits over till are less than 30 cm thick, these soils are part of the Mexicana (ME) map unit. Trincomali soils are similar to St. Mary soils but lack the finer-textured layer above the till.
Natural vegetation
The natural vegetation consists of toast Douglas fir, with some grand fir and scattered Pacifie madrone. The understory consists of salal, western bracken, and du11 Oregon-grape.
76

Land use
Trincomali soils are rarely used for hay and pasture. The main limiting factors for agriculture on these soils are stoniness, droughtiness, and topography. In addition, the soils are very strongly to strongly acid (pH 4.6-5.5) and have a low inherent fertility. The best use for these soils is for growing coniferous trees.
Map units
Trincomali soils occur as the dominant soi1 in the Trincomali (TR) simple map unit. In addition, Trincomali soils occur as a minor soi1 or unmentioned inclusion in some delineations of the Beddis (BD), Brigantine (BE), Mexicana (ME), Musgrave (MG), Parksville (PA), Qualicum (QV), Rock-Rumsley (RO-RY), Rock-Saturna (RO-ST), Rumsley (RY), St. Mary (SM), and Saturna (ST) map units.
Trincomali map unit. (TRI
The Trincomali (TR) map unit consists dominantly (80%; 65-100s) of the imperfectly to well-drained Trincomali soils. The Trincomali map unit includes an average 20% (up to 35%) of other soils, of which the Qualicum soi1 is the most commonly occurring minor soi1 (in half the delineations of the map unit). Unmentioned inclusions of other soils occur sporadically. Soils with very compact (Quadra) sands in the subsoil were included in the Trincomali map unit. Although the Qualicum minor soi1 does not limit the use in.terpretations, some of the imperfectly and poorly drained inclusions and the ones with shallow soils to bedrock do limit the use interpretations for the Trincomali map unit.
Landform and occurrence
The Trincomali landscape consists of shallow beach, terrace, or outwash deposits over till, usually near or at the shoreline or along drainageways. Soils of the Trincomali map unit (TR) occur on very gently to strongly sloping topography (2-309) but occasionally on steeper bluff slopes (46-100%) on James Island. Qualicum soils occur at random where the coarse-textured deposits are deeper than 150 cm. Inclusions of other soils also occur scattered in some delineations.
Distribution and extent
The Trincomali map unit is the most extensive map unit in the survey area with 24 small- to large-sized delineations. Twelve delineations, including large ones, were mapped on Sidney Island, and five on James Island. Ten delineations were mapped as TR, five delineations were mapped as TRd, five as TRid, two as TRd,a, one each for TRid,a and TRpd. This map unit represents an area of 410 ha (15.6% of total map area).
77

SUMMARY OF AREAL EXTENT OF MAP UNITS IN THE SURVEY AREA
When the map units are grouped by the origin of parent materials or by parent material textures of the dominant soils, some comparisons cari be made about the distribution of map units in the survey area (Table 6).
Table 6. Distribution of map units in survey area by parent materials
Dominant parent Map unit Area occupied materials (ha) (%)
1 Shallow colluvial and glacial drift (within 1 m)
2 Rock
3 Shallow over compact glacial till (within 1 m)
4 Deep, moderately fine to fine textured marine materials
5 Deep, coarse to moderately coarse textured materials
6 Coarse to moder- ately coarse over dw , moderately fine to fine textured marine materials
GA, HA, MG, 527 RY, SL, and ST over bedrock
20
RO, RO-BH, RO-MG, RO-RY, and RO-ST
562 21
ME, SM, and TR 455 17
TL 245 9
BD, BY, DA, and QV
451
BE, BE-TL, PA, and PA-TL
296
17
11
Summary:
1,293 Shallow soils and rock 1544 58
4,5,6, Deep soils 991 37
Note: The remaining area (5%) consists of land types such as CB, MD, TF, and W.
78

PART 5. LAND USE INTERPRETATIONS
Application of soi1 survey information is often required by the users of soi1 maps and reports. Information about soils, therefore, has to be interpreted for different uses. For the Gulf Islands, the main users are land use planners, for whom two kinds of land use interpretations have been identified: - land constraints for the absorption of septic tank effluent; and - land capability for agriculture.
In the following sections these two land use interpretations are described, and the map unit ratings are presented in table format. However, the map unit interpretations in the following tables cannot be regarded as site-specific. Not a11 the land limitations mentioned in the text or in the tables may be encountered in any particular location. These sections should be used as a guide to the types of limitations (problems) that could be encountered. Whether they Will or Will not be encountered, and how difficult they may be to overcome in a particular location, must be determined by on-site inspections.
LAND CONSTRAINTS FOR SEPTIC TANK EFFLUENT ABSORPTION
In the survey area, sewage disposa1 is handled by septic tanks and effluent absorption fields. With increasing pressure for residental development it is important to know the constraints or limitations the soi1 and landscape properties of each map unit impose on septic tank effluent absorption. Soi1 characteristics, more than any other factor, determine the success or failure in the performance of septic tank absorption fields. If an absorption field is to function properly, the soi1 must do three things: it must first accept the effluent, then treat it, and finally dispose of it.
Interpretations for septic tank effluent absorption are based on a number of soi1 and landscape properties. Four constraint classes (slight, moderate, severe, and very severe) have been defined to indicate problems or potential problems with effluent absorption that are caused by soi1 and landscape characteristics (Epp 1984). A rating of slight indicates that the soi1 is well suited for effluent absorption. As the severity of the constraint class increases from slight to very severe, the design and maintenance requirements for septic tank effluent disposa1 increase. Soils within a constraint class are similar in the degree of limitations but the kind of limitation (for example, depth to bedrock or drainage) may differ.
For the survey area the following six soi1 and landscape properties were used to indicate the limitations for septic tank effluent absorption (Epp 1984): D DEPTH TO RESTRICTED LAYERS: Layers with low permeability near the surface
limit the thickness of material available for effluent treatment and may result in saturated conditions in the overlying soi1 (for example, compact till and massive-structured horizons).
G COARSE FRAGMENT CONTENT: Coarse fragment content reduces the effectiveness of the soi1 for effluent treatment.
R DEPTH TO BEDROCK: Bedrock near the surface limits the thickness of material available for effluent treatment and may result in saturated conditions in the overlying soil.
79

s SOIL TEXTURE: Texture is not a major property for determining effluent disposa1 but rather for determining soi1 permeability.
T TOPOGRAPHY: Steepness and pattern of slopes limit effluent disposal. W SOIL DRAINAGE: The rapidity and extent of water removal from the soi1
in relation to additions is important.
The methods, assumptions, definitions, and symbols for constraint classes and properties used in determining effluent absorption constraints are defined in MOE Manual 5 (Epp 1984).
The constraint class and soi.1 and landscape limitations for septic tank effluent absorption are listed for each map unit in Table 7. The constraint class is determined by the most limiting soi1 and landscape property (or properties). These properties are indicated in capital letters behind the constraint class. Also, those limiting properties that occur at the next lower constraint class are indicated by a lowercase letter behind the ones indicated in capital letters. A maximum of three limitations per constraint class are presented in Table 7. The slight constraint class does not list subclass limitations.
The typical constraint classes for effluent absorption in columns 4 and 5 of Table 7 are based on the dominant occurrence of the limiting soi.1 and landscape properties for the map unit as indicated in the map unit legend. Where a range is defined for a given property, for example slope or coarse fragment content, the calculated mean value is used to determine the typical constraint class. For compound map units the calculated mean proportion of dominant and subdominant soils is used, although for a specific delineation the actual proportions may vary within the limits indicated in the legend. Where inclusions of minor soils have been described, the proportion of the most frequent limiting soi1 is assumed to be 20%. In some delineations the proportion of minor soils may vary from this assumed proportion. The different soi1 proportions within each map unit are represented by superscripts for the ratings in Table 7.
For some delineations the constraint class may differ from the typical constraint class for one or more reasons. For example, slopes may be more or less steep than for the typical rating. Also, the range of slopes occurring in some delineations may span more than one constraint class. Therefore, columns 6, 7, and 8 of Table 7 indicate variations from the typical rating because of changes in slope class. Also the described range in soi1 properties such as coarse fragment content, texture, drainage, depth to bedrock, or other restricting layers may caver more than one constraint class. Variations in soi1 properties as indicated by the soi1 phase or variant symbol do occur, such as texture, coarse fragment content, depth to bedrock, or presence of an organic capping. Where the occurrence of a soi1 phase or variant results in the constraint rating of the map unit being different from the typical rating, this variation, along with the soi1 phase or variant is indicated in columns 9, 10, and 11 of Table 7. These ratings assume the same typical slope class (column 4). In addition, inclusions of unmappable (because of the size of the map scale) soils, or variations in the proportion of dominant, subdominant, and minor soils do occur for some delineations. These types of variations could not be expressed in the table.
80

81

-0 .r ki
82

Table 7. Constraint classes and soi1 and landscape limitations for septic tank effluent absorption (continued)
Mao unit Tvpical constraint class Variation due to slooe Variation due to soi1 prooerties Symbol Name Slope Constraint Soi1 Slope Constraint Soi1 Soi1 Constraint Soi1
class* class limitations class* class limitations phase* class limitations (1) (2) (3) (4) (5) (6) (7) (8) (9) (10) (11)
QU Qualicum 4 Moderate8- GSW8-Dgw2 5 Moderate8- GTW8-Dtw2 QUvg Severe Gsw8-Dgw2
severe2 severe2
RO Rock 3,4,5 Very severe R 6 Very severe Rt
7,8,9 Very severe RT
RO-BH Rock- 4,5 Very severe R 6 Very severe Rt
Bellhouse
w RO-MG Rock- 5 Very severe5- R5-Rgt5 4 Very severe5- R5-Rg5 RO-MGsl Very severe R
Musgrave severe5
6‘
severe5
Very severe5- Rt5-RTg5 8
severe5
7 Very severe RT5-Tr5
RO-RY Rock- 4 Very severeh R6-Rg4 3 Very severe6- R6-Rg4
Rumsley severe4 severe4
5 Very severe6- R6-Rgt4
severe 4
6 Very severe6- Rt6-RTg4
severe4
7 Very severe RT6-Tr4
RO-ST Rock- 3,4,5 Very severe R 6 Very severe Rt Saturna 798 Very severe RT
(continued)

Table 7. Constraint classes and soi1 and landscape limitations for septic tank effluent absorption (concluded)
Mao unit Tvpical constraint class Variation due to slope Variation due to soi1 p roperties Symbol Name Slope Constraint Soi1 Slope Constraint Soi1 Soi1 Constraint Soi1
class* class limitations class* class limitations phase" class limitations (1) (2) (3) (4) (5) (6) (7) (8) (9) (10) (11)
RY Rumsley 3,4 Severe8- Rg8-R2 5 Severe8- Rgt8-R2 RYsl Very severe R
very severe2 very severe 2
6 Severe8- RTg8-Rt2 RYvg Severe8- GR8-R2
very severe2 very severe2
SL Salalakim 495 Very severe R 6 Very severe Rt SLsl,vg Very severe Rg7-R3
SM St. Mary 2 Severe DW8-Dgw2 SM Severe DWg8-Dgw2
SMpd Very severe8- Wd8-Dgw2
severe2
ST Saturna 3,4,5 Very severe R 6 Very severe RT
7 Very severe RT
TL Tolmie 1,2,3 Very severe W 4 Very severe W
TR Trincomali 3 Severe8- Dwg8-GSW2 4 Severe8- Dwg8-GSW2 TRd Moderate DGW8-GSW2
moderate moderate
5 Severe8- Dtw8-GTW2 TRid Severe8- DWg8-GSW2
moderate moderate
6 Severe DTw8-Tgw2 TRpd Very severe8- Wd8-GSW2
moderate
899 Very severe Td8-T2
* See map legend.
t Percent soi1 component (see map legend for inclusions).

The ratings in Table 7 are to be used as a guide only. They are not specific to individual map delineations and therefore do not eliminate the need for detailed on-site investigations.
Results of Table 7 indicate that none of the map units for the survey area has a slight constraint rating for effluent absorption. Beddis map units have dominantly a moderate limitation for effluent absorption because of soi1 texture (S) and soi1 drainage (W) and slope below 15% (up to slope class 5) and gravelly phase (BDg). Also, the Qualicum (QV) and Trincomali deep (TRd) map units on moderate slopes (10-15s) have moderate limitations for effluent absorption. Al1 other map units occurring in the survey area, including the foregoing map units on steeper topography (115%), fa11 into the severe and very severe constraint classes for septic tank effluent absorption.
LAND CAPABILITY FOR AGRICULTURE
Land in the agricultural land reserve accounts for about 40% of the total surveyed area. With increasing pressures to use land for purposes other than agriculture (for example, residential development), it is important for planning purposes to know the agricultural capability class for the map units recognized in the survey area. This section evaluates the soi1 and landscape properties for the map units to determine soi1 and landscape limitations for agriculture capability.
Land capability ratings for agriculture are interpretations based on climatic, soil, and landscape characteristics. The Land Capability Classification for Agriculture in British Columbia (Kenk and Cotic 1983) groups soils into seven classes on the basis of the range of regionally adapted crops that cari be grown, or the intensity of management inputs required to maintain trop production, or both. Class 1 soils are considered to have no limitations for trop production. As the class level increases from 1 to 7, the level of management input increases and the range of suitable crops decreases. Class 7 soils are considered to have no potential for natural grazing or arable trop production. Soils within a class are similar in the degree of limitation but the kind of limitation may differ. The subclasses indicate the nature of the soi1 limitations (Kenk and Cotic 1983).
For the survey area, the following six land capability subclasses were used to describe the soi1 and landscape limitations for agriculture capability:
A SOIL MOISTURE DEFICIENCY: Crops are adversely affected by droughtiness caused by soi1 and/or climate characteristics; improvable by irrigation.
D UNDESIRABLE SOIL STRUCTURE OR LOW PERVIOUSNESS OR BOTH: Soils are difficult to till, require special management for seedbed preparation, pose trafficability problems, have insufficent aeration, absorb and distribute water slowly, or have the depth of rooting zone restricted by conditions other than high water table, bedrock, or permafrost; improvement practices vary; no improvement is assumed in the absence of local experience.
P STONINESS: Coarse fragments significantly hinder tillage, planting, and harvesting operations; improvable by stone picking.
85

R DEPTH TO SOLID BEDROCK AND ROCKINESS: Bedrock near the surface or rockoutcrops, or both, restrict rooting depth and cultivation; not improvable.
T TOPOGRAPHY: Steepness or the pattern of slopes limits agricultural use; not improvable.
w EXCESS WATER: Excess free water, other than from flooding, limits agricultural use and may result from poor drainage, high water tables, seepage, or runoff from surrounding areas; improvable by drainage; feasibility and level of improvement is assessed on a site-specific basis.
The methods, assumptions, definitions, and symbols for classes and subclasses used in determining the agricultural capability ratings are described in MOE Manual 1 (Kenk and Cotic 1983).
In determining the agriculture capability, climatic limitations are evaluated first and, if neither soi1 nor landscape characteristics produce any limitations, then the regional climate determines the land capability for agriculture.
For the survey area, the climatic moisture deficit (CMD) is the limiting climatic parameter for agricultural capability. Potential evaporation data are not available for the survey area. For Saltspring Island, which is nearby in the same climatic regime, the CMD was calculated at 203-234 mm during the growing season (Coligado 1979). This CMD represents a Class 4 climate in the Climatic capability classification for agriculture in British Columbia (Air Studies Branch 1981).
The capability class and soi1 and landscape limitations (subclasses) for agricultural capability are listed for each map unit in Table 8. The capability class is determined by the most limiting soi1 and landscape property (or properties). These properties are indicated in capital letters behind the numerical capability class. Also, those limiting properties that occur at the next lower capability class are indicated by a lowercase letter behind the ones indicated in capital letters. A maximum of three limitations per capability class are presented in Table 8.
The typical land capability for agriculture ratings in columns 4 and 5 of Table 8 are based on the dominant occurrence of the limiting soi1 and landscape properties for each of the map units as indicated in the map legend. Where a range is defined for a given property, for example slope or coarse fragment content, the calculated mean value is used. Column 4 gives the unimproved rating. For some soils, capability cari be improved through management practices such as irrigation, drainage, and stone picking, which is indicated by the improved ratings in column 5. For compound map units, calculated means of the proportion of dominant and subdominant soils are used,although for a specific delineation the actual proportions may vary within the limits indicated in the legend. Where inclusions of minor soils have been described, the proportion of the most frequent limiting minor soi1 is assumed to be 20%. In some delineations, the proportion of minor soils may vary from this assumed proportion. For the foregoing two examples, the proportions are represented by superscripts for the ratings in Table 8.
86

Table 8. Land capability ratings for agriculture
Mao unit Tvpical capabilitv class Variation due to slope Variation due to soi1 properties Symbol Name Slope Unimproved Improved Slope Unimproved Improved Soi1 Unimproved Improved
cl ass” rating rating Glass" rating rating phase* rating rating (1) (2) (3) (4) (5) (6) (7) (8) (9) (a) (a)
BD Beddis 3 3Ap8'+4AP2t 2A8-3Adp2 4 3Apt8-4APt* 2AT8-3APt2 BDg 3Ap8-3APd2 3Ap8-3Adp*
5 3ATp8-4Apt2 3Ta8-3ATp2 BD1 3ARp8-3APd2 3Ra8-3Adp2
6 5T 5T BDvs 4A8-3APd2 3A8-3Adp2
BE Brigantine 4 3At8-4W2 2AT8-2ADW2 3 3A8-4W2 2A8-2ADW* BEg 3AP8-4W2 3Ap8-2ADW2
5 3AT8-4W2 3Ta8-2ADW2
6 4Ta8-4W2 4T8-2ADW2
BE-TL Brigantine- 3 3A6-4W4 2A6-2DW4 4 3At6-4W4 2AT6-2DW4 BEg-TL 3AP6-4W4 3Ap6-2DW4 Tolmie 5 3AT6-4W4 3Ta6-2DW4
BY Baynes 293 3A8-4W2 2A8-2AW2 3AT 3Ta BYg 3AP8-4W2 2A$p-2AW2
4Ta 4Ta BYw 3w8-4w2 2A8-2AW2
DA Denman 1,2,3 4W 2AW DAl,lo 4W 2RW
Island DApt 5W 3w
GA Galiano 5 4Rat8-7R2 4Rt-7R2 4 4Ra8-7R2 4R8-7R2 GAsl,vg 4Rat8-7R2 4Rat8-7R2
6 5Tr8-7R2 5Tr8-7R2
7 7T8-7RT2 7T8-7RT2
(continued)

Table 8. Land capability ratings for agriculture (continued)
Map unit Tvpical capabilitv class Variation due to slope Variation due to soi1 properties
Symbol Name Slope Unimproved Improved Slope Unimproved Improved Soi1 Unimproved Improved
class* rating rating class* rating rating phase* rating rating (1) (2) (3) (4) (5) (6) (7) (8) (9) (10) (11)
HA Haslam 5 4APR8-7R2 4PRt8-7R2 4 4APR8-7R2 4PRa8-7R2
6 5Tar8-7R2 5Tpr8-7R2
798 7T8-7RT2 7T8-7RT2
ME Mexicana 4 3APt8-4Ap2 2APT8-3Apt2 3 3APd8-4Ap2 2APd8-3Adp2
5 3APT8-4Ap2 3Tap8-3ATp2
k% MG Musgrave 5 4Art7-7R2 3ART7-7R2 3 4Apr7-7R2-4Ap' 3APR7-7R2-3Ap1 MGsl 5Ra7-7R2-4Ap1 5R7-7R2-3APT1
-4AT' -3APT' 4 4Apr7-7R2-4Ap' 3APR7-7R2-3APt'
6 5Ta8-7R2 5T8-7R2
7 7T8-7RT2 7T8-7RT2
PA Parksville 2,3 4W 2ADW8-2DW2 PAd 4W 2AW8-2DW2
PAlo 4W 3W8-2DW2
PAsi 4W 2W8-2DW2
PA-TL Parksville- 3
Tolmie 4w 2ADW5-2DW5
QU Qualicum 4 GAP 3Apt 3 GAP 3Ap8-3Adp2 QUvg 5A8-3Apt2 5A8-3Apt2
5 4Apt 3ATp
(continued)

Table 8. Land capability ratings for agriculture (continued)
Map unit Tvpical capabilitv class Variation due to slope Variation due to soi1 properties Symbol Name Slope Unimproved Improved Slope Unimproved Improved Soi1 Unimproved Improved
class* rating rating class* rating rating phase" rating rating (1) (2) (3) (4) (5) '(6) (7) (8) (9) (10) (11)
RO Rock 3,4 7R8-5Rap2 7R2-5Rp2 5 7R8-5Ap2 7R8-5Ap2
6 7R8-4ATp2 7R8-5ATp2
7,8,9 7RT8-7T2 7RT8-7T2
RO-BH Rock- 4 7R6-6R4 5 7R6-6Rt4 Bellhouse 6 7R6-6Rt4
CO RO-MG Rock- 5 7R5-4Art5 7R5-3ART= 4 7R5-4Apr5 7R5-3APR5 RO-MGsl 7R5-5Ra5 7R5-5R5 Lo
Musgrave 6 7R5-5Tap5 7R5-5T5
7 7RT5-7T5 7RT5-7T5
RO-RY Rock- 4 7R6-4APr4 7R6-3APR4 3,5 7R6-4APr4 7R6-3APR4 Rumsley 6 7R6-5Tap4 7R6-5T4
7 7RT6-7T4 7RT6-7T4
RO-ST Rock- 5 7R5-4Art5 7R5-3ART5 3,4 7R5-3Apr5 7R5-3APR5 RO-STsl 7R5-5Ra5 7R5-5R5 Saturna 6 7R5-5Ta5 7R5-5T5
738 7RT5-7T5 7RT5-7T5
RY Rumsley 4 4APr8-7R2 3APR8-7R2 3 4APr8-7R2 3APR8-7R2 Rysl 5Ra8-7R2 5R8-7R2
5 4APr8-7R2 3APR8-7R2 RYvg 5AR8-7R2 5AR8-7R2 6 5Tap8-7R2 5T8-7R2
(continued)

Table 8. Land capability ratings for agriculture (concluded)
Mao unit Tvpical capabilitv class Variation due to slope Variation due to soi1 properties
Symbol Name Slope Unimproved Improved Slope Unimproved Improved Soi1 Unimproved Improved
class* rating rating class* rating rating phase* rating rating Jl) (2) (3) (4) (5) (6) (7) (8) (9) (10) (11)
SL Salalakim 5 4Rat7-7R3 4Rt7-7R2 4 4Ra7-7R3 4R7-7R3 SLsl,vg 5AR7-7R3 5AR7-7R3
6 5Tr7-7R3 5Tr7-7R3
SM St. Mary 2 3A8-4Ap2 2A8-3Adp2 3 3A8-4Ap2 2A8-3Adp2 SQ GAP 3Ap8-3Adp2
4 3At8-4Ap2 2AT8-3Apt2 SMpd 4W8-4Ap2 2AW8-3Adp2
SMpd,si 4W8-4Ap2 2W8-3Adp2
ul ST Saturna 4 4Apr*-7R2 3APR8-7R2 3 4Apr8-7R2 3APR8-7R2 STsl 5Ra8-7R2 5R8-7R2 0 5 4Art8-7R2 3ART8-7R2
6 5Ta8-7R2 5T8-7R2
7 7T8-'RT2 7T8-7RT2
TL Tolmie 1,2,3 4W 2DW8-2ADW2 4 4W 2DTW TLid 3Ad 2D
TLpt 5W 3Wd
TR Trincomali 3 4Ap 3Adp8-3Ap2 4 GAP 3Apt TRd 4Ap 3Ap 5 4Apt 3ATp TRpd 4Wp8-4Ap2 2APW8-3Ap2
6 5Ta 5T
8,9 7T 7T
* See map legend.
t Percent soi1 component (see map legend for inclusions).

For some delineations, the land capability for agriculture may differ from the typical capability rating for one or more reasons. For example, slopes may be more or less steep than for the typical rating. Also, the range of slopes occurring in some delineations may span more than one land capability for agriculture class. Therefore, columns 6, 7, and 8 of Table 8 indicate the variations from the typical rating because of changes in slope class. Also, the described range in soi1 properties, such as coarse fragment content, may caver more than one capability class. Variations in soi1 properties, such as texture, coarse fragment content, depth to bedrock, and presence of an organic capping, do occur for some delineations. These are indicated by the soi1 phase or variant symbol in the map legend. Where the occurrence of a soi1 phase or variant results in the land capability for agriculture rating of the map unit being different from the typical rating, this difference, along with the soi1 phase or variant is indicated in columns 9, 10, and 11 of Table 8. These ratings assume the same typical slope class (column 4). In addition, inclusions of unmappable (because of the size of the map scale) soils, or variations in the proportion of dominant, subdominant, and minor soils do occur for some delineations. These types of variations could not be shown in the table.
The ratings in Table 8 are to be used as a guide only. They are not specific to individual map delineations and, therefore, do not eliminate the need for detailed on-site investigations.
Land capability for agriculture ratings in Table 8 show that soils of map units with the least degree of limitation for agricultural trop production generally occur below the 100-m contour either on gently sloping terrain or in valley bottoms. Most of these soils have developed on deep marine deposits with a low content of coarse fragments. Some of these map units represent the following soils: Baynes, Beddis, Brigantine, Denman Island, Parksville, and Tolmie. Similar soils with compact till occurring between 50 and 100 cm (St. Mary) fa11 into the same category.
Soils of map units having more severe limitations for agricultural trop production are generally found at the higher elevations and on more steeply sloping terrain. Most of these soils are shallow to bedrock or to compact till, because they have developed on colluvial and glacial drift materials. They usually have a high percentage of coarse fragments. The fact that these soils are difficult or impossible to improve realistically is indicated by the improved ratings (Table 81, which are the same as the unimproved ratings. Some of these map units represent the following soils: Galiano, Haslam soi1 complex, Musgrave, Rumsley, Salalakim, and Saturna soils. Agricultural uses on these soils are restricted to natural grazing, the production of perennial forage crops, or other specially adapted crops, such as tree fruits and grapes.
91

PART 6. DERIVED AND INTERPRETIVE MAPS
Besides the map unit interpretations discussed and presented in Part 5 of this report, similar or different interpretations that are specific for map delineations cari be made.
Agriculture Canada is able to produce maps based on the soi1 information. These may be either interpretive maps like the land capability for agriculture, maps derived from the original soi1 information, such as maps of soi1 texture, slope, or drainage. Such maps cari be made because the original boundaries and map unit symbols are stored in a computer as part of the Canada Soi1 Information System (CanSIS).
Soi1 maps are drafted by the Cartography Section in the Land Resource Research Centre of Agriculture Canada, Ottawa. As part of the cartographie procedure, the soi1 maps are digitized, and the locations of the map unit boundaries and their symbols are entered into the computer. The soi1 map, associated legend, and map unit symbols are then stored in the computer. This data base provides the basis for the production of derived or interpretive maps.
For example, it is possible that a map showing only the different types of soi1 parent materials is required. The procedure involves replacing the original map unit symbol by a new symbol that indicates the type of soi1 parent material. The same boundaries are retained, with the exception of those that have the same new symbols on either side. In this instance, the boundary is deleted. No new boundaries are added.
If users of the soi1 information need derived or interpretive maps, they should contact the senior author of this report at British Columbia Land Resource Unit, Agriculture Canada, 6660 N.W. Marine Drive, Vancouver, B.C. V6T 1X2 (Telephone (604) 224-4355).
92

REFERENCES
Advanced Data Institute America Incorporated. 1983 l Aladin relational problem solver: Software and documentation. Sacramento, Calif.
Air Studies Branch. 1981. Climatic capability classification for agriculture in British Columbia. APD Tech. Pap. 4. Ministry of Environment, Victoria, B.C. 23 pp.
Agriculture Canada Expert Committee on Soi1 Survey. 1987. The Canadian system of soi1 classification. Agric. Can. Publ. 1646. 164 pp.
Akrigg, G.P.V.; Akrigg, H.B. 1973 l 1001 British Columbia place names. Discovery Press, Vancouver, B.C. 195 pp.
Anonymous. 1930 l Industrial island real beauty spot. Victoria Daily .Times. Oct. 11, magazine section:l.
Anonymous. 1981. If your wondering. Victoria Times-Colonist, B.C., Dec. 23: ii.
Armstrong, J.E.; Clague, J.J. 19'77. Two major Wisconsin lithostratigraphic units in southwest British Columbia. Can. J. Earth Sci. 14:1471-1480.
Atmospheric Environment Service. 1982a. Canadian climate normals: Temperature and precipitation 1951-1980, British Columbia. Environment Canada, Downsview, Ont. 268 pp.
Atmospheric Environment Service. 1982b. Canadian climate normals: Volume 6, frost 1951-1980. Environment Canada, Downsview, Ont. 276 PP~
Atmospheric Environment Service. lg82c. Canadian climate normals: Volume 4, degree days 1951-1980. Environment Canada, Downsview, Ont. 280 pp.
Barr, L.R. 1978 l Land of the Trust Islands, a review of subdivision, housing, and ownership. Islands Trust, Ministry of Municipal Affairs and Housing, Victoria, B.C. 36 PP.
Bond, B. 1979 l James Island . ..once a private hunting reserve. The Daily Colonist, Victoria, B.C., Feb. 11:4-5.
Borden, C.E. 1968. Prehistory of the Lower Mainland. Pages 9-26 in Siemens, A.H., ed. Lower Fraser Valley: Evolution of a cultural landscape. B.C. geographical series, number 9. Tantalus Research Ltd. Vancouver, B.C.
Boyes, E.B. 1960. Strange doings on Moresby Island. The Daily Colonist, Victoria, B.C., Sept. 18:8-g.
British Columbia Ministry of Agriculture. 1978. Agriculture on Vancouver Island and the Gulf Islands. Victoria, B.C. 16 pp.
British Columbia Ministry of Lands, Parks, and Housing. 1983. Coastal marine parks of British Columbia. Victoria, B.C. (map).
93
Canadian Society of Soi1 Science. 1976 l Glossary of terms in soi1 science. Can. Dep. Agric. Publ. 1459. 44 pp.
Chilton, R.R. 1975. Climatology of the Gulf Islands trust area. Climate and Data Services Division, Environmental Land Use Committee Secretariat, Victoria, B.C. 20 pp.
Clague, J.J. 1975. Late Quaternary sea level fluctuations, Pacifie Coast of Canada and adjacent areas. Geol. Surv. Can. Paper 75-X:17-21.
Clague, J.J. 1977. Quadra Sand: A study of the Late Pleistocene geology and geomorphic history of coastal British Columbia. Geol. Surv. Can. Paper77-17. 24 pp.
Clapp, C.H. 1913. Geology of the Victoria and Saanich map-areas, Vancouver Island, B.C. Geol. Surv. Can. Memoir. 36. 143 pp. (plus appendices).
Coligado, M.C. 1979. Climate of the southern Gulf Islands. Pages 1 and 2 of resource folio for the Gulf Islands. Resource Analysis Branch, Ministry of Environment, Victoria, B.C. (maps).
Day, J.H.; Farstad, L.; Laird, D.G. 1959. Soi1 survey of southeast Vancouver Island and Gulf Islands, British Columbia. Report No. 6 of the B.C. Soi1 Survey, Department of Agriculture, Vancouver, B.C. 104 pp.
Dickason, A. 1949. Boom island. Vancouver Sun, June 4, magazine section: 6.
Duff, W. 1961. The Indians of the Gulf Islands. Pages l-5 in A Gulf Islands patchwork: Some early events on the islands of gliano, Mayne, Saturna, North and South Pender. Published for the Gulf Islands Branch, B.C. Historical Association.
Epp, P.F. 1984. Soi1 constraints for septic tank effluent absorption. MOE Manual 5. Surveys and Resource Mapping Branch, Ministry of Environment, Kelowna, B.C. 90 pp.
Foweraker, J.C. 1974. Groundwater investigations on Mayne Island. Report No. 1: Evaluation, development, and.management of the groundwater resource on Mayne Island. Groundwater Division, Water Investigation Branch, B.C. Department of Lands, Forests and Water Resources. Victoria, B.C. 54 PP*
Freeman, B.J.S. 1961. Moresby Island. Page 81 in A Gulf Islands patchwork: Some early events on the islands of Galiano,Mayne, Saturna, North and South Pender. Published for the Gulf Islands Branch, B.C. Historical Association.
Gibbs, M. 1973. Pearl of the Gulf Islands. The Daily Colonist, Victoria, B.C., April 8, magazine section:4-5.
Green, J. 1982. Sidney Island tree farm still Pearl of Gulf Islands, Victoria Times-Colonist, B.C., Nov. 7, magazine section:4-5.

Halstead, E.C. 1968. The Cowichan ice tongue, Vancouver Island. Can. J. Earth Sci. 5:1409-1415.
Hinkens, K. 1982. How to shoot a deer and save an island. Province, Vancouver, B.C., Oct. 24, magazine section:1,3.
Hirvonen, H.E.; Senyk, J.P.; Oswald, E.T. 1974. Saltspring Island, a landscape analysis. Can. For. Serv. Pac. For. Res. Cent. Inf. Rep. BC-X-99, Victoria, B.C., 54 pp.
Holland, S.S. 1976. Landforms of British Columbia, a physiographic outline. B.C. Dep. Mines and Petroleum Resources, Victoria, B.C. Bull. 48. 138 pp.
Ingham, D. 1952. Their powder boosts progress James Island runs own railway with toy-sized track and lotos. Victoria Daily Times, B.C., May 29:lO.
Islands Trust. 1982. Islands Trust regional plan. Draft, March 1982. Brochure, Ministry of Municipal Affairs, Victoria, B.C. 13 PP.
Islands Trust. 1984. Island water conservation information for residents and visitors. Brochure, Ministry of Environment and Ministry of Municipal Affairs, Victoria, B.C. 6 pp.
Kenk, E.; Cotic, 1. 1983 l Land capability classification for agriculture in British Columbia. MOE Manual 1. Ministry of Environment and Ministry of Agriculture and Food, Kelowna, B.C. 62 pp.
Kerr, D.P. 1951. The summer-dry climate of Georgia Basin, British Columbia. Trans. R. Can. Inst. 29:23-31.
Klinka, K.; Nuszdorfer, F.C.; Skoda, L. 1979. Biogeoclimatic units of central and southern Vancouver Island. B.C. Ministry of Forests, Victoria, B.C. 120 pp.
Krajina, V.J. 1969. Ecology of forest trees in British Columbia. Pages l-146 in Krajina, V.J.; Brooke, R.C., eds. Ecology of western North Americz2(1).
Lotus Development Corporation. 1983 l Lotus 123: Release 1A. Lotus Development Corp., Cambridge, Mass.
Lyons, C.P. 1976. Trees, shrubs, and flowers to know in British Columbia. J.M. Dent and Sons (Canada) Ltd., Vancouver, B.C. 194 pp.
MacRae, D. 1970. This tight little island is determined not to blow it. Victoria Daily Times, B.C., Nov. 21:15.
Mapping Systems Working Group. 1981. A soi1 mapping system for Canada: revised. Land Resource Research Institute, Contribution No. 142, Agriculture Canada, Ottawa, Ont. 94 pp.
95
Mathews, W.H.; Fyles, J.G.; Nasmith, H.W. 1970. Postglacial crustal movement in northwestern British Columbia and adjacent Washington state. Can. J. Earth Sci. 7:690-702.
McKeague, J.A., ed. 1978 w Manual on soi1 sampling and methods of analyses, second edition. Prepared by Subcommittee of Canada Soi1 Survey Committee on methods of analysis. Canadian Society of Soi1 Science, Ottawa, Ont. 212 pp.
Miller, D.E. 1973. Water retention and flow in layered soi1 profiles. Pages 107-117 in Bruce, R.P.; Flach, K.W.; Taylor, H.M., et al., eds. Field soi1 watz regime. Special Publ. Series 5. Soi1 Science Society of America Inc., Madison, Wis.
Muller, J.E. 1977. Geology of Vancouver Island and Gulf Islands. Geological Survey of Canada, open file 463 (maps).
Muller, J.E.; Jeletzky, J.A. 1970. Geology of the Upper Cretaceous Nanaimo Group, Vancouver Island and Gulf Islands, Canada. Geol. Sur. Can. Paper69-25. 77 PP*
Pearse, P.H. 1982. Sidney Island is safe from desecration. Vancouver Sun, June 12:A5 (letter).
Rowe, J.S. 1977. Forest regions of Canada. Department of Fisheries and Environment, Ottawa, Ont. Can. For. Serv. Publ. 1300. 172 PP-
Smeck, N.E.; Norton, L.D.; Hall, G.F.; Bigham, J.M. 1980. Computerized processing and storing of soi1 descriptions and characterization data. Soi1 Sci. Soc. Am. J. 44:649-652.
Taylor, R.L.; MacBryde, B. 1977 l Vascular plants of British Columbia. Univ. B.C. Press, Bot. Gard. Tech. Bull. No. 4. 754 pp.
Valentine, K.W.G.; Lidstone, A. 1985. Specifications for soi1 survey intensity (survey order) in Canada. Can. J. Soi1 Sci. 65:543-553.
Williams, M.Y.; Pillsbury, R.W. 1958. The Gulf Islands of British Columbia. Can. Geogr. J. 6:184-201.
Winsby, J.A. 1973. Geology of the Upper Cretaceous Nanaimo Group, Saltspring Island, British Columbia. B.Sc. Thesis, Department of Geology, University of British Columbia, Vancouver, B.C. 34 PP*
Wischmeier, W.H.; Smith, D.D. 1978 l Predicting rainfall erosion losses - a guide to conservation planning. U.S. Department of Agriculture, Agric. Handb. 537. 58 PP.

APPENDIXES
97

APPENDIX 1. PROFILE DESCRIPTIONS AND ANALYTICAL DATA OF THE SOILS
This appendix is an alphabetical listing of profile descriptions and accompanying analytical data for most of the soils in the survey area. TO best represent the most common profiles for the soils mapped in the survey area, selections have also been made from profiles described on adjoining Gulf Islands.
Standard methods of soi1 analyses (McKeague 1978) were followed in Agriculture Canada's soi1 survey laboratory in Vancouver, B.C. The relative soi1 erodibility (K-value) for each horizon was determined, using the methodology described by Wischmeier and Smith (1978).
Profile descriptions and analytical data for the following soils are included:
Baynes soi1 ..................................................... Beddis soi1 ..................................................... Bellhouse soi.1 .................................................. Brigantine soi1 ................................................. Galiano soi1 .................................................... Mexicana soi1 ................................................... Musgrave soi1 ................................................... Parksville soi1 ................................................. Qualicum soi1 ................................................... Rumsley soi1 .................................................... Salalakim soi1 .................................................. Saturna soi1 .................................................... St. Mary soi1 ................................................... Tolmie soi1 ..................................................... Trincomali soi1 .................................................
Page 99
100-101 102
103-104 105
106-107 108
109-110 111 112 113 114
115-116 117
118-119
98

BAYNES SOIL
Location: along driveway to Madrona Studio, Mayne Island Landform: blanket of marine deposits Topography: very gentle slopes (2%), micromounded microtopography Parent materials: deep marine sand deposits Present land use: toast Douglas fir, red alder, and western sword fern Remarks: surface horizon (Ah) much deeper than typical Baynes profile, (Baynes sombric phase),
subsoil (BCg horizon) slightly cemented; commonly classified as Gleyed Dystric Brunis01
Longitude: 123°16'10"W Latitude: 48“51'50"N Elevation: 10 m Drainage: imperfectly Perviousness: moderately Effective rooting depth: 27 cm Classification: Gleyed Sombric Brunis01
PROFILE DESCRIPTION
Horizon Depth Color Texture Structure Consistence Mottles Coarse moist dry grade class kind dry moist fragments
-- (cm) (%)
Ah o-33 very dark gray very dark grayish sandy loam weak medium granular soft very none 15 (10YR 3/1) brown (10YR 3/2) to loamy to coarse friable
sand Bgj 33-66 grayish brown light olive brown sand weak medium subangular slightly very com.,coarse,dist. 20
(10YR 5/2) (2.5YR 5/4) to coarse blocky hard firm brown (10YR 4/3) BCg 66-135 light olive brown light olive gray sand weak coarse angular hard very many,coarse,dist. 2
(2.5YR 5/4) (5Y 6/2) blocky firm dark y. brown (10YR 4/6)
z cg 135-180 light gray light brownish 2ZY
massive slightly fit-m Com.,fine;prom. 1 (5 Y 7/2) gray (2.5Y 6/2) hard yellowish brown
(10YR 4/8)
ANALYTICAL DATA
Horizon pH Organic Total C:N Pvrophos. Cation exchanse Base Particle size distribution Soi1
Ca:l2 C N ratio Fe Al CEC Ca Mg K Na sat. Total Very Silt Clay erosion
sand fine sand
(%) (%) (%) (%) (mes/100 o soil) (%) (%) (%) (%) (%) (K value)
Ah 42 0:; 0.26 14 0.5 0.2 15.5 3.8 73 5 20 0.14 W
5:1 0.03 17 Oa Om2
Lt; i:: ts:: zi : 0.13
BCg i:;
0.02 25 3.5
cg 5.4 0.02 10 3:9
1.;
1:7 El vi i:: 5:
;4 s 0.10
86 5 ; 0.14

LF Ah
Bml
z Bm2 0
BC
Horizon Depth Color Texture Structure Consistence Mottles Coarse moist dry grade class kind moist wet fragments
(cm) (%)
2-o mat of dead needles and twigs o-5 black dark grayish sandy loam strong medium granular very nonsticky none 0
(10YR 2/1) brown (10YR 4/2) friable nonplastic 5-15 dark yellowish brown (10YR 5/3) loamy sand weak fine granular very nonsticky none 3
brown (10YR 3/4) blocky friable nonplastic 15-40 dark yellowish yellowish brown sand weak fine granular loose nonsticky none 5
brown (10YR 3/5) (10YR 5/4) nonplastic 40-70 olive brown light yellowish sand single loose nonsticky none 15
(2.5Y 4/4) brown (2.5Y 6/4) grain nonplastic 70-110 dark yellowish brownish yellow fine sand _ - massive very nonsticky none 0
brown (10YR 3/6) (10YR 6/6) friable nonplastic 110-120 light olive light gray fine sand weak medium to pseudo very nonsticky none 0
brown (2.5Y 5/4) (2.5Y 7/2) coarse blocky friable nonplastic cc 120-145 light olive light yellowish fine sand strong medium to pseudo very nonsticky none 0
brown (2.5Y 5/6) brown (2.5Y 6/4) coarse blocky friable nonplastic C2 145-150+ light olive light gray to fine sand moderate medium to pseudo very nonsticky none 0
brown (2.5Y 5/4) pale yellow coarse blocky friable nonplastic (2.5Y 7/3)
Bcj
Cl
BEDDIS SOIL
Location: 250 m east of picnic shelter at north end of large field on B.C. Provincial Park, Sidney Island
Landform: blanket of marine deposits Topography: crest of convex very gentle slopes (4%) Parent materials: coarse-textured marine deposit Present land use: forested, primarily toast Douglas fir and western red cedar
with understory of ocean spray and sala1 Remarks: tut bank along Strait of Georgia side of the Park; at 180 cm there is a stone line
below which marine clay occurs; in Ah granules appear to be earthworm fecal pellets; weakly cemented sands in Bcj horizon cari be crushed between fingers when dry; blocks disintegrate quickly in water; the Cc horizon is moderately cemented
PROFILE DESCRIPTION
Longitude: 123°19'20"w Latitude: 48°38'15"N Elevation: 30 m Drainage: well Perviousness: rapidly Effective rooting depth: 110 cm Classification: Orthic Dystric Brunisol

ANALYTICAL DATA
Horizon pH
C~~l *
Ah Bm Bfj BC Bcj
cc C2
Organic Total C:N Pvrophos. Cation exchanqe Base C N ratio Fe Al CEC Ca Mg K Na sat.
(%) (%) (%) (%) (meq/lOO q soil)
4.6 0.26 18 0.2 0.2 18.4 8.1 2.1 0.5 0.5
A:9 0.07 0.04 20 20 0.3 0.2 0.3 0.2 7.0 5.9 2.0 1.8 E i:i Ek: 0.1 0.1 ;:5
::: 0.3 0.1 0.3 0.1 0":;
3.: 1.6 0.7 0.1 0.2
0 8 0.0 0 3 4:7 ::: 1:3 0.1 0:4
(%)
Particle size distribution Total Very Silt Clay Sand fine
Sand (%) (%) (%) (%)
79 79
96
Ei
LE
; 16 19 ;
4 12 1
4 44 5
;
1 1
4 9 II
Soi1 erosion
(K value2
0.11 0.13 0.08 0.05 0.05 0.05 0.05 0.05

BELLHOUSE SOIL
Location: petroglyph site behind United Church, South Road, Gabriola Island Landform: colluvial veneer overlying smooth, sandstone bedrock Topography: nearly level (2%) within a moderate sloping (lO-15%) area with smooth
microtopography, southerly aspect
Longitude: 123"43'5O"W Latitude: 49°08'18"N Elevation: 45 m
Parent materials: shallow channery sandy loam to channery sand colluvial materials over Drainage: well
sandstone bedrock Perviousness: rapidly
Present land use: Garry oak and grasses with exposed sandstone bedrock, usually covered by moss, Effective rooting depth: 25 cm Classification: Orthic Sombric Brunisol
surrounded by toast Douglas fir Remarks: organic iron cementation (Bc horizon) is not common for Bellhouse soi1
PROFILE DESCRIPTION
Horizon Depth Color Texture Structure Consistence Mottles Coarse moist dry grade class kind moist
(cm) dry
f ra7T:nts 0
H 3-o Ah1 O-10 black dark brown sandy weak fine columnar slightly friable none 15
(10YR 2/1) (7.5YR 3/2) loam hard Ah2 10-20 black dark brown channery very medium subangular soft very none 40
(10YR 2/1) (10YR 3/3) sandy loam weak blocky friable Bm 20-23 dark yellowish dark brown brown channery very fine granular soft friable none 45
0' brown (10YR 4/4) (7.5YR 4/4) loamy sand weak
Bc 23-26 dark brown black sand strong massive ru (10YR 3/3)
rigid very fin none (10YR 2/1)
ANALYTICAL DATA
Horizon pH 0rg;nic Total C:N Pvrophos. Oxalate Cation exchange Base Particle size distribution Soi1
C& N ratio Fe Al Fe Al CEC Ca Mg K Na sat. Total Very Silt Clay erosion
sand fine - sand
(%) (%) (%) (%) (%) (%) (mes/100 q soil) (%) (%) (%) (%) (%) (K value)
H i::
18.0 1.3 0.3 0.6 0.6 0.6 47.4 13.8 0.4 37 Ah1 12.1 Ah2 5.8
E ;z 0.3 0.8 0.6 0.8 31.6 2.8 o-5 12 0.3 0.8 0.6 1.0 23.2 1.8 0:4
ii-?- 0:1 2
12 64 10
Fi 23 5 0.15 0.18
Bm Bc 2:: E 1;
0.2 0.8 0.5 1.8 21.4 0.5 0.5 1.8 1.5 12.4 ;:8 i:: ;:; El 8
l3; 15 4 0.06 89 9 2 0.08
R

BRIGANTINE SOIL
Location: Morgan Road Dyer's farm, Galiano Island Landform: blanket of marine deposits overlying subdued terrain Topography: gentle slope (7%), moderately mounded microtopography Parent materials: Present land use:
shallow sandy loam marine deposits overlying deep loam marine deposits forested, dominated by western red cedar and toast Douglas fir
Remarks: subsoil usually finer textured
PROFILE DESCRIPTION
Longitude: 123"21'5O'~W Latitude: 48°52'45"N Elevation: 130 m Drainage: imperfectly Perviousness: moderately Effective rooting depth: 67 cm Classification: Gleyed llystric Brunsiol
Horizon Depth Color Texture Structure Consistence Mottles Coarse moist class kind moist wet
(cm) dry grade
f ra%nt 0
Ah o-9 very dark brown dark brown sandy loam weak medium granular friable (10YR 2/2) (10YR 4/3) to coarse
Bml 9-31 dark brown yellowish brown sandy loam weak fine to subangular very (7.5YR 3/4) (10YR 5/4) medium blocky friable
Bm2 31-58 strong brown yellowish brown sandy loam weak to fine to subangular very (7.5YR 4/6) (10YR 5/4) moderate medium blocky friable
Bm3 58-67 dark yellowish yellowish brown sandy loam moderate fine to brown (10YR 4/6) (10YR 5/4) medium
s$;"kyular friable
IIBgl 67-76 olive pale yellow loam moderate medium to subangular friable (2.5Y 5/4) (2.5Y 7/4) coarse blocky
IIBg2 76-96 olive very pale brown loam moderate coarse angular firm (2.5Y 4/4) (10YR 7/4) to strong blocky
IICBg 96-115 olive light yellowish loam moderate coarse angular fin (2.5Y 4/4) brown (2.5Y 6/4) to strong blocky
nonsticky
slightly sticky slightly sticky slightly sticky sticky
sticky
sticky
none <lO
none Cl0
none <lO
none Cl0
com.,fine,prom. <5 strong brown (7.5YR 4/6)
many,medium,prom. <5 strong brown (7.5YR 4/6) few,fine,prom. <5 strong brown (7.5YR 5/6)

ANALYTICAL DATA
Horizon pH Organic Total C:N Pvrophos. Oxalate Cation exchanse Base Particle size distribution Soi1
cz12 C N ratio Fe Al Fe Al CEC Ca Mg K Na sat.
% Very Silt Clay erosion
fine sand
(%) (%) (%) (%) (%) (%) (meq/lOO q soil) (%) (%) (%) (%) (%) (K value)
Ah i.4 4.6 0.21 22 0.3 0.3 0.5 0.3 21.2 1.2 0.7 0.1 42 13 12 0.22 Em1
4:8 CI:: 0.06 20 0.3 0.3
Bm2 0.06 15 0.3 0.3 iii:5 E 10.1
?I1
9.8 213 ::: i:; 0:: ?l
si 10
25 10 0.26
63 11 0.23 Bm3 IIBgl i:: i.5
0.05 18 0.3 0.2 0.5 0.3 10.4 2.5 34 2:
11 0.24
0:4 0.03 17 0.1 0.1 0.5 0.1 12.1 0.: * if: - 0.: :5 11 0.38
IIBg2 5.0 0.02 20 0.4 0.1 14.3 9-i
0'2 Fi;
44 :':
9 0.43 IICBg 5.9 0.2 0.1 15.0 10:6
2:; FI:'1 0:3 91 45 44 10 0.40

GALIANO SOIL
Location: Yardarm Road, Magie Lake Estates, North Pender Island Landform: colluvial veneer overlying shale bedrock Topography: strongly sloping (25%) with a northerly aspect Parent materials: shallow very shaly silt loam colluvial materials overlying shale bedrock Present land use: residential subdivision Remarks: Bfj horizon, normally a Em horizon, meets a11 chemical requirements of Bf
horizon but not morphologically (color)
PROFILE DESCRIPTION
Longitude: 123“18'7"W Latitude: 48O46'30"N Elevation: 85 m Drainage: well Perviousness: rapidly Effective rooting depth: 40 cm Classification: Orthic Dystric Brunisol
Horizon Depth Color Texture Structure Consistence Mottles Coarse moist grade class kind dry moist fragments
(cm) dry
(%)
Ah o-9 very dark brown dark grayish very shaly weak fine granular soft very friable none 65 (10YR 2/2) brown (10YR 4/2) silt loam
Bfj 9-40 very dark grayish dark brown very shaly moderate coarse angular slightly friable none 65 brown (10YR 3/2) (10YR 4/3) silt loam blocky hard
C 40-55 dark brown brown very shaly strong coarse angular hard fi rm none 85 (10YR 4/3) (10YR 5/3) silt loam blocky
R 55+
z ANALYTICAL DATA
u-l Horizon pH 0rg;nic Total C:N Pvrophos. Cation exchange Base Particle size distribution Soi1
C& N ratio Fe Al CEC Ca Mg K Na sat. Total Very Silt Clay erosion
Sand fine sand
(%) (%) (X) (%) (meq/lOO q soil) (%) (%) (%) (%) (%) (K value)
Ah 4.9 7.1 0.34 21 23.2 16.5 2.4 1.1 0.2 87 14 Bfj 4.8 2.0 0.12 17 0.4 0.4 11.3 8.8 1.9 0.5 lOO+ 3: ; 52 14 E C 4.7 1.5 0.10 15 19.5 10.8 2.5 0.7 i:: 73 25 61 14 0:34

MEXICANA SOIL
Location: Mansell and Robinson Road junction, about 60 m towards Bullock Lake, Saltspring Island
Longitude: 123°30'10"W Latitude: 48'52'24"N
Landform: Topography:
morainal blanket, rolling to undulating landscape Elevation: 35 m strongly sloping (ZO-25%), southwest aspect, moderately mounded microtopography
Parent materials: Drainage: imperfectly
Present land use: sandy loam morainal materials cl00 cm deep forested with coastal Douglas fit-, western red cedar, red alder, bigleaf
Perviousness: moderately
maple, Effective rooting depth: 30 cm
and western sword fern Classification: Remarks: drainage is slower than is common for this soi1 in the Gulf Islands (commonly classified
Gleyed Dystric Brunisol
as Orthic Dystric Brunisol), but representative for the map area
PROFILE DESCRIPTION
Horizon Depth Color Texture Structure Consistence Mottles Coarse moist class kind moist wet
(cm) dry grade
f ra$ints 0
LF Ah
Bml
Bm2
c: Bwj m
Bg
BCg
2-o o-7 very dark brown
(10YR 2/2) 7-20 dark grayish
brown (10YR 4/4) 20-35 brown (10YR 5/3)
35-55 dark grayish brown (10YR 4/4)
55-65 yellowish brown (10YR 5/4)
65-85 light brownish gray (2.5Y 6/2)
85-110 light brownish gray (2.5Y 6/2)
llO-145+ olive brown (2.5Y 4/4)
dark grayish loam brown (1OYR 4/2) brown sandy loam (10YR 5/3)
very pale brown sandy loam (10YR 7/3) light yellowish sandy loam brown (10YR 6/4) brown (10YR 5/3)
sandy loam
light olive sandy loam moderate coarse angular brown (2.5Y 5/4) to strong blocky
light olive sandy loam brown (2.5Y 5/4)
strong coarse granular
weak to fine to subangular moderate medium blocky moderate medium angular to strong blocky moderate coarse angular to strong blocky moderate coarse platy to strong
moderate coarse angular to strong blocky
friable nonsticky none 5
friable nonsticky none 10
firm nonsticky none 10
fit-m nonsticky few,fine,faint 10
firm slightly common,fine,dist 10 sticky dark brown
(7.5YR 4/4) friable slightly many,fine.prom. 10
sticky strong brown (7.5YR 5/8)
fit-m slightly common.med.prom. 10 sticky dark brown
pale olive (5Y 6/3)
(7.5YR 4/4) sandy loam moderate coarse angular firm slightly 10
to strono blockv stickv

ANALYTICAL DATA
Horizon pH Organic Total C:N Pvrophos. Bulk Cation exchange Base Particle size distribution Soi1 C N ratio Fe Al densisy CEC Ca Mg K Na
CZl, sat. Total Very Silt Clay erosion
(g/cm 1 sand fine
(%) (%) (%) (%) sand
(meu/lOO q soi11 (%) (%) (%) (%) (%) (K value)
Ah 6.9 0.27 26 0.3 0.2 22.7 0.1 43 18 0.21 Bml 24 1.6 0.07 23 0.3 0.2 11.1 5:: K EL2 5; i: 34 10 0.33 Bm2 0.05 24 0.2 0.1 1:3 i:; :9 59 0.27 Bmgj 5-t 0-E 0.03 15 0.1 0.1 8.: 3.7" i:: 58 32' 10 0.30 Bg 5:o 014 0.03 14 0.1 0.1 1.76 8:6 3:8 i+; i:! i-z! 32 9 0.31 '3'2 0.03 10 1.74 11.4 2:2 0:: 68 Fi"8 11 0.29 cg 5-i ;:; 0.02 12 1.95 5.7 Es :1 0.32 C 5:9 0.1 0.01 13 1.98 !:8" 5:9 ::: i:: 0:2 ;2 :; 33 8 0.32
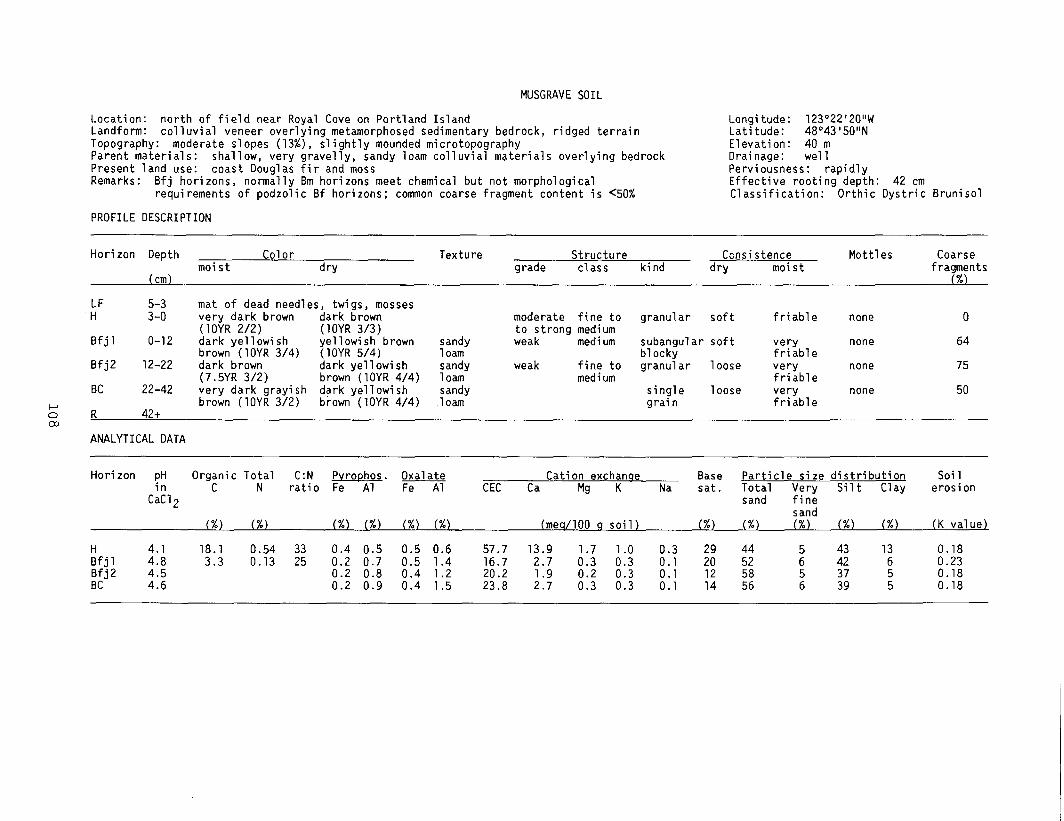
MUSGRAVE SOIL
Location: north of field near Royal Cove on Portland Island Landform: colluvial veneer overlying metamorphosed sedimentary bedrock, ridged terrain Topography: moderate slopes (13%), slightly mounded microtopography Parent materials: shallow, very gravelly, sandy loam colluvial materials overlying bedrock Present land use: toast Douglas fir and moss Remarks: Bfj horizons, notmally Bm horizons meet chemical but not morphological
requirements of podtolic Bf horizons; common coarse fragment content is <50%
PROFILE DESCRIPTION
Longitude: 123'=22'2O"W Latitude: 48“43'50"N Elevation: 40 m Drainage: well Perviousness: rapidly Effective rooting depth: 42 cm Classification: Orthic Dystric Brunisol
Horizon Depth Color Texture Structure Consistence Mottles Coarse moist dry grade class kind moist fragments
(cm) dry
(%)
LF mat of dead needles, twigs, mosses H 3:; very dark brown dark brown
(10YR 212) (10YR 3/3) Bfjl o-12 dark yellowish yellowish brown
brown (10YR 3/4) (10YR 5/4) Bfj2 12-22 dark brown dark yellowish
(7.5YR 3/2) brown (10YR 4/4) BC 22-42 very dark grayish dark yellowish
0' brown (10YR 3/2) brown (10YR 4/4)
R 42+ cn
ANALYTICAL DATA
sandy loam sandy loam sandy
.loam
moderate fine to granular soft friable none 0 to strong medium weak medium subangular soft very none 64
blocky friable weak fine to granular loose very none 75
medium friable single loose very none 50 grain friable
Horizon pH Organic Total C:N Pvrophos. Oxalate Cation exchanqe Base Particle size distribution Soi1
ca:,, C N ratio Fe Al Fe Al CEC Ca Mg K Na sat. Total Very Silt Clay erosion
sand fine sand
(%) (%) (%) (%) (%) (%) (mea/lOO q soil) (%) (%) (%) (%) (%) (K value)
H 4:: 18.1 0.54 33 0.4 0.5 0.5 0.6 57.7 13.9 1.7 1.0 0.3 2: 44 43 13 0.18 Bfjl 3.3 0.13 25 0.2 0.7 0.5 1.4 16.7 2.7 0.3 0.3 0.1 52
; 42 6 0.23
Bfj2 BC ::Fi
0.2 0.8 0.4 1.2 20.2 12 58 37 0.18 0.2 0.9 0.4 1.5 23.8 ::: i:: 0:: ;:i 14 56 5 39 5 0.18

PARKSVILLE SOIL
Location: old orchard near Princess Bay, Portland Island Landform: Topography:
blanket of marine deposits: overlying level terrain very gentle slope (3%) ~7th smooth microtopography
Parent materials: Present land use:
shallow sandy marine deposits overlying deep, silty clay marine deposits old orchard with grass
Remarks: common coarse fragment content of overlay material X20%; Ae horizon not typical for Parksville soi1
PROFILE DESCRIPTION
123"22'1O"W Longitude: Latitude: 48°43'15"N Elevation: 10 m Drainage: poorly Perviousness: moderately Effective rooting depth: 60 cm
Classificaton: Orthic Humic Gleysol
Horizon Bepth Color Texture Structure Consistence Mottles Coarse moist class kind moist
(cm) dry grade dry fragments
(%)
L-H AP
Awj
bl
Bg2
z ul IICgl
IICg2
2-o o-15 black
(10YR 2/2) 15-23 dark grayish
brown (2.5Y 4/2) 23-50 olive brown
(2.5YR 4/3) 50-60 olive brown
(2.5Y 4/3)
60-110 dark greenish ww (5 GY 4/1)
110-150 olive (5Y 4/3)
dark grayish brown (10YR 4/2) light brownish gray (2.5Y 6/2) grayish brown (2.5Y 5/2) light brownish gray (2.5Y 60)
v-w (5Y 6/1)
pale olive (5Y 6/3)
sandy loam sand
sand
sand
silty moderate medium clay to strong
silty clay
weak medium
weak medium
weak medium
weak to medium moderate weak to medium moderate
granular
single grain single grain single grain
pseudo angular blocky pseudo angular
soft very none 21 friable
loose loose few. fine, faint 34
loose loose com., fine, prom. 42 brown (7.5YR 5/5)
loose loose many, fine, prom. 32 strong brown (7.5YR 5/6)
hard fitm many, medium, prom. 0 dark yellowish brown (10YR 4/4)
hard fit-m many, medium, prom. 0 brown (10YR 4/3)

ANALYTICAL DATA
Horizon pH Organic Total C:N Pvrophos. Oxalate Cation exchanse Base Particle size distribution Soi1
CZl, C N ratio Fe Al Fe Al CEC Ca Mg K Na sat. Total Very Silt Clay erosion
sand fine L sand
(%) (%) (%) (%) (SO) (%) (meq/lOO o soi11 (%) (%) (%) (X) (X) (K value)
AP 5.4 0.5
0.34 10 0.1 0.2 0.4 0.3 19.2 12.0 70 76 14 10 0.11 Aesj 5::
0:4 0.03 16 0.1 0.1 0.2 0.2 4.5 k4 3 0:: 77 3' 0.13
QI1 0.02 22 0.3 0.2 5.0 3:;
0:5 0:1 i:; 78 8;
2 : z
0.11 Bg2 5.6 0.2 0.1 2.7 O-l 91 7 2 0.12 IICgl
5:: 0.4 0.3
27.:
25:7 17.1
i-3
IICg2 0.3 0.3 14.4 8:5 i:; 0::
8: z 0.26
93 ; 3 :9 42 0.32
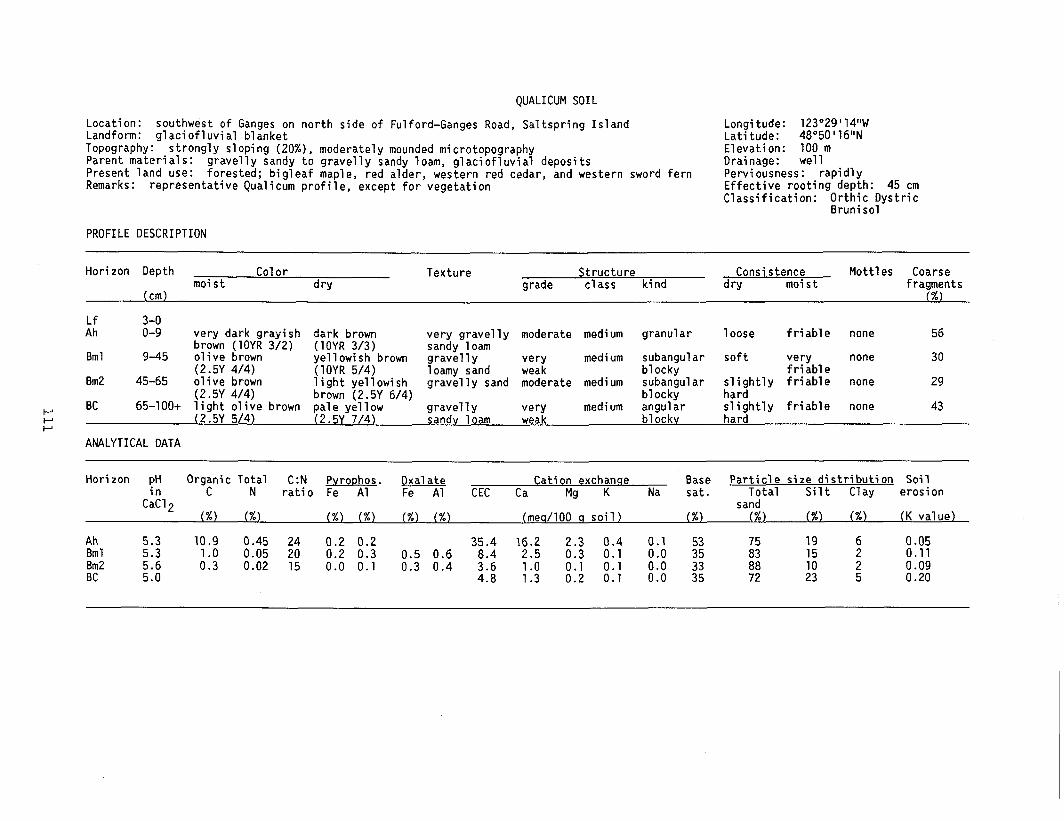
QUALICUM SOIL
Location: southwest of Ganges on north side of Fulford-Ganges Road, Saltspring Island Longitude: 123029'14"W Landfotm: glaciofluvial blanket Latitude: 48°50'16"N Topography: strongly sloping (20%), moderately mounded microtopography Elevation: 100 m Parent materials: Drainage: well Present land use:
gravelly sandy to gravelly sandy loam, glaciofluvial deposits forested; bigleaf maple, red alder, western red cedar, and western sword fern Perviousness: rapidly
Remarks: representative Qualicum profile, except for vegetation Effective rooting depth: 45 cm Classification: Orthic Dystric
Brunis01
PROFILE DESCRIPTION
Horizon Depth Color Texture Structure Consistence Mottles Coarse moist dry grade class kind dry moist fragments
(cm) (%)
Lf Ah i-9 very dark grayish dark brown very gravelly moderate medium granular loose friable none 56
brown (10YR 3/2) (10YR 3/3) Bml 9-45 olive brown
sandy loam yellowish brown medium subangular soft very none 30
(2.5Y 414) gravelly very
(10YR 5/4) Bm2 45-65 olive brown
loamy sand weak blocky friable light yellowish gravelly sand moderate medium subangular slightly friable none 29
(2.5Y 4/4) brown (2.5Y 6/4) blocky hard
I-J BC 65-100+ l;gk; ;)Te brown pale yellow gravelly very medium angular slightly friable none 43
r ( . 1 (2.5Y 7/4) sandv loam weak blockv hard
ANALYTICAL DATA
Horizon pH Organic Total C:N Pvrophos. Oxalate Cation exchanue Base Particle size distribution Soi1
CZl, C N ratio Fe Al Fe Al CEC Ca Mg K Na sat. Total Silt Clay erosion
sand (%) (%) (%) (%) (%) (%) (mes/100 q soil) (X) (%) (%) (X) (K value)
Ah 5.3 10.9 0.45 24 0.2 0.2 35.4 16.2 i:i: 0.4 0.1 :s 75 19 5 0.05 Bml 5.8 A:3 0.05 20 0.2 0.3 0.5 0.6 25 0.11 Bm2
5:o 0.02 15 0.0 0.1 0.3 0.4
2
4:8 1'0
BC 1:3 0"::
0-i
0:1
0-i
0:o E
ii 1: 5 0.09
72 23 0.20

RUMSLEY SDIL
Location: 200 m east of big field (pasture) on shallow to bedrock area, Sidney Island Landform: colluvial veneer overlying metamorphosed intrusive bedrock; rocky, ridged terrain Topography: gentle slope (6%), moderately mounded microtopography Parent materials: shallow, gravelly sandy loam colluvial materials overlying bedrock Present land use: Remarks:
toast Douglas fir, bunch grass, and mosses normally, profile has Bm horizons and is classified as an Orthic Dystric Brunis01
PROFILE DESCRIPTION
Longitude: 123“17'45"W Latitude: 48°36'20"N Elevation: 60 m Drainage: well Perviousness: moderately Effective rooting depth: 65 cm Classification: Orthic Humo-Ferric Podzol
Horizon Depth Color Texture Structure Consistence Mottles Coarse moist dry grade class kind dry moist fragments
(cm) (%)
LFH Bfl i-:0 dark brown brown to dark loam weak very granular soft very none 19
(7.5YR 3/2) brown (10YR 4/3) fine friable Bf2 10-25 dark brown dark yellowish sandy loam weak fine granular soft very none 33
(7.5YR 3/4) brown (10YR 4/4) friable Bm 25-45 dark brown dark yellowish sandy loam weak fine granular soft very none 50
(7.5YR 3/4) brown (10YR 4/4) friable BC 45-65 dark brown dark yellowish sandy loam weak medium subangular soft very none 25
F (7.5YR 3/2) brown (10YR 4/4) blocky friable
R 65+ N
ANALYTICAL DATA
Horizon pH Organic Total C:N Pvrophos. Oxalate Cation exchanae Base Particle size distribution Soi1
cac1, C N ratio Fe Al Fe Al CEC Ca Mg K Na sat. Total Very Silt Clay erosion
sand fine sand
(%) (%) (%) (%) (%) (%) (mea/lOO a soil) (%) (%) (%) (%) (%) (K value)
Bfl 4:: 6.5 0.33 20 0.3 1.1 0.6 1.5 27.2 6.7 0.8 0.5 0.2 30 48 0.23 Bf2 4:: 0.19 18 0.2 1.0 0.5 1.5 19.6 l2
4: : 48
4 0.26
Bm3 4:; 0.22 18 0.2 1.1 0.4 1.7 23.0 A.8
BC 0.3 1.5 0.4 1.8 37.4 1:1
i*:
0:2
ii*;
0:2
Fi*;
0:1 2 56 4 ;; 4 0.22
8 5 0.23

SALALAKIM SOIL
Location: Gowlland Point Road, South Pender Island Landform: Topography:
colluvial blanket, ridged terrain extremely sloping (65%), with southerly aspect, slightly mounded microtopography
Parent materials: Present land use:
gravelly loam, colluvial materials over conglomerate bedrock forested; toast Douglas fir, Pacifie madrone, grasses, hairy honeysuckle, and common gorse
Remarks: profile deeper (Cil00 cm), finer textured, and slower perviousness than common Salalakim soi1
Longitude: 123"12'43"W Latitude: 48"44'26"N Elevation: 55 m Drainage: well Perviousness: moderately Effective rooting depth: 78 cm Classification: Orthic Dystric
Brunis01
PROFILE DESCRIPTION
Horizon Depth Color Texture Structure Consistence moist
Mottles Coarse class kind moist
(cm) dry grade dry fragments
(%)
Ah o-4 dark brown dark brown (7.5YR 3/2)
gravelly loam (7.5YR 4/2)
Bml 4-33 dark brown dark brown (7.5YR 3/2)
gravelly loam
Bm2 33-78 dark brown (7.5YR 4/2) to sandy loam dark brown
(7.5YR 4/2) gravelly loam
BC 78-120+ dark brown (7.5YR 4/2) to sandy loam brown
(7.5YR 3/2) gravelly loam
(7.5YR 5/2) to sandv loam
2 ANALYTICAL DATA
moderate fine granular hard friable none 35 to strong moderate very subangular hard friable none 35
fine blocky moderate very subangular hard friable none 40
fine blocky weak to fine subangular hard friable none 30 moderate blockv
Horizon pH Organic Total C:N Pvrophos. Cation exchanqe Base Particle size distribution Soi1
C:cl2 C N ratio Fe Al CEC Ca Mg K Na sat. Total Very Silt Clay erosion
sand fine sand
C%l (%) C%) (%) (meq/lOO g soil) (%) (X) (%) (%) (%) (K value)
Ah Z:Z 3.9 0.27 14 0.1 0.0 23.2 47 13 0.24
Bml 1.0 0.06 17 0.1 0.1 21.6 2; i; 52 14 z9 K 0.39 Bm2 ::7 3 0.09 21 0.1 0.1 21.9 52 13 BC
i:: 2 z:
0.20 0.06 17 0.1 0.1 17.8 51 11 0.30

SATURNA SOIL
Location: south atm of Hess Road, 100 m before dead end, 10 m east in trees, Gabriola Island Landfonn: colluvial veneer over sandstone bedrock, rolling landscape Topography: moderate to strong slopes (15%) southerly aspect, slightly mounded microtopography Parent materials: sandy loam colluvial materials over sandstone bedrock Present land use: forested; toast Douglas fir, and sala1 Remarks: Ah deeper and textures finer than typical Saturna soil; commonly classified as
Orthic Dystric Brunis01
PROFILE DESCRIPTION
Longitude: 123°47'30"w Latitude: 49"09'20"N Elevation: 140 m Drainage: well Perviousness: rapidly Effective rooting depth: 60 cm Classification: Orthic Sombric Brunisol
Horizon Depth Color Texture Structure Consistence Mottles Coarse moist grade class kind dry moist fragments
(cm) dry
(%)
LF 3-o Ah o-1 1 very dark grayish brown to dark channery
brown(lOYR 3/2) brown(7.5YR 4/2) loam Bml 11-30 brown.dark brown dark brown channerv
(lOYR'4/3) (7.5YR 3/2) loam to" sandy loam
Bm2 30-50 brown,dark brown brown, dark very (10YR 4/3) brown(7.5YR 4/4) channery
F sandy loam
CE 50-80 yellowish brown brown, dark .E
very (10YR 5/4) brown(7.5YR 4/4) channery
sandv loam
strong coarse granular slightly friable none 20 hard
strong medium angular slightly friable none 25 blocky hard
moderate medium angular slightly friable none 60 blocky hard
weak very angular slightly friable none 90 fine blocky hard
ANALYTICAL DATA
Horizon pH Organic Total C:N Pvrophos. Oxalate Cation exchanqe Base Particle size distribution Soi1
Ca;l~ C N ratio Fe Al Fe Al CEC Ca Mg K Na sat. Total Very Silt Clay erosion
sand fine
(%) (%) sand
(%) (%) (%) (%) (meo/lOO o soil) (%) (%) (%) (%) (%) (K value)
LF 4.9 :-9
36.2 7.1 0.37 1.30 28 19 0.0 0.2 0.1 0.2 i.4 i.3 ;i.; 32.7 11.5 2 El K 2; 48 10 42 10 0.24 Bml
4:8 1.5 0.09 17 0.2 0.2 0:4 0:3 19:o 1'7 0'5 52 11 10 0.30
Bm2 1.3 0.08 16 0.2 0.2 0.5 0.5 17.1 E 1:3 0:5 ::1 :2 55 3: 11 0.24 CB 4.8 0.1 0.1 0.5 0.3 53 40 7 0.28
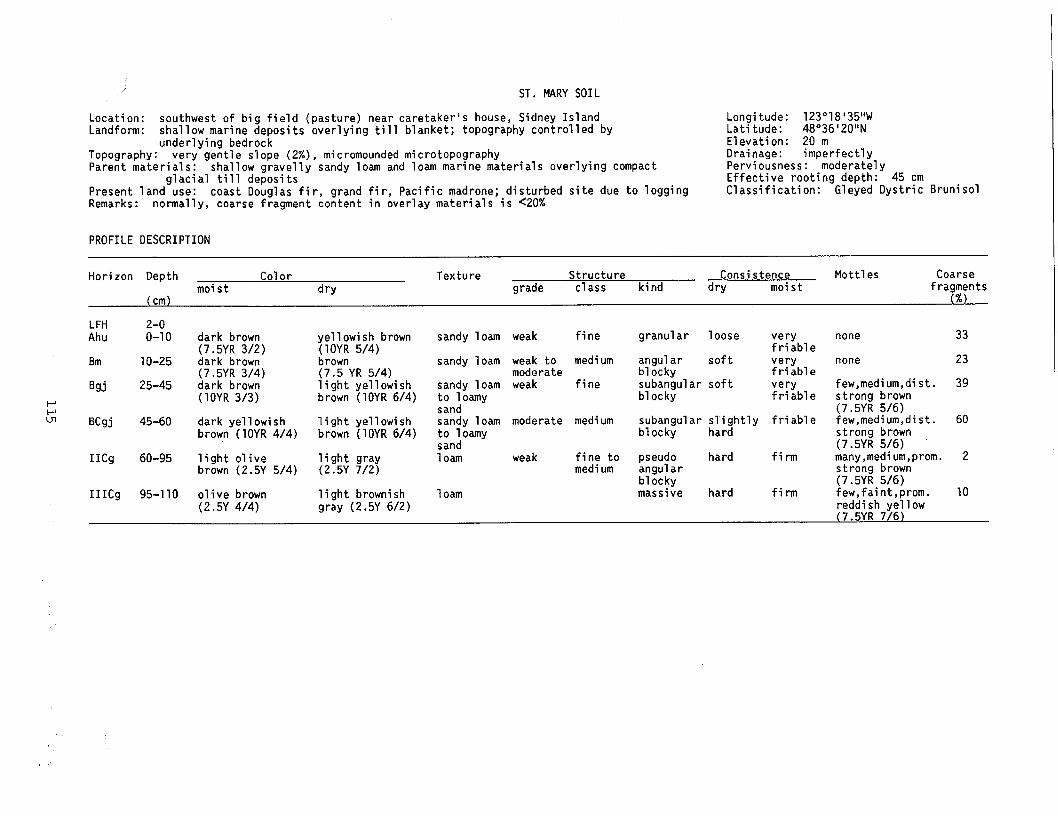
ST. MARY SOIL
Location: southwest of big field (pasture) near caretaker's house, Sidney Island Landfotm: shallow marine deposits overlying till blanket; topography controlled by
underlying bedrock Topography: very gentle slope (2%), micromounded microtopography Parent materials: shallow gravelly sandy loam and loam marine materials overlying compact
glacial till deposits Present land use: toast Douglas fir, grand fir, Pacifie madrone; disturbed site due to logging Remarks: nonnally, coarse fragment content in overlay materials is <ZD%
Longitude: 123"18'35"W Latitude: 48O36'20"N Elevation: 20 m Drainage: imperfectly Perviousness: moderately Effective rooting depth: 45 cm Classification: Gleyed Dystric Brunis01
PROFILE DESCRIPTION
Horizon Depth Color Texture Structure Consistence Mottles Coarse moist dry grade class kind dry moist fragments
(cm) (%)
LFH 2-o Ahu O-10 dark brown yellowish brown sandy loam weak fine granular loose very none 33
(7.5YR 3/2) (10YR 5/4) friable Bm 10-25 dark brown brown sandy loam weak to medium angular soft very none 23
(7.5YR 3/4) (7.5 YR 5/4) moderate blocky friable W 25-45 dark brown light yellowish sandy loam weak fine subangular soft very few,medium,dist. 39
(10YR 3/3) brown (10YR 6/4) to loamy blocky friable strong brown
n sand (7.5YR 5/6)
BW 45-60 dark yellowish light yellowish sandy loam moderate medium subangular slightly friable few,medium,dist. 60 brown (10YR 4/4) brown (10YR 6/4) yomY blocky hard strong brown
(7.5YR 5/6) IICg 60-95 light olive light gray loam weak fine to pseudo hard fi rm many,medium,prom. 2
brown (2.5Y 5/4) (2.5Y 7/2) medium angular strong brown blocky (7.5YR 5/6)
IIICg 95-110 olive brown light brownish loam massive hard firm few,faint,prom. 10 (2.5Y 4/4) gray (2.5Y 6/2) reddish yellow
(7.5YR 7/6)

ANALYTICAL DATA
Horizon pH 0rg;nic Total C:N Pvroohos. Oxalate Cation exchanqe Base Particle size distribution Soi1
C& N ratio Fe Al Fe Al CEC Ca Mg K Na sat. Total Very Silt Clay erosion
sand fine sand
(%) (%) (%) (%) (%) (%) (meo/lOO q soil) (%) (%) (%) (%) (%) (K value1
Ahu Bm b3j EGO
4.8 2.3 0.15 18 0.2 0.3 0.5 0.4 13.1 3.3 0.8 0.2 72 22 6 0.12 5:; i:: 0.09 0.07 19 16 0.3 0.2 0.3 0.3 0.6 0.4 0.5 10.4
27 0 9 1:o
0.3 i:; 4: 72 4 0.5 8.9
i.2 i:: :7 75 4 si 5 kz3
i:: 0.2 0.2 0.4 0.4
IICg 0.4 0.2 1::: 4-T 0:20
5:9 :*: 5:3
0'1 14 8
0:1 ::5 61 i: 9 18 0.35
IIICg 5.5 0.3 0.1 15.1 79 45 9 4: 15 0.39
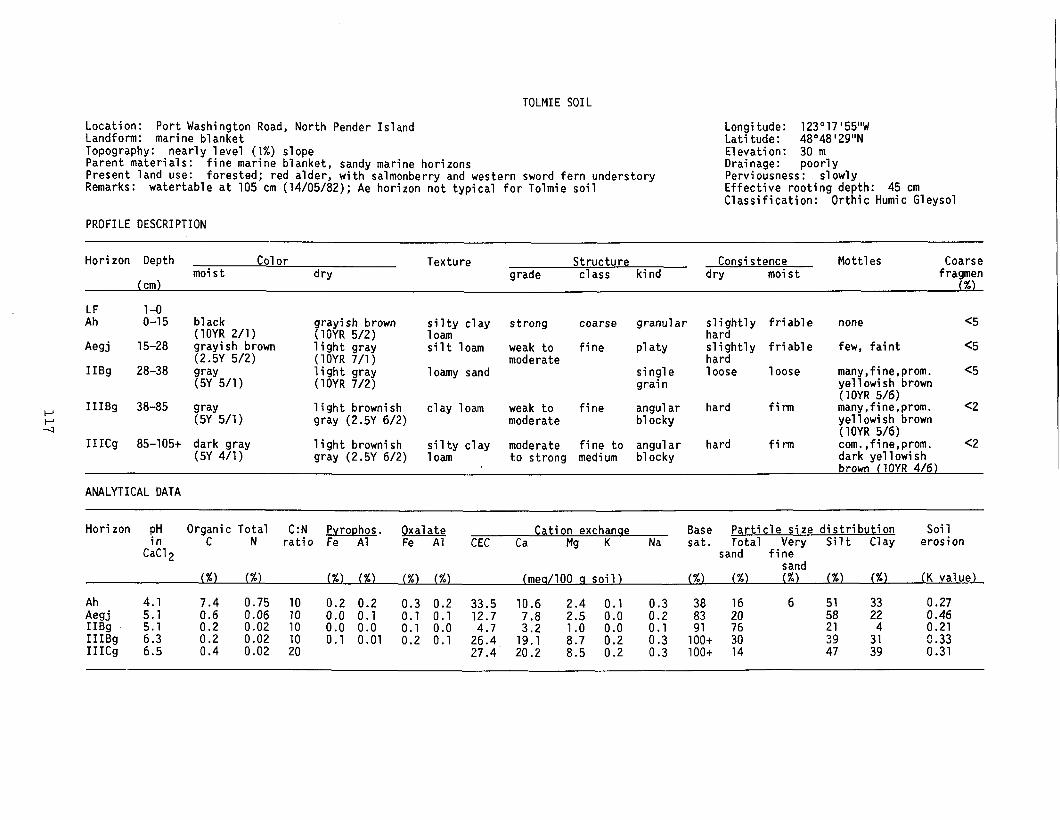
TOLMIE SOIL
Location: Port Washinoton Road. North Pender Island Lonaitude: 123=.17'55"W Landform: marine blanket Topography: nearly level (1%) slope Parent materials: Present land use:
fine marine blanket, sandy marine horizons
Remarks: forested; red alder, with salmonberry and western sword fern understory
watertable at 105 cm (14/05/82); Ae horizon not typical for Tolmie soi1
PROFILE DESCRIPTION
Latrtude: 48"48'29"N Elevation: 30 m Drainage: poorly Perviousness: slowly Effective rooting depth: 45 cm Classification: Orthic Humic Gleysol
Horizon Depth Color Texture Structure Consistence Mottles Coarse moist dry class kind moist
(cm) grade dry
f ra,;n 0
kF 1-o o-15 black
(10YR 2/1) grayish brown (10YR 5/2)
silty clay strong coarse granular slightly friable none <5 loam hard
Aegj 15-28 grayish brown (2.5Y 5/2)
light gray silt loam weak to fine platy slightly friable few, faint <5 (1OYR 7/1) moderate hard
IIBg 28-38 way loose loose many,fine,prom. <5 (5Y 5/1)
light gray loamy sand single (1OYR 7/2) grain yellowish brown
(10YR 5/6) IIIBg 38-85 9-w light brownish clay loam weak to fine angular hard firm many,fine,prom. <2
(5Y 5/1) gray (2.5Y 6/2) moderate blocky yellowish brown (10YR 5/6)
IIICg 85-105+ ;l;;k4T;T light brownish silty clay moderate fine to angular hard firm com.,fine,prom. <2 gray (2.5Y 6/2) loam to strong medium blocky dark yellowish
brown (10YR 4/6)
ANALYTICAL DATA
Horizon pH Organic Total C:N Pvrophos. Oxalate Cation exchanqe Base Particle size distribution Soi1
c121, C N ratio Fe Al Fe Al CEC Ca Mg K Na sat. Total Very Silt Clay erosion
sand fine sand
(%) (%) (%) (%) (%) (%) (mes/100 n soil) (%) (%) (%) (%) (X) (K value)
Ah 4.1 0::
0.75 10 0.2 0.2 0.3 0.2 33.5 10.6 6 0.27 Aegj 5.1 0.06 10 0.0 0.1 0.1 0.1 12.7 ::5 0":; 0":; ;3 :o 5: 22 0.46 IIBg 5-i i-2 0.02 10 0.0 0.0 0.1 0.0 26.4
i:; A*: El2 k3 91 ;i 21 4 0.21
IIIBg 6:5 0:4
0.02 10 0.1 0.01 0.2 0.1 IIICg 0.02 20 27:4'
:::: 8:5 0:2 0:3
lOO+ ii7 2 0.33 lOO+ 14 0.31

TRINCOMALI SOIL
Location: 700 m from turnoff to village before bend in road heading towards
Landform: farm at south end of Kuper Island
Topography: marine veneer overlying glacial till blanket, rolling landscape
moderate slopes (12%), slightly mounded microtopography Parent materials: shallow, gravelly loamy Sand marine deposits overlying gravelly sandy
loam, glacial till deposits with red alder, Present land use:. second-growth'coast Douglas fit-, western red cedar,
Remarks: bigleaf maple. and Pacifie madrone; ground caver of sala1
drainage slower than usual for this soi1 in the Gulf Islands as Orthic Dystric Brunisol), but representative for the map nontypical vegetation species
(commonly classified area; slower drainage reflects
PROFILE DESCRIPTION
Longitude: 123'38'2O"W Latitude: 48O58'5"N Elevation: 60 m Drainage: imperfectly Perviousness: slowly Effective rooting depth: 60 cm Classification: Gleyed Dystric Brunisol
Horizon Depth Color Texture Structure moist
Consistence Mottles Coarse
(cm) dry grade class kind dry moist fragments
(X)
LF Ah
Bf
;Ii dark brown (7.5YR 3/2)
4-12 reddish brown
dark brown (10YR 3/3) reddish brown (5YR 5/4) brown (7.5YR 5/4) light yellowish brown (10YR 6/4) light yellowish brown (2.5Y 6/4)
gravelly loamy Sand gravelly loamy Sand gravelly loamy Sand gravelly Toamy Sand sandy loam
weak medium granular soft very to coarse friable
weak medium subangular loose very blocky friable
weak medium subangular loose very blocky friable
weak medium subangular loose very blocky friable
moderate coarse subangular soft very blocky friable
none 50
none 40
none 40
none 30
few,coarse,faint 15 yellowish brown (10YR 5/6) many, coarse,dist. 30 brown to dark brown (7.5YR 4/4) common,medium,dist. 25
r (5YR 4/3)
Bml 12-50 dark reddish m
Bm2 50-60 brown (5YR 3/4) dark yellowish
IIBCgj 60-65 brown (10YR 4/4) olive brown (2.5Y 4/4)
IICg 65-80 grayish brown (2.5Y 5/2)
light gray gravelly weak fine to (2.5Y 7/2)
pseudo very extremely sandy loam medium platy hard firm
light brownish gray (2.5Y 6/2)
gravelly moderate fine pseudo extremely extremely loamy Sand to platy hard fit-m
stronq brown to dark brown (7.5YR 4/4)
IICcg 80-lOO+ olive brown (2.5Y 4/4)

ANALYTICAL DATA
Horizon
LF Ah Bf Bml Bm2 IIBCgj IICg IICcg
PH Organic Total
CiCI 2 C N
(%) (%)
4.: 41.9
418 ?Ei .
0.25 1.54
0.09
;:FI ;:: 0.05 0.04
4.: 4:7
C:N Pvroohos. ratio Fe Al
(%) (%)
25 0.3 0.5 ;2, 0.2 0.4
0.1 0.3 15 0.1 0.2
0.0 0.2 0.1 0.3 0.1 0.2
Oxalate Fe Al
(%) (%)
0.7 0.7 0.8 0.9 0.7 0.9 0.6 0.9 0.4 0.8 0.3 0.6 0.6 0.5
Cation exchanse Base CEC Ca Mg K Na sat.
(meo/lOO g soil)
24.5 11.4 ::; i-3 E i-0
418 i?;
1.4 0:2 a:1 0:o
0":; 0":: 0.0 0.: 6.4 6.0
0:: ::1 E 0:o
0'0 0:1
L
E 21
1; 16 17
Particle size distribution Total Very Silt Clay sand fine
sand (%) (%) (%) (X)
Soi1 erosion
(K value)
0.20 0.22 0.25 0.17 0.39 0.44 0.40

APPENDIX 2. SOIL MOISTURE DATA FOR THE SOIL PROFILES
Table 2.1 includes data on available water storage capacity (AWSC) and the Atterberg limits of the minera1 soils for the same profiles as in Appendix 1.
AWSC represents the amount of water that cari be extracted from the soi1 by plants or is available for plant use. Quantitatively, it is determined by the arithmetic difference between percent water at field capacity (1/3 atm.) and permanent wilting point (15 atm.). AWSCs have been determined for horizons in about the top 50 cm of the soil.
The Atterberg limits (liquid and plastic limits) measure the effect of moisture on the consistence of the soi1 material. This engineering property of the soi1 varies with the amount of water present. Atterberg limits have been determined for the subsoil (BC and C) horizons. The plasticity index is the arithmetic difference between the liquid and plastic limits. Some soils are nonplastic (NP).
The methods for the determination of AWSC and Atterberg limits are described by McKeague (1978).
120

Table 2.1 Selected soi1 moisture data for the soi1 profiles
Soi1 Horizon Depth AWSC
(cm) C%l
Liquid Plastic Plasticity limit limit index
($1 C%l (%)
Baynes Ah o-33 Bgj 33-66 BCg 66-135 CG 135-180
Beddis Ah o-5 11 Bm 5-15 6 Bfj 15-40 4 BC 40-70 1 Bcj 70-110 4 Cl 110-120 3 cc 120-145 4 c2 145-150+ 4
Bellhouse Ah1 O-10 Ah2 10-20 Bm 20-23 C 23-26+
Brigantine Ah o-9 Bml 9-31 Bm2 31-58 IICBg 96-115
Galiano Ah Bfj C 40-55+
Mexicana AP o-7 Bml 7-20 Bm2 20-35 Bgj 35-55 BCg 65-85 Cl 85-110 c2 llO-145+
13 2
29 19 11
13 7 7
21 19 17
17
8 6 6
5
NPS NP NP NP NP NP
NP NP NP NP NP NP NP NP NP
NP NP NP
20 18 2 22 17 5
33 28 5
NP NP NP
NP NP NP NP NP NP
(continued)
121
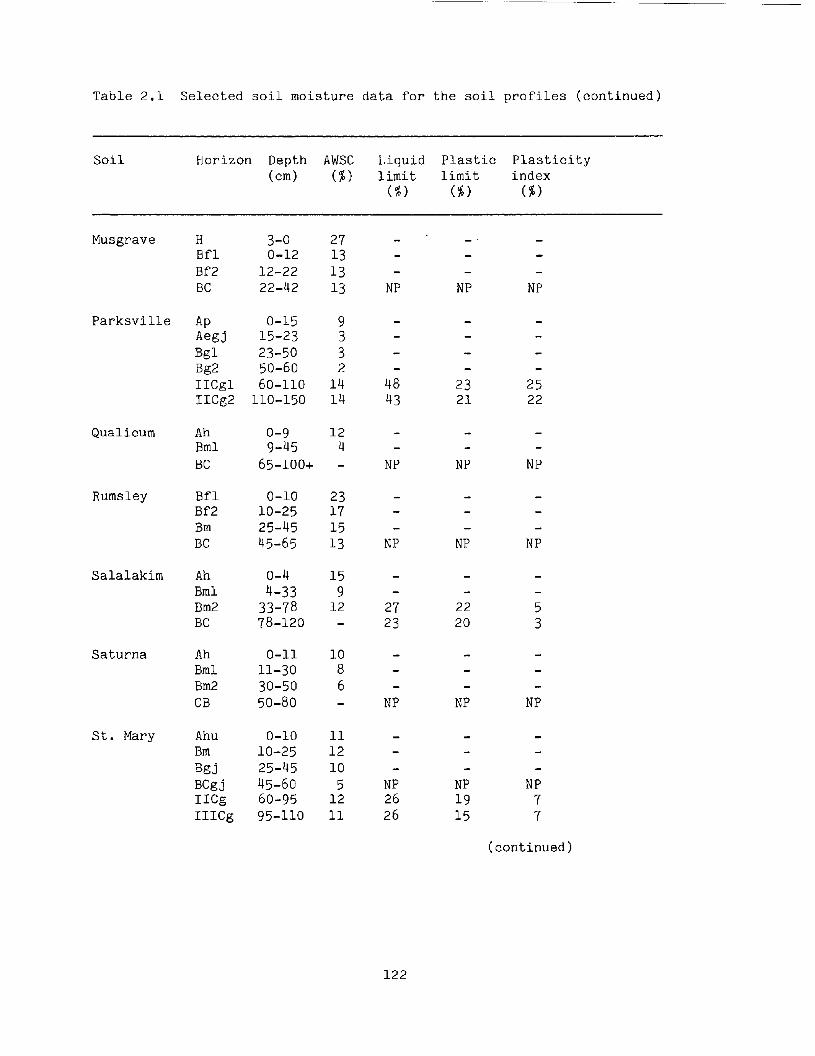
Table 2.1 Selected soi1 moisture data for the soi1 profiles (continued)
Soi1 Horizon Depth AWSC Liquid Plastic Plasticity (cd (%> limit limit index
C%l C%l (%)
Musgrave
Parksville
Qualicum
Rumsley
Sa la lakim
Saturna
St. Mary
H 3-o 27 Bfl o-12 13 Bf2 12-22 13 BC 22-42 13
AP o-15 9 A& 15-23 3 Bd 23-50 3 Bis2 50-60 2 IICgl 60-110 14 IICg2 110-150 14
Ah Bml BC
o-9 9-45
65-lOO+
12 4
Bfl O-10 23 Bf2 10-25 17 Bm 25-45 15 BC 45-65 13
Ah o-4 Bml 4-33 Bm2 33-78 BC 78-120
15 9
12
Ah o-11 Bml 11-30 Bm2 30-50 CB 50-80
10 8 6
Ahu O-10 11 Bm 10-25 12 Bd 25-45 10 BW 45-60 5 IICg 60-95 12 IIICg 95-110 11
NP NP NP
48 23 25 43 21 22
NP NP NP
NP NP NP
27 22 5 23 20 3
NP NP NP
NP NP NP 26 19 7 26 15 7
(continued)
122

Table 2.1 Selected soi1 moisture data for the soi1 profiles (concluded)
Soi1 Horizon Depth AWSC (cm) (8)
Liquid Plastic Plasticity limit limit index
(%) (%) C%l
Tolmie Ah o-15 Aegj 15-28 IIBg 28-38 IIICgl 85-105 IIICg2 at 225
Trincomali Ah o-4 Bf 4-12 Bml 12-50 IICg 65-80 IICcg 80-100
62 51 9
15 8
10
46 21 25 51 25 26
NP NP
NP NP
NP NP
* Nonplastic.
123

Recycled Papier Paper recyclé