Soil Water and Salinity Movement and Management of ... and Energy/sustainable land...Maintaining...
31
Welcome to Xinjiang Zhao Chengyi, Sheng Yu, Han Ming, Li Jun AKSU Water Balance Experimental Station [email protected] Soil Water and Salinity Movement and Management of Farmland in Tarim River Basin
Transcript of Soil Water and Salinity Movement and Management of ... and Energy/sustainable land...Maintaining...

Welcome to Xinjiang
Zhao Chengyi, Sheng Yu, Han Ming, Li Jun AKSU Water Balance Experimental Station
Soil Water and Salinity Movement and
Management of Farmland in Tarim River Basin
Brief Introduction of Akesu Water Balance
Experimental Station
Soil Water and Salinity movement and Management
of Farmland in Tarim River Basin
Outlines

E80˚45′
N 40˚37′
Sea Level 1028 m
Urumqi
1100 km
Precipitation<50 mm
Evaporation>2500 mm
AKSU Water Balance Experimental Station

The extreme arid zone is 10 million km2 in the world China accounted for 1/5
Oasis Area 9.3%,95%of Population
China Oasis Map
Akesu Station
Evaporation: 2500-3000 mm;
Annual rainfall: < 50 mm;
Aridity:1.5- 4
Challenges on Sustainable Irrigation

Background of Tarim
River Basin
Rich in nature resources, but friable in ecosystem
Main Research
● Process of water, salt and heat
exchange in oasis cropland ecosystem.
● Theory of water-saving irrigation in
oasis cropland and new technology.
● Water and salt balance from soil
profile to watershed scale and water
resource management

Xinjiang Irrigation Experimental Station
AKSU Water Balance Experimental
Station, CAS
Agro-ecological Station, Chinese
Ecosystem Research Network (CERN)
1982
2002
2005 National Field Research Station of Agro-
ecosystem
2008
History of AKSU Station

Equipment
34 meters
meteorological tower Laser-radar emission instrument

PTM-48M system

Platform for monitoring oasis cropland system
Station---Farm---Basin

Sketch map of mountain ,oasis and desert(MOD)
Soil Water and Salinity movement and Management
of Farmland in Tarim River Basin

Challenges on Sustainable Irrigation
●Drip irrigation farmland is approximately 2 million hm2 in Xinjiang.
●Improve the utilize efficient of canal water from 0.48 to 0.65,
●Save water resource 1.0 billion cubic meter.
Drip irrigation in
Xinjiang
Water Saving Strategies
Maximum or optimal yield?
Shallow groundwater management
Sequential water use
Sequential land use
Ecosystem effect???

Soil water movement under drip irrigation

Comparing drip irrigation with traditional irrigation, drip irrigation can save
water 50%, save fertilizer 20%, save pesticide 10%, improve the irrigation
efficiency from 0.48 to 0.65, improve yield 20%, and total economic benefit is
more than 40%.
save money Increase earning
Improve the using efficiency of
irrigation water
Improve the using efficiency of
fertilizer
Save energy sources
Save pesticide and fertilizer
Save labours
Improve the output
of crop
Improve the quality
of farm produce

Maintaining high productivity
Low irrigation requirement (90% of total water)
Good soil quality (60% of total arable land)
Less soil salt input (soil salt content<1%)
Environmentally (ecosystem) friendly
Ecosystem health
Less adverse environmental effect such as
runoff and leaching
● How much is the irrigation requirement under drip irrigation.
● What is the threshold salinity for cotton growth
● How much is the salt leaching requirement under drip irrigation
Key Questions:

Numerical model
△y=0.5cm
△y=1cm
△y=3cm
△x=3cm
Depth thr ths Alfa n Ks L
10 0.04 0.453 0.012 2 27.3 0.5
20 0.04 0.483 0.011 1.7 12.5 0.5
30 0.04 0.482 0.01 1.5 8.9 0.5
40 0.0386 0.453 0.004 1.8 11.4 0.5
60 0.0386 0.482 0.009 1.37 9.3 0.5
80 0.0386 0.474 0.005 1.35 4.7 0.5
100 0.043 0.486 0.006 1.35 4.5 0.5
表4 – 1 利用PEST获得以及实测的土壤水力学参数
Tab 4 – 1 The van Genchten parameter got though measurement and PEST inverse
solution
Colum selected with blue means all the value
is measured in the field
Colum selected with means all the value is
get via inverse solution using PEST
Material distribution map(left) , boundary condition and grid map
Pink Nodes means variable-flux boundary
Red Nodes means Free-drainage boundary
Green Nodes means Atmosphere boundary
White Nodes means No-flux boundary

Data preparation ----- Plant transpiration and Soil evaporation
Reference crop evapotransipiration and
potential evapotranspiration
Basic plant coefficient , soil evaporation
coefficient and crop coefficient calculated by
FAO-56
Using FAO-56 calculating the soil
evaporation and plant transpiration
Soil water movement under drip irrigation

Data preparation -----Root Distribution and water uptake distribution
function
The parameter in the function above is get though inverse
solution compared with normalized root length density
R² = 0.831
eyy
Y
pxx
X
p
mm
m
y
m
x
Y
y
X
xyxb
11),(
----water uptake distribution function
Result of water uptake
distribution function

Model Calibration ----- Compared with observation measurement
Variation of soil water
content is decrease as
the increase in x and
depth
The influence of irrigation
and evapotranspiration
on soil water content is
more significant in the
depth of 0-50 cm of soil
layer

Result and discussion ----- soil water exchange between upper layer
(0 – 50 cm) and lower layer (> 50 cm )
Soil water exchange process is highly consistent with irrigation process
Maximum infiltration happen in the second day of irrigation and after forth day
the lower soil layer begin to recharge upper soil layer
Total infiltration amount due to irrigation is 349.50cm3, 11% of total irrigation
amount. Total recharge from lower layer to upper layer is 74.145cm3.

0
10
20
30
40
50
60
70
80
90
100
0.0 0.5 1.0 1.5土壤含盐量(%)
土壤
深度
(cm)
滴灌后
滴灌前
4265 m3/hm2
峰值
0
10
20
30
40
50
60
70
80
90
100
0.0 0.5 1.0 1.5土壤含盐量(%)
土壤
深度
(cm)
3926m3/hm2
峰值
0
10
20
30
40
50
60
70
80
90
100
0.0 0.5 1.0 1.5土壤含盐量(%)
土壤
深度
(cm)
3600 m3/hm2
峰值
3271m3/hm2
0
10
20
30
40
50
60
70
80
90
100
0.0 0.5 1.0 1.5土壤含盐量(%)
土壤深度(cm)
峰值
2947m3/hm2
0
10
20
30
40
50
60
70
80
90
100
0.0 0.5 1.0 1.5土壤含盐量(%)
土壤
深度
(cm)
峰值
0
10
20
30
40
50
60
70
80
90
100
0.0 0.5 1.0 1.5土壤含盐量(%)
土壤
深度
(cm)
2618m3/hm2
峰值
Salinity peak value under different irrigation demand before (black line) and after
irrigation (pink line)
Soil salt movement under drip irrigation

0102030405060708090
100
0.0 0.3 0.6 0.9 1.2 1.5 1.8
盐分含量(%)
土层
深度
(cm)
膜间
膜下
Three times
积盐区
0102030405060708090
100
0.0 0.3 0.6 0.9 1.2 1.5 1.8
盐分含量(%)
土层
深度
(cm)
膜间
膜下
Six times
积盐区
0102030405060708090
100
0.0 0.3 0.6 0.9 1.2 1.5 1.8
盐分含量(%)
土层深度(cm)
膜间
膜下
Ten times
积盐区
The range of salinity movement with soil water is about 0-70cm after several
times of irrigation, and there is no percolation in deep soil. Meantime, the
depth of salinity peak value is 40cm, then the desalted zone was formed in
0-40cm, and next was salinity balance zone.
Character of salinity distribution under irrigation demand( 3600 m3/hm2 )after irrigation
Soil salt movement under drip irrigation

盐分水平方向分布值 z
量
d
h
含盐量分布值x
盐分垂直方向分布值
分值
含盐
Horizontal distribution of salt Vertical distribution of salt
0.0%
1.0%
2.0%
3.0%
4.0%
5.0%
6.0%
7.0%
0 10 20 30 40 50 60 70
土层深度(cm)
含盐量(g/g)
t=530mint=1320mint=1680mint=1920min初始含盐量
0.00
0.05
0.10
0.15
0.20
0.25
0.30
0.35
0 10 20 30 40 50土层深度(cm)
盐分浓度(g/g)
t=530mint=1320mint=1680mint=1920min
S=menzC=C0e
dz
0.0%
1.0%
2.0%
3.0%
4.0%
5.0%
6.0%
7.0%
0 10 20 30 40 50 60 70
土层深度(cm)
含盐量(g/g)
t=530mint=1320mint=1680mint=1920min初始含盐量
0.00
0.05
0.10
0.15
0.20
0.25
0.30
0.35
0 10 20 30 40 50土层深度(cm)
盐分浓度(g/g)
t=530mint=1320mint=1680mint=1920min
S=menzC=C0e
dz

0
10
20
30
40
50
60
70
80
0.00 0.50 1.00 1.50土壤总盐(%)
土壤
深度
(cm)
2005年 2006年 2007年
b
0.00
0.20
0.40
0.60
0.80
1.00
1.20
1.40
Ⅰ Ⅱ Ⅲ Ⅳ
土壤
总盐
含量
(%)
2005-6-26 2006-6-21 2007-6-23
a
2001-2008年0-60cm土壤盐分变化
0.00
0.05
0.10
0.15
0.20
0.25
0.30
1 2 3 4 5 6 7
滴灌年限(年)
土壤含盐量(
µs·
cm-1)
Alaer
No.142
Farm
(张伟,2008,农业工程学报)
Annual variation of salinity distribution under drip irrigation
Soil salt content (%)
So
il dep
th (c
m)
Year
Soil salt movement under drip irrigation
AKSU Station

Sequential Land Use? If you do not have sufficient leaching, salinity is going to build
up. Crop rotation may temporally prolong the land use.
Salinity sensitive
plants
Year 1.2.3……N
Salinity sensitive
plants
Salinity resistant
plants
After Year N…
Soil salt movement under drip irrigation

LR Calculation
Empirical equation (3):
⊿S = aⅠi+b
Where ⊿S = S2-S1 , S1—soil salinity content before irrigation, S2—soil salinity content after irrigation, Ⅰi -- irrigation water requirement, it include cotton irrigation demand and leaching requirement.
For⊿ S =S2-S1 , S1 , S2—salinity before and after irrigation(g/kg)if ⊿S﹥0,then salification; if⊿ S<0, then desalinization
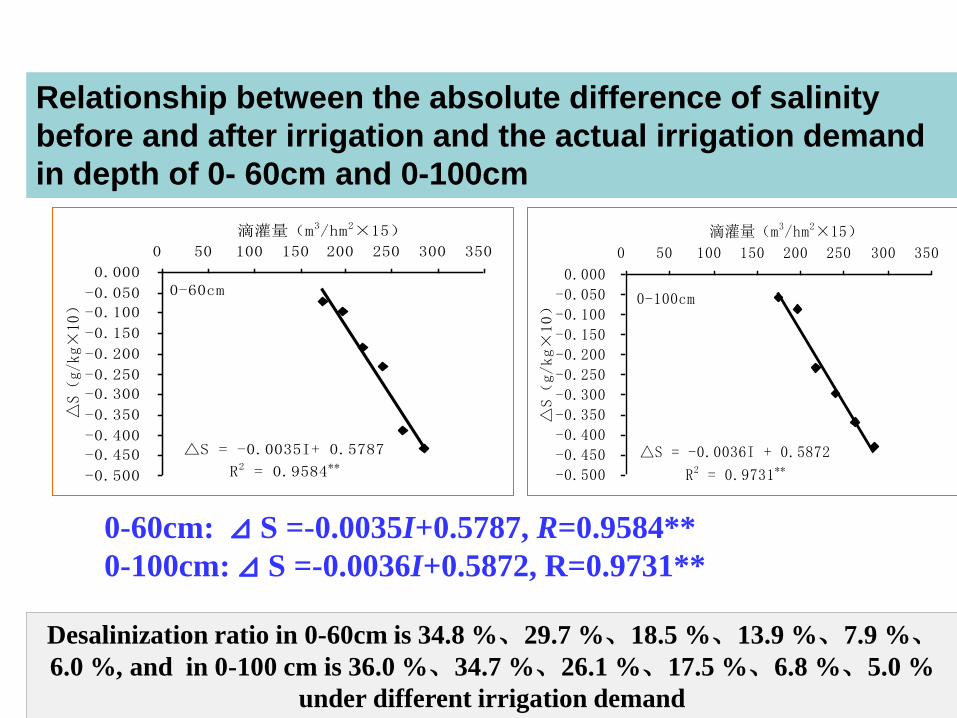
Relationship between the absolute difference of salinity
before and after irrigation and the actual irrigation demand
in depth of 0- 60cm and 0-100cm
0-60cm: ⊿ S =-0.0035I+0.5787, R=0.9584**
0-100cm: ⊿ S =-0.0036I+0.5872, R=0.9731**
△S = -0.0036I + 0.5872
R2 = 0.9731**-0.500
-0.450
-0.400
-0.350
-0.300
-0.250
-0.200
-0.150
-0.100
-0.050
0.000
0 50 100 150 200 250 300 350
滴灌量(m3/hm2×15)
△S(g/kg×10)
0-100cm
△S = -0.0035I+ 0.5787
R2 = 0.9584**-0.500
-0.450
-0.400
-0.350
-0.300
-0.250
-0.200
-0.150
-0.100
-0.050
0.000
0 50 100 150 200 250 300 350
滴灌量(m3/hm2×15)
△S(
g/kg
×10
)
0-60cm
Desalinization ratio in 0-60cm is 34.8 %、29.7 %、18.5 %、13.9 %、7.9 %、6.0 %, and in 0-100 cm is 36.0 %、34.7 %、26.1 %、17.5 %、6.8 %、5.0 %
under different irrigation demand

Degree of
salinity
S1
(g/kg)
S2
(g/kg) I
(m3/hm)
I1
(m3/hm) I2
(m3/hm)
Suitability demand
LR
Light 0.3-0.6 1.0 5432 3465 0 2909 Y
Middle 0.6-1.0 1.0 5432 3465 0 2909 Y
Heavy
1.0-1.5 1.0 5432 3465 1158 2909 M
1.5-1.7 1.0 5432 3465 2010 2909 M
1.7-2.0 1.0 5432 3465 3300 4728 N
Solonchak >2.0 Cotton dead N
Irrigation norm and suitability evaluation of cotton drip
irrigation under mulching
I1--irrigation norm in cotton growing season, it include cotton water
demand and LR; I2---added irrigation in winter or spring
Conclusion
The peak curve of soil salt under mulch moved downward with the increases of drip irrigation. Wet peak moved downward from 40 cm to 100 cm and peak value of salt also moved downward from 30 cm to 70 cm. The desalinization rate increased with the increase of drip irrigation requirement.
As a new water-saving technology, drip irrigation under mulch can be used to irrigate farmland in dry land area.
Considering long-term soil salt balance, drip irrigation under mulch will be unfavorable to salt-leaching in irrigation area. After harvest of cotton, quantity of water must be increased to leach salt.

-
Thanks for your Attention!
Chengyi Zhao AKSU Water Balance Experimental Station
Xinjiang Institute of Ecology and Geography
2013. 08.15