SOIL RESOURCE DEPRECIATION AND DEFORESTATION
42
SOIL RESOURCE DEPRECIATION AND DEFORESTATION: Philippine case study in resource accounting 1 By Hermina A Francisco and Marian S de Los Angeles 2 Planning and Statistics Branch Policy and Planning Division Forestry Department
Transcript of SOIL RESOURCE DEPRECIATION AND DEFORESTATION
SOIL RESOURCE DEPRECIATION AND DEFORESTATION:
Philippine case study in resource accounting1
By Hermina A Francisco and Marian S de Los Angeles2
Planning and Statistics Branch Policy and Planning Division
Forestry Department

The designations employed and the presentation of material in this publication do not imply the expression of any opinion whatsoever on the part of the Food and Agriculture Organization of the United Nations concerning the legal status of any country, territory, city or area or of its authorities, or concerning the delimitation of its frontiers or boundaries.
All rights reserved. No part of this publication may be reproduced, stored in a retrieval system, or transmitted in any form or by any means, electronic, mechanical, photocopying or otherwise, without the prior permission of the copyright owner. Applications for such permission, with a statement of the purpose and extent of the reproduction, should be addressed to the Director, Information Division, Food and Agriculture Organization of the United Nations, Viale delle Terme di Caracalla, 00100 Rome, Italy.
© FAO 1998

i
Soil resource depreciation and deforestation: Philippine case study in resource accounting
EXECUTIVE SUMMARY
Soil depreciation is a measure of the change in the productivity of the soil resource over time. There are two alternative measures of coming up with this estimate. One is through the estimation of a damage function that relates yield to soil loss. The second measure is through the change in the asset value of the soil over the relevant time frame of analysis. The first measure relies largely on the physical measure of loss, which is then monetized using financial or economic prices. The second approach captures both the physical and monetary changes in the value of the asset; the latter brought about by changes in the input and output prices over time. Both of these approaches require certain data that is often difficult to find. As a result, much research continues to rely on the use of the replacement cost method, although there are a number of limitations with this approach. The change in asset value approach is a superior measure of soil depreciation, since it captures both physical and economic changes taking place over the lifetime of the resource. One can picture a scenario wherein the physical loss in production may be compensated by higher prices of the remaining quantity of the good produced. If the gain from the change in prices more than offsets the loss from the change in quantity, then an appreciation (or negative depreciation) of the resource may result. In the case of the damage function approach, conceptually one would expect that depreciation will always correspond to a loss in production or some positive number. Both of the two approaches discussed above require time series data that are often not available. At best, one has a number of years of observations for an experimental site but this is hardly large enough to say something about a whole province, more so for the whole country. This paper presents the results of an attempt to derive a damage function for soil loss using 20-year data projected through the application of the Erosion Productivity Index Calculator or EPIC in one soil conservation project site in the Philippines. For the asset value method, the study assumes a constant rent over the life span of the soil resource, assumed to be 30 years, which is the period in which all the topsoil is expected to be lost through erosion under condition of erosive farming practices. With a constant rent assumption, however, the economic measure of soil depreciation simply measures the change in the value of the asset due to the declining value of money over time. The paper also presents an estimate of 50% the value of the nutrients lost through soil erosion. The study assumes that only 50% of the nutrients available in the soils are taken up by the crops. The rest are lost through various natural processes. Soil depreciation estimates for upland agricultural land ranged from PHP 1.47 billion to PHP 6.39 billion in 1989 using a 10% discount rate. The lower value represents the economic depreciation estimate using the asset valuation approach (i.e. a change largely attributed to changes in the value of money over time). The higher value considers both the economic depreciation and the physical deterioration of the resource base, measured in terms of the value of soil nutrients lost through soil erosion. Using 1988 data, the undiscounted value of soil nutrients lost from the uplands through erosion (PHP 5.94 billion) represents 4.27 percent of the Gross Value Added in agriculture and one percent of the Net National Product. The magnitude of the soil depreciation estimate is, therefore, substantial when viewed in total. This value represents what can reasonably be spent by the government for soil conservation programs in upland agricultural areas of the country.

ii
Soil resource depreciation and deforestation: Philippine case study in resource accounting
This study has established that the value of soil nutrients lost through erosion is substantial for the country as a whole, but may not be that big when expressed on a per hectare basis. To the upland users of the soil resource, it is the per hectare analysis which is the more relevant measure. This means that farmers' decision making is affected largely by damages that are felt by them and not by the value of damages that society as a whole may incur. If, indeed, the environmental cost of land use activities in the uplands is greater to society than to the upland farmers, then there is a sub-optimal incentive for farmers to adopt soil conservation practices. Alternatively, one may state that if the benefits from soil conservation activities will accrue more to society than they do to upland farmers, then there is a greater incentive for society to invest in such activities. Therefore, it makes sense for society to assist upland farmers in undertaking soil conservation activities, since these yield greater benefits to the country as a whole than to the individual farmers. The findings of the study, therefore, suggest that where upland farmers are already considered part of the ecosystem, they must be provided with some incentives in the form of technical assistance, counterpart costs for soil conservation and other measures to attain the desired reduction of soil erosion in the uplands. Where entrants of more migrants to the uplands can still be prevented, however, then efforts to prevent further encroachment into the uplands must be strengthened.

1
Soil resource depreciation and deforestation: Philippine case study in resource accounting
1 INTRODUCTION
1.1 The stages of deforestation and focus of the case study
Philippine old growth forests were dominated by dipterocarp forests, which contain a mixture of varied dipterocarp trees along with timber species of other plant families (e.g., Mimosaceae, Moraceae, Fagaceae, Sapotaceae, Myrtaceae, Euphorbiaceae) and numerous members of lesser-used species. Dipterocarp forests have been major sources of raw material for lumber, veneer and plywood, furniture wood and other hardwood-based products. They are located in higher elevations of Luzon, Palawan, Visayas and Mindanao, particularly in regions where precipitation is highest. Today, much of the remaining old-growth and second-growth dipterocarp forest are located in Regions II, IV, X and XI. Old-growth dipterocarp trees of large diameter sizes (at least 55 centimetres at breast height) now compose only 16 percent of all trees. Figure 1 Dynamics of Philippine deforestation
Past social bias for converting forest lands into other uses to promote growth and development
Urban poverty Rural poverty Landlessness
Population growth
• Development projects • Increased road networks • Inadequate protection of
forest lands
Improper pricing of and uncertain short-term
rights for private use of forest lands by loggers
• Large logging industry with high capital intensity & low employment generation
• Low investments in forest regeneration & protection
• Highly erosive road building techniques
Migration of poor farmers into
uplands
• Uncertain use rights for uplanders
• No long-term investments in land
DEFORESTATION
SHIFTING CULTIVATION
EXPANDING UPLAND AGRICULTURE
The process of deforestation follows a series of stages beginning with high extraction rates in terms of high volume removal, extensive area cut, and logging damage, ineffective protection of cut-over forest, intrusion by secondary loggers, and conversion into non-forest uses (Figure 1). During the period 1970-1989, the exploitation of old-growth forest occurred at a rate of 210,000 hectares annually; on the other hand the gain in secondary area was only 11,000 hectares per year, implying further conversion into non-forest uses. Since depreciation of resources in forest land occurs in terms of declining stocks of various forests species as well as removal of top layers of soils in forest lands as a result of erosion, this report integrates the results of both the forest and upland soils depreciation studies. The studies were generated by several phases of the Philippine Environmental and Natural Resources Accounting Project (ENRAP), an undertaking of the Department of Environment and Natural Resources (DENR) funded by the United States Agency for International Development (USAID).

2
Soil resource depreciation and deforestation: Philippine case study in resource accounting
1.2 Organization of the report
Section 2 presents a detailed treatment of soil resources accounting in upland areas of at least eight percent slope. Three approaches are explored, including the change in asset value as affected by reduction of lifetime, productivity changes and replacement cost approaches. Comparisons are made and relevant policy implications are discussed. Section 3 summarizes the results for dipterocarp forest resources and Section 4 presents an integration of the two accounting results with emphasis on forest-land-based resources. Recommendations for further methodology development and data refinement are discussed briefly.

3
Soil resource depreciation and deforestation: Philippine case study in resource accounting
2 ACCOUNTING FOR THE DEPRECIATION OF SOIL RESOURCES IN THE UPLANDS
The soil erosion problem in the Philippines is quite pronounced with more than half of the country's land area having a slope exceeding eight percent (hereby defined as the Philippine uplands). The problem is aggravated by heavy rainfall, improper land use and management, excessive and improper logging, shifting cultivation and road construction (PCARRD, 1992). Eroded areas are estimated to cover more than half of the land area in the following 13 provinces: Batangas; Cebu; Ilocos Sur; La Unión; Batanes; Bohol; Masbate; Abra; Ilo-ilo; Cavite; Rizal; Capiz; and Marinduque (PCARRD, 1984). Agricultural activities occur largely at the expense of natural vegetation and are responsible for much of soil loss taking place everywhere, particularly in areas that are vulnerable to soil erosion. Under natural conditions, the topsoil that is lost is largely replenished from the subsoil (Anderson and Thampapillai, 1990). The topsoil is defined as a renewable resource with a threshold level below which resource use renders it non-renewable. Yield losses from soil erosion can come not only from soil nutrient losses but also from the reduction in the soil’s water holding capacity, infiltration rates and loss of other beneficial topsoil characteristics. The loss in crop productivity caused by reduced water holding capacity or rooting depth may be permanent while losses from nutrient loss can be offset by increased use of fertilizers. Because of the above considerations, the valuing soil depreciation in terms of the fertilizer equivalent of the nutrients contained in the eroded materials has been largely criticized as an inadequate measure. Due to the absence of basic data, however, this approach has been used extensively in the country as an indicator of the on-site costs of soil erosion. The study by Cruz et al (1988) reported that in the Magat watershed, where sheet erosion was in the order of 88 tonnes/ha/yr, the fertilizer equivalent of nutrients loss through soil erosion was PHP 15/ton or PHP 1, 320 /ha/yr. For the Pantabangan watershed, the on site cost of soil erosion (using 1977 prices) was about PHP 7/ton from the topsoil layers to about PHP 4/ton for the lower soil layers. The study also estimated the off site cost of soil erosion. For Magat, the loss was estimated at PHP 18/ton of sediment while it was PHP 30/ton for Pantabangan watershed. Alternatively, the use of a damage function relating yield to soil loss as the basis of a depreciation estimate is more popular. Colacicco, et al (1989) cited the study made by Pierce Crosson (1983) that found out through a yield soil loss regression analysis that yield of corn and soybeans can be reduced by 1.5 percent and 2.0 percent respectively over a 30 year period of 1950 to 1980. These values may not be substantial but the author cautioned that they could not be ignored for the following reasons: yield losses are substantial in some regions, and therefore, there could be large variability in production that then translates to wide fluctuations in farm income, export supplies and domestic food supplies. In addition, there is the risk posed by the irreversibility and cumulative nature of soil productivity losses. Crosson estimated the 1983 cost of erosion in the United States at USD 420 million for crop production losses, USD 105 to168 million for fertilizer losses and USD 1.2 billion for erosion control. Studies on soil yield loss relationships are more advanced in the United States with the development of the Erosion Productivity Impact Calculator (EPIC) model. This model has been used in one study area in the country and the results of that study will be discussed in a later section. Obtaining the estimates for more sites is largely constrained by limited data availability.

4
Soil resource depreciation and deforestation: Philippine case study in resource accounting
2.1 Conceptual framework: the change in asset value approach
A given piece of land devoted to any agricultural use (commonly referred to as a farm) is assumed to possess inherent characteristics (i.e. natural inputs) necessary for crop production. These inputs normally consist of: soil nutrients (accessed largely from the top layer or A horizon); favourable soil texture; favourable Ph values; and other characteristics conducive to plant growth. When mixed with man-made inputs consisting of materials (e.g. chemicals, high yielding varieties of seeds, machinery and irrigation) and labour, natural resource commodities (e.g. crops, fruits, etc.) are produced. When the value of all man-made inputs are deducted from the value of total output, including a reasonable amount of returns for investment and management, the resulting figure comprises what is now considered as payment for the use of the natural input. This value is called the “economic rent” or, more literally in the case of soil resources, land rent. Variation in the amount of land rent over space is perceived to be the result of the inherent differences in soil fertility status (which is the Ricardian concept of rent). Rent is high for the more fertile soil, which could be found in less steep areas, and is expected to be lower for the less fertile soil. The economic rent is expected to vary every year with changes in the level of outputs and/or inputs used, their prices and the discount rate. Since the resource unit is expected to contribute to the production of one or more resource commodities over a period of time, the value of the natural resource asset (termed as asset value) for any one land use, say agriculture, will be equal to the present value of the stream of land rent over the economic life of the resource or over the relevant planning period. Land rent is obtained by estimating the annual net returns from the use of the resource over time, less a reasonable allowance for profit. In equation form, the net present value (NPV) of the asset (herein referred to as the asset value) is represented by:
)i+(1LR=NPV n
nT
1=n∑
Where: NPV is the present value of the asset at year n; T is the length of the planning horizon/or economic life of the resource; i is the discount rate; and LRn is the land rent in year n.
Three sets of assumptions are critical in this estimation procedure. One relates to prices, costs and yield data as a function of time. If one assumes constant prices, then the observed changes in the value of the land rent can only be attributed to changes in the yield or productivity of the resource and in the time-value of money. The second assumption has something to do with the expected value of the resource at the end of the planning horizon. This corresponds to a salvage value (in the case of equipment). With land, however, the term pertains to how much one could probably sell the land for at year T for non-agricultural purposes. This cannot be zero, but it is generally difficult to estimate. Hence, it will be assumed that this value is a constant amount, Kt, which is perceived not to influence the yearly changes in the value of the asset while it is still being used for agricultural purposes. For this reason, one may conveniently remove Kt from the general formulation presented above. The third assumption refers to the choice of the discount rate to be used in weighing present consumption value versus that of future consumption. In general, a lower discount rate favours future consumption, while a high discount rate gives more preference to present consumption. Two rates are used in this study: a low rate of 10 percent and a high rate of 15 percent. The cost of production in the model is defined to include the value of all material and labour inputs, including a reasonable (normal) allowance for return or profit on one's investment and management.
5
Soil resource depreciation and deforestation: Philippine case study in resource accounting
The variable, n, which may be defined as the economic life of the resource for agriculture or the planning horizon faced by the analyst, is another key variable in the asset estimation procedure. If n is defined as the economic life of the soil resources, then this measures the number of years it will take for the productive depth of the soil to be depleted at a given rate of soil erosion. When that time is reached, it is assumed that the soil resource can no longer support plant life; or even if it does permit biological growth, the variable costs incurred to make it happen over and above family labour can no longer be recovered. The asset value of the resource for agriculture then becomes zero. Alternatively, it can refer to the length of the planning horizon, which usually ranges from 25 to 30 years for resource based projects. At the end of the planning period, the asset value of the resource for agriculture may still be positive if the productive soil depth is not yet completely depleted at this stage. Note that the asset value of the land at the end of the planning period when used for alternative land uses (i.e., residential, industrial use, etc.,) may still be positive. If these alternative uses exist, then, the land use may be shifted to what may be considered as the next best alternative use of the land. If no such option exists, then the asset value at the end of the period T may indeed be zero. Note further that this phenomenon can only be a temporary situation. Given ample time for the soil resource to renew its inherent fertility, i.e., by leaving the land fallow, then the soil's asset value may increase subsequently. The ability of the soil to regenerate may allow agricultural land to be used again after the fallow period and, thus, contributes to increasing the asset value of the land under consideration. Once this happens, the whole process of accounting for soil depreciation for upland agriculture practices can start again. Also, while the asset value formula only reflects the changes arising from the variations in the present value of the land rent over time, the paper does not imply that the soil resource will be worthless at the end of the accounting period. Due to increasing demand for land resources from the growing population and probably from increasing development or even commercialization in a given area, there could be an appreciation of the land. With no data on the appreciation of land value, however, the paper assumes that the present value of the asset at time T is a constant amount K. Since this, by assumption, does not vary over time, then the observed yearly changes in the asset value of the land resource can only be caused by changes in the land rent of the resource. Depreciation is subsequently estimated as the change in asset value during the accounting period. On a year to year basis, soil resource depreciation is simply measured as the difference between the asset value at the beginning of the year and the asset value at the end of the year. 2.2 Soil yield loss damage function
One measure of the cost of human induced erosion is through the use of a soil yield loss damage function. This function could be derived from empirical studies which relate productivity level of soils for a given land use/crop to varying rates of erosion. As earlier noted, however, these studies are hardly available in the Philippines in wider spatial and temporal coverage. Moreover, given the large number of crops that are grown in various parts of the country, it is hardly possible to come up with damage functions for all of these various crops. Still, having such a damage function is advantageous in the sense that it will enable one to project the changes in the productivity of the crop corresponding to a given change in soil loss, assuming that the level of use of all other inputs remain constant. It is of course conceivable to think of a scenario wherein the farmers would try to offset the loss in productive soil with the increased application of organic and/or inorganic fertilizers. 2.3 Fertilizer equivalent of soil nutrients not available for crop uptake
In the process of producing the natural resource commodities, an undesirable by-product is generated (e.g. a soil loss beyond the tolerable rate). The tolerable level of soil loss may be defined as the volume of soil eroded through the natural process under a virtually undisturbed

6
Soil resource depreciation and deforestation: Philippine case study in resource accounting
ecosystem. Under this undisturbed state, soils have the chance to regenerate so that whatever is lost (i.e., the tolerable level) is also brought back into the system, in which case, no physical depreciation is taking place. However, when the natural rate is exceeded (i.e., when soils are lost faster than they are regenerated), a physical depreciation of soil resources takes place. The physical depreciation of soil resources is a product of both the bio-physical characteristics of the soils' environment (i.e. slope, rainfall and vegetation) and the activities introduced in the production process. Given that the physical environment of soils limits the extent and the kind of land use practices that man can reasonably perform on a soil resource unit, any rate of soil loss in excess of the tolerable level may be considered as human induced. It is the cost of human induced soil erosion that natural resource accountants are interested in monitoring and valuing. As a second best approach (but one that is recognizably an inferior measure), one can use the value of the nutrients in the soil that are no longer available for crop uptake (because they are lost through erosion) as an indicator of the loss in soil productivity. This approach usually entails the estimation of the fertilizer-equivalent value of the nutrients carried in the eroded soils and some assumptions of the percentage of nutrients uptake by the crop. The most commonly measured nutrients consist of available nitrogen translated into urea equivalent (45 0 0), phosphorus in terms of solophos equivalent (0 20 0) and potassium converted into the value of muriate of potash (0 0 60). Assuming a constant annual rate of soil loss and some estimate of the percentage of nutrient uptake of the crop, the value of the inorganic fertilizer equivalent that could have been used by the crop (had this not been lost through soil erosion) can be estimated and presented as a measure of the physical deterioration/depreciation of the soil resource base. 2.4 Discussion of the data analysis
2.4.1 The soil erosion problem in The Philippines
Soil erosion is one of the most serious forms of land degradation, which greatly affects the population and the environment. This problem was recognized as early as the 1930s when it served as a precursor to the reforestation program of the then Bureau of Forest Development (PCARRD 1991). Sometime in the 1950s, the Bureau of Soil Conservation was created to promote better management of the country's soil resources. Efforts to combat soil erosion continued in the 1970s with the creation of the National Environment Protection Council (NEPC) and in the 1980s when Soil Erosion Prevention was considered as a national thrust. The seriousness of the soil erosion problem today attests to the lack of success of these programs. An analysis made by the Department of Environment and Natural Resources (DENR) on the state of the Philippine environment showed that, overall, 75 percent of total croplands is vulnerable to erosion of various degrees. Thirteen provinces have 50 to 90 percent of their areas eroded. In terms of size of eroded land area, the top ranking provinces are Cebu (386,717 ha) and Bohol (271,739 ha) of Region VII; Masbate (269,147 ha) of Region V; Batangas (262,762 ha) of Region IV; and Abra (258,410 ha) of Region I (PCARRD, 1991). The Bureau of Soils and Water Management (BSWM) further classified the country's agricultural and non-agricultural lands in terms of slight, moderate or severe soil erosion (Table 1). The basis for this classification is the number of rills and/or gullies found per 100 meter length across a given slope. In a way, the assessment may be considered crude but it was the best that could be done given the high cost requirement of undertaking more quantitative measurement of the extent of soil loss all over the country. Analysis revealed that of the 42.4 percent land area in Luzon devoted to agriculture, 14.3 percent (1.44 million ha) suffers from moderate to severe erosion. The remaining 28.1 percent (4.55 million ha) has none to slight erosion. Erosion also takes place under non-agricultural land uses. Of the 57.6 percent non-agricultural land in Luzon, 27.1 percent (4.56 million ha) suffered from moderate to severe erosion. The remaining 30.5 percent (3.58 million ha) has zero to slight erosion.

7
Soil resource depreciation and deforestation: Philippine case study in resource accounting
Table 1 Areas used for agricultural and non-agricultural uses in The Philippines: extent of degradation by major island and by slope
Land used for agriculture (in '000ha) Land used for other uses (in '000ha) Island/ slope Moderate to
Severe None to Slight Total Moderate to
Severe None to Slight Total
Luzon 0-8% 814 3,277 4,091 276 948 1,224 > 8% 626 1,277 1,903 4,288 2,634 6,921 Total 1,440 4,554 5,994 4,564 3,582 8,146
Visayas 0-8% 610 610 200 200 401 > 8% 501 183 684 1,120 653 1,773 Total 501 793 1,294 1,320 854 2,174
Mindanao 0- 8% 2,053 1,412 3,465 771 511 1,282 > 8% 1,815 200 2,015 3,358 79 3,438 Total 3,868 1,612 5,480 4,129 590 4,720
Philippines 0- 8% 2,867 5,299 8,166 1,248 1,660 2,907 > 8% 2,942 1,660 4,602 8,765 3,367 12,132 Total 5,809 6,959 12,767 10,013 5,027 15,039
Source: "Crop Development and Soil conservation Framework for Luzon, Visayas and Mindanao Islands", Management and Evaluation Division (ALMED), Bureau of Soils and Water Management (BSWM), 1990.
Total land use in the Visayas accounted only for those areas covered by the major watersheds. It amounts to only 57.7 percent of the total land area of the region. Of this, 22.8 percent is devoted to agriculture, 8.0 percent of which falls under moderate to severe erosion category. Agricultural lands are largely found in areas with greater than 8 percent slope. Of the 34.8 percent land area devoted to non-agricultural use, about half (1.12 million ha) has moderate to severe erosion, all having a slope of greater than 8 percent. Soil erosion is greater in areas with more than 8 percent slope, as seen also in the Mindanao data. In particular, almost all of the agricultural land areas with slope exceeding 8 percent suffer from moderate to severe soil erosion (1.81 million ha). The same is true for non-agricultural lands. Of the total 3.44 million ha, 3.36 million ha suffer from the same state of soil erosion. For the country as a whole, some 2.87 million ha have moderate to severe erosion, out of the 8.17 million ha of agricultural land having less than 8 percent slope. The rest have no erosion problem. Of the 4.60 million ha of agricultural land with slope exceeding 8 percent, more than half (2.94 million ha) have moderate to severe erosion problem. Of the 15.04 million ha of non-agricultural land, 12.13 million ha are in areas with greater than 8 percent slope. Moderate to severe erosion exists in about 8.76 million ha of this land use category. Table 2 Average erosion rates for various land uses
Land use Average soil loss (tons/ha/yr)
Grassland/Pastureland 267.8 Upland Agriculture 112.8 Open Grassland 79.6 Fruit Trees 22.1 Trees, shrubs, grasses 12.5 Secondary Forest 3.0 Paddy rice, irrigated 2.3 Gmelina, ipil-ipil, coffee, grass 1.0
Source: IRG, Edgevale Associates and MADECOR (1991).
8
Soil resource depreciation and deforestation: Philippine case study in resource accounting
2.4.2 Rate and volume of soil erosion
The Philippine Council for Agriculture and Resources Research and Development (PCARRD, 1991) cited results of several local studies on soil erosion. Among these are the study of Paningbatan (1990) which indicated that annual soil loss was very much higher than the accepted tolerable soil loss of 3 to 10 tonnes/ha/yr and Sajise's (1984) which estimated that bare plots with 27 to 29 percent slope will have a soil erosion of 23 to 62 tonnes/ha/yr. In cultivated mountain slopes, the average erosion rate was 218.2 tonnes/ha/yr. The PCARRD (1991) publication also quoted the findings of David and Collado (1986), which applied the modified Universal Soil Loss Equation (USLE) to Philippine conditions using the Magat watershed as the test case. In particular, this study arrived at widely varying rates of soil loss by land use. Kaingin lands had the highest soil loss of 508 tonnes/ha/yr, followed by the open grasslands with 211 tonnes/ha/yr, and then by savannah with 195 tonnes/ha/yr. Diversified crop lands also have a very high erosion rate of 177 tonnes/ha/yr. The NRAP I (1991) have put together results of several studies which quantified erosion rates for various land uses in tonnes/ha/yr. These are presented in Table 2. As indicated, erosion rates vary in different vegetative covers and across different slopes. The highest rate was measured in grassland/pastureland, which averaged 267.8 tonnes/ha/yr, and lowest in lands planted to forest tree crops (1.0 tonne/ha/yr), in paddy areas (2.3 tonnes/ha/yr) and in secondary forests (3 tonnes/ha/yr). For the purpose of this study, the erosion rate for agricultural land use was estimated by getting the weighted average between upland agricultural land and land used for fruit trees. This is because of the observed predominance of agro-forestry (i.e., combined crop farming and tree farming) in many upland areas of the Philippines. The weight used was the proportion of agricultural land area devoted to cash crops and to fruit tree species as given in Evangelista (1993). The weighted average computed for agricultural land use was 61.8 tonnes/ha/yr. In the case of grasslands (open grassland and grassland/ pastureland), the average was 173.7 tonnes/ha/yr. For woodlands, the rate measured for secondary forest was 3.0 tonnes/ha/yr. These erosion rates were used in this study to calculate gross erosion and for the cost of erosion per hectare and per region.

9
Soil resource depreciation and deforestation: Philippine case study in resource accounting
Table 3 Gross and average erosion rates by region and by land use in The Philippines in 1993
Gross erosion rate (million metric tonnes/year)
Region
Agriculture Grassland Woodland
Total, tonnes/year
Averages (tonnes/ha/yr)
CAR 5.99 131.73 2.54 140.26 82.42I 4.53 104.02 0.53 109.08 128.49II 18.17 99.54 3.85 121.57 56.51III 6.73 98.84 1.24 106.82 97.82IV 68.60 190.39 5.50 264.49 65.50V 50.99 73.61 0.69 125.29 84.74VI 39.01 136.18 0.74 175.94 105.80VII 36.45 118.21 0.27 154.92 114.04VIII 50.07 95.24 1.70 147.00 76.35IX 42.13 110.76 1.03 153.92 92.58X 46.69 125.10 3.50 175.29 66.31XI 57.92 127.18 3.65 188.76 65.39XII 29.72 151.00 1.72 182.45 94.79Philippines total 457.02 1,561.80 26.98 2,045.79 80.62
Table 3 presents the gross and average erosion rate per region in the areas classified as uplands and highlands based on the classification given by Evangelista (1993). These land uses account for a total land area of 25.37 million ha, or 84 percent of the country's land resources. The national average erosion rate of 80.62 tonnes/ha is based on a weighted average of the three land-use specific erosion rates. The gross erosion in the country was estimated at 2.05 billion tonnes per year. The greatest contribution comes from the grasslands, which have the highest gross erosion rate of 1.56 billion tonnes/yr. Agriculture loses about 457 million tonnes of soil yearly while the woodland, a significant proportion of which has been encroached upon by illegal loggers and upland dwellers, has an annual loss of 26.98 million tonnes of soil. The average rate for the various regions ranges from 65 tonnes/ha/yr in Region XI to 128 tonnes/ha/yr in Region I. The Visayas have relatively higher erosion rates of 105 tonnes/ha/yr for Region VI, 114 tonnes/ha/yr for Region VII and 76 tonnes/ha/yr for Region VIII. These are comparable to the estimated erosion rate in the Forestry Master Plan (1990) of 74 tonnes/ha/yr average for the entire Philippines. Results showed that in all of the three major islands, the erosion rate was higher in the hilly lands or in areas with a slope of more than 18 percent and an elevation of less than 500 m. 2.4.3 Length of time to deplete soil resources
Given the information on rate of soil loss, soil density and effective soil depth, one can estimate how long it will take to deplete a centimetre (cm) of soil and the entire effective depth of the soil. Earlier, this length of time was referred to as the economic life of the resource. The economic life of Philippine soil resources was estimated using data on sampled and management units (LMUs) in different regions of the country. The sampling was limited by the available data and by the time constraint in this study.

10
Soil resource depreciation and deforestation: Philippine case study in resource accounting
Table 4 Length of time required to deplete soils of a given depth and bulk density by pedo-ecological zone (PEZ) and by region
Number of years to deplete Region PEZ
Effective soil depth
(cm)
Average Bulk Density (gm/cc)
Weight of Soil
(ton/cm)
Soil Loss
(ton/ha)
Depth of Soil Loss (cm/ha) Soil depth 1 cm
CAR I 131 1.31 131 82.42 0.63 211 1.59 II 75 1.09 109 0.76 99 1.32 III 50 1.16 116 0.71 70 1.41 Ave 85 1.19 119 0.70 127 1.44 I I 91 1.37 137 128.49 0.95 97 1.06 II 63 1.34 134 0.96 65 1.04 III 69 1.13 113 1.15 61 0.88 Ave 74 1.28 128 1.02 74 0.99
II I 68 1.20 120 56.51 0.47 143 2.12 II 60 1.20 120 0.47 127 2.12 III 98 1.20 120 0.47 208 2.12 Ave 75 1.20 120 0.47 160 2.12
III I 96 1.13 113 97.82 0.89 107 1.15 II 76 1.22 122 0.81 94 1.25 III 75 1.30 130 0.75 100 1.33 Ave 82 1.22 122 0.82 100 1.24
IV I 70 1.19 119 65.50 0.56 129 1.82 II 52 1.07 107 0.64 88 1.63 III 50 1.19 119 0.56 91 1.82 Ave 57 1.15 115 0.59 103 1.76
V I 110 1.15 115 84.74 0.77 142 1.35 II 154 1.23 123 0.70 226 1.45 III 87 1.20 120 0.71 139 1.40 Ave 117 1.19 119 0.72 169 1.40
VI I 75 1.24 124 105.80 0.85 87 1.18 II 100 1.28 128 0.83 125 1.21 III 112 1.24 124 0.85 131 1.17 Ave 96 1.25 125 0.85 114 1.18
VII I 75 1.24 124 114.04 0.92 106 1.06 II 100 1.28 128 0.90 27 1.06 III 112 1.24 124 0.92 139 1.40 Ave 96 1.25 125 0.91 91 1.17
VIII I 150 1.26 126 76.35 0.61 248 1.65 II 92 1.28 128 0.60 158 1.68 III 112 1.24 124 0.62 182 1.62 Ave 118 1.26 126 0.61 196 1.65
IX I 116 1.06 106 92.58 0.87 133 1.15 II 142 1.07 107 0.86 164 1.16 III 160 1.00 100 0.93 173 1.08 Ave 139 1.04 104 0.89 157 1.13
X I 84 1.10 110 66.31 0.60 140 1.66 II 63 1.10 110 0.60 104 1.66 III 163 1.08 108 0.61 265 1.63 Ave 103 1.09 109 0.61 169 1.65
XI I 63 1.24 124 65.39 0.53 120 1.90 II 105 1.24 124 0.53 200 1.90 III 112 1.24 124 0.53 212 1.90 Ave 94 1.24 124 0.53 177 1.90
XII I 102 0.91 91 94.79 1.04 98 0.96 II 101 0.91 91 1.04 96 0.96 III 158 0.91 91 1.04 152 0.96 Ave 120 0.91 91 1.04 115 0.96
Total I 95 1.18 118 0.75 136 1.43 II 91 1.18 118 0.75 121 1.42 III 104 1.16 116 0.76 148 1.44 Ave 97 1.18 118 0.75 135 1.43
Source of basic data: BSWM, Data files and LREP Reports, various provinces Data from sample LMUs of the different pedo-ecological zones are summarized in Table 4, along with the economic life estimates for soils in the different regions. In general, one cm of soil, given current erosion rate, will be depleted in about a year and a half, or an average soil depletion rate of 0.75 cm a year. With effective soil depth ranging from 50 to 163 cm, the economic life of soils for agricultural land use is still very long at 70 to 265 years. This means that soil loss is going on at a very slow process and may not be noticeable within normal economic planning time-spans. This could partly account for the lack of sensitivity to on-site cost of soil erosion by many upland land
11
Soil resource depreciation and deforestation: Philippine case study in resource accounting
users. They lack appreciation for the severity of the situation since there are still soils where they can plant. For as long as this is the case, they can see no problem, especially since many yield-enhancing technologies can mask the impact of soil degradation. One can argue that it is not the effective soil depth that should be the main concern of the analysis. Rather the topsoil is more important since it is in this soil layer where the plants take most of the nutrients needed for their growth. Once this layer is removed, sustaining plant growth without additional fertilizer application will be difficult. Recent data on topsoil depth of some upland areas reveal a soil depth of less that 10 cm. At soil depletion rate of 0.75 cm/ha/yr, it will take only some 13 years for the topsoil to be depleted. This makes it necessary for current resource users to be concerned with how the soil is being "mined" at present. If one takes a more optimistic stand and assumes a topsoil depth of 15-25 cm (a figure quoted by some respected soil scientists of the country)3, then it will take 20-33 years for this layer to be removed. This period is much shorter than when the effective soil depth was considered, but it can still probably be viewed as a long time when one accounts for a person's economic lifespan. Nevertheless, the continuous removal of the topsoil through erosion will result in the reduction of total nutrients available for plant growth. Hence, noticeable costs are incurred in the process of soil erosion. Thus, it can be argued that even in the absence of studies which will relate nutrient loss to productivity decline or which will establish that the loss of soil nutrients leads to productivity loss, it is appropriate to "charge" resource users with an amount at least equal to the value of the lost soil nutrients. 2.4.4 Soil resources as an asset: asset value for different land uses in the Philippines
Land is a non reproducible asset that, in productive use, has a market value. The market value of any capital asset is the present (i.e., discounted) value of the stream of net returns expected from its use over a given time span, plus how much the land owner expects to get from it if it will be sold at the end of that time span. The net return for any land use, in turn, is obtained by deducting from the value of output the operating costs (i.e., labour and intermediate input), the cost of exploration and development, and capital consumption allowance (Hamilton 1989). Since the asset is expected to provide a flow of services over time, one may estimate the useful life of the resource, the rate of extraction or resource utilization over time, and the rate of return from the use of the resource. This information is not easy to derive. One simple approach is to assume optimal production, which requires (according to Hotelling’s specification) the returns from production of an exhaustible resource to grow over time at a rate equal to the interest rate. This assumes that extraction costs are independent of scarcity. There are three possible ways to estimate the value of a natural resource base (Hamilton, 1989). Two of these are: (a) getting the net present value (NPV) of a constant stream of land rent (i.e. net returns less a reasonable allowance for profit) which is assumed to be equal to the current land rent; and (b) calculating the NPV of a constant stream of land rent assumed to be equal to the land rent on the Maximum Sustainable Yield (MSY) of the resource. The MSY is the yield achievable by an optimum population size which is exploiting the given natural resource unit. Since determining MSY is in itself a research topic that is not yet explored at present, the former approach will be used in this paper. Admittedly, the current rate of extraction (as reflected in the current level of net returns) is subject to wide yearly variations and, therefore, may be arbitrary, but the lack of time-series data on land rent as a function of time, limits the analysis to that year when the land rent estimate was available.

12
Soil resource depreciation and deforestation: Philippine case study in resource accounting
Table 5 Basic data used in the asset depreciation analysis (in 1998 prices) Region/Crops Total Area (Ha) Net revenue
(Pesos) Land rent (Pesos)
Total land rent (million Pesos)
Erosion cost (Pesos and USD)
CAR Rice - terraced and irrigated 53,997 2,415 1,690.5 91.28 563 Corn 24,383 2,433 1,703.1 41.53 $22.5 Fruit and leafy vegetables 18,518 39,257 27,479.9 508.88 Total 96,898 641.69 Region I Rice - terraced, non-irrigated 5,849 2,958 2,070.6 12.11 444 Corn 6,790 2,439 1,707.3 11.59 $17.68 Root crops 13,333 4,792 3,354.4 44.72 Other fruit trees 24,386 114,849 80,394.3 1,960.47 Coconut 22,958 3,775 2,642.5 60.67 Total 73,316 2,089.57 Region II Upland rice 24,631 1,939 1,357.3 33.43 612 Corn 239,211 2,497 1,747.9 418.12 $24.45 Leguminous vegetables 14,837 3,586 2,510.2 37.24 Banana 15,245 14,934 10,453.8 159.37 Total 293,924 648.16 Region III Corn 7,117 1,210 847.0 603 779 Leguminous vegetables 7,852 3,794 2,655.8 20.85 $30.97 Mango 13,799 25,509 17,856.3 246.40 Other fruit trees 9,123 25,509 17,856.3 162.90 Sugarcane 70,967 19,024 13,316.8 945.05 Total 108,857 1,381.23 Region IV Coconut 435,291 2,462 1,723.4 750.18 441 Coconut and shrubs 546,675 2,462 1,723.4 942.14 $17.63 Sugarcane 127,601 33,286 23,300.2 2,973.12 Total 1,109,567 4,665.44 Region V Corn 72,302 1,179 825.3 59.67 887 Coconut 624,976 4,526 3,168.2 1,980.05 $35.29 Coconut and shrubs 127,454 4,526 3,168.2 403.80 Total 824,733 2,039.72 Region VI Corn 590,587 1,798 1,258.6 743.31 941 Coconut 11,567 3,866 2,706.2 31.30 $36.46 Sugarcane 28,830 34,250 23,975.0 691.20 Total 630,983 1,465.81 Region VII Corn 220,341 3,914 2,739.8 603.69 1,134 Coconut 280,405 3,546 2,482.2 696.02 $44.34 Sugarcane 88,700 34,009 23,806.3 2,111.61 Total 589,446 3,411.32 Region VIII Rice - terraced, non-irrigated 21,787 6,128 4,289.6 93.46 1,134 Coconut 716,895 1,821 1,274.7 913.83 $44.34 Fibre crops 50,167 4,949 3,464.3 173.79 Sugarcane 20,875 24,356 17,049.2 335.90 Total 809,724 1,536.98 Region IX Upland rice 34,741 1,986 1,390.2 48.30 592 Corn 132,060 1,614 1,129.8 149.20 $23.54 Coconut 463,423 2,571 1,799.7 834.02 Root crops 23,605 2,473 1,731.1 40.86 Rubber 27,537 6,137 4,295.9 118.30 Total 681,366 1,190.68 Region X Corn 262,464 1,852 1,296.4 340.26 689 Coconut 392,555 3,216 2,251.2 883.72 $27.44 Banana 51,836 12,582 8,807.4 456.54 Sugarcane 48,273 13,408 9,385.6 453.07 Total 755,128 2,133.59 Region XI Corn 216,937 1,434 1,003.8 217.76 501 Coconut 651,402 3,412 2,388.4 1,555.81 $19.50 Banana 68,479 5,805 4,063.5 278.27 Total 936,818 2,051.83 Region XII Corn 199,032 2,452 1,716.4 341.62 1,673 Coconut 240,314 4,974 3,481.8 836.73 $66.74 Rubber 41,394 14,228 9,959.6 412.27 Total 480,741 1,590.62

13
Soil resource depreciation and deforestation: Philippine case study in resource accounting
Table 5 presents a summary of the basic data used in estimating the asset value for agricultural land use in the Philippines. The source of basic data is the Land Resources Evaluation Project (LREP) of the Bureau of Soils and Water Management, which are contained in the ALMED (1990) reports for Luzon, Visayas and Mindanao. The major agricultural crops that dominate each of the 13 regions were taken from Evangelista (1993). This paper assumes that these dominant land uses account for all of the agricultural land use each in region. The net returns, as reflected in the LREP report, were adjusted downward by 30 percent to reflect a normal rate of return on investment. The remaining amount constitutes the above normal profit or the land rent. Land rent for the various agricultural crops is then multiplied to the agricultural area by type of agricultural crop to derive the total land rent for the various regions. These land rent values were used to estimate the asset value of the agricultural land resource in the upland Philippines. Table 6 Estimated asset value and depreciation of agricultural land
Asset Value (billion of pesos) Economic depreciation (billion of pesos) Year
discount rate = 10% discount rate = 15% discount rate = 10% discount rate = 15%
1988 242.28 168.75 - - 1989 240.81 168.36 1.47 0.38 1990 239.18 167.92 1.62 0.45 1991 237.40 167.40 1.79 0.52 1992 235.44 166.81 1.96 0.59 1993 233.28 166.13 2.16 0.68 1994 230.92 165.35 2.37 0.78 1995 228.30 164.45 2.61 0.90 1996 225.44 163.42 2.87 1.03 1997 222.28 162.23 3.16 1.19 1998 218.81 160.87 3.47 1.36 1999 214.98 159.30 3.82 1.57 2000 210.78 157.49 4.20 1.81 2001 206.16 155.41 4.63 2.08 2002 201.08 153.03 5.08 2.39 2003 195.48 150.28 5.59 2.74 2004 189.33 147.12 6.15 3.16 2005 182.56 143.49 6.77 3.63 2006 175.12 139.31 7.44 4.18 2007 166.93 134.51 8.19 4.80 2008 157.92 128.98 9.01 5.53 2009 148.01 122.63 9.91 6.35 2010 137.11 115.32 10.90 7.31 2011 125.12 106.93 11.99 8.40 2012 111.93 97.26 13.19 9.66 2013 97.43 86.15 14.50 11.12 2014 81.74 73.37 15.96 12.77 2015 63.91 58.68 17.56 14.69 2016 44.60 41.78 19.31 16.90 2017 23.37 22.35 21.24 19.43
Notes: the above figures are based on the following retail prices: urea = PHP 3.94/kg; P205 = PHP 2.94/kg; and K20 = PHP 3.47/kg, plus import prices of: urea =USD 157.64/MT; P205 = USD122.00/MT; K20 = USD 125.43/MT. Economic depreciation is computed as the year-on-year change in asset value. The asset value of the 7.4 million ha of agricultural lands in 1988 was PHP 242.28 billion using a 10 percent discount rate, or PHP 168.75 billion using 15 percent discount rate over a 30-year period (Table 6). Take note that the asset value represents the return to the use of the land since all production costs have already been paid for, including an allowance of 30 percent of net returns for normal return on investment. On a per hectare basis, using the 7.4 million hectares of agricultural land area, the asset value is PHP 32,778 at 10 percent discount rate or PHP 22,830 at 15 percent discount rate. As indicated in Table 5, land rent varies depending on the crop planted. Higher land rent is noted for high value crops like fruits, vegetables, and plantation crops. Low land rent is noted in areas planted to crops like corn, rice and root crops. Crops best suited to the soil characteristics are also expected to generate higher land rent.

14
Soil resource depreciation and deforestation: Philippine case study in resource accounting
Between 1988 and 1989, a reduction in asset value was noted to be PHP 1.47 billion and PHP 0.38 billion, using 10 percent and 15 percent rate of discount, respectively. These figures represent the economic depreciation of the soil resource base mainly due to the declining value of money over time (a present value formula). As a measure of depreciation, the economic depreciation values do not reflect the physical deterioration of the soil resource base that can be caused by several forces, a major one being soil erosion. To assume that depreciation from physical deterioration of the soil is not significant is tantamount to saying that productivity losses from soil erosion are not substantial to cause a significant decline in yield. This was implied in the long period remaining before soils become totally depleted (Table 4). From an earlier discussion, it was pointed out that effective soil depth is still relatively thick and, given current rate of soil loss, it will take a long time before the depletion point is reached. When that time comes, substantial productivity loss will be experienced, but since that is expected to happen beyond the life span of the present generation, converting it to present value will yield a very small number. One may, however, argue that soil nutrients lost through erosion is real and, therefore, should at least be accounted for. If this is to be an accepted measure of cost of soil erosion, then the value of lost nutrients should be considered as part of the production cost, a negative externality, which must be deducted yearly from the value of the net returns. Whatever remains of the net returns can then be used in the asset value formula. There are two objections to this alternative. One is the issue on whether the lost nutrients are indeed lost. The other is whether soil depreciation is really brought about by the physical changes in the soil. The first objection argues that when fertile soils are eroded from the upland farms to downstream farms with less productive soils, they may even increase soil productivity downstream. Productivity loss takes place only if the additional returns downstream are less than the value of foregone productivity upstream. It is possible, however, that the topsoil upstream is still thick such that no significant productivity decline may result from soil erosion. In which case, there will even be a benefit from soil erosion rather than a cost. Of course, it is possible to think of fertile farms downstream being covered by infertile soils. In which case, productivity decline is expected to take place. Unfortunately, there is not enough information to ascertain what becomes of the eroded materials. This lack of information limits our knowledge of the true value of soil erosion and consequent sedimentation. Nevertheless, the value of soil nutrients foregone may be considered as the minimum value of the cost of soil erosion under condition of thin topsoil in upland farms. This measures the amount of fertilizer nutrients that must be added to the soil to sustain crop growth. The second objection to the proposed asset valuation approach relates to the measurement of soil depreciation. Under the said approach, it is hypothesized that the change in the value of the asset (a measure of depreciation) is brought about by changes in the physical quality of the resource and in monetary changes due to changes in prices. To treat the value of lost nutrients as part of the direct production cost would limit the definition of soil depreciation to changes that are brought about by changes in prices. This is not in conformity with what one normally associates with depreciation, i.e., the physical component. Table 6, thus, shows the yearly economic depreciation measured from changes in the value of the asset (also shown in Figure 2) and, separately, the value of the soil nutrients found in eroded soil, discounted to the present. As earlier discussed, the latter can be taken as indicator of the physical deterioration of the soil resource base.

15
Soil resource depreciation and deforestation: Philippine case study in resource accounting
Figure 2 Economic depreciation
0
5
10
15
20
25
1985 1990 1995 2000 2005 2010 2015 2020
Year
(In b
illio
n Pe
sos)
Economic depreciation at 15% interest rate
2.4.5 Value of soil nutrients in eroded soil
One way of putting a monetary value on the on-site cost of soil erosion is to estimate the value of the lost nutrients through erosion. The idea behind this is that eroded soil carries with it soil nutrients that could have been used up for plant growth. The value can be estimated using an analysis of soil nutrient content expressed in a per tonne or per cm of soil basis. Due to the important role played by macro-nutrients in the soil and because most data are only available for these soil nutrients, the analysis has focused on nitrogen (N), phosphorus (P), and potassium (K). The values of available N, P, and K were estimated in terms of the equivalent levels of urea (45 0 0), solophos or P205 (0 20 0), and muriate of potash or K20 (0 0 60).

16
Soil resource depreciation and deforestation: Philippine case study in resource accounting
Table 7 N (urea), P (P2O5) and K (K2O) content of a tonne of soil under varying land uses, by region, Philippines, 1993
Agriculture Grassland Woodland All N P K N P K N P K N P K Region
(kilograms) (kilograms) (kilograms) (kilograms) CAR 2.22 0.07 0.04 2.22 0.07 0.04 2.22 0.07 0.04 2.22 0.07 0.04 I 1.70 0.03 0.11 1.63 0.04 0.14 1.70 0.03 0.11 1.68 0.04 0.12 II 2.24 0.07 0.27 1.88 0.03 0.11 1.88 0.03 0.11 2.00 0.04 0.17 III 2.94 0.07 0.23 2.37 0.05 0.18 1.93 0.04 0.13 2.41 0.05 0.18 IV 1.70 0.08 0.05 2.47 0.05 1.00 2.47 0.05 1.00 2.21 0.06 0.68 V 3.41 0.04 0.23 3.41 0.04 0.22 3.33 0.03 0.20 3.38 0.04 0.22 VI 2.91 0.06 0.98 2.32 0.23 1.05 4.52 0.03 0.37 3.25 0.11 0.80 VII 3.51 0.06 1.25 2.91 0.06 1.32 4.96 0.03 0.75 3.79 0.05 1.11 VIII 3.51 0.06 1.25 2.91 0.06 1.32 4.96 0.03 0.75 3.79 0.05 1.11 IX 2.22 0.08 0.17 2.22 0.08 0.17 2.42 0.07 0.15 2.29 0.07 0.16 X 2.64 0.03 0.18 2.64 0.03 0.18 2.64 0.03 0.18 2.64 0.03 0.18 XI 1.45 0.04 0.66 2.44 0.05 0.16 1.55 0.04 0.62 1.81 0.04 0.48 XII 6.60 0.03 0.27 3.01 0.06 0.18 4.79 0.04 0.30 4.80 0.04 0.25 Average 2.85 0.06 0.44 2.50 0.07 0.47 3.03 0.04 0.36 2.79 0.05 0.42
Note: Urea - 45-0-0; P2O5 - 0-20-0; K2O - 0-0-60. Table 7 shows the macro-nutrient content of a tonne of soil while the peso equivalent is shown in Table 8 for the three major land uses and for the 13 regions of the country. Table 8 Value of N, P and K found in a tonne of soil under varying land uses, by region,
Philippines, 1993, (in pesos)
Agriculture Grassland Woodland Region N P K Total N P K Total N P K Total All
average CAR 8.76 0.21 0.13 9.10 8.76 0.21 0.13 9.10 8.76 0.21 0.13 9.10 9.10 I 6.71 0.10 0.37 7.18 6.42 0.11 0.47 7.00 6.71 0.10 0.37 7.18 7.12 II 8.83 0.20 0.94 9.97 7.39 0.10 0.39 7.88 7.39 0.10 0.39 7.88 8.58 III 11.58 0.20 0.81 12.59 9.34 0.14 0.64 10.12 7.59 0.12 0.44 8.15 10.28 IV 6.71 0.25 0.18 7.14 9.73 0.16 3.48 13.36 9.73 0.16 3.48 13.36 11.29 V 13.43 0.12 0.80 14.34 13.43 0.11 0.78 14.32 13.13 0.10 0.68 13.91 14.19 VI 11.48 0.18 3.40 15.06 9.14 0.67 3.64 13.45 17.80 0.10 1.29 19.19 15.90 VII 13.81 0.18 4.35 18.35 11.48 0.18 4.59 16.25 19.55 0.10 2.60 22.25 18.95 VIII 13.81 0.18 4.35 18.35 11.48 0.18 4.59 16.25 19.55 0.10 2.60 22.25 18.95 IX 8.76 0.22 0.59 9.57 8.76 0.22 0.59 9.57 9.53 0.20 0.54 10.27 9.80 X 10.41 0.10 0.64 11.15 10.41 0.10 0.64 11.15 10.41 0.10 0.64 11.15 11.15 XI 5.71 0.11 2.28 8.10 9.63 0.16 0.55 10.34 6.10 0.12 2.16 8.38 8.94 XII 26.02 0.10 0.94 27.06 11.87 0.16 0.63 12.66 18.87 0.11 1.06 20.04 19.92 Average 11.23 0.17 1.52 12.92 9.83 0.19 1.62 11.65 11.93 0.12 1.26 13.32 12.63
Note: retail prices (source: FPA, 1988-89): Urea (45-0-0) - P 3.94/Kg; Solophos (0-20-0) - P 2.94/Kg; Muriate of Potash (0-0-60) - P 3.47/Kg. Price of Solophos is not known. Its price was assumed to be 50% of TSP (0-46-0). Valuation was done using two sets of prices. The financial prices were the 1988 retail prices of urea, super phosphate (P2O5), and muriate of potash (K2O), which was PHP 3.94/kg, PHP 2.94/kg, and PHP 3.47/kg, respectively. The economic prices of these nutrients were the 1988 CIF import prices, which were US$ 157.64/MT for urea, US$ 112/MT for solophos, and US$ 125.43/MT for muriate of potash. The N content (in urea equivalent) of soils under agriculture ranged from a low 1.45 kg (PHP5.71) in Region XI to a high 6.60 kg (PHP26.02) in Region XII. The average for all regions is 2.85 kg of urea, which is worth PHP 11.23. The solophos content of agricultural land is quite low at 0.06 kg, valued at PHP 0.17 only, while the muriate of potash content is also low at 0.44 kg, which is worth PHP 1.52. No significant differences were observed between the N, P and K content of soils under grassland. The average N content of grassland is 2.5 kg valued at PHP 9.83, K content is 0.07 kg

17
Soil resource depreciation and deforestation: Philippine case study in resource accounting
worth PHP 0.19, and P content is 0.47 kg valued at PHP 1.62. The woodland has relatively higher N content of 3.03 kg urea (PHP11.93), but it has lower P and K content at 0.04 kg and 0.36 kg, respectively. Considering all the macro-nutrient content of a soil, a tonne of soil contains PHP 12.92 worth of macro-nutrients for agricultural land, PHP 11.65 for grassland, and PHP 13.32 for woodland. (Table 8) A tonne of soil lost through erosion carries with it this amount of soil nutrients. One can immediately notice that the estimated values are probably so small to matter to the farmers, which may be the reason why soil erosion has reached its present state. There appears to be little incentive to prevent the nutrient losses since they are insignificant in money terms. The above discussion has focused on the soil nutrient content of a tonne of soil. A hectare of soil, however, loses more nutrients annually than a tonne of soil. This means that the on site loss to farmers can be much bigger than what is implied by the per tonne soil analysis. Recall that the erosion rate used for agriculture land use was 61.8 tonnes/ha/yr, 173.7 tonnes/ha/yr for grassland, and 3 tonnes/ha/yr for woodland (see Section 3.21, p.12). Using these erosion rates, the average N content of a hectare of eroded agricultural land is 176.27 kg of urea worth PHP 694.50, 3.5 kg of solophos worth PHP 10.29, and 27.11 kg of muriate of potash valued at PHP 94.07. Thus, a hectare of agricultural land is losing soil nutrients worth PHP 798.86 per year. Nutrient loss in grasslands is worth PHP 2,023.52 per year, while for woodlands it is only PHP 39.97 per year. The average value of soil nutrients lost through erosion is PHP 799.23/ha/yr for all land uses. Differences in the value of soil nutrient losses can be explained by the differences in the level of soil erosion for the three land uses. Even on a per hectare basis, the value of soil nutrients lost through erosion may not be considered substantial. When masked by use of inorganic and organic fertilizers, nutrient losses are hardly noticeable at all. Again, this shows that on site losses may not be that significant to cause farmers to worry about the economic impact on them. The off site effects are often not a relevant concern to private decision makers on site. The off site cost, however, is a relevant one to society and must be considered in determining the optimal level of soil loss that can be allowed to persist. Note that while the per hectare losses may not be substantial, the value of the loss for the country as a whole is quite huge. From the agricultural lands, the value of the loss is estimated at PHP 5.94 billion, which represents close to 1 percent of the Net National Product (NNP) in 1988 at 1985 constant prices and 4.27 percent of the PHP 139.258 billion gross value added for agriculture in the same year. Losses from grasslands are highest at PHP 18.29 billion while from the woodlands they were lower at PHP 323.4 M. From all land uses, the value of lost soil nutrients is PHP 24.56 billion. The share of the various regions to this total is also given in the same table. Region IV had the biggest value of loss at PHP 3.1 billion while Regions I and II had the lowest at PHP 764.8 million and PHP 995.9 M, respectively. In agriculture, however, the biggest losses were estimated for the Visayas Region, with PHP 587.7 million in Region VI, PHP 668.6 million in Region VII, and PHP 918.5 million in Region VIII. Nutrient loss was also high for Region XII, estimated at PHP 804.28 million for 1988. The CAR and Region I registered low losses from agriculture at PHP 54.55 million and PHP 32.55 M, respectively. The low value obtained in these two regions was mainly due to the relatively smaller agricultural land found in them.

18
Soil resource depreciation and deforestation: Philippine case study in resource accounting
Table 9 Value of depreciation and nutrient losses of agricultural lands at 10% and 15% discount rate (in billion pesos, 1988 prices)
Economic Depreciation Value of Soil Nutrients in Eroded Soil 10% 15%
Year
10% 15% a b a b 1988 - - 5.41 213.5 5.17 204.21989 1.47 0.38 4.92 194.1 4.50 177.61990 1.62 0.45 4.47 176.4 3.91 154.41991 1.79 0.52 4.06 160.4 3.40 134.41992 1.96 0.59 3.69 145.9 2.96 116.81993 2.16 0.68 3.36 132.6 2.57 101.51994 2.37 0.78 3.05 120.5 2.24 88.31995 2.61 0.90 2.78 109.6 1.94 76.81996 2.87 1.03 2.52 99.6 1.69 66.81997 3.16 1.19 2.29 90.6 1.47 58.01998 3.47 1.36 2.08 82.3 1.28 50.51999 3.82 1.57 1.89 74.8 1.11 43.92000 4.20 1.81 1.72 68.0 0.97 38.22001 4.63 2.08 1.57 61.8 0.84 33.22002 5.08 2.39 1.42 56.2 0.73 28.92003 5.59 2.74 1.29 51.1 0.64 25.12004 6.15 3.16 1.18 46.5 0.55 21.82005 6.77 3.63 1.07 42.2 0.48 19.02006 7.44 4.18 0.97 38.4 0.42 16.52007 8.19 4.80 0.88 34.9 0.36 14.42008 9.01 5.53 0.80 31.7 0.32 12.52009 9.91 6.35 0.73 28.8 0.27 10.92010 10.9 7.31 0.66 26.2 0.24 9.42011 11.99 8.40 0.60 23.8 0.21 8.22012 13.19 9.66 0.55 21.7 0.18 7.12013 14.50 11.12 0.50 19.7 0.16 6.22014 15.96 12.78 0.45 17.9 0.14 5.42015 17.56 14.69 0.41 16.3 0.12 4.72016 19.31 16.90 0.37 14.8 0.10 4.12017 21.24 19.43 0.34 13.5 0.09 3.5
Note: a. Based on retail price of Urea=P3.94/Kg, P2O5=P2.94/Kg, K2O=P3.47/Kg b. Based on import price of Urea=$157.64/MT, P2O5=$122.00/MT, K2O=$125.43/MT 2.5 Soil depreciation estimates for upland agricultural lands: economic depreciation and
value of lost soil nutrients
Depletion of an exhaustible resource means the consumption of the asset, which should be reflected as a reduction in the value of the asset over time. From 1988 to 1989 for example, the value of the asset has declined by P1.47 billion using a 10% discount rate (Table 9). This represents a 0.6 percent decline in the 1988 asset value of the country's agricultural lands. The yearly economic depreciation estimate over the period of 1988-2017 has been increasing. This trend reflects the reduction in the value of the asset over time because of the decreasing time value of money. As a measure of soil depreciation, the value of economic depreciation measures purely the decline in the monetary value of the asset. Since the economic depreciation estimates does not yet reflect any change in the physical depreciation of the soil (i.e. the change in the productivity of the soil), one can say that physical change is not an accurate measure of soil depreciation. The loss in soil productivity cannot be established yet, especially for all the major crops in the country. Alternatively, the loss in nutrient content could be used as an indicator of the physical damage of the soil. If these two figures will be

19
Soil resource depreciation and deforestation: Philippine case study in resource accounting
added, then the 1989 value of soil depreciation on site would be PHP 6.39 billion at 10% discount rate or P4.88 billion when the discount rate used is 15%. One will immediately notice that the value of soil nutrients in eroded soil far exceeds the economic depreciation estimates. In 1989, for example, at 10% discount rate, the value of soil nutrients was PHP 4.92 billion as against the PHP 1.47 billion estimate of economic depreciation. The economic depreciation estimate increases over the years as the asset value decreases over time The decreasing asset value was due to the declining period of accounting (i.e. in 1988 one considers stream of land rent in the next 30 years while in year 2000, the stream of land rent being counted is that due in the remaining 18 years of the 30-year life span) for the value of the asset. 2.6 Estimates of a yield-soil loss damage function: application of EPIC in an upland town
in Luzon
De Guzman (1997) used the simulation model developed by the USDA in the early 1980s. This model is more popularly known as the EPIC, which stands for Environmental Policy Integrated Climate. In the early phase of the development of this model, it was described as Erosion Productivity Index Calculator. Due to the wider application of the model to various environmental problems, the name has been changed as is currently defined. EPIC requires detailed information on the physical characteristics of the site, crop cultural practices and crop requirements. The model combines the soil loss estimates from the USLE with various other soil characteristics and climatic variables and is capable of predicting losses of soil nutrients such as N and P, and movement of pesticides in water runoff. The model runs on an IBM-PC compatible computer system with at least 640 K RAM. The model provides default values for some parameters. Table 10 Measured and EPIC simulated yields of corn and peanut: mabini, batangas, (in
tonnes/hectare)
Corn Peanut Year Measured Predicted Measured Predicted 1991 0.34 0.31 1.02 0.54 1992 0.86 0.95 1.26 1.33 1993 1.83 0.67 0.53 0.92 1994 0.53 0.23
Source: Table 2 in De Guzman, Ma. Theresa (1997) "Evaluating the Impacts of Area Development Plans and Soil Conservation Practices on Soil Productivity: A Simulation Approach" (Unpublished Masteral Thesis, M.S. Ag. Econ., UPLB). Table 10 shows a comparison of the measured soil loss and yield with those generated through the EPIC model. It can be seen that the numbers obtained by the model did not seem to differ substantially from the actual data. With confidence on the EPIC model, the author projected the soil loss and yield data for corn crop over a 20 year period. These generated time series data were then used to estimate a damage function with yield as a function of soil loss, using a linear relationship. Results of regression analysis gave the following soil loss - yield relationship:
Yt = 1,360 - 12.5 soil loss The results show that a tonne of soil loss would result to a yield decline equivalent to 12.5 kg/hectare. When price of corn is available, the value of productivity loss can be estimated. Assuming a PHP 10/kg of corn, the productivity loss per tonne of soil loss is worth PHP 125/ton. On a per hectare basis, assuming an 80 tonnes/ha rate of soil loss, then the production foregone in a hectare of upland area can come to PHP 10,000 per ha (USD 250).

20
Soil resource depreciation and deforestation: Philippine case study in resource accounting
2.7 The magnitude of soil depreciation.
Soil depreciation estimates for upland agricultural lands ranged from PHP 1.47 billion to PHP 6.39 billion in 1989. The lower value represents the economic depreciation estimate using the asset valuation approach (i.e., a change largely attributed to changes in the value of money over time). Recall that in this particular case, prices are assumed constant and losses due to physical depreciation/deterioration of the soil are considered insignificant. The higher value considers both the economic depreciation and the physical deterioration of the resource base, measured in terms of the value of soil nutrients carried by the eroded materials. Using 1988 data, the undiscounted value of soil nutrients lost from the uplands through erosion (PHP 5.94 billion) represents 4.27 percent of the Gross Value Added in agriculture and one percent of the Net National Product. The magnitude of the soil depreciation estimate is, therefore, substantial when viewed at the aggregate. This value represents what can reasonably be spent by the government for soil conservation programs in upland agricultural lands of the country. Note that since the earlier estimates account only for agricultural lands, these values may be considered to be on the low side. The value of nutrient losses from grasslands is much higher than that from agricultural lands. This value was PHP 18.29 billion from grasslands in 1988 as against only PHP 5.94 billion from agricultural lands. Many of the country's grasslands are in degraded state and must be given attention, particularly those found in the uplands. Planting trees or afforestation efforts in these grasslands have higher payoff, as indicated alone by the value of soil nutrients lost through soil erosion worth PHP 323.40 million under woodlands. This value is much lower than the PHP18.29 billion value of nutrients lost in the grasslands pointing to high potential benefit of rehabilitating grasslands. Several approaches in estimating soil depreciation were discussed. The use of soil productivity loss damage function was pointed out as important in measuring the changes in the physical ability of the soil to support plant growth. The lack of data to make this estimation possible, however, is still a major constraint in the estimation process. As an alternative, the use of replacement cost method has gained popularity. There are several limitations to this approach, however, and its continued use by analysts is due more to the absence of adequate alternatives. The asset valuation approach may provide a better measure of soil depreciation. If the changes in asset value over the years can capture both the monetary and the physical changes in the soil resource base, then this method will be an ideal measure of soil depreciation. Unfortunately, not much can be said about the physical deterioration of the soil at this time due to lack of data. The economic measure of soil depreciation in the context of this study was limited to measure of changes in the value of the asset due to declining value of money over time. The potential for using EPIC in generating damage function relating yield to soil loss is promising in the Philippine condition. The comparison of the experimental data with EPIC-generated data reveals no significant differences in the two data sets. This may be interpreted to mean that EPIC is capable of predicting yield and soil loss data when fed with bio-physical characteristics of the study area and some information on the cultural practices used in the production activity. Where data are not available, the model allows the use of default values in the United States that closely approximately the study area—in the Philippine case study, the data in Hawaii was used as the default values. The use of EPIC in other study areas in the country should be explored further in the future.

21
Soil resource depreciation and deforestation: Philippine case study in resource accounting
2.8 Recommendations for future research
The valuation of soil depreciation may be improved in the future if the following aspects are given greater attention:
1. Assessment of the value of land at the end of year T. In the analysis, this was assumed to be a fixed amount K. In reality, we know that the value of the land in different locations and for different land uses tend to change (generally appreciate) over time. This trend in land value or appreciation over time must be studied as well to obtain a more realistic figure of soil depreciation (appreciation) over the years.
2. The on-site productivity loss associated with soil erosion still needs to be established.
There are some modelling works done in other countries that some technical scientists in the country have started to adopt. At some future time, results of their analysis may become available, which can allow for the estimation of the damage function of soil loss.
3. The next phase should already consider the off site estimation of soil erosion damages.
The on site impacts have already been given enough consideration in this paper, and given the state of data constraint we are in, not much changes can be done in the methodology adopted in the study.
4. The use of EPIC in other parts of the country should be encouraged to address data
constraints on time series information on soil loss and yield.

22
Soil resource depreciation and deforestation: Philippine case study in resource accounting

23
Soil resource depreciation and deforestation: Philippine case study in resource accounting
3 ACCOUNTING FOR DIPTEROCARP FOREST RESOURCES: SUMMARY OF RESULTS
3.1 General methodology: accounting for and valuing changes in the forest resource stock
Changes in the stocks of dipterocarp forest resources were first computed through the development of physical accounts. For a given accounting year, the physical account in volume terms starts with an opening stock. Two types of transactions are included: (1) additions in the form of natural stand growth, and (2) reductions in the form of harvest, wastes, stand mortality, and forest conversion/deforestation. Man-made growth as in reforestation and plantation development is treated as a separate account. Growth and reforestation may be considered as investments while reductions as disinvestments. Addition less reductions results in a net change in stock, which is added algebraically to the opening stock in order to estimate the closing stock for that year. Such end-of-the-year figure then becomes the opening stock of the next accounting year and the process continues until the end of the accounting period. Depreciation (appreciation) was subsequently estimated using two approaches that draw primarily from the market values of derived products. 3.1.1 The net price method
The most frequently used approach involves a two-step procedure that develops the physical (volume) accounts for an accounting period and covers previous and current years. The resulting change in resource stocks is then expressed in monetary terms through the net price method. The rationale for this is that net price may be used to approximate the inter-temporal effect of scarcity on the welfare of various generations. The net price is used as a proxy for the marginal user cost: it is indicative of the foregone use by future generations who are left with fewer resources, and it also reflects the sacrifice that conservation-oriented, present-day users make for the sake of subsequent generations requirements. Measuring scarcity costs is thus estimated through multiplying net prices with the physical depletion estimates. The net price is computed as the difference between unit price of the extractive resource products (on-site) less the marginal cost of production and a normal return to capital (or the profit and risk margin). For timber resources, the use off net prices where a normal return to the investment is also deducted as cost, yields stumpage values. The method is convenient to use and has been applied in several country studies conducted under the auspices of the World Resources Institute (e.g. Repetto et al. 1989). When equilibrium exists in the market for natural resources (i.e. when the rate of increase of net price or stumpage value equals the return on alternative investments, or the market rate of interest), “depletion as measured by changes in the present value of the resource equals depletion as measured by the net price method” (Landefeld and Hines 1985:14). For this to happen, either the production has to be monopolistically controlled, or there must be perfect arbitrage among all capital of all forms worldwide. The net price method does not require assumptions on patterns of depletion over time, or the service life of the asset. Existence of equilibrium in the product markets however, depends on the ability of the resource owner to participate in the market as well as on the competitiveness of markets. The net price method has other weaknesses hence, the need to explore various methods for valuing natural resource depreciation. One of these weaknesses is imperfections in the market.

24
Soil resource depreciation and deforestation: Philippine case study in resource accounting
Examples are:
1. monopoly, which implies that the net price is inclusive of monopoly rent and therefore tends to overvalue scarcity;
2. the absence of pseudo-forward market due to information bottlenecks; 3. institutional bottlenecks such as tenure insecurity, that limit the time horizon of resource
users; 4. with public goods, non-mutually exclusive use, which means that rent is eventually
dissipated as the resource is depleted - for most open access resources such as fisheries, the net price method is inappropriate for valuing fish stocks depletion; and
5. for small open economics, declining forest stock does not affect the global wood supply and
price; thus, local scarcity is not reflected in the depreciation estimate. 3.1.2 The asset value approach
The second more appropriate approach measures year-to-year changes in the physical resource stock’s asset value. This is done by estimating the stream of goods and services from resource stocks at the beginning of the year and at the end of the year. This means including those expected in the future, and necessitates prior estimates not only of the expected lifetime of the asset but also of the future prices. The physical accounts so derived are subsequently transformed into monetary terms either through the application of the usual stumpage values or by using prices (gross values). The stream of benefits and costs are subsequently computed in present value terms through the discounting process. Figure 3 Net change in area for old-growth dipterocarp forests, Philippines, 1970-1989
-1.8
-1.6
-1.4
-1.2
-1
-0.8
-0.6
-0.4
-0.2
0
1970-1974 1975-1979 1980-1984 1985-1989
Time period
Are
a (In
mill
ion
hect
ares
)

25
Soil resource depreciation and deforestation: Philippine case study in resource accounting
Old-growth forest opening area in 1970 of 5.2 million hectares was reduced by 81 percent to a closing area of 1.0 million hectares in 1989, or an average annual net decrease of 0.21 million hectares. Area reduction was due mainly to logging at an average rate of 130,000 hectares per year and forest conversion at a rate of 80,000 logging and 34 percent to forest conversion, on the average, during the 20 year-period. Old-growth forests have thus consistently declined, albeit at a decreasing rate, with much of the decline occurring during the early years of the accounting period (Figure 3). Figure 4 Closing area: old-growth and second-growth dipterocarp forests
0
1
2
3
4
5
6
1970 1972 1974 1976 1978 1980 1982 1984 1986 1988
Year
Are
a (in
mill
ion
hect
ares
)
Old-growth forest
Second-growth forest
Second-growth forests result from the harvest of old-growth forests. The largest increases occurred in the early seventies and late eighties. However, since a significant portion of logged-over areas was converted to other uses, increase in second-growth forests area did not compensate for old-growth area reduction (Figure 4). The decline forests reached only 12.3 million CUM annually; net volume loss thus averaged at 40 million CUM/year. 3.1.3 The asset value approach
The second approach used in estimating economic depreciation of dipterocarp forest resource, the asset value approach, looks into changes in the future stream of harvests. These are then converted into changes in the present value of stumpage at the beginning and at the end of each year; a social discount rate of 15 percent per annum was applied (NRAP I Technical Report No. 6 shows the details of such calculations). Corresponding estimates amount to an average depreciation of PHP 1,427 million per year for old-growth dipterocarps on the one hand, and a lower depreciation of PHP 1,021 million annually for both old-growth and subsequent growth forests, on the other, as a consequence of appreciation from secondary forests (Table 11). Thus, the adjustments made on NNP averaged only –0.22 percent throughout the accounting period; this figure is many times less than the average adjustments of –6.2 percent implied by the net price method (IRG, Edgevale, Madecor 1991). When the index used for comparison is the forestry gross value added, the percentage is expectedly higher, averaging at 39 percent, resulting in an average net value added of PHP 2.4 billion only.

26
Soil resource depreciation and deforestation: Philippine case study in resource accounting
Table 11 Economic depreciation estimates for dipterocarp forests asset value approach based on stumpage values (in million pesos, at 1988 prices)
Old-Growth Forests Old-Growth and Subsequent Forests
Vi Vi – Vi-1 Vi Vi – Vi-1
Gross Value Added in Forestry
(GVAF)
Percent on GVAF (OG+SG)
Net Value Year ti
(1) (2) (3) (4) (5) (4) / (5) (4) + (5) 1975 0 37,327.60 n.a. 38,684.90 n.a. 1,244.20 n.a. 1,244.20 1976 1 34,421.90 -2,905.70 35,982.80 -2,702.10 1,451.50 -186.2 -1,250.60 1977 2 33,150.60 -1,271.30 34,945.60 -1,037.20 1,643.00 -63.1 605.80 1978 3 32,268.20 -882.40 34,332.50 -613.20 2,080.40 -29.5 1,467.20 1979 4 30,754.50 -1,513.70 33,128.30 -1,204.10 2,248.10 -53.6 1,044.00 1980 5 29,126.80 -1,627.70 31,856.80 -1,271.60 2,961.40 -42.9 1,689.80 1981 6 27,559.20 -1,567.60 30,698.70 -1,158.10 2,701.40 -42.9 1,543.30 1982 7 25,700.50 -1,858.80 29,310.90 -1,387.80 3,228.40 -43.0 1,840.50 1983 8 23,937.10 -1,763.40 28,089.00 -1,221.80 3,311.80 -36.9 2,090.00 1984 9 22,624.30 -1,312.70 27,399.10 -689.90 5,447.10 -12.7 4,757.10 1985 10 19,823.00 -2,801.30 25,314.00 -2,085.10 4,771.60 -43.7 2,686.50 1986 11 18,530.60 -1,292.50 24,845.20 -468.80 4,336.40 -10.8 3,867.60 1987 12 17,032.40 -1,498.20 24,294.20 -551.00 4,790.10 -11.5 4,239.10 1988 13 15,052.40 -1,980.00 23,403.40 -890.70 5,762.40 -15.5 4,871.70 1989 14 13,361.00 -1,691.30 22,964.80 -438.60 4,892.80 -9.0 4,454.20 1992 15 -504.00 2,970.10 -17.0 2,466.10 Average 25,378.00 -1,711.90 29,683.30 -1,081.60 3,365.00 -38.6 2,351.00
Notes: (1) Vi = present value of future stream of benefits at year i (for old growth forests only). (2) Vi - Vi-1 = present value of future stream of benefits at the end of the year minus present value at beginning
of the year (for old growth forests only). Negative numbers imply depreciation, while positive ones mean appreciation.
(3) Vi = present value of future stream of benefits at year i (for old growth and subsequent forests). (4) Vi - Vi-1 = present value of future stream of benefits at the end of the year minus present value at beginning
of the year (for old growth and subsequent forests). Post 1990 harvests are from residual forests, based on Forestry Master Plan estimates (1990).
(5) Source: NSCB, Philippine Statistical Yearbook, 1990. Source: NRAP1 Main Report - Table 38; rebased to 1988 using IPIN for forestry
Table 12 Depreciation estimates for dipterocarp forests: ENRAP estimates (in million pesos,
at 1988 prices)
(Depreciation) Appreciation Year Net Price Method Asset Value Method 1975 (56,660.5) (3,602.0)1976 (38,372.3) (2,702.1)1977 (37,511.0) (1,037.2)1978 (40,435.7) (613.2)1979 (36,597.4) (1,204.1)1980 (44,581.8) (1,271.6)1981 (51,789.9) (1,158.1)1982 (40,003.6) (1,387.8)1983 (40,734.6) (1,221.8)1984 (35,111.9) (689.9)1985 (17,856.9) (2,085.1)1986 (14,869.1) (468.8)1987 (19,805.8) (551.0)1988 (15,631.0) (890.7)1989 (781.2) (438.6)1992 (504.0)
Average (32,716.2) (1,239.1)Source: NRAP I (Table 37 & 38); rebased to 1988 using implicit price index for forestry. The difference (in results of the two approaches, as shown in Table 12) is caused by the inclusion of future timber harvests, the effect of continuously increasing the real values of stumpage well into the future insensitivity of net price method to the asset’s lifetime. The asset value approach in fact

27
Soil resource depreciation and deforestation: Philippine case study in resource accounting
implies that in spite of a physical growth in subsequent forests and future increases in stumpage values. An important distinction between the two approaches is the need to estimate the lifetime of forest stocks for implementing the asset value approach. The net price method does not require any estimate of the time when physical depletion is expected to occur at all. In addition, the net price method tends to overestimate depreciation because it also captures monopoly rents. This is not true for the asset value approach, where the computations are based on changes in present values, thereby eliminating monopoly rents that may initially be included in the stumpage values. 3.1.4 Unrecorded removals and timber harvesting waste
The importance of unrecorded removals and wastage of timber resources cannot be understood. Table 13 shows an attempt to estimate such sources of depletion. One factor is under-reporting of log production that, based on estimates by Bautista (1990), amounts to about 50 percent of official log production on average. With such adjustments, an average annual volume harvest of 10 million CUM is implied. Despite this, about 26.2 million CUM of removals remain unaccounted. A portion of such unrecorded removal may be attributed to unregulated fuelwood gathering, losses due to logging damage, and further adjustments for illegal logging. Based on the most conservative estimate of fuelwood consumption in 1988 of 0.56 CUM per capita at most, 2.89 million CUM is involved. Table 13 - Implied data discrepancies, various indicators (in million cubic meters)
Depletion estimates
Recorded log production
Trade adjusted log Production
Corresponding harvest
Unrecorded removals
Year
(A) (B) (C) (D) (A-D) 1971 68.2 10.7 16.7 23.8 44.41980 42.4 6.4 8.3 11.8 30.51988 12.7 3.8 4 5.7 7Average 404.0 6.7 10.0 14.2 26.2
Notes: A. Based on ENRAP estimates, 12 December 1991. B. Based on Philippine Forestry Statistics. C. Based on R.P. - Japan trade data discrepancy (Bautista, 1989). D. Computed as: (C) divided by 70% conversion efficiency. 3.2 Estimates of non-marketed household production based on forest lands
It is likely that the contribution to the economy by the forest land-based communities engaged in food production and fuelwood gathering is under-measured, because of their generally subsistence nature and the difficulty in including them in household surveys. Table 14 shows an attempt at estimating the value of upland agriculture that does not enter into market transactions due to their subsistence nature. An annual change of PHP 43.4 million during 1980-1987 was estimated, assuming that non-marketed upland production values are approximately 10 to 20 percent of lowland production values. Computed subsistence upland food production of PHP 1.52 billion in 1987 plus the average annual change of PHP 43.4 million implies a total of PHP 1.6 billion worth of unrecorded upland production in 1988.

28
Soil resource depreciation and deforestation: Philippine case study in resource accounting
Table 14 Estimates of non-marketed upland production, 1980-1987
Non-marketed production (at 1985 prices) Crop type Year Total area
(in hectares) in PHP/ha in million PHP 1980 462,625 2711987 591,777 586 347Plantation crops Annual Change 18,450 111980 247,000 4291987 314,879 1,737 547Upland rice Annual Change 9,697 171980 307,175 5131987 373,344 1,669 623Upland field crops Annual Change 9,453 161980 1,016,800 1,2131987 1,280,000 n.a. 1,517Total Annual Change 37,600 43
With respect to fuelwood gathering, some indicators enable the estimation of subsistence wood production. The average time spent on household fuelwood collection is 7.4 hours per week, which translates into 48 person-days per year. Some 151 kilograms per week is gathered of which 41 percent (62.3 kg) is consumed by the gatherer-household. Assuming that such home consumption of fuelwood is not appropriately measured in the income accounts, an estimate of the value of fuelwood gathering for subsistence consumption may be made that is based on labour opportunity costs. Applying the 41 percent (home consumption rate) to the labour opportunity cost of PHP 42 farm wage per day in 1988 translates into PHP 4.3 billion, assuming that 70 percent of the 10.5 million households in 1988 are fuelwood users, of which another 70 percent gather wood for free. The equivalent figure in 1985 is PHP 3.8 billion. Adding up the two estimates of unrecorded household production of agriculture crops and fuelwood implies a total of PHP 5.4 billion worth of income from non-timber, forest land-based production that did not enter into the national income accounts in 1988. This large value resulting from a serious measurement problem in the national income accounts does not necessarily imply that conversion of forested land into other uses is warranted. Rather, the comparison of net benefits from such conversion needs to be made in incremental terms. Using rough comparisons based on averages, depreciation using the net price method implies a loss of PHP 5,700 per hectare; on the other hand, increase in upland cultivated area means additional value of only PHP 1,154 per hectare (computed as PHP 43.4 million/37,600 ha) of subsistence production and PHP 1,800 of fuelwood consumption (PHP3.8 billion /205,000 ha). A net loss of PHP 2,750 thus characterizes forest depletion in terms of on-site values of alternative forest land uses that involves various user groups.

29
Soil resource depreciation and deforestation: Philippine case study in resource accounting
3.3 Revenue losses
Total wood removal however was more than what is implied by recorded and unrecorded log production, since considerable conversion of productive forests into other land uses occurred. Table 15 presents comparisons of the economic value from optimal timber harvest, actual depletion and recorded log production. Economic rent from optimal cuts should have averaged only PHP 17.6 billion; but actual depletion and forest land conversion resulted in an average rent of PHP 30.6 billion, or an excess of PHP 13 billion due to over cutting, forest conversion, and damage. Much of these excess earnings were earned through unrecorded removals, and therefore untaxed activities. The large difference between economic rent from actual depletion and from official log production, averaging PHP 25.7 billion, signals considerable foregone earnings from this tax base. Another source of revenue loss comes from foregone future timber from uncut old-growth forest and secondary forests. Based on optimum harvest rate simulations, an average of 14 million CUM per year would have been harvestable from old-growth forest during the remaining 20 years of its cutting cycle, and 12 million CUM annually from subsequent residual cutting cycles. On the other hand, the current picture is zero harvest from the remaining small area of old-growth forest (of less than 1.0 million hectares). In addition, projected harvest from well-managed, secondary forests under the current forestry Master Plan for example is expected to reach a lower 7.5 million CUM annually by the mid-1990s.
Table 15 Measures of economic inefficiency from forest depletion (in billion pesos, at 1985 prices)
Annual Economic Rent Estimates Economic Inefficiency Economic
Cut Actual
Depletion Log
Production Excess
Earnings Unrecorded
Removal
Period
(A) (B) (C) (B-A) (B-C) 1970-74 11.7 37.7 5.8 26.2 31.9 1975-79 14.4 36.2 5.7 21.8 31.5 1980-85 23.8 36.6 4.9 12.8 31.7 1985-89 20.5 11.9 3.2 -8.6 8.7 Average 17.6 30.6 4.9 13.0 25.7
Notes: A. Based on economic cut from 80% of 5.2 million ha old growth forest in 1969 permanently allocated for timber production.
B. Based on NRAP estimates of forest depletion, 12 December 1991. C. Based on Philippine Forestry Statistics Data.

30
Soil resource depreciation and deforestation: Philippine case study in resource accounting
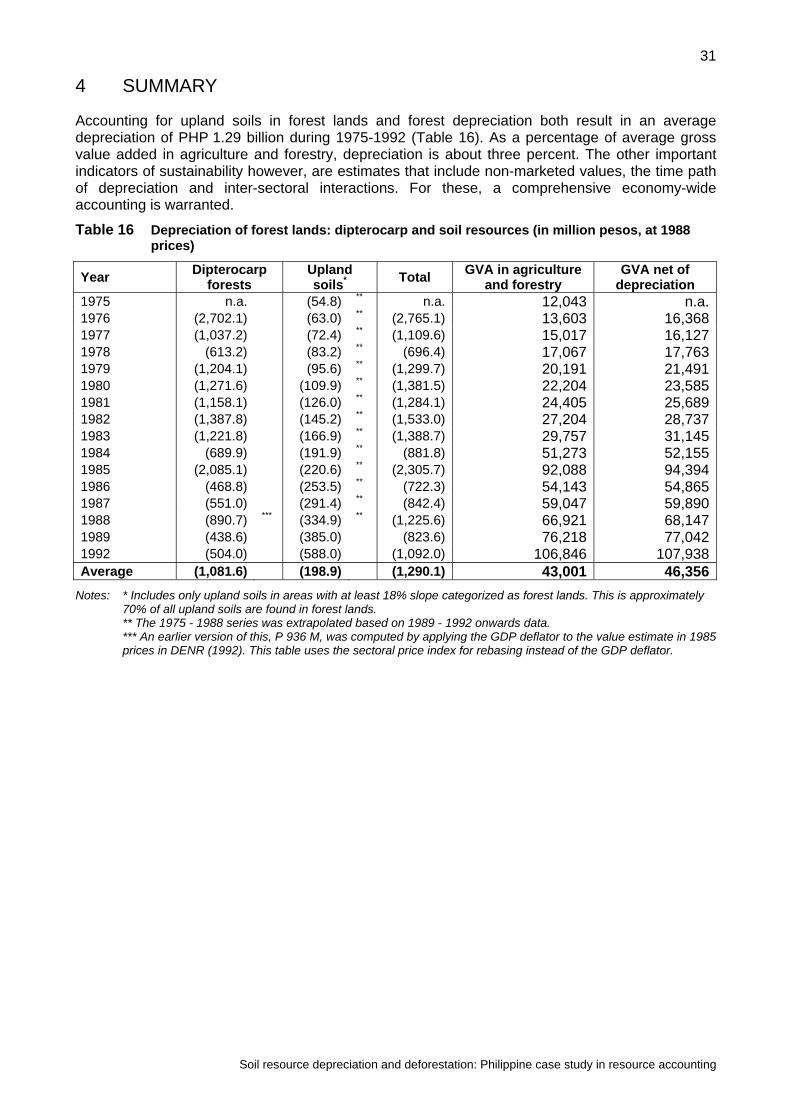
31
Soil resource depreciation and deforestation: Philippine case study in resource accounting
4 SUMMARY
Accounting for upland soils in forest lands and forest depreciation both result in an average depreciation of PHP 1.29 billion during 1975-1992 (Table 16). As a percentage of average gross value added in agriculture and forestry, depreciation is about three percent. The other important indicators of sustainability however, are estimates that include non-marketed values, the time path of depreciation and inter-sectoral interactions. For these, a comprehensive economy-wide accounting is warranted.
Table 16 Depreciation of forest lands: dipterocarp and soil resources (in million pesos, at 1988 prices)
Year Dipterocarp forests
Upland soils* Total GVA in agriculture
and forestry GVA net of
depreciation 1975 n.a. (54.8) ** n.a. 12,043 n.a. 1976 (2,702.1) (63.0) ** (2,765.1) 13,603 16,3681977 (1,037.2) (72.4) ** (1,109.6) 15,017 16,1271978 (613.2) (83.2) ** (696.4) 17,067 17,7631979 (1,204.1) (95.6) ** (1,299.7) 20,191 21,4911980 (1,271.6) (109.9) ** (1,381.5) 22,204 23,5851981 (1,158.1) (126.0) ** (1,284.1) 24,405 25,6891982 (1,387.8) (145.2) ** (1,533.0) 27,204 28,7371983 (1,221.8) (166.9) ** (1,388.7) 29,757 31,1451984 (689.9) (191.9) ** (881.8) 51,273 52,1551985 (2,085.1) (220.6) ** (2,305.7) 92,088 94,3941986 (468.8) (253.5) ** (722.3) 54,143 54,8651987 (551.0) (291.4) ** (842.4) 59,047 59,8901988 (890.7) *** (334.9) ** (1,225.6) 66,921 68,1471989 (438.6) (385.0) (823.6) 76,218 77,0421992 (504.0) (588.0) (1,092.0) 106,846 107,938Average (1,081.6) (198.9) (1,290.1) 43,001 46,356
Notes: * Includes only upland soils in areas with at least 18% slope categorized as forest lands. This is approximately 70% of all upland soils are found in forest lands.
** The 1975 - 1988 series was extrapolated based on 1989 - 1992 onwards data. *** An earlier version of this, P 936 M, was computed by applying the GDP deflator to the value estimate in 1985
prices in DENR (1992). This table uses the sectoral price index for rebasing instead of the GDP deflator.

32
Soil resource depreciation and deforestation: Philippine case study in resource accounting

33
Soil resource depreciation and deforestation: Philippine case study in resource accounting
BIBLIOGRAPHY
Alcantara, Antonio. 1989. "Environmental Management of the Hillyland Farming System." In the Philippine Council for Agriculture and Resources Research and Development (PCARRD). Productivity Enhancement in Rainfed Areas. Los Baños, Laguna: PCARRD. Agricultural Land Management and Evaluation Division (ALMED), 1990. "Crop Development and Soil Conservation Framework for Mindanao Island." Bureau of Soils and Water Management, Department of Agriculture, Quezon City, Philippines. Unpublished. ___________. "Crop Development and Soil Conservation Framework for Luzon Island." Bureau of Soils and Water Management." Department of Agriculture, Quezon City, Philippines. Unpublished. ___________. "Crop Development and Soil Conservation Framework for Visayas Island." Bureau of Soils and Water Management." Department of Agriculture, Quezon City, Philippines. Unpublished. Anderson, J.R. and J. Thampapillai. 1990. Soil Conservation in Developing Countries: Project and Policy Intervention. Washington, D.C.: Agricultural and Rural Development Department, World Bank. Bautista. 1990 Bayotlang, E. "Evaluation of Erosivity, Erodibility and Crop and Management Factors of the Universal Soil Loss Equation." Ph.D. dissertation, University of the Philippines, 1986. Unpublished. Briones, Nicomedes. 1986. "Estimating Erosion Costs: A Philippine Case Study in the Lower Agno River Watershed." In Watershed Resources Management: An Integrated Framework with Studies from Asia and the Pacific by W. Easter, J. Dixon and M. Hufschmidt (eds). Celestino, A. and Florencia P. Elliot. 1986. Hillyland Farming Systems in the Philippines: An Assessment. Laguna: Farming System and Social Research Institute (FSSRI), College of Agriculture, UP at Los Baños. Colacicco, D; T. Osborn; and K. Alt. 1989. "Economic Damage from Soil Erosion". Journal of Soil and Water Conservation. Vol. 44. No.1. Jan-Feb. Crosson, P. and A.T. Stout. 1983. Productivity Effects of Cropland Erosion in the United States. Washington, D.C.: Resources for the Future. Cruz, W., H.A. Francisco, and Z. Conway. 1988. "The On site and Downstream Costs of Soil Erosion in the Magat and Pantabangan Watersheds." Journal of Philippine Development Volume XV, No. 1, pp. 85-112. Cruz, W. and R. Repetto. 1992. "Economic Policy Reform for Natural Resource Conservation." Environment Department Working Paper No. 4. Washington D.C.: World Bank. David, W. 1987. "Erosion and Sediment Transport. Upland Resource Policy Program." Philippine Institute for Development Studies (PIDS) Working Paper 87-01. Makati: PIDS. David and Collado. 1986. ______ de Guzman, Ma. Theresa. 1997. Evaluating the Impacts of Area Development Plans and Soil Conservation Practices on Soil productivity: A Simulation Approach. (Unpublished Masteral Thesis. M.S. Ag. Econ., UPLB).

34
Soil resource depreciation and deforestation: Philippine case study in resource accounting
de Los Angeles, M.S. and N.C. Lasmarias. 1990. "A Review of Philippine Natural Resource and Environmental Management in 1980 1988." PIDS Working Paper Series No. 90 08. Makati: Philippine Institute for Development Studies. Department of Environment and Natural Resources (DENR). 1990. Master Plan for Forestry Development. Quezon City: DENR. ____________________. 1989. The Philippine Strategy for Sustainable Development. Quezon City: DENR. Dregne, H.E. 1989. "Informed Opinion: Filling the Soil Erosion Data Gap". Journal of Soil and Water Conservation. July-Aug. Vol. 44. No. 4. Evangelista, Perfecto. 1993. "Land Use on Uplands." Paper Presented at the 3rd International Soil Taxonomy Forum and Sustainable Land Management, May 17 28, 1993 at the Soil Research Development Center, Bureau of Soil and Water Management, Diliman, Quezon City, Philippines. Fertilizer Advisory, Development and Information Network for Asia and the Pacific (FADINAP). 1985. "Marketing, Distribution and Use of Fertilizer in the Philippines." An updated report by the FADINAP. Bangkok. Fernandez, Virgilio and Rogelio Serrano. 1989. "Agroforestry in the Philippines: Practices, Current R & D Undertakings, and Directions." In Soil and Water Conservation Measures and Agroforestry. Proceedings of the Training Workshop on Soil and Water Conservation Measures and Agroforestry, July 9 16. Philippine Council for Agriculture and Resources Research and Development, Los Baños, Laguna. Francisco, Herminia A. 1994. Technical Report No. 6: Upland Soil Resources of the Philippines: Resource Assessment and Accounting for Soil Depreciation. In The Philippine Environmental and Resources Accounting Project, Phase II: Reports. Department of Environmental and Natural Resources, United States Agency for International Development (USAID)/ International Resources Group, Ltd. (IRG), and Edgevale Associates. __________. 1986. "Economics of Soil Erosion and Conservation: The Case of the Magat Watershed." Ph.D. Dissertation. University of the Philippines at Los Baños. Hamilton, K. 1989. "Natural Resources and National Wealth." Discussion Paper No. 1. National Accounts and Environment Division, Statistics Canada. Landfeld and Hines. 1985. __________. ___________. 1990. "Proposed Treatment of the Environment and Natural Resources in the National Accounts: A Critical Assessment." Discussion Paper No. 7, National Account and Environment Division, Statistics Canada. Magrath, W. and P. Arens. 1989. "The Costs of Soil Erosion in Java: A National Resource Accounting Approach." Environment Department Working Paper No. 18. Washington, D.C.: Policy Planning and Research Staff, World Bank. Micosa, Alejandro and Arturo Dayot. The 1993 General Soil Map of the Philippines. Bureau of Soils Philippines. Musgrave, Warren and R. Pearse. 1984. "Soil Management Policy in Australia: Institutions, Criteria and Socio economic Research," University of New England, Australia. Presented in Philippine Council for Agriculture and Resources Research and Development, Los Baños (PCARRD). Soil Erosion Management Workshop. Dec 3 5. Los Baños, Laguna.

35
Soil resource depreciation and deforestation: Philippine case study in resource accounting
National Economic and Development Authority (NEDA). 1991. National Handbook on Land and Other Physical Resources. National Land Use Committee, NEDA. International Resources Group, Ltd. (IRG), Edgevale Associates and Mandala agricultural Development corporation (MADECOR). Natural Resources Accounting Project Phase I. The Philippine Natural Resource Accounting Project: Final Report of Phase I Activities. Manila. Paningbatan, Eduardo P. 1993. "Management of Soil Erosion for Sloping Uplands in the Philippines." Paper Presented at the Third International Forum on Soil Taxonomy and Sustainable Land Management, May 16 29, Bureau of Soil and Water Management, Diliman, Quezon City, Philippines. ______________________. 1989. "Soil Erosion Problem and Control in the Philippines." In Soil and Water Conservation Measures and Agroforesty. Proceedings of the Training Workshop on Soil and Water Conservation Measures and Agroforestry, July 9 16, 1989, Philippine Council for Agriculture and Resources Research and Development, Los Baños, Laguna. ______________________, D. Guinto, and R. Comia. 1991. "Soil Conservation for Hillyland Farming Systems." In PCARRD Productivity Enhancement in Rainfed Areas. Los Baños, Laguna: PCARRD, October 26, 1989. Philippine Council for Agriculture and Resources Research and Development, Los Baños (PCARRD). 1978. "Soil Conservation." Proceedings of the National Seminar Workshop on Soil Conservation, PCARRD Headquarters. Los Baños, Laguna, July 28 30. _____________________.1984. The Philippine Recommends for Soil Conservation. PCARRD Headquarters, Los Baños, Laguna. _____________________.1991. State of the Art: Soil and Water Conservation in the Philippine Upland Watersheds. PCARRD Headquarters, Los Baños, Laguna. _____________________.1992. Management and Rehabilitation of Degraded Hillylands. PCARRD Headquarters, Los Baños, Laguna. Repetto, R., W. Magrath, M. Wells, C. Bees and F. Rossini. 1989. "Wasting Assets". Washington, D.C.: World Resources Institute. Repetto, R. 1986. "Economic Policy Reform for Natural Resource Conservation." Environment Department Working Paper 2. Washington, D.C.: World Bank. Sajise, P.E. 1984. "Soil Erosion and Soil Conservation in the Philippines Some Traditional and Modern Practices." In Conference on Soil Rehabilitation: The Philippine Experience, April 12 14, Ramon Magsaysay Award Foundation, Manila, Philippines. ___________, and Delfin Ganapin, Jr. 1990. "Overview of Upland Development Issues and Problems." Proceedings of the 1st NGO Consultative Workshop on Upland Development Issues and Proceedings, PURC Upland NGO Assistance Committee, April 22 26, Ecotech Center, Lahug, Cebu City. Southgate, D. 1988. "The Economics of Land Degradation in the Third World." Environment Department Working Paper 2. Washington, D.C.: World Bank. Turker, A.K., T.A. Mcmahon, and R. Srikanthan. 1984. "Rainfall Intensity and Overland Flow in Relation to Soil Erosion Studies for Tropical Lands." Paper presented at the workshop on Soil Erosion Management, December 3 5.

36
Soil resource depreciation and deforestation: Philippine case study in resource accounting
Vincent and Hartwick. ______. FAO handbook Walker, D.J. 1982. "A Damage Function to Evaluate Erosion Control Economics." American Journal of Agricultural Economics, Nov, pp 690-698. World Resources Institute. 1991. Accounts Overdue. Natural Resource Depreciation in Costa Rica. Washington, D.C.: WRI.

37
Soil resource depreciation and deforestation: Philippine case study in resource accounting
ENDNOTES
1 Paper submitted to the FAO. Based on earlier versions prepared by the authors for the
Philippine Environmental and Natural Resources Accounting Project (ENRAP) implemented by the International Resources Group, (IRG) , Edgevale Associates and Resources, Environment and Economics Center for Studies for the Department of Environment and Natural Resources under funding from the US Agency for International Development.
2 Vice-President and Board Chair, respectively, of the Resources, Environment and Economic
Center for Studies (REECS); The authors are consultants and project leader, respectively of ENRAP.
3 As discussed during the ENRAP II Mini-Workshop in the Soil Resources Accounting Study,
January 8, 1994, City of Springs, Los Baños, Laguna.

38
Soil resource depreciation and deforestation: Philippine case study in resource accounting