Soil Protection Activities and Soil Quality Monitoring in SEE
JUNE 2005
Soil quality monitoring technical report
Bruce Croucher Resource Investigations Department Greater Wellington Regional Council

Contents
1. Introduction 1 1.1 What is so important about soils? 1 1.2 Why do we monitor soils? 1 1.3 Scope of the programmes 1
2. Policy context 3
Monitoring programmes 5
3. Soil quality monitoring 5 3.1 Soil quality indicators 5 3.2 Analysis of soil quality 6 3.3 Correcting for bias in datasets 10 3.4 Regional soil quality expressed on an area basis 11 3.5 Comparison of the Wellington region with other regions 12 3.6 Is land use affecting soil health? 13 3.6.1 Pasture 13 3.6.2 Exotic forestry 15 3.6.3 Cropping and horticulture 16 3.6.4 Indigenous vegetation 17 3.7 Conclusions 18 3.8 Recommendations 19
4. Background concentration of metals 22 4.1 How do the metals get there? 22 4.2 Background concentration of heavy metal in the Wellington region 23 4.2.1 Identification of the main soil types 23 4.2.2 Sampling and analysis of soils 24 4.3 Results 26 4.4 Heavy metals concentration in soil from soil quality monitoring sites in the Wellington region 27 4.5 Results 28 4.6 Conclusions 29 4.7 Recommendations 30
5. Contaminated land 31 5.1 Selected Land Use Register 31 5.2 Identification of hazardous activities and industries in the Wellington region 32
Appendix 1 34
Appendix 2 43
Appendix 3 45
Appendix 4 46

SOIL QUALITY MONITORING TECHNICAL REPORT PAGE 1 OF 48
1. Introduction
1.1 What is so important about soils?
The soils of the region provide a habitat for a diverse range of flora and fauna and support a wide range of agricultural practices. Maintaining the health and reserves of high quality soils is fundamental to the sustainability of the region. High quality soils are a scarce commodity, only 54% of New Zealand’s land can support agriculture and just 5% is suitable for horticultural use. Whilst only accounting for a small proportion of the Gross Domestic Product, the agriculture sector is critical to the New Zealand economy. Accounting for 52% of goods exports and generating 150,000 jobs, the sector and its downstream effects have a significant influence on the overall health of the New Zealand economy.
Agricultural practices can cause in degradation of a soil’s health and structure resulting in reduced productivity. The intensification of these agricultural practices such as increased stock numbers, fertiliser application and irrigation are placing ever increasing burdens on our soils.
The function of a soil is not only to support plant growth, soils also store, regulate and filter water and chemicals. These other soil functions have been given a lesser importance in the past, the main focus being on increasing soils productivity. However, research has shown that all the properties of soils need to be maintained to ensure the most efficient and sustainable use of soils and to protect the environment.
Increased leaching of nutrients and pathogens and effluent into aquifers and waterways provide an indication that the function of the soils is being impaired. The pollution of our soils and waterways threatens the “Clean and Green” image of New Zealand that is so important to our tourism and dairy industries.
1.2 Why do we monitor soils?
Regional Councils are charged with the responsibility for promoting the management of the natural and physical resource of their region. Monitoring of these resources establishes the state of the environment and whether the communities’ expectations are being met.
The results of the monitoring provide information that can be used to change or prioritise, the manner in which we manage the environment. The trends determined by the monitoring of soils can be used to develop policies and rules that will protect the sustainability of our soils resources.
1.3 Scope of the programmes
Greater Wellington has undertaken soil quality sampling and analysis annually since 1999/2000 to monitoring the condition of the high quality soils in the region. The soil quality monitoring programme has concentrated on assessing high quality soil sites under a range of different land uses.
PAGE 2 OF 48 SOIL QUALITY MONITORING TECHNICAL REPORT
The soil quality monitoring programme monitors the health of the high quality soils in the region and in particular the following:
• The fertility of the soil;
• The structure of the soil; and,
• The accumulation of metals from anthropogenic sources.
The programme has now sampled sufficient sites to provide robust representative information on the quality of these soils. However, no resampling of any sites has yet been undertaken and until the sites have been sampled three times, it will not be possible to determine any trends in soil quality with any confidence.
Background soil monitoring was undertaken to determine the concentrations of common pollutants that occur naturally within the soils of the region. In 2003 and 2004, forty six sites on five different soil types across the region were sampled. The samples were analysed for a range of heavy metals and total petroleum hydrocarbons. The information provided by this monitoring enables Greater Wellington to assess whether the pollutants are accumulating in the regions soils and whether sites are contaminated.
Greater Wellington also maintains a Selected Land Use Register which records sites where hazardous activity or industry has taken place. The register also records confirmed contaminated sites, remediated sites and sites that have shown to be uncontaminated. Greater Wellington undertakes to identify these sites and provides site specific information to the landowner and public on request. The Selected Land Use Register is also available to the Territorial Authorities to assist them when processing Land Information Memoranda and Resource/Building Consents.
SOIL QUALITY MONITORING TECHNICAL REPORT PAGE 3 OF 48
2. Policy context
The soil quality monitoring programme was established to monitor the performance of the following objectives in the Regional Policy Statement and Regional Soil Plan for the Wellington Region: -
RPS Soil & Minerals - Objective 1 The soils of the Wellington Region maintain those desirable physical, chemical, and biological characteristics which enable them to retain their life supporting capacity and to sustain plant growth.
Soil Plan - Objective 4.1.3 The life supporting capacity of the regions soils is maintained.
Soil degradation has been raised as an issue. The loss of soil structure or fertility, or the loss of the soil cover itself, reduces the potential of soil to meet the needs of land users, and may reduce the life supporting capacity of soil. The intentions of these objectives are that the basic physical, chemical and biological properties of soils are maintained.
The incidence of erosion, eutrophication, and contamination of soil and waterways in the Region shows that the capacity of some soils to meet the life supporting and productive functions required of them is being undermined by inappropriate land use practices.
RPS Soil & Minerals - Objective 2 Land degradation is limited to that for which there is no feasible remedy.
Soil Plan - Objective 4.1.2 The potential of Regions soils to provide for a full range of uses for present and future generations in maintained or enhanced
The intentions of these objectives are that, in the long-term and over the Region as a whole, the amount or extent of degraded land should only be that which results from natural processes which it is not feasible to control. By "feasible" is meant that a remedy is technically possible and financially achievable. Where it is feasible to control or influence the causes of degradation — whether this results from natural processes or human activities or some combination of these — such degradation is either prevented or remedied. This allows for situations where, in spite of the best efforts, degradation might still occur, but requires that the damage be remedied.
RPS Soil & Minerals - Objective 5 The off-site impacts of soil degradation on land, water, air, ecosystems and communities are avoided or mitigated.
The intent of this objective is to encourage land users to have regard to the wider context in which their land use activities take place. The strong interrelationship between soils, water, vegetation and air means that effects on one usually flow on to affect another. Some degradation will occur as a result of natural events or human actions, or some combination of both, but this
PAGE 4 OF 48 SOIL QUALITY MONITORING TECHNICAL REPORT
should be controlled to the extent that damage is avoided or mitigated to a level that is acceptable to the communities affected.
It is intended that resource users should first seek to avoid or mitigate off-site impacts, rather than allowing them to occur unabated before trying to remedy them.
Soil Plan - Objective 4.1.4 There is sufficient information to make sound resource management decisions.
The soil monitoring programme was established in 1999/2000 in conjunction with the Ministry for the Environment and Landcare Research. Baseline information has been gathered for the high quality soils in the region under a range of land uses. The information the programme has provided could be used as the basis of relevant resource management decisions although any trends in soil quality have yet to be determined.
SOIL QUALITY MONITORING TECHNICAL REPORT PAGE 5 OF 48
Monitoring programmes
3. Soil quality monitoring
3.1 Soil quality indicators
In 1999 the Ministry for the Environment, Landcare Research, Crop and Food Research and number of Regional Councils initiated a national soil quality monitoring programme. Greater Wellington became involved in the programme is known as “The 500 Soils Project” in 2000. As part of the 500 Soils Project a standard set of sampling methods and chemical, physical and biophysical parameters were identified. A value or ranges of values for each of the parameters were derived enabling the relationship between the qualitative measure of the soil attribute and its soil quality rating to be determined. The use of these standard methods/parameters allows comparisons of similar soils and land uses both within the regions and nationally.
Since 2000 Greater Wellington Regional Council has undertaken sampling on an annual basis to assess soil quality in the region, and to report on sustainable land use. One hundred and sixteen sites have been identified and characterised, covering the main land uses and soil types in the region. Where it was possible samples have been taken from different land uses on the same soil type to help identify the impact of various activities on soil types.
Twelve primary soil quality indicators were selected to assess soil quality across the region and a wide range of soil types. The properties have been separated into three distinct groups. The first group are the chemical properties defining the pH of the soil and the concentration of those elements associated with the soil fertility (Total Carbon and Nitrogen, Olsen Phosphate and exchangeable Calcium, Potassium and Magnesium).
The second group are the biological properties. Potentially mineralisable Nitrogen concentrations provide an estimate of the nitrogen status of soil organic matter, and is a surrogate measure for soil microbial biomass.
The third group are the physical properties these determine the weight, porosity and size of the soil and its particles. The properties measured are bulk density, particle density and water release characteristics, which provide information on total porosity, macroporosity, total available water and readily available water. Aggregate stability which provides information on the size of the soil particles has also been measured, but only on sites where the soil is regularly tilled e.g. intensive cropping and market gardens.
The groups of properties are detailed in Table 1, and more detailed information on the properties and function of the soil quality parameters is appended in Appendix 1.
PAGE 6 OF 48 SOIL QUALITY MONITORING TECHNICAL REPORT
Table 1: Indicators used for soil quality assessment Indicators Soil Quality Information Method
Chemical properties
Total C content Organic matter status Dry combustion, CNS Analyser
Total N content Organic N reserves Dry combustion, CNS Analyser
Soil pH Acidity or alkalinity Glass electrode pH meter, 1:2.5 in water
Olsen P Plant available phosphate Bicarbonate extraction, molybdenum blue method.
Exchangeable Ca, K and Mg Plant available cations QuickTest extraction.
Biological properties
Potentially mineralisable N Readily mineralised N reserves (also provides extractable ammonium and nitrate concentrations
Waterlogged incubation at 40°C for 7 days
Physical properties
Dry bulk density Compaction, volumetric conversions
Soil cores
Particle density Used to calculate porosity and available water
Specific gravity
Total porosity, air capacity and macroporosity
Soil compaction, root environment, aeration, voids
Pressure plates
Total and readily available water Water for plant growth and soil biology
Pressure plates
Aggregate stability Presence of soil crumbs, stable soil structure
Wet sieving
A detailed description of the sampling and analytical methods used to determine the soil quality parameters is attached as Appendix 2.
The soil quality indicators themselves do not measure soil quality. Soil quality is a value judgement about how suitable a soil is for a particular use. A group of experts in soil science have developed soil response curves for each of the soil properties for different soil order/land use combinations. The indicators represent the attributes of a soil (e.g. pH, bulk density). Consequently different target values for indicators are required for different land uses. For example, acidic soils with pH <5 may be of suitable quality to grow radiata pine, but not for a good crop of white clover. Soils that are stony and excessively free-draining may be of poor quality for pasture production, but of excellent quality for vineyards.
3.2 Analysis of soil quality
The soil quality monitoring programme undertaken since 1999 has involved the following:
SOIL QUALITY MONITORING TECHNICAL REPORT PAGE 7 OF 48
• Location of the high quality soils in the region;
• identification of sites covering a range of landuses for each of the soil types;
• undertaking site investigations to confirm the soil type; and
• sampling of the identified sites.
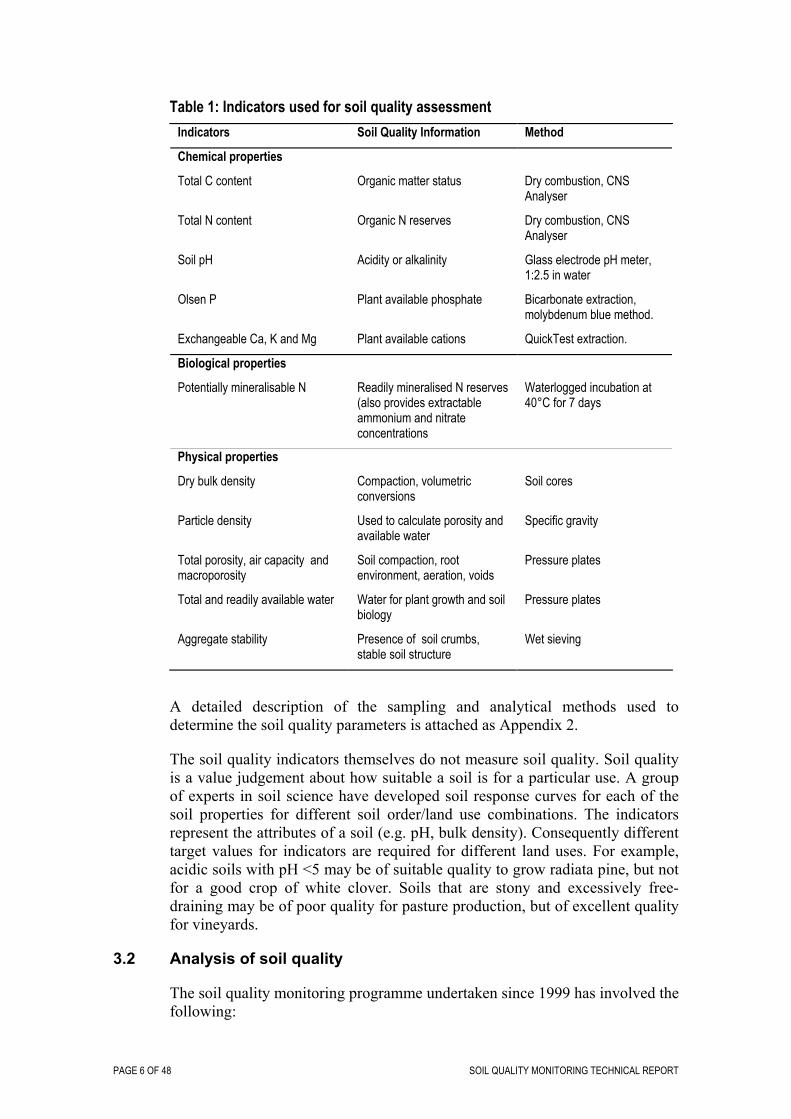
The programme has a provided a data set establishing baseline information on the quality of the soils in the region. The sample locations are shown on Map 1 – Location of soil quality monitoring sites. Until the resampling of sites has been undertaken and any trends in soil quality determined, the best measure of the state of the soils in the region is to compare them to the soil quality indicators developed during the 500 soils project. The statistical methods and data management techniques to allow comparison between soil types and different regions are appended as Appendix 3.
PAGE 8 OF 48 SOIL QUALITY MONITORING TECHNICAL REPORT
SOIL QUALITY MONITORING TECHNICAL REPORT PAGE 9 OF 48
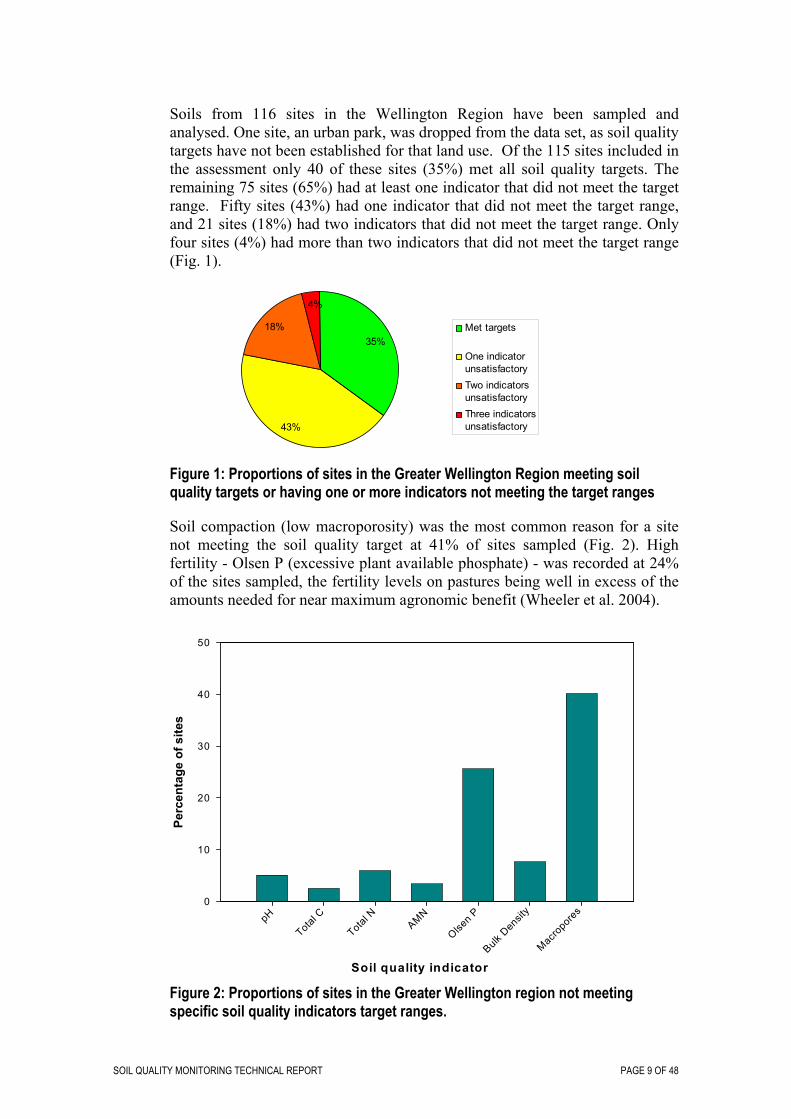
Soils from 116 sites in the Wellington Region have been sampled and analysed. One site, an urban park, was dropped from the data set, as soil quality targets have not been established for that land use. Of the 115 sites included in the assessment only 40 of these sites (35%) met all soil quality targets. The remaining 75 sites (65%) had at least one indicator that did not meet the target range. Fifty sites (43%) had one indicator that did not meet the target range, and 21 sites (18%) had two indicators that did not meet the target range. Only four sites (4%) had more than two indicators that did not meet the target range (Fig. 1).
35%
4%
18%
43%
Met targets
One indicatorunsatisfactoryTwo indicatorsunsatisfactoryThree indicatorsunsatisfactory
Figure 1: Proportions of sites in the Greater Wellington Region meeting soil quality targets or having one or more indicators not meeting the target ranges
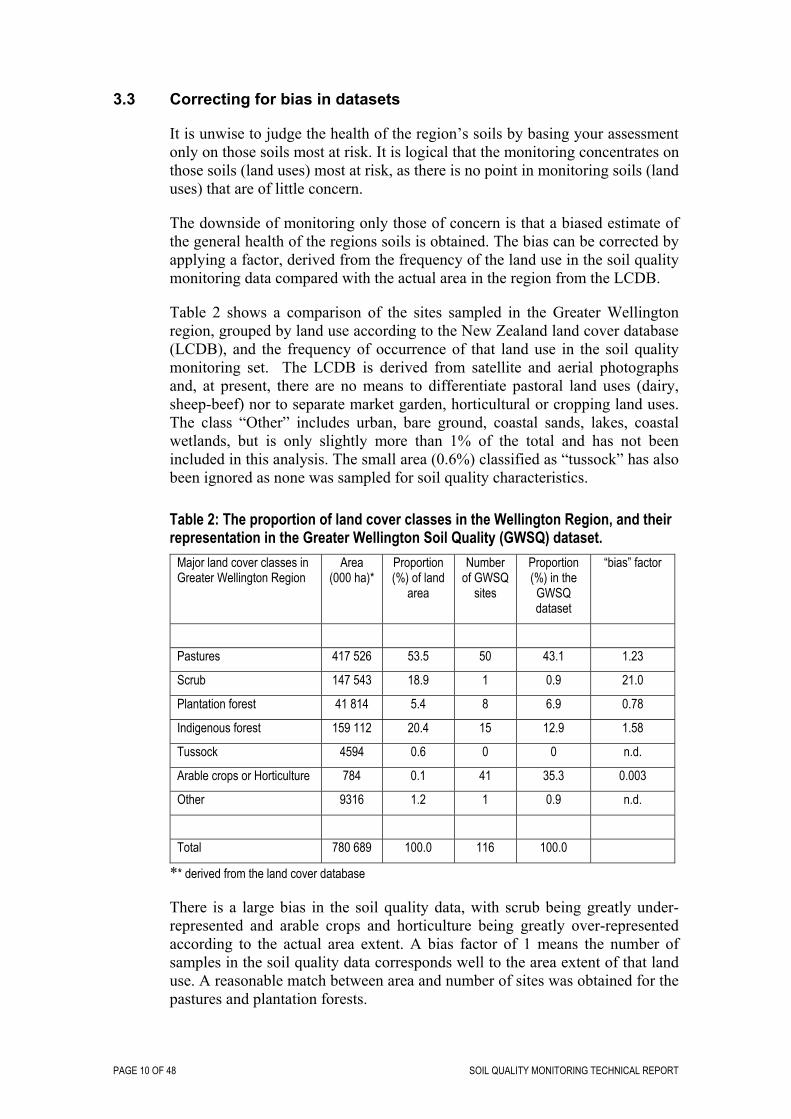
Soil compaction (low macroporosity) was the most common reason for a site not meeting the soil quality target at 41% of sites sampled (Fig. 2). High fertility - Olsen P (excessive plant available phosphate) - was recorded at 24% of the sites sampled, the fertility levels on pastures being well in excess of the amounts needed for near maximum agronomic benefit (Wheeler et al. 2004).
Soil quality indicator
pH
Total C
Total N
AMN
Olsen P
Bulk D
ensit
y
Macropo
res
Perc
enta
ge o
f site
s
0
10
20
30
40
50
Figure 2: Proportions of sites in the Greater Wellington region not meeting specific soil quality indicators target ranges.
PAGE 10 OF 48 SOIL QUALITY MONITORING TECHNICAL REPORT
3.3 Correcting for bias in datasets
It is unwise to judge the health of the region’s soils by basing your assessment only on those soils most at risk. It is logical that the monitoring concentrates on those soils (land uses) most at risk, as there is no point in monitoring soils (land uses) that are of little concern.
The downside of monitoring only those of concern is that a biased estimate of the general health of the regions soils is obtained. The bias can be corrected by applying a factor, derived from the frequency of the land use in the soil quality monitoring data compared with the actual area in the region from the LCDB.
Table 2 shows a comparison of the sites sampled in the Greater Wellington region, grouped by land use according to the New Zealand land cover database (LCDB), and the frequency of occurrence of that land use in the soil quality monitoring set. The LCDB is derived from satellite and aerial photographs and, at present, there are no means to differentiate pastoral land uses (dairy, sheep-beef) nor to separate market garden, horticultural or cropping land uses. The class “Other” includes urban, bare ground, coastal sands, lakes, coastal wetlands, but is only slightly more than 1% of the total and has not been included in this analysis. The small area (0.6%) classified as “tussock” has also been ignored as none was sampled for soil quality characteristics.
Table 2: The proportion of land cover classes in the Wellington Region, and their representation in the Greater Wellington Soil Quality (GWSQ) dataset.
Major land cover classes in Greater Wellington Region
Area (000 ha)*
Proportion (%) of land
area
Number of GWSQ
sites
Proportion (%) in the GWSQ dataset
“bias” factor
Pastures 417 526 53.5 50 43.1 1.23
Scrub 147 543 18.9 1 0.9 21.0
Plantation forest 41 814 5.4 8 6.9 0.78
Indigenous forest 159 112 20.4 15 12.9 1.58
Tussock 4594 0.6 0 0 n.d.
Arable crops or Horticulture 784 0.1 41 35.3 0.003
Other 9316 1.2 1 0.9 n.d.
Total 780 689 100.0 116 100.0
** derived from the land cover database
There is a large bias in the soil quality data, with scrub being greatly under-represented and arable crops and horticulture being greatly over-represented according to the actual area extent. A bias factor of 1 means the number of samples in the soil quality data corresponds well to the area extent of that land use. A reasonable match between area and number of sites was obtained for the pastures and plantation forests.
SOIL QUALITY MONITORING TECHNICAL REPORT PAGE 11 OF 48
The bias in the data set does not imply any criticism of the monitoring policy. It is justifiable to monitor those sites which are at more at risk of losing soil quality, but care is needed to avoid reporting excessively pessimistic soil-quality condition in the region.
3.4 Regional soil quality expressed on an area basis
High quality soils only cover a small percentage of the region’s area. Therefore, to determine what percentage of the region may not meet the soil quality indicators, the results of the monitoring were extrapolated and adjusted for bias.
Using the area of land in each land-use class, the soil quality in the Greater Wellington Region was estimated. This approach assumes the proportion of the area affected was the same as the proportion of sites not meeting quality targets and that the effects observed on the higher class soils are reflected in the other soils of the region.
Using this calculation, 57% of the region’s area may exceed one or more of the soil quality indicators. The large area of pastoral land, much of which had moderate compaction, dominated this figure. The converse figure, that 43% of the land met all soil quality targets, is substantially greater than the proportion of 35% if calculated without the area and bias correction (Table 3).
Table 3: The proportions and area of land cover classes with some concern regarding soil quality condition in the Wellington region.
Major land cover classes in Wellington Region
Area (000 ha)*
% sites with soil quality indicators “of some concern”
Estimated area of soils with “some concern” (000 ha)
% of regional area
Pastures 417 526 88 367 422 47
Scrub 147 543 No data 0 Unknown
Plantation forest 41 814 25 10 453 1.3
Indigenous forest 159 112 44 70 009 9
Tussock 4594 No data 0 Unknown
Arable crops or Horticulture 784 51 400 0.05
Other 9316 No data 0 Unknown
Total 780 689 448 284 57%
* derived from the land cover database
The areas where there is no data are predominately located on the lower class soils of the region or are urban areas and therefore have not yet been subject to any monitoring.
PAGE 12 OF 48 SOIL QUALITY MONITORING TECHNICAL REPORT
3.5 Comparison of the Wellington region with other regions
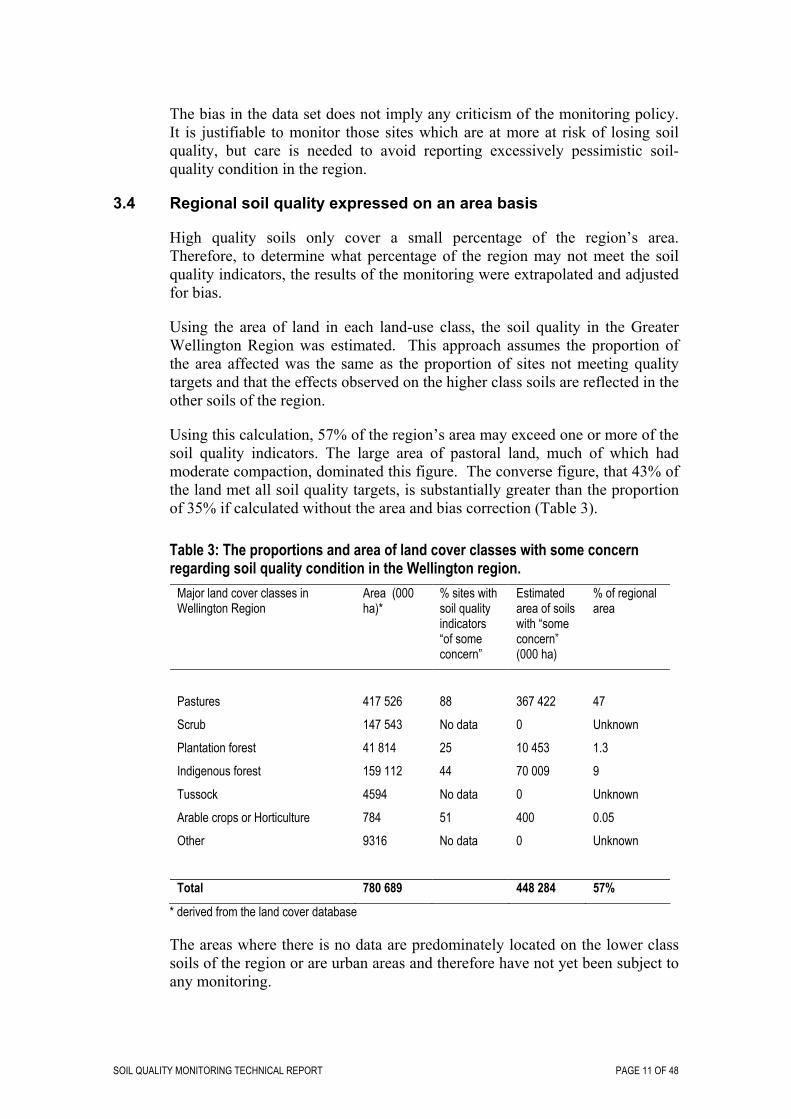
The proportion of sites meeting soil quality targets (35%) in the Wellington Region was very slightly greater than the proportion for other regions in New Zealand (32%). However, this comparison is greatly affected by the sites that the various regions chose to sample. If regions chose to sample a higher proportion of “at risk” sites then it is likely that a greater proportion will not meet the soil quality target ranges. To illustrate this point, you would not try to judge the general health of your whole community by assessing only those people in hospital, even though they would be most at need. The proportions of sites with one, two or more indicators not meeting targets were very similar in all regions. (Fig. 3).
Met all
7 so
il qua
lity ta
rgets
One in
dicato
r uns
atisfa
ctory
Two ind
icator
s uns
atisfa
ctory
Three o
r more
indic
ators
unsa
tisfac
tory
Perc
enta
ge o
f site
s
0
10
20
30
40
50
Greater WellingtonOther Regions
Figure 3: Comparison of the proportion of sites in Wellington region and sites in other regions of New Zealand meeting soil quality targets
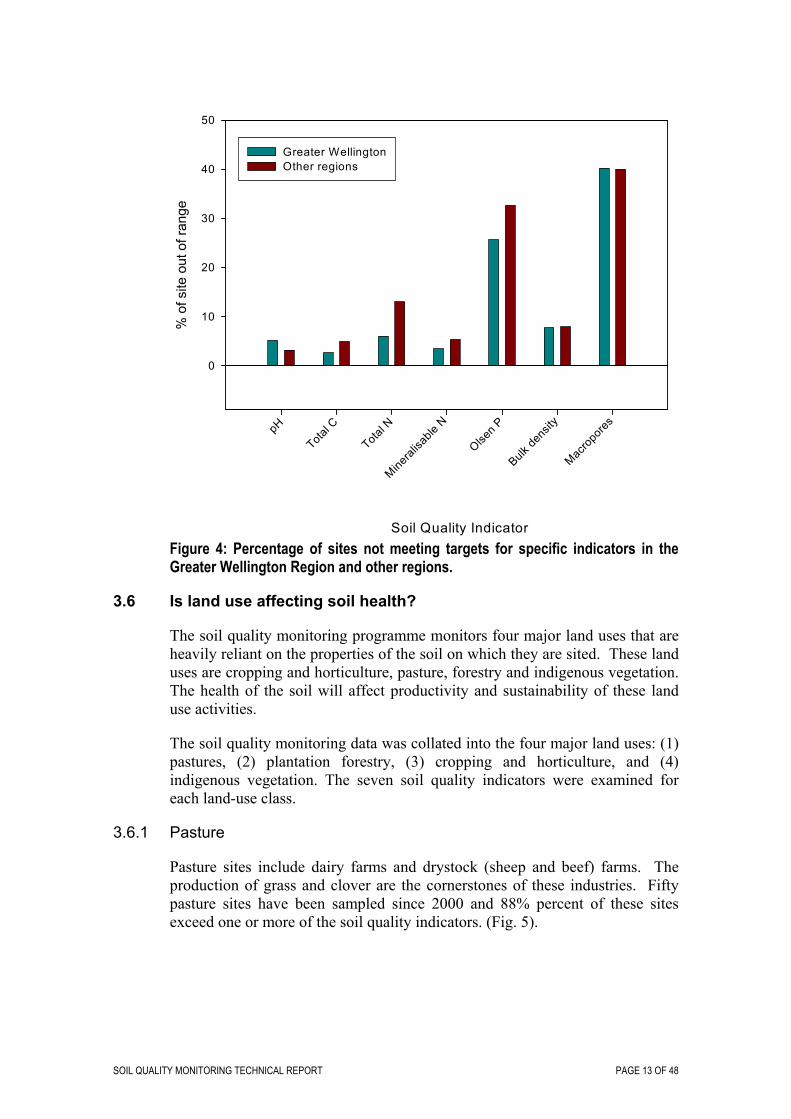
The similarity of these results was consistent with the general similarity of the individual indicator values for Wellington sites compared to sites in other regions – i.e. the reasons for sites not meeting soil quality target ranges were generally the same throughout the country – there was widespread compaction under pastures, often coupled with very high Olsen P levels, loss of organic matter and aggregate stability under cropping, again with very high fertility levels (Fig. 4).
SOIL QUALITY MONITORING TECHNICAL REPORT PAGE 13 OF 48
Soil Quality Indicator
pH
Total C
Total N
Mineral
isable
N
Olsen P
Bulk de
nsity
Macrop
ores
% o
f site
out
of r
ange
0
10
20
30
40
50
Greater WellingtonOther regions
Figure 4: Percentage of sites not meeting targets for specific indicators in the Greater Wellington Region and other regions.
3.6 Is land use affecting soil health?
The soil quality monitoring programme monitors four major land uses that are heavily reliant on the properties of the soil on which they are sited. These land uses are cropping and horticulture, pasture, forestry and indigenous vegetation. The health of the soil will affect productivity and sustainability of these land use activities.
The soil quality monitoring data was collated into the four major land uses: (1) pastures, (2) plantation forestry, (3) cropping and horticulture, and (4) indigenous vegetation. The seven soil quality indicators were examined for each land-use class.
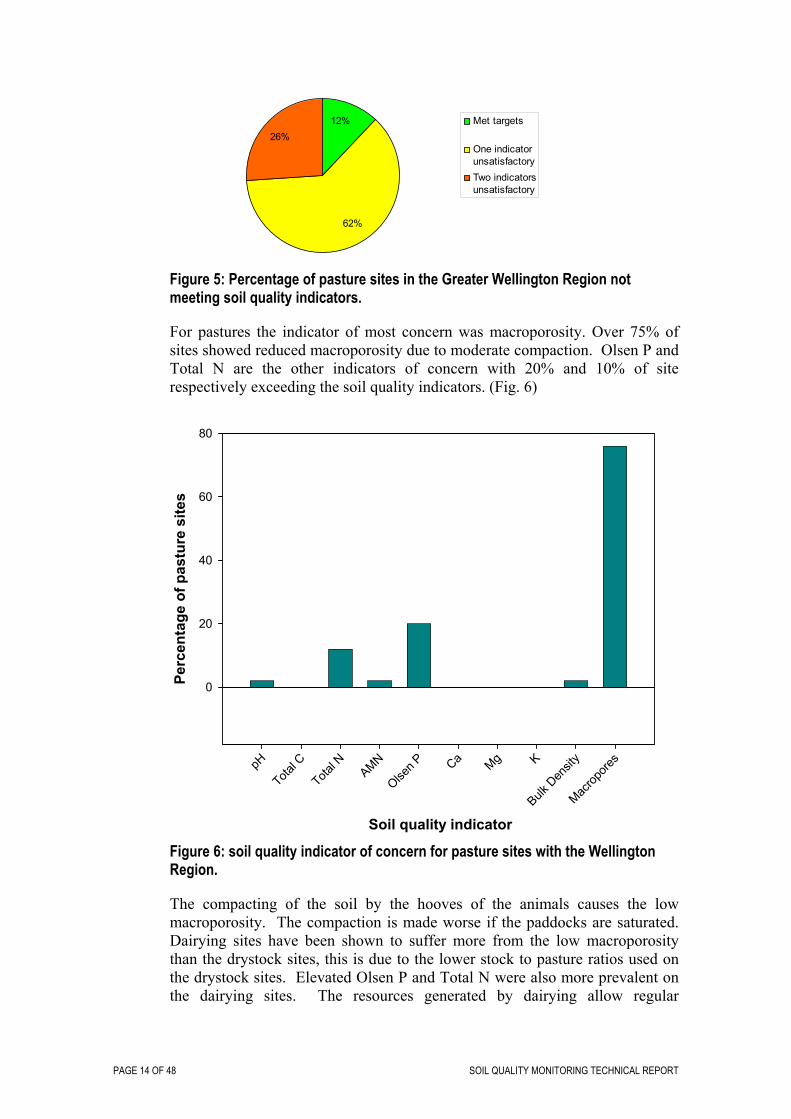
3.6.1 Pasture
Pasture sites include dairy farms and drystock (sheep and beef) farms. The production of grass and clover are the cornerstones of these industries. Fifty pasture sites have been sampled since 2000 and 88% percent of these sites exceed one or more of the soil quality indicators. (Fig. 5).
PAGE 14 OF 48 SOIL QUALITY MONITORING TECHNICAL REPORT
26%12%
62%
Met targets
One indicatorunsatisfactoryTwo indicatorsunsatisfactory
Figure 5: Percentage of pasture sites in the Greater Wellington Region not meeting soil quality indicators.
For pastures the indicator of most concern was macroporosity. Over 75% of sites showed reduced macroporosity due to moderate compaction. Olsen P and Total N are the other indicators of concern with 20% and 10% of site respectively exceeding the soil quality indicators. (Fig. 6)
Soil quality indicator
pH
Total C
Total N
AMN
Olsen P Ca Mg K
Bulk D
ensit
y
Macrop
ores
Perc
enta
ge o
f pas
ture
site
s
0
20
40
60
80
Figure 6: soil quality indicator of concern for pasture sites with the Wellington Region.
The compacting of the soil by the hooves of the animals causes the low macroporosity. The compaction is made worse if the paddocks are saturated. Dairying sites have been shown to suffer more from the low macroporosity than the drystock sites, this is due to the lower stock to pasture ratios used on the drystock sites. Elevated Olsen P and Total N were also more prevalent on the dairying sites. The resources generated by dairying allow regular
SOIL QUALITY MONITORING TECHNICAL REPORT PAGE 15 OF 48
applications of fertiliser to be applied to their paddock, thus generating more grass, allowing more animals to graze the land than on drystock sites.
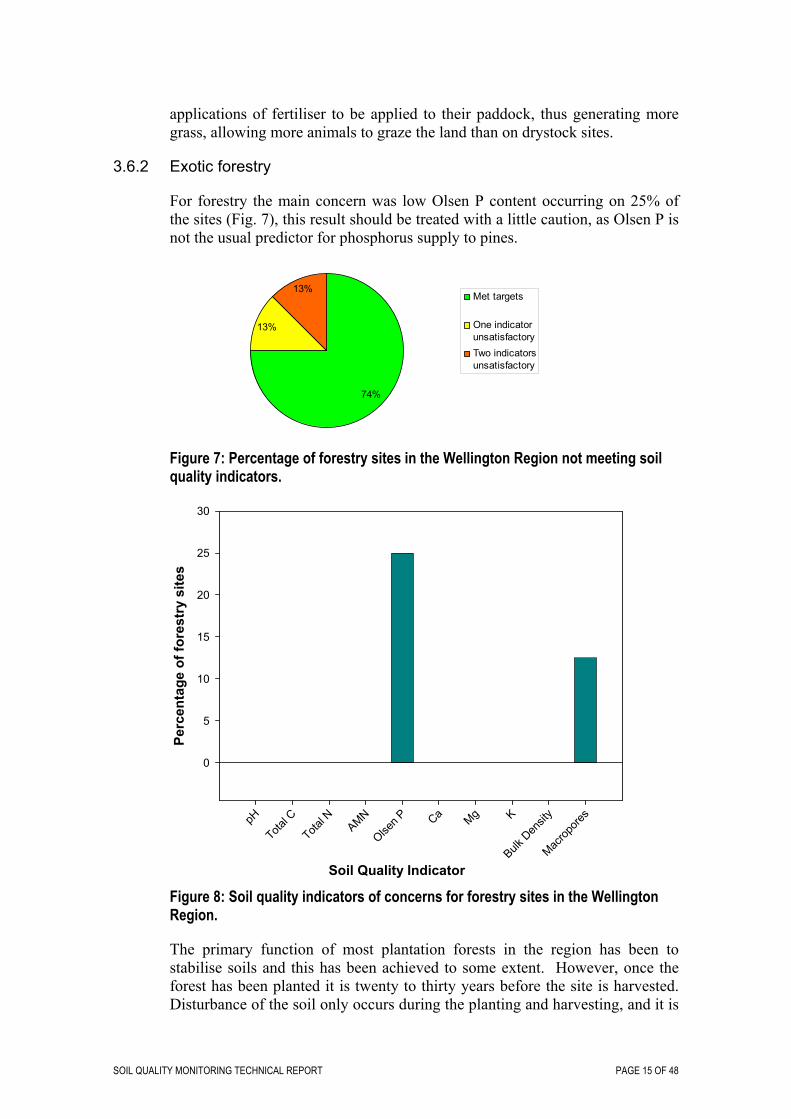
3.6.2 Exotic forestry
For forestry the main concern was low Olsen P content occurring on 25% of the sites (Fig. 7), this result should be treated with a little caution, as Olsen P is not the usual predictor for phosphorus supply to pines.
13%
74%
13%Met targets
One indicatorunsatisfactoryTwo indicatorsunsatisfactory
Figure 7: Percentage of forestry sites in the Wellington Region not meeting soil quality indicators.
Soil Quality Indicator
pH
Total C
Total N
AMN
Olsen P Ca Mg K
Bulk D
ensit
y
Macrop
ores
Perc
enta
ge o
f for
estr
y si
tes
0
5
10
15
20
25
30
Figure 8: Soil quality indicators of concerns for forestry sites in the Wellington Region.
The primary function of most plantation forests in the region has been to stabilise soils and this has been achieved to some extent. However, once the forest has been planted it is twenty to thirty years before the site is harvested. Disturbance of the soil only occurs during the planting and harvesting, and it is
PAGE 16 OF 48 SOIL QUALITY MONITORING TECHNICAL REPORT
unlikely that any physical damage to the soil happens whilst the trees are growing. Exotic pine trees do not consume large amounts of nutrient from the soils and application of fertilisers to the soils is rare. Only eight sites have been sample and of these only two sites exceeded the soil quality indicators. This has potentially resulted in the exaggeration of the percentage of forestry sites which do not meet soil quality indicators.
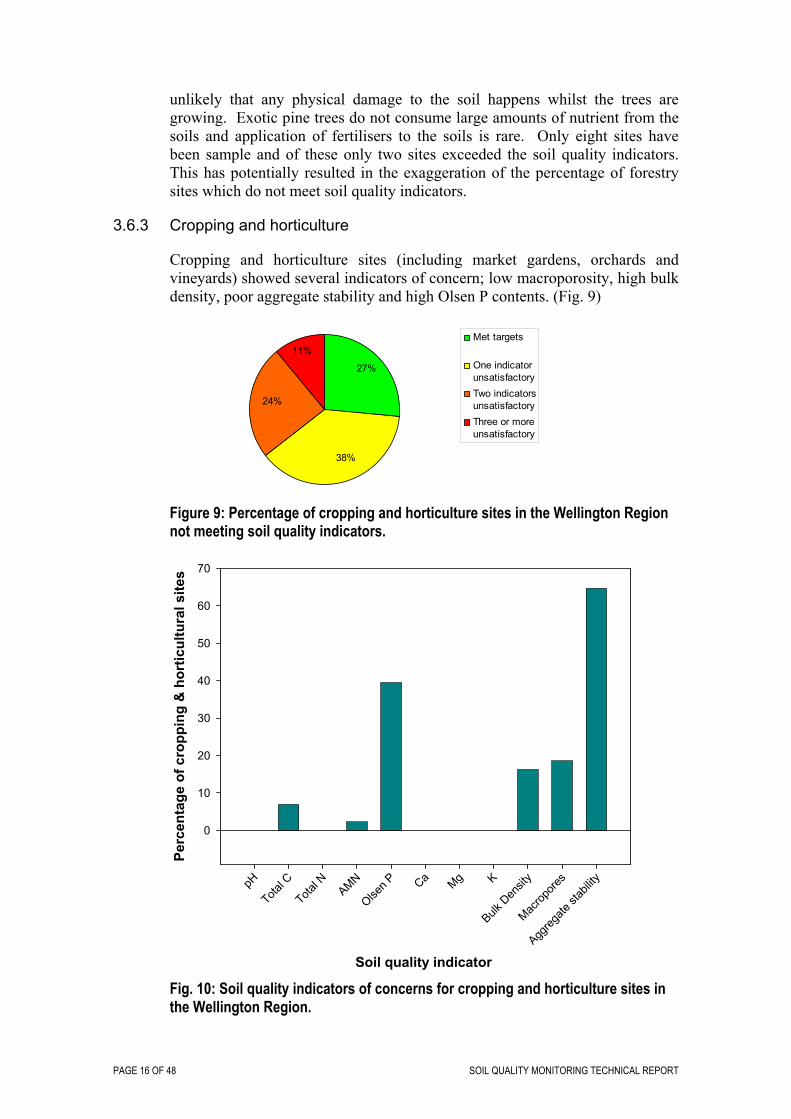
3.6.3 Cropping and horticulture
Cropping and horticulture sites (including market gardens, orchards and vineyards) showed several indicators of concern; low macroporosity, high bulk density, poor aggregate stability and high Olsen P contents. (Fig. 9)
24%
38%
27%
11%Met targets
One indicatorunsatisfactoryTwo indicatorsunsatisfactoryThree or moreunsatisfactory
Figure 9: Percentage of cropping and horticulture sites in the Wellington Region not meeting soil quality indicators.
Soil quality indicator
pH
Total C
Total N
AMN
Olsen P Ca Mg K
Bulk D
ensit
y
Macrop
ores
Aggreg
ate st
abilit
y
Perc
enta
ge o
f cro
ppin
g &
hor
ticul
tura
l site
s
0
10
20
30
40
50
60
70
Fig. 10: Soil quality indicators of concerns for cropping and horticulture sites in the Wellington Region.
SOIL QUALITY MONITORING TECHNICAL REPORT PAGE 17 OF 48
Cropping and horticulture are probably the most intensive landuses, with one or more crops grown per year and the soils being regularly mechanically tilled. This has resulted in the loss of organic matter, nutrients and the reduction in the size of the soil particles. The reduction in the particle size enables the soil to packed more tightly resulting in low macroporosity and high bulk density. The intensive use of the land has utilised all the available nutrients in the soil and fertilisers must now replace these. The loss of organic matter is also of concern as this provides water and nutrient retention. Reduced nutrient retention and increased irrigation requirements results in the rapid leaching of nutrients from the site into groundwater and surface waters. The lack of water retention also makes the soils susceptible to erosion by the wind and surface water runoff.
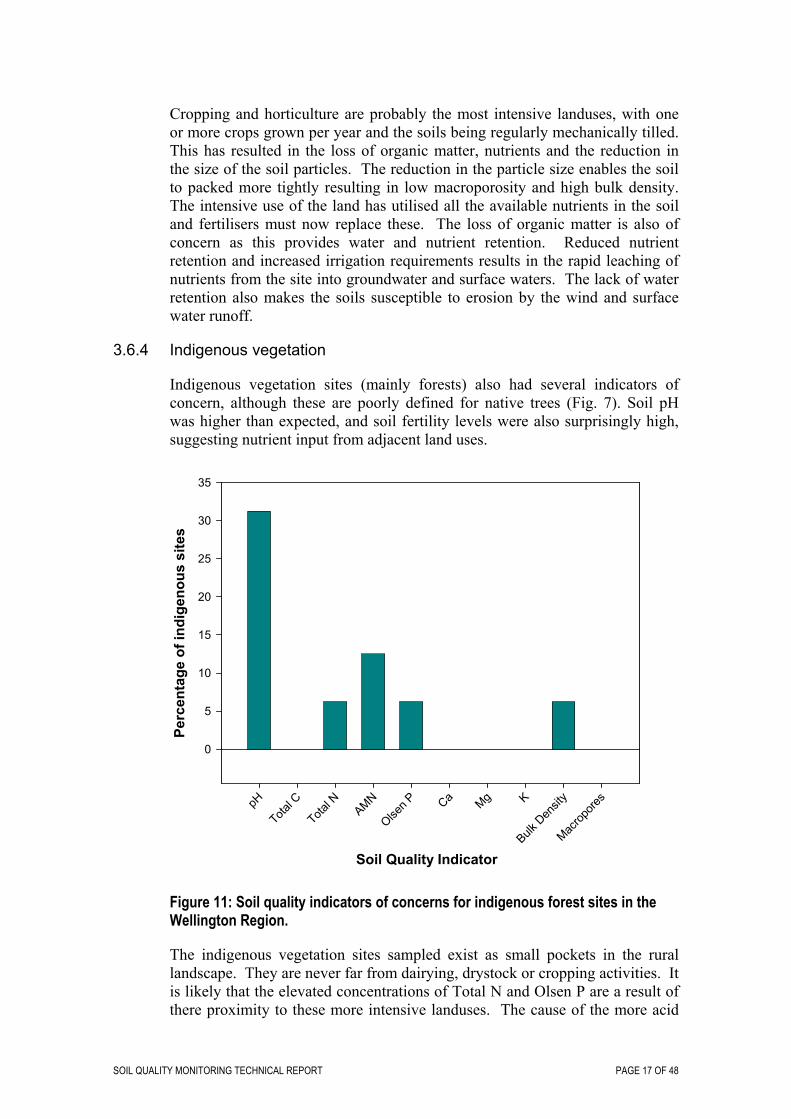
3.6.4 Indigenous vegetation
Indigenous vegetation sites (mainly forests) also had several indicators of concern, although these are poorly defined for native trees (Fig. 7). Soil pH was higher than expected, and soil fertility levels were also surprisingly high, suggesting nutrient input from adjacent land uses.
Soil Quality Indicator
pH
Total C
Total N
AMN
Olsen P Ca Mg K
Bulk D
ensit
y
Macrop
ores
Perc
enta
ge o
f ind
igen
ous
site
s
0
5
10
15
20
25
30
35
Figure 11: Soil quality indicators of concerns for indigenous forest sites in the Wellington Region.
The indigenous vegetation sites sampled exist as small pockets in the rural landscape. They are never far from dairying, drystock or cropping activities. It is likely that the elevated concentrations of Total N and Olsen P are a result of there proximity to these more intensive landuses. The cause of the more acid
PAGE 18 OF 48 SOIL QUALITY MONITORING TECHNICAL REPORT
pH concentrations is not obvious. However, little work has been undertaken to establish what soil pH could be expect in native bush and, therefore, the pH encountered may be entirely natural.
3.7 Conclusions
A total of 116 sites in the Wellington region have now been examined to assess soil quality condition, using a set of 7 key indicators. One-third of the sites (35%) met all soil quality targets, specific to those soils and their land uses. This proportion is similar to that found in other regions in New Zealand.
The focus of the Soil Quality Monitoring programme to date has been on the higher quality soils in the region. These high quality soils are only present in small areas of the region, predominantly the flat land in the Wairarapa and on the Kapiti Coast. However, the distribution of sampling of different land uses does not reflect the distribution of the land cover in the region, resulting in bias. In particular, cropping and horticulture – usually situated on high quality soils - were greatly over-represented and scrubland – usually situated on lower quality land – was under-represented. This can lead to bias in soil quality reporting, because “poor-quality” sites can be over-represented.
Lower quality soils have not yet been sampled, yet proportionally they cover a much larger percentage of the region. These lower quality soils are typically more robust than the high quality soils, however, are now coming under pressure from more intensive landuses. To perform well these soils may need to be supplemented to a greater extent than the high quality soils, which, may result in increased leaching of nutrients to the environment. The exclusion of lower quality soils from the soil quality monitoring programme may result in an exaggeration in the overall soil quality of the region
It is useful to be able to express soil quality on an area basis as this can adjust for bias in the sampling regime. In the Greater Wellington region scrubland forms a substantial land-cover category. However, only one example of scrubland category had been sampled, so it was not possible to comment on overall quality in this land use. Expressing soil quality in the region on an area basis to correct bias suggested 43% of the sampled area met all seven soil-quality targets.
Baseline soil quality data has now been established for the high quality soils in the region under a range of landuses. This has shown that there are issues with some of the landuses and to ensure that the soils remain productive and that the landuses are sustainable Greater Wellington should continue its strategy of monitoring soils in the regions to provide data for state of the environment reporting. The Soil Quality Monitoring Programme should also be expanded to cover the lower quality soils in the region, proportionally they cover a larger percentage of the region and are also coming under pressure from more intensive landuses and the other landuse/landcover not currently monitored. E.g., some soil quality sites under scrub are established to check the soil quality status of this vegetation cover, which is widespread in the region.
SOIL QUALITY MONITORING TECHNICAL REPORT PAGE 19 OF 48
The overall soil quality in the region was heavily influenced by the condition of pastures. Because pasture land uses dominate in the region, any loss of soil quality under this land use has a major effect of the overall soil quality status. When compared with other regions, the soil quality within Greater Wellington was very similar to that recorded elsewhere. This suggests that most regions were experiencing similar problems. Soils in the Wellington region, did not appear to be any more susceptible or resistant to soil quality degradation than those in other areas. This suggests the net effect of soil management across regions was similar, despite some regions having soils (e.g., Allophanic Soils) that have been traditionally thought of as resistant to structural degradation (Hewitt & Shepherd 1997).
The most common cause for sites not meeting soil quality targets was low macroporosity under pastures indicating soil compaction (40% of sites affected); followed by high fertility levels on some pastures and cropping sites (26% of sites affected). Other indicators (pH, total C, total N, mineralisable N, and bulk density) were of lesser concern and generally affected less that 5% of the sites.
An argument can be made that low macroporosity is an on-farm issue and not the concern of the Regional Council. Macroporosity below 10% has been shown to reduce pasture production, and it is an on-farm concern for that reason (Drewry et al. 2001, 2002). However, loss of macroporosity is usually associated with decreased infiltration, and an increased risk of overland flow during high intensity rainfall. Overland flow is a great contributor to the eutrophication of surface waters, and loss of soil quality (Monaghan et al. 2002). The off-site effects of changed water flow and quality certainly should be a concern of the regional councils.
The results of the Soil Quality Monitoring Programme have highlighted that there are some issues about the quality of soil under some land uses in the Wellington region. However, as we have yet to complete any repeat sampling no trends in soil quality can be drawn from this data. Resampling of the same sites is needed to determine direction and rates of change in soil quality characteristics and to assess long-term sustainability. For reliable long-term detection and prediction of trends, at least 3 and preferably 5 points along a time sequence should be obtained. With the exception of scrubland sites, we now appear to have a sufficient dataset to commence the resampling of sites.
3.8 Recommendations
Baseline soil quality data has now been established for the high quality soils in the region under a range of landuses. The next phase of the programme is to resample previously characterised sites to determine trends and rates of change in soil quality characteristics. For reliable long-term detection and prediction of trends, at least 3 and preferably 5 points along a time sequence should be obtained. A suggested resampling schedule is shown in Table 4:
PAGE 20 OF 48 SOIL QUALITY MONITORING TECHNICAL REPORT
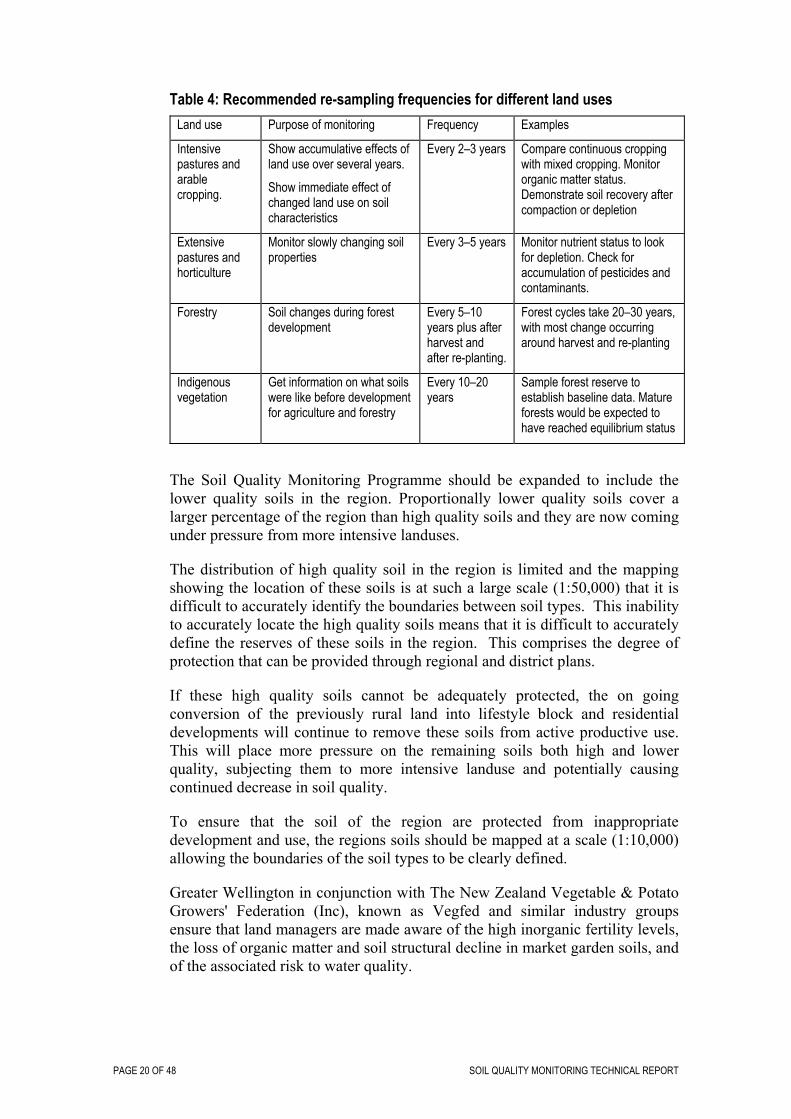
Table 4: Recommended re-sampling frequencies for different land uses Land use Purpose of monitoring Frequency Examples
Intensive pastures and arable cropping.
Show accumulative effects of land use over several years.
Show immediate effect of changed land use on soil characteristics
Every 2–3 years Compare continuous cropping with mixed cropping. Monitor organic matter status. Demonstrate soil recovery after compaction or depletion
Extensive pastures and horticulture
Monitor slowly changing soil properties
Every 3–5 years Monitor nutrient status to look for depletion. Check for accumulation of pesticides and contaminants.
Forestry Soil changes during forest development
Every 5–10 years plus after harvest and after re-planting.
Forest cycles take 20–30 years, with most change occurring around harvest and re-planting
Indigenous vegetation
Get information on what soils were like before development for agriculture and forestry
Every 10–20 years
Sample forest reserve to establish baseline data. Mature forests would be expected to have reached equilibrium status
The Soil Quality Monitoring Programme should be expanded to include the lower quality soils in the region. Proportionally lower quality soils cover a larger percentage of the region than high quality soils and they are now coming under pressure from more intensive landuses.
The distribution of high quality soil in the region is limited and the mapping showing the location of these soils is at such a large scale (1:50,000) that it is difficult to accurately identify the boundaries between soil types. This inability to accurately locate the high quality soils means that it is difficult to accurately define the reserves of these soils in the region. This comprises the degree of protection that can be provided through regional and district plans.
If these high quality soils cannot be adequately protected, the on going conversion of the previously rural land into lifestyle block and residential developments will continue to remove these soils from active productive use. This will place more pressure on the remaining soils both high and lower quality, subjecting them to more intensive landuse and potentially causing continued decrease in soil quality.
To ensure that the soil of the region are protected from inappropriate development and use, the regions soils should be mapped at a scale (1:10,000) allowing the boundaries of the soil types to be clearly defined.
Greater Wellington in conjunction with The New Zealand Vegetable & Potato Growers' Federation (Inc), known as Vegfed and similar industry groups ensure that land managers are made aware of the high inorganic fertility levels, the loss of organic matter and soil structural decline in market garden soils, and of the associated risk to water quality.
SOIL QUALITY MONITORING TECHNICAL REPORT PAGE 21 OF 48
Greater Wellington should work with industry groups such as Fonterra to make dairy and drystock farmers aware of the trend in decreasing macroporosity (compaction) of pasture soils, the potential effects of low macroporosity on pasture production, and be encouraged them to adopt mitigation techniques. The use of farm plans and nutrient budgets should also be encouraged, this will benefit the farmer and potentially reduce the amount of nutrient leaching from the land into groundwater and surface water courses.
PAGE 22 OF 48 SOIL QUALITY MONITORING TECHNICAL REPORT
4. Background concentration of metals
4.1 How do the metals get there?
Heavy metals are present in all soils, usually at concentrations that are unlikely to cause concern to human health and the environment. However, in New Zealand there are a few exceptions, these are generally located in the volcanic/geothermal areas where concentrations of heavy metals can naturally exceed health and environmental guidelines.
Background concentrations of trace metals, other elements and compounds in surface soils are primarily the result of geological and soil forming factors and commonly reflect the composition of the parent rock material. Different parent rocks give rise to distinctive soil types with characteristic compositions. Soil type and composition can, therefore, vary locally or regionally, depending upon the composition of the parent rock. For example, in the Auckland Region the isthmus volcanic field has a naturally high level of nickel, generally exceeding published investigation levels. Accumulation or dilution of trace elements within the environment occurs due to physical deposition, natural events such as lightning strikes, geo/hydro-chemical processes, forest fires etc.
In addition, certain elements or compounds of anthropogenic origin are widespread in the environment and accumulate in soils and are also present at what are effectively background levels. Such compounds include trace metals, hydrocarbons, including polycyclic aromatic hydrocarbons (PAH), and dioxins.
For example, soils in parts of the Hutt Valley and Wellington City may have levels of metal and organic contaminants that are elevated compared to those found in other soils within the same areas and which are of the same geological origin, but which are in a natural or pristine state. Any comparatively elevated levels within the same ‘natural’ soil type would tend to be specifically related to human activities, such as the contribution of vehicle emissions to lead concentrations. To determine background concentration ranges for soil constituents consideration needs to be given to how concentration differences can occur naturally within a region and the concentration effects that may be caused by the impacts of human activities.
However, there are situation were these heavy metal are applied directly to land or to plants being grown on the land. It is the toxic characteristics of these metals that have seen them use widely as agricultural pesticides. Lead, mercury, arsenic and copper have all been used to control fungus and insects on crops. Copper is still widely used on organic farms and orchards as a fungicide. Investigations in other regions have been undertaken on a range of agricultural and horticultural sites and have shown that these metals accumulate in the soil.
Not all metal are applied to the land intentionally, cadmium is a contaminant in certain sources of phosphate. The phosphate has been applied to the land as fertiliser and the cadmium along with it.
SOIL QUALITY MONITORING TECHNICAL REPORT PAGE 23 OF 48
4.2 Background concentration of heavy metal in the Wellington region
Greater Wellington has undertaken an investigation to determine the natural background concentrations of common pollutants in soils. This investigation focused on the soil in and around urban area. This information enables Greater Wellington to determine whether a site was contaminated and if so to set appropriate remediation standards.
Until Greater Wellington undertook this investigations information on background levels of potentially hazardous substances in soils for the Wellington Region was not available. Reliance was placed on soil background levels developed offshore. In particular, the ANZECC guidelines which provide background or screening levels for potential soil contaminants. The ANZECC guidelines are not always applicable to soils in New Zealand and the Wellington Region. Greater Wellington identified that establishing the background concentrations of certain common pollutants in the main soil types in the Wellington Region would be a valuable tool to assist the Council with determining the contamination status of sites and to set appropriate remedial levels for different land uses across the Wellington Region.
4.2.1 Identification of the main soil types
The soil groupings to be used in this investigation were identified by reviewing the major parent rock formations present in the Wellington Region. This was conducted by using the information provided in the 1:250,000 Geological Maps of New Zealand, 1:1,000,000 North Island Soil Map of New Zealand and the Regional Soil Plan for the Wellington Region (the Regional Soil Plan).
The Major Soils selected are:
• The Coastal and Terrace Soils North of Paekakariki, which mostly comprise Brown Soils associated with the Holocene dune sand and flood plain, estuarine and beach deposits of the Kapiti Coast (Main Soil Type 1, Sandy soils).
• The Rugged Axis Soils, mainly to the west of the Wairarapa Fault, which comprise mainly Brown Soils associated with the Greywacke bedrock (Main Soil Type 2, Greywacke Soils - the most widely distributed main soil type in the Region)
• The Ultic Soils associated with the Holocene flood plain deposits of the Hutt Valley (Main Soil Type 3, Hutt Alluvium).
• The Wairarapa Soils, located to the east of the Wairarapa Fault, which comprise Gley and immature Pallic Soils associated with Holocene flood plain and terrace deposits (Main Soil Type 4, Wairarapa Alluvium). And;
• The Pallic Soils associated mainly with the Tertiary mudstones and siltstones. (Main Soil Type 5, Mudstone/siltstone).
PAGE 24 OF 48 SOIL QUALITY MONITORING TECHNICAL REPORT
Figure 2-1 presents the main geological units of the Wellington Region and the Main Soil Types described above.
4.2.2 Sampling and analysis of soils
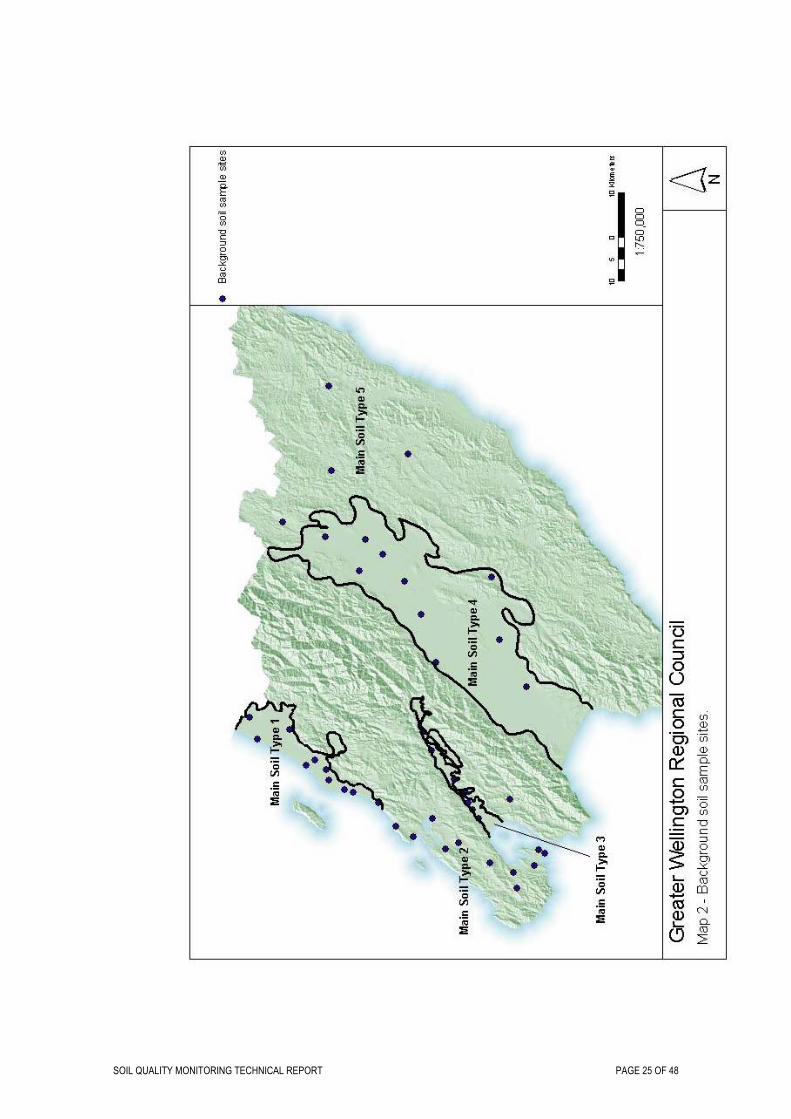
The five major soils of the region were sampled at sites where there has been minimal or no human impact and analysed for the common heavy metal and organic pollutants. (Plan 2 – Background soil sample sites.)
SOIL QUALITY MONITORING TECHNICAL REPORT PAGE 25 OF 48
PAGE 26 OF 48 SOIL QUALITY MONITORING TECHNICAL REPORT
The objective of the sampling was to provide soil quality information representative of background (“pristine”) concentrations in the target areas. In practice, sites were targeted only if their soils were assessed to have been undisturbed for a significant period of time and they appeared to be the sites in an area least likely to have been exposed to contaminants. This was done with reference to the location of roads, industrial areas, contaminated sites (including landfills) and other potential sources of contamination.
Sites previously used for soil sampling as part of the soil quality monitoring programme and assessed as complying with these site selection criteria were reused. This was done to provide some correlation between different sampling programmes and potentially create a wider application for the data collected.
The sites selected needed to provide a relatively even spatial coverage over each target area. Approval to access and sample soil from each site had to be obtained from the landowner for the site to be included.
Descriptive statistics are presented for each target analyte in the following sections. The results are reported against each of the five Main Soil Type groupings and are assessed using the applicable ANZECC guideline background levels, where applicable, for comparative purposes.
The methods used for sampling are appended as Appendix 4 – Site sampling strategy.
The common pollutants targeted in this investigation were the metals listed in Table 5. Analytical limits of detection (LOD) were selected for each analyte based on the following:
• current understanding of the risk it poses to human health;
• existing knowledge of expected background concentration levels;
• current analytical detection capability; and
• analysis cost.
4.3 Results
The investigation showed that the background concentrations of heavy metals in all five of the main soils in the region are very low in comparison to some of the other regions in New Zealand. There were only minor variations between each of the soil types. Table 5.
SOIL QUALITY MONITORING TECHNICAL REPORT PAGE 27 OF 48
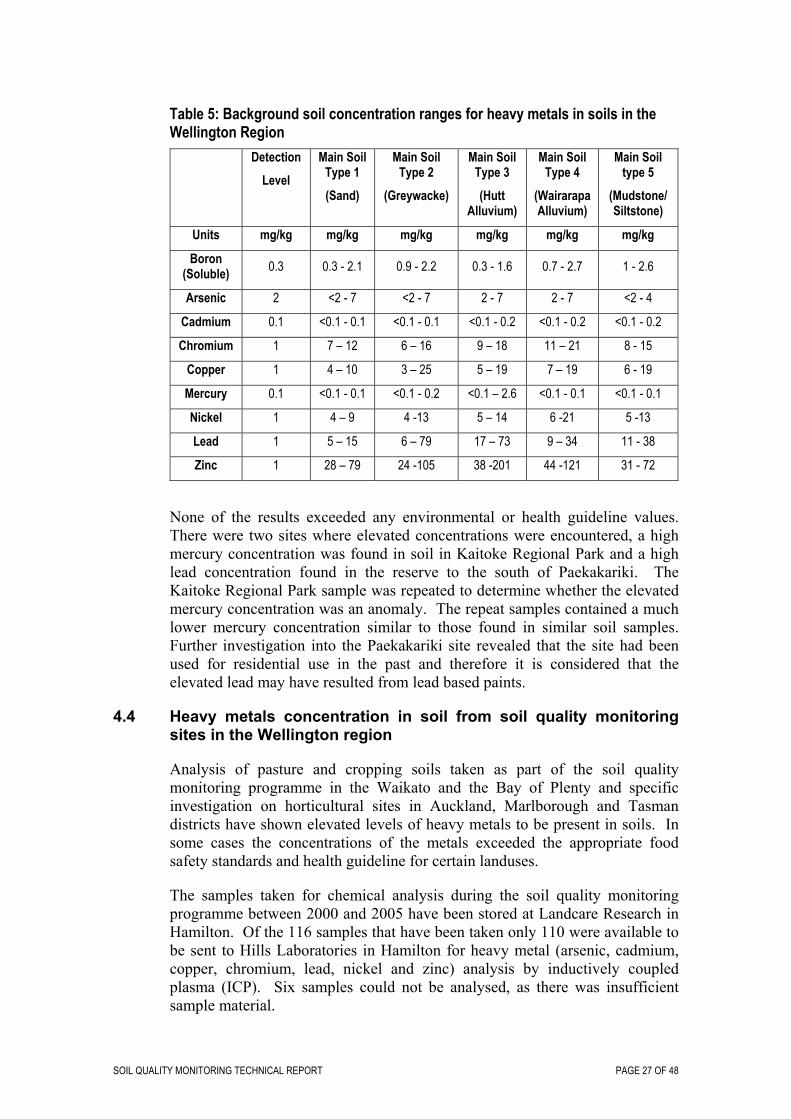
Table 5: Background soil concentration ranges for heavy metals in soils in the Wellington Region
Detection Level
Main Soil Type 1 (Sand)
Main Soil Type 2
(Greywacke)
Main Soil Type 3 (Hutt
Alluvium)
Main Soil Type 4
(Wairarapa Alluvium)
Main Soil type 5
(Mudstone/Siltstone)
Units mg/kg mg/kg mg/kg mg/kg mg/kg mg/kg
Boron (Soluble) 0.3 0.3 - 2.1 0.9 - 2.2 0.3 - 1.6 0.7 - 2.7 1 - 2.6
Arsenic 2 <2 - 7 <2 - 7 2 - 7 2 - 7 <2 - 4
Cadmium 0.1 <0.1 - 0.1 <0.1 - 0.1 <0.1 - 0.2 <0.1 - 0.2 <0.1 - 0.2
Chromium 1 7 – 12 6 – 16 9 – 18 11 – 21 8 - 15
Copper 1 4 – 10 3 – 25 5 – 19 7 – 19 6 - 19
Mercury 0.1 <0.1 - 0.1 <0.1 - 0.2 <0.1 – 2.6 <0.1 - 0.1 <0.1 - 0.1
Nickel 1 4 – 9 4 -13 5 – 14 6 -21 5 -13
Lead 1 5 – 15 6 – 79 17 – 73 9 – 34 11 - 38
Zinc 1 28 – 79 24 -105 38 -201 44 -121 31 - 72
None of the results exceeded any environmental or health guideline values. There were two sites where elevated concentrations were encountered, a high mercury concentration was found in soil in Kaitoke Regional Park and a high lead concentration found in the reserve to the south of Paekakariki. The Kaitoke Regional Park sample was repeated to determine whether the elevated mercury concentration was an anomaly. The repeat samples contained a much lower mercury concentration similar to those found in similar soil samples. Further investigation into the Paekakariki site revealed that the site had been used for residential use in the past and therefore it is considered that the elevated lead may have resulted from lead based paints.
4.4 Heavy metals concentration in soil from soil quality monitoring sites in the Wellington region
Analysis of pasture and cropping soils taken as part of the soil quality monitoring programme in the Waikato and the Bay of Plenty and specific investigation on horticultural sites in Auckland, Marlborough and Tasman districts have shown elevated levels of heavy metals to be present in soils. In some cases the concentrations of the metals exceeded the appropriate food safety standards and health guideline for certain landuses.
The samples taken for chemical analysis during the soil quality monitoring programme between 2000 and 2005 have been stored at Landcare Research in Hamilton. Of the 116 samples that have been taken only 110 were available to be sent to Hills Laboratories in Hamilton for heavy metal (arsenic, cadmium, copper, chromium, lead, nickel and zinc) analysis by inductively coupled plasma (ICP). Six samples could not be analysed, as there was insufficient sample material.
PAGE 28 OF 48 SOIL QUALITY MONITORING TECHNICAL REPORT
4.5 Results
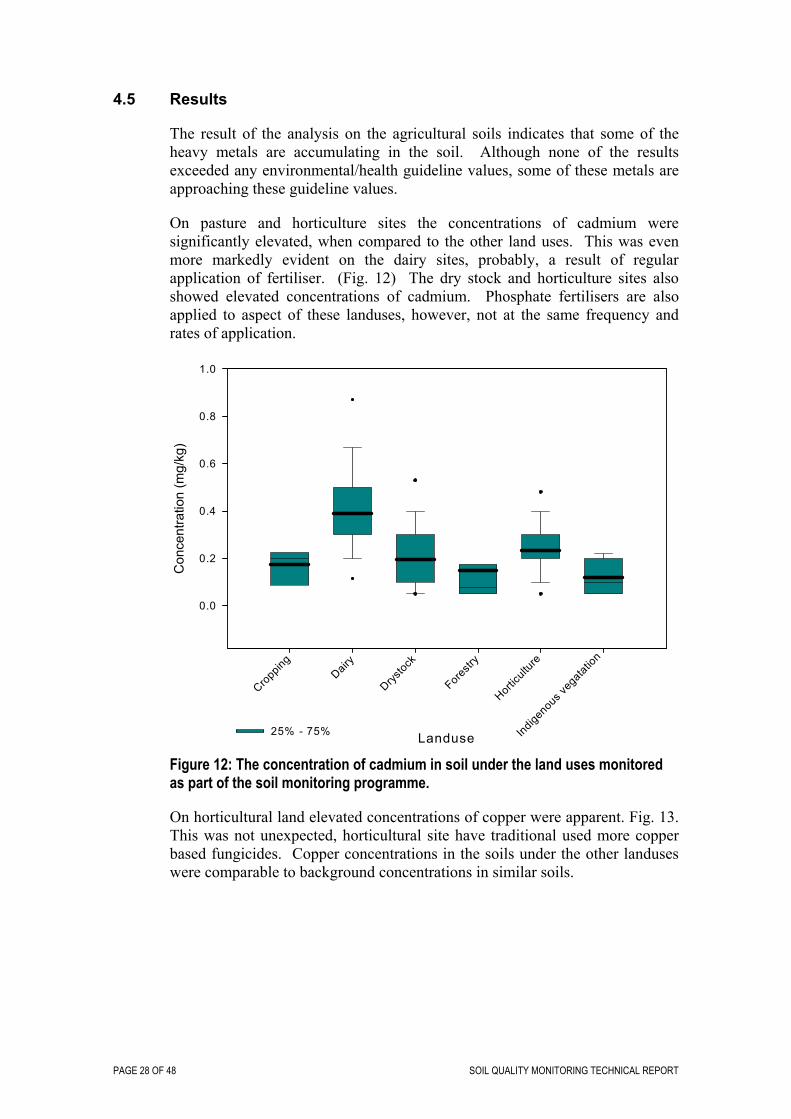
The result of the analysis on the agricultural soils indicates that some of the heavy metals are accumulating in the soil. Although none of the results exceeded any environmental/health guideline values, some of these metals are approaching these guideline values.
On pasture and horticulture sites the concentrations of cadmium were significantly elevated, when compared to the other land uses. This was even more markedly evident on the dairy sites, probably, a result of regular application of fertiliser. (Fig. 12) The dry stock and horticulture sites also showed elevated concentrations of cadmium. Phosphate fertilisers are also applied to aspect of these landuses, however, not at the same frequency and rates of application.
Landuse
Croppin
gDair
y
Drystoc
k
Forestr
y
Horticu
lture
Indige
nous
vega
tation
Con
cent
ratio
n (m
g/kg
)
0.0
0.2
0.4
0.6
0.8
1.0
25% - 75%
Figure 12: The concentration of cadmium in soil under the land uses monitored as part of the soil monitoring programme.
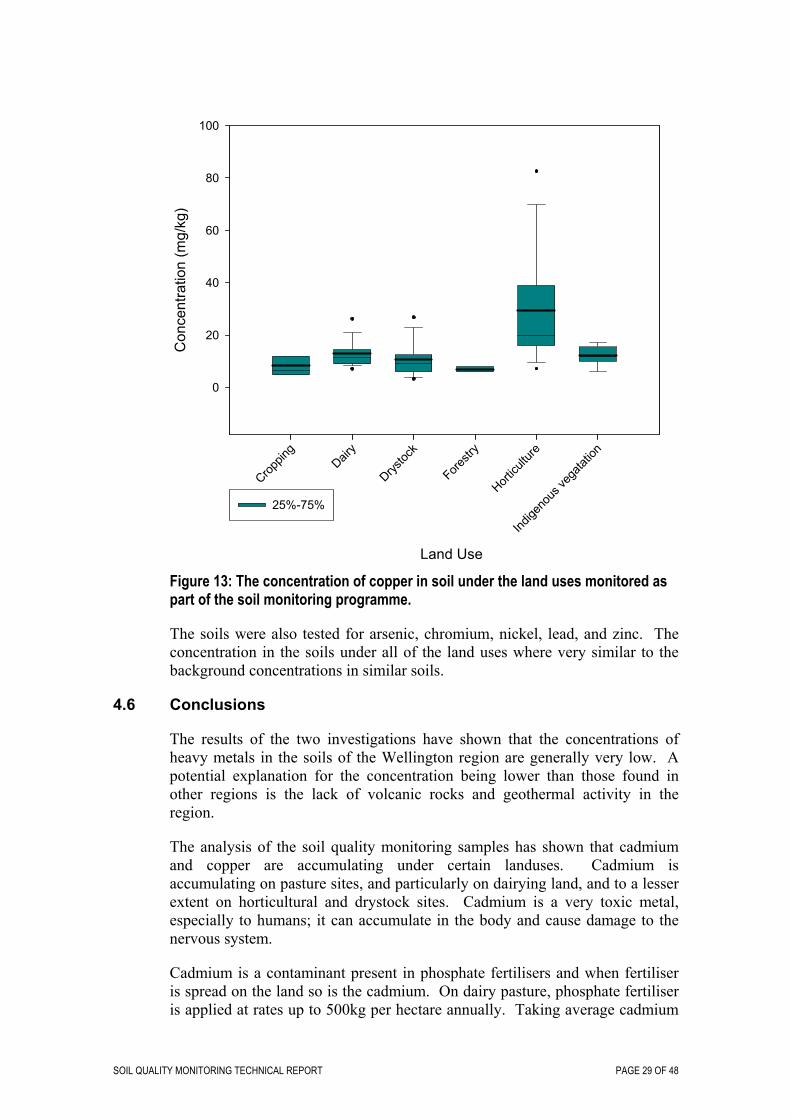
On horticultural land elevated concentrations of copper were apparent. Fig. 13. This was not unexpected, horticultural site have traditional used more copper based fungicides. Copper concentrations in the soils under the other landuses were comparable to background concentrations in similar soils.
SOIL QUALITY MONITORING TECHNICAL REPORT PAGE 29 OF 48
Land Use
Croppin
gDair
y
Drystoc
k
Forestr
y
Horticu
lture
Indige
nous
vega
tation
Con
cent
ratio
n (m
g/kg
)
0
20
40
60
80
100
25%-75%
Figure 13: The concentration of copper in soil under the land uses monitored as part of the soil monitoring programme.
The soils were also tested for arsenic, chromium, nickel, lead, and zinc. The concentration in the soils under all of the land uses where very similar to the background concentrations in similar soils.
4.6 Conclusions
The results of the two investigations have shown that the concentrations of heavy metals in the soils of the Wellington region are generally very low. A potential explanation for the concentration being lower than those found in other regions is the lack of volcanic rocks and geothermal activity in the region.
The analysis of the soil quality monitoring samples has shown that cadmium and copper are accumulating under certain landuses. Cadmium is accumulating on pasture sites, and particularly on dairying land, and to a lesser extent on horticultural and drystock sites. Cadmium is a very toxic metal, especially to humans; it can accumulate in the body and cause damage to the nervous system.
Cadmium is a contaminant present in phosphate fertilisers and when fertiliser is spread on the land so is the cadmium. On dairy pasture, phosphate fertiliser is applied at rates up to 500kg per hectare annually. Taking average cadmium
PAGE 30 OF 48 SOIL QUALITY MONITORING TECHNICAL REPORT
concentration of 24 mg/kg in phosphate fertilisers means approximately 12 g of cadmium is applied to land per year. The average concentration on dairy sites in the Wellington Region is 0.4 mg/kg, however on one site the cadmium concentration was 0.9 mg/kg. The New Zealand health guideline based on uptake into plant and consumption of these plants is 1.0 mg/kg. There have been no reports of cadmium being detected in milk or beef, however, offal from cattle does accumulate cadmium and elevated concentrations have been reported.
Phosphate fertilisers are still being applied to soil and at the current rate it is only a matter of time before concentration of cadmium will exceed the soil guideline values. The issue of cadmium in fertilisers is also of concern to the agricultural industry groups as they do not want their farmers land to exceed guideline values in soil and/or in foods. If cadmium was to be found in foods grown for exports, this may have significant impact on export markets.
Copper is still widely used as a fungicide on organic farm and horticultural sites. The results of the investigation show that concentration are significantly higher that on other agricultural landuses. The concentrations of copper detected in the soil of the Wellington Region are all still well below any New Zealand health guideline values for soils.
4.7 Recommendations
(a) It is recommended that the concentrations of heavy metal in the soils especially those under landuses which have been shown to accumulate metals are monitored. As part of the soil quality monitoring programme we will soon be resampling sites to determine trends in soil quality and fertility and it recommended that these soils are also analysed for heavy metals. The sites to be resampled were first visited five years ago, the inclusion of metals analysis of the soils will in time show trends in metal accumulation.
(b) Greater Wellington should work with agricultural industry groups, farmers and the fertiliser manufactures to address the issue of cadmium in phosphate fertilisers. If the concentration of cadmium in the fertiliser cannot be reduced, then measures should be investigated to manage the rate at which the contaminated fertilisers are applied to land. The use of farm plans and nutrient budgets by farmers will ensure that excess fertilisers - and the associated cadmium - are not applied to the land.
(c) The determination of the background concentration of contaminants in soils has provided useful information to a number of projects undertaken by Greater Wellington. The dataset is still small and the robustness of the data could be improved with the identification and analysis of further sites.
SOIL QUALITY MONITORING TECHNICAL REPORT PAGE 31 OF 48
5. Contaminated land
In the Regional Policy Statement Greater Wellington set an object that in conjunction with the Territorial Authorities in the region that we would identify all the contaminated sites in the region. Greater Wellington has been compiling a register of selected industry/activity sites.
The Ministry of the Environment (MfE) has released a list of hazardous activities and industries. The hazardous activities and industries list (HAIL) contains fifty one groups of industries/activities that have a higher potential to contaminate the land on which they take place. In the New Zealand Waste Strategy the Ministry of the Environment has asked all New Zealanders to identify all HAIL sites by 2008.
MfE has also produced a draft Contaminated Land Management Guide which gives best practice on how and what information should be stored on site where hail activities have taken place. The MfE guidelines have been through many drafts to address the various concerns of industry group and the public who feel the database may cause issues for their land or property. They have struggled to ensure the guideline comply with the legislation, meet the expectation of the local authorities and do not cause concern to the public/industry.
5.1 Selected Land Use Register
In the late 1990s Greater Wellington developed the Selected Land Use Register (SLUR) to store information on sites where hazardous activities/industries have taken place, where contamination of land has been confirmed or remediated suitable for a specific land use and site where no contamination has been identified. SLUR has continued to develop in general accordance with the draft Ministry for the Environments guidelines.
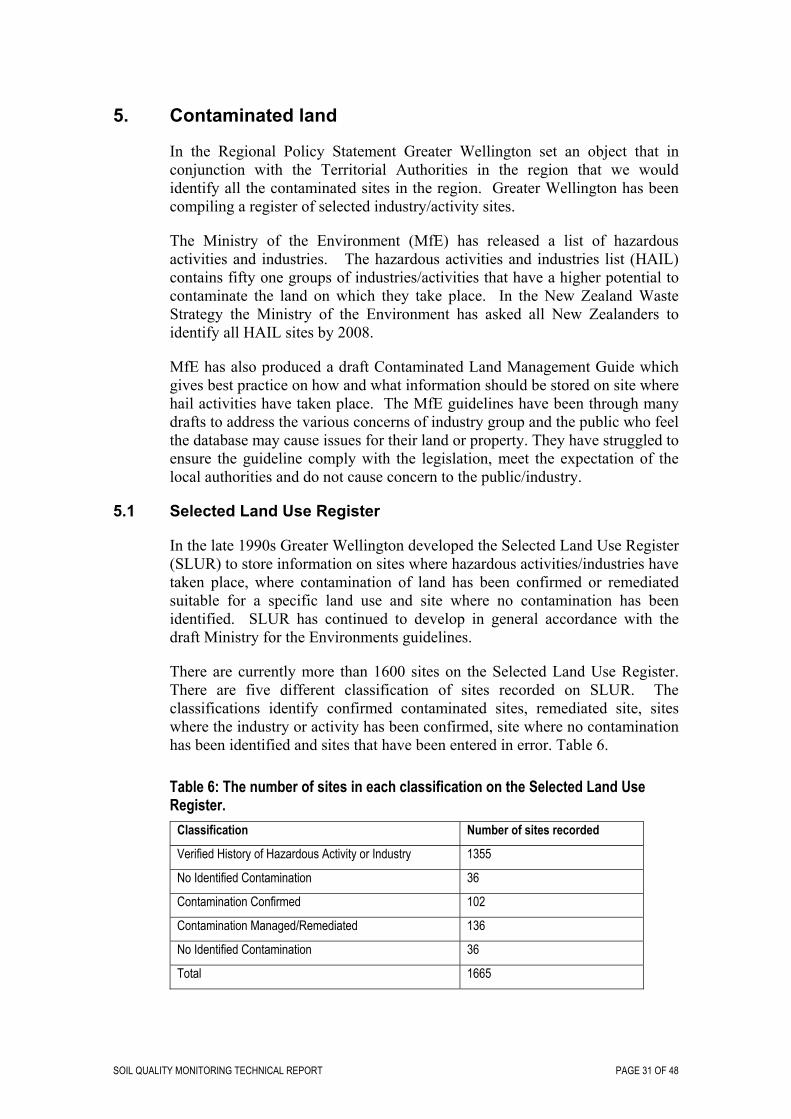
There are currently more than 1600 sites on the Selected Land Use Register. There are five different classification of sites recorded on SLUR. The classifications identify confirmed contaminated sites, remediated site, sites where the industry or activity has been confirmed, site where no contamination has been identified and sites that have been entered in error. Table 6.
Table 6: The number of sites in each classification on the Selected Land Use Register.
Classification Number of sites recorded
Verified History of Hazardous Activity or Industry 1355
No Identified Contamination 36
Contamination Confirmed 102
Contamination Managed/Remediated 136
No Identified Contamination 36
Total 1665
PAGE 32 OF 48 SOIL QUALITY MONITORING TECHNICAL REPORT
The information stored on the SLUR is useful to a wide range of organisation including Central Government, environmental consultancies, Greater Wellington Consents management and Territorial Authorities. The information is used to determine a sites contamination status and whether it is suitable for specific uses.
The most common users of SLUR are the Territorial Authorities who have been provided with a direct link to the database via a web portal. They use the information for the preparation of Land Information Memoranda, Project Information Memoranda and in the processing of resource and building consents. SLUR is interrogated by the Territorial Authorities on average 300-400 times a week.
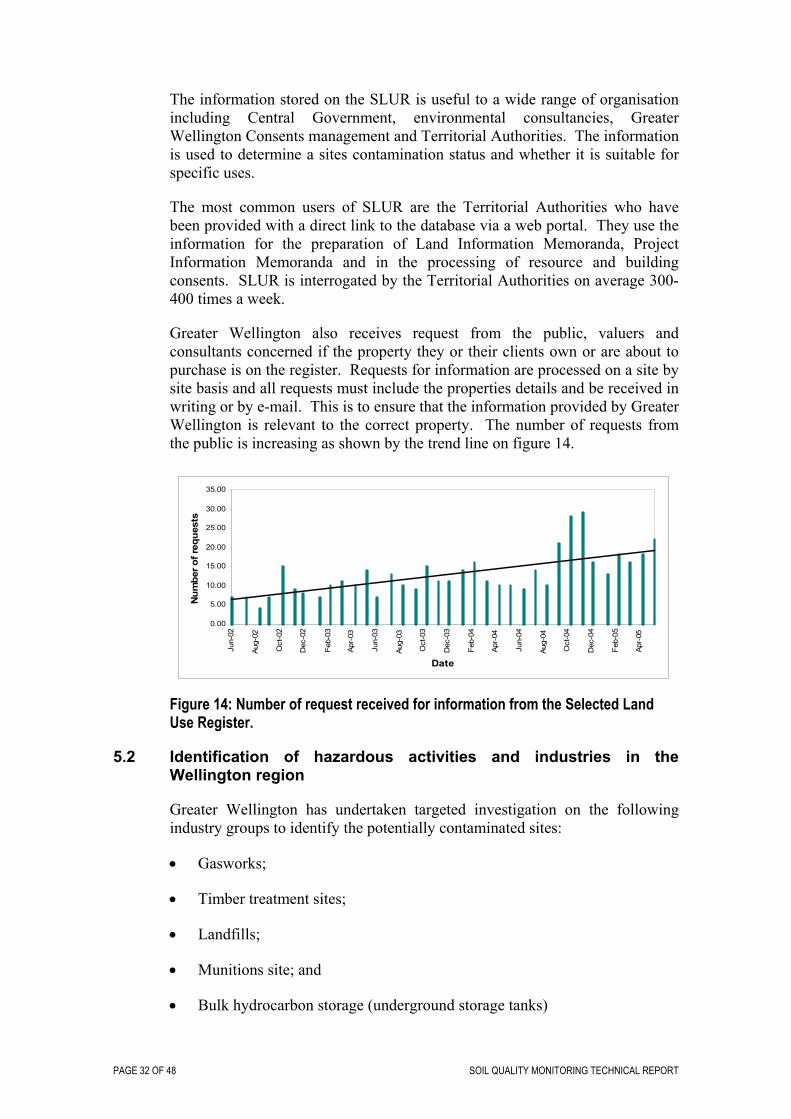
Greater Wellington also receives request from the public, valuers and consultants concerned if the property they or their clients own or are about to purchase is on the register. Requests for information are processed on a site by site basis and all requests must include the properties details and be received in writing or by e-mail. This is to ensure that the information provided by Greater Wellington is relevant to the correct property. The number of requests from the public is increasing as shown by the trend line on figure 14.
0.00
5.00
10.00
15.00
20.00
25.00
30.00
35.00
Jun-
02
Aug-
02
Oct
-02
Dec
-02
Feb-
03
Apr-
03
Jun-
03
Aug-
03
Oct
-03
Dec
-03
Feb-
04
Apr-
04
Jun-
04
Aug-
04
Oct
-04
Dec
-04
Feb-
05
Apr-
05
Date
Num
ber o
f req
uest
s
Figure 14: Number of request received for information from the Selected Land Use Register.
5.2 Identification of hazardous activities and industries in the Wellington region
Greater Wellington has undertaken targeted investigation on the following industry groups to identify the potentially contaminated sites:
• Gasworks;
• Timber treatment sites;
• Landfills;
• Munitions site; and
• Bulk hydrocarbon storage (underground storage tanks)
SOIL QUALITY MONITORING TECHNICAL REPORT PAGE 33 OF 48
The investigations undertaken have been mainly phase 1 investigation using available information to identify sites. However, some of the sites have been selected for further investigation to determine the status of the contamination on the site. The investigations were undertaken with the assistance of the Territorial Authorities especially where they held records detailing the activity. Where the Territorial Authorities were unlikely to have any information, consultants were employed to search through archive materials and undertake site inspections to locate the sites.
Further investigation have been undertaken to determine the location of sheep dips in areas of the region which are coming under development pressure. This should ensure that the sites will be investigated prior to their inappropriate use for a sensitive land use such as residential or lifestyle block.
The target set in the New Zealand Waste Strategy to identify all HAIL site by 2008, is going to require a lot of effort and resources from everyone who is involved in the control of contaminated land. To achieve these targets we will have to work with Territorial Authorities who hold a lot of information about landuses in their archives.
Through the development of the Selected Land Use Register web portal Greater Wellington staff established a close working relationship with the staff in each of the Territorial Authorities. It is recommended that this relationship is formalised through a memoranda of understanding and a working group be establish to develop methods to collect and collate the information from council archives. The group should select the next group of industries to be investigated and decide on how the investigations are to proceed and who will undertake the work.
PAGE 34 OF 48 SOIL QUALITY MONITORING TECHNICAL REPORT
Appendix 1
1. Properties and functions of soil quality parameters
Total carbon Carbon is one of the basic building blocks of organic matter. The total content of organic matter in the soil is not easily measured accurately, but soil carbon can be measured accurately. Consequently carbon is usually measured and reported as an estimate of the soil organic matter content of a soil. We assume that all the carbon in the soil is from organic matter, and that contributions to total carbon from carbonates are very small. This assumption is valid for most New Zealand soils. Soil organic matter is an important component of the soil because it is relevant to all biological, chemical and physical systems in the soil. Biologically, soil organic matter is the source of energy for soil micro-organisms (or microbes). Microbes are the 'engine' that drives the cycling of nutrients within the soil. Chemically, soil organic matter is a major reservoir of plant nutrients. It is the major source of plant nitrogen, sulphur and phosphorous, which are cycled through accumulation and decomposition of soil organic matter. Other nutrients, such as calcium, magnesium, potassium and sodium, are loosely attached as positively charged cations to the negatively charged bonding sites on organic matter. Physically, soil organic matter stabilises soil structure and soil pores and therefore has a marked effect in enhancing structural stability, aeration, water storage capacity and rainfall infiltration.
Total carbon is used as an indicator of soil quality in mineral soils but not in organic soils. Organic matter can be estimated as a percentage of the soil by multiplying parentage total carbon by a factor of 1.7. Levels of total carbon need to be interpreted with reference to the soil type.
Organic matter levels can be directly improved by ploughing in crops grown specifically for the purpose, or by addition of waste organic material such as manure. Addition of manure is usually impractical for large areas, in which case, natural processes can be encouraged to accumulate soil organic matter as a by-product of plant growth. Natural rates of accumulation can be very slow but may be accelerated by increasing plant productivity and improving conditions that will favour the activity of living organisms in the soil. Vegetation productivity and incorporation of organic matter is encouraged by fertilisation, encouraging good plant cover and litter accumulation, and by irrigation (where plant productivity is limited by droughtiness). Minimum tillage can minimise organic matter losses.
Total carbon provides a measure of the organic matter content of soil. Loss of organic matter from soil is a cause for concern because organic matter contributes to soil quality in many ways. It provides a source of plant nutrient, contributes to stable soil structure and the formation of soil aggregates. It acts as an exchange surface to store added nutrients and helps hold fertiliser and pesticides in the upper soil layers. It forms habitat and food for soil flora and fauna. Water retention and controlled release are improved by the presence of organic matter. Because of the many beneficial effects on soil quality, retention

SOIL QUALITY MONITORING TECHNICAL REPORT PAGE 35 OF 48
of soil organic matter is a high priority in all systems of sustainable land management.
The natural level of organic matter differs between soils because the retention is much influenced by interactions between organic matter, soil minerals and climate. Clay soils in cooler regions generally have more organic matter than sandy soil in warmer climates. Changes in organic matter are slow and sometimes insidious, so it can be many years before organic matter losses become clearly apparent. Equally, once organic matter has been lost, it can take many years - sometimes hundreds of years - for it to be restored to its former level. Some organic matter fractions, such as the microbial biomass C, change more rapidly than does the total organic matter and may provide a useful early indication of longer-term trends.
It is apparent that cropping soils and market garden soils have lost total C when compared to the equivalent soil under pasture or forest. In the current data set there were only small differences in the intrinsic resources of pastures and native or plantation forests. Loss of total C and N from long-term arable soils was independent of soil type or region. Loss of intrinsic resources in cropping soils is also reflected in the declines in anaerobically mineralisable N (see below) as well as microbial biomass and soil respiration (Sparling and Schipper 1997). These exceptional cropping soils are able to maintain high productivity because, despite the loss of organic matter, their mineralogy gives them good physical stability. Other cropping soils are not as resilient (Sparling et al. 1992).
Total N Nitrogen is an essential major nutrient required by all living organisms. Nitrogen comes in many forms – as dinitrogen gas, ammonia and gaseous oxides of nitrogen, ammonium, nitrite and nitrate salts, and organic forms such as proteins and amino acids. Animals obtain their nitrogen by eating plants or other animals. Plants obtain their nitrogen from soluble forms in soil, or from the atmosphere by a symbiotic relationship with specialist micro-organisms that can “fix” the nitrogen gas from the atmosphere. Virtually all the nitrogen in soil has been accumulated by fixation by microrganisms and their subsequent death and incorporation into organic matter. Very little of the N in soil comes from weathered rocks as most common minerals contain negligible amounts of N.
Total N give a measure of the total N stocks of a soil. Usually only a small fraction of the total N is immediately available for plant uptake (soluble inorganic N), while a variable proportion of the total N is potentially mineralisable to inorganic (see mineralisable N).
Because the N content of a soil represents the end product of years of biological fixation and accumulation, N contents tend to be low in young soils (sand dunes, fresh pumice), and greatest in those where there has been substantial organic matter accumulation and nitrogen fixation (long-term grass-clover pastures). The ratio of total N to total C gives the soil C:N ratio, and gives an indication of the quality of the organic matter to supply N.
PAGE 36 OF 48 SOIL QUALITY MONITORING TECHNICAL REPORT
In general, high total N indicates the soil is in a good biological condition. However, low N soils are adequate for growing species with low N demand, such as pines. Very high total N contents increase the risk that N supply may be in excess of plant demand, and ultimately lead to leaching of nitrate. The rationale for setting the boundaries between the various levels is the same as for the mineralisable N contents.
Total N is increased by the accumulation of organic matter with low C:N ratio, typically from a legume crop. In pastures this crop is usually clover, under arable cropping a rotation including lucerne, peas or beans will contribute to total N. On low N status soils, a crop of lupins may be planted before the tree seedlings, while the presence of gorse and broom, although often considered weeds, is beneficial for increasing the N stock and secondary forest succession. Nitrogen addition is only rarely needed for indigenous ecosystems, although gorse can be a useful nurse plant for the establishment of secondary forests species. In contrast, exotic legumes may disrupt primary succession sequences, and, in general, exotic legumes should be discouraged in indigenous ecosystems.
Nitrogen is the element most generally limiting primary production in natural and agricultural ecosystems. The capacity of ecosystems to sequester carbon, for instance, is constrained by the maximum ratios of carbon-to-nitrogen (C/N) in living tissues. Several important greenhouse gases (e.g., N2O and NOx and CH4) are tied to the soil N cycle. As with soil C, most changes occur in the top 30 cm, which should be the measurement standard, but stations and centres should measure to 1 m.
Total N analysis mostly measures organic N, which is not the form taken up by plants. However, inorganic N (NO3 and NH4) are very variable at short time scales and therefore not suitable for monitoring except at centres or in ground water and aquatic systems. The process of conversion of organic N to inorganic N (mineralization and nitrification) are suitable for measuring only at the centre level.
Nitrogen (N) is absorbed from soil and used by plants in its inorganic form, as either nitrate (NO3-) or ammonium (NH4+). Both forms occur naturally in soils and are common components of inorganic fertilizers. Nitrate is the principal form in which nitrogen is taken up by plants, due to its mobile nature and greater abundance than ammonium. However, inorganic N represents only 2 to 5% of the total nitrogen in the soil. Most soil N is bound to organic matter and not readily available to plants. Total nitrogen (TN) is a measure of both inorganic and organic forms of nitrogen and is expressed as a percentage.
Levels of N vary with temperature and moisture in the same way as levels of SOM, that is, N increases with cooler temperatures and more moisture.
Soil pH Soil pH, a measure of the acidity or alkalinity of soil, is an important indicator because acidity influences both the ability of plants to grow in soil, the availability of nutrients, and the functioning of beneficial organisms. Acidification is a natural soil process, but can be accelerated by cropping,
SOIL QUALITY MONITORING TECHNICAL REPORT PAGE 37 OF 48
excessive use of fertilisers, leaching, and application of acidic wastes. Excess acidity is normally ameliorated by application of lime. However, in extensive agriculture application of lime may not be practical or economically feasible. In the range of soils examined here, those under intensive land use such as cropping, and the more productive dairy pastures, usually have higher pH. A common target range for crop or pasture production is to maintain pH between 5.5 and 6.5. Some crops such as radiata pine are tolerant of lower pH, and acidity generally tends to be greater under pines than under pastures.
Olsen P Phosphorus (P) is an essential nutrient element for plants and animals. Only a small amount of the total P in soil is in forms able to be taken up by plants (plant-available P). The Olsen method uses a chemical (bicarbonate) to extract the available P that provides a reasonable estimate of the amount of plant-available P by measuring phosphate from soil solution and exchange surfaces. Olsen P values are commonly used to calculate P fertiliser requirements.
Soils differ in their P contents, and how readily the P is released. Allophanic (Yellow brown loams) and Pumice soils (Yellow brown pumice) have a high “P retention”, so that even when total P may be high, a comparatively smaller amount is available to plants. For these soils higher Olsen P status is needed to get P availability equivalent to other soil groups. In general, target Olsen P values are determined by the soil type, crop demand and rate of removal. Horticultural crops require high Olsen P status, pastoral demands are lower but depend on stocking rates and off-take. Adequate Olsen P is essential for good grass growth and to maintain clover in the sward. Forestry generally has low P demands.
New Zealand indigenous species are well adapted to low P status, and higher Olsen P levels can have the disadvantage of favouring undesirable weed species in native ecosystems. Consequently, Olsen P levels of 4–8 are regarded as normal, while on Allophanic and Pumice soils of 15–20 are regarded as very high, and 20–30 as excessive. Target ranges on other soil types are even lower, with 8–12 classed as very high and 12–15 as excess. The values are based on typical levels measured in the 500 Soils Project
Olsen P is rarely used to assess the P status of soils for forestry, Bray P being the preferred method. The results from the two methods are not readily convertible. Consequently, there is little information about production responses in response to Olsen P status. The defined ranges were obtained by typical Olsen P levels measured in the 500 Soil Project, which included forestry sites on a range of soil types. Pumice and Allophanic Soils are again considered as a separate category to other soil orders.
The Olsen P status can be rapidly raised by adding soluble fertiliser sources such as super-phosphate or di-ammonium phosphate. Amounts are calculated from calibrated response curves (e.g. Roberts and Morton 1993) which use the current Olsen P status of the soil and the desired pasture production. The P is made soluble and rapidly-acting by industrial acidification of phosphate rock. Non-acid treated phosphate rock is only sparingly soluble. Although much
PAGE 38 OF 48 SOIL QUALITY MONITORING TECHNICAL REPORT
cheaper than superphosphate, it requires fine grinding to be effective and several years to take effect.
Phosphate is normally strongly bound to soils, but high levels on shallow soils with low P retention have a risk of P leaching and contaminating waters. P is often bound to surface soil particle, and surface erosion causing sediment to reach waters often carries phosphate as well. Again this may result in contamination of water supply, algal growth and eutrophication. Comparatively small amounts of P reaching waters can cause eutrophication.
In general, inorganic chemical indices have not proved to be good indicators of long-term trends in soil quality. This is because the fertility of a soil can change extremely rapidly depending on the intensity and frequency of fertiliser use. However, maintenance of chemical fertility in soil is highly desirable for production purposes, and many farmers routinely measure the nutrient status of their soils to estimate maintenance fertiliser requirements. For many pasture and cropping soils in New Zealand the amount of plant available phosphate (bicarbonate-extractable phosphate or Olsen P) is a major factor determining productivity. Cameron et al. (1997) also recommend Olsen P as a good indicator of longer-term trends in soil fertility. To assess whether P reserves of a soil are being depleted, or to identify excessive fertiliser use, we suggest the Olsen P status should be included in the suite of environmental performance indicators. The range in Olsen P values of the 24 soils used in the current trial are shown in Fig. 5. Excessive P levels are clearly seen on the market garden soil.
Exchangeable CA, K and Mg Potassium, Ca, and Mg are the so-called basic cations that are held on soil cation exchange sites. These exchange sites are negatively charged, whereas the exchangeable ions that can occupy the sites are positive charged (a positively charged ion is called a cation). The individual values for exchangeable Ca, Mg, and K give certain indicators of the fertility status of the soil (Macro-nutrients). The sum of the cation exchange sites in the soil is referred to as the Cation Exchange Capacity (CEC). Mineral clays have a great number of negative charge sites, thus clay soils have a high CEC, whereas sandy (coarse) soils have a low CEC. Organic matter also has negative charge sites and may contribute to the CEC.
The CEC of a soil often indicates its natural fertility and its development and ability to supply Ca, Mg, and K for plant growth. It is also a measure of the ability of the soil to store added nutrients (fertilizers). Soils which have a low CEC cannot store large amounts of plant nutrients and must be replenished more regularly.
In the inorganic part of the soil complex only clay particles play a decisive role, since the active total internal surface of silt and sand particles in comparison to that of clay is very small. The CEC of clay depends on the type of clay mineral. The organic matter complex (the humus colloids) has a much higher CEC than clay.
SOIL QUALITY MONITORING TECHNICAL REPORT PAGE 39 OF 48
The higher the CEC, the greater the soil's capacity to store nutrients and to prevent their loss by leaching. Theoretically, soils with higher CEC may require less frequent fertilization. Where the CEC is low, we need to apply fertilizer more frequently, but at a lower rate to avoid nutrient loss through leaching. Incorporation of organic matter (compost, green manure) is usually recommended to improve low-CEC soils because over time organic matter can increase the CEC as well as water-holding capacity of coarse-textured soils.
Anaerobically mineralisable N In addition to the Phase 1 indicators discussed above, several other indices in the current set have good potential as soil quality indicators. In particular, anaerobically mineralisable N differentiates soils and land uses very clearly. This measure is useful to monitor the organic matter quality and nutrient status of soils and to indicate their life supporting capacity. A large amount of nitrogen in soil is in the form of organic matter. Before plants are able to make use of this nitrogen it needs to be mineralised by soil microbes into ammonium and nitrate. Examination of the data set shows a very high linear correlation between anaerobically mineralisable N and the microbial biomass, itself a commonly advocated soil quality indicator (Doran & Parkin 1994). Only a small proportion of the total nitrogen is able to be mineralised within a growing season. Anaerobically mineralised N could therefore be substituted for microbial biomass, with the advantage that it is easier and cheaper to measure. The method is equally applicable to soils from farmland, forests, or pastures.
Pasture soils with high organic matter and a high proportion of legumes in the sward often have high mineralisable N levels. Depending on soil organic reserves and plant demands, mineralisable N can supply a large proportion of the nitrogen requirements of the plant. Allophanic soils used for dairy pasture frequently have high mineralisable N contents reflecting high organic matter content and high nitrogen status. If levels are high, then any additional N inputs from fertiliser, dung and urine should be minimised, otherwise N will be in excess of demand.
If levels are low, then the mineralisable N content can be raised by increasing the proportion of legumes in the pastures by liming, fertilising and oversowing of pastures; by ploughing in green manures to cropped soils, or direct additions of organic matter (e.g. composted wastes) to the soil. Even with such additions organic N may take several years to build up. To meet immediate plant demand for N, a soluble source such as urea, DAP or nitrate will need to be supplied at recommended rates. Soils with depleted organic N reserves may need to be supplemented with fertiliser N to meet the deficiency.
The anaerobically mineralisable N of soils under dairy farming was generally greater than under any other land uses. The increase in N status presumably reflects the greater nutrient inputs under dairy farming, increased stocking rates and greater returns of animal wastes to the land. The improved soil nutrient status should benefit pasture productivity, but carries the risk that, at times of low nutrient demand from the pasture species, mineralization of organic N will increase nitrate concentration in the soil. If not utilised by the pasture, nitrate will ultimately be leached through the soil to ground water as a potential
PAGE 40 OF 48 SOIL QUALITY MONITORING TECHNICAL REPORT
pollutant. Whether this represents good or bad soil quality is dependent on the public acceptably of groundwater and surface water pollution. Quality will, to an extent, be dependent on the use and sensitivity of receiving waters.
Bulk density Bulk density is the weight of soil in a specified volume. Bulk density provides a measure of how loose or compacted the soil is. Loose soils may be subject to increased risk of erosion. Compaction reduces the porosity and stability of soil aggregates. The consequences may include reduced supply of air to plant roots, increased resistance to penetration that may limit root extension and germination, and reduced capacity of the soil to store water that is available to plants. Reduced water entry into the soil may increase water runoff over the soil surface. Compaction will increase soil strength, requiring increased tillage power (Shepherd 1992). Bulk density is also an important measurement for interpreting other soil health indicators because it is used to convert concentration values into weight per unit of soil volume. For example, percent organic carbon may be converted into weight of carbon per unit of soil volume (necessary for calculation of carbon storage). The exploitation of soil by plants relates more to characteristics of soil volume than soil weight, so that volume measures may have more ecological relevance than weight measures. This conversion is particularly important when comparing the chemical and biochemical characteristics of the same soil under different land uses where one land use has caused a change in bulk density
Bulk density C content
Land use (g cm-3) (µg g-1) (µg cm-3)
Forest 0.33 266 86.5
Pasture 0.71 205 145
The conclusion that soil under pasture has a lower total C content than forest (when expressed on a gravimetric basis) is shown to be erroneous when recalculated to allow for the differing bulk density. On a volume basis, the pasture soil has a much greater organic matter content than the forest soil. Generally, data expressed on a volumetric or area basis are more meaningful for land use comparisons.
Bulk density provides a measure of the porosity and compaction of a soil. However, soils of differing mineralogy and genesis differ naturally in bulk density, and frequency and method of cultivation can often mask underlying trends. Taken in isolation, bulk density is not a sensitive indicator of soil quality (Fig. 3). The clay mineralogy of some soil types causes them to swell and shrink as they gain or lose moisture. The bulk density of a soil can alter depending on the moisture content. For this reason bulk density may be more readily interpreted from dry samples than from soils sampled while moist. The dry bulk density should be determined for soils showing swelling and shrinking characteristics.
SOIL QUALITY MONITORING TECHNICAL REPORT PAGE 41 OF 48
Highly compacted soils have low infiltration, are poorly aerated, slow draining, susceptible to waterlogging and have a high penetration resistance. Root development is generally decreased in soils with bulk density greater than 1.2 g cm-3, but in cracking clay soils, roots can penetrate along fracture planes even when the bulk density is greater than 1.2 g cm-3. Soils with high clay content will show the effects of compaction at lower levels of bulk density than will soils with low clay content. The effect of clay can be allowed for by calculating the packing density where:
Packing density = 0.09 x % clay x bulk density
It is generally considered that root growth is adversely affected when the packing density is greater than 1.3 t/m3 and the upper limit is 1.85 t/m3 (Webb and Wilson, 1995).
Loose soils that may be exposed to erosion may be compacted by rolling. Continuous vegetation cover offers protection from surface erosion. Amelioration of a compacted soil involves the reduction of any mechanical impact and restoration of vigorous vegetation cover. Growing plants add organic matter to the soil through root growth and decomposition of litter, and stimulate increased burrowing activity of the soil fauna. This has the effect of ‘puffing up’ the soil volume and increasing porosity and aggregate stability. If necessary, tillage or ripping may break up compacted layers.
Readily available water and macroporosity Bulk density measures can only provide a very crude approximation of soil physical condition. Much more sensitive data can be obtained by combining bulk density data with particle density and moisture release characteristics. The preferred indicators for soil physical condition are macroporosity and readily available water, as these two measurements give an indication of the number of larger pores in soil, which are crucially important for aeration and storage of plant-available water. The larger pores are also the first to collapse under pressure, so these measures are much more sensitive to compaction than is bulk density. To calculate macroporosity and readily available water it is necessary to know the bulk density, particle density, and moisture retention at specific tensions (Claydon 1997).
Macroporosity is a measure of the proportion of large pores in the soil that provide the air supply to roots. The pores are larger than about 60 microns. Soils are comprised of solid material, water and air. Where macroporosity is limited the proportion of air is restricted, and when a low macroporosity soil becomes wet air is excluded and consequently reduced diffusion of oxygen will lead to the onset of anaerobic conditions. Very low macroporosity may limit the extension of roots and drainage of water.
Soils with very high macroporosity may need to be mechanically compacted. Continuous vegetation cover offers protection from surface erosion. Amelioration of low macroporosity soils is the same as for high bulk density soils. Any mechanical impacts need to be reduced. Drainage may be necessary to establish vigorous vegetation cover. Growing plants add organic matter to

PAGE 42 OF 48 SOIL QUALITY MONITORING TECHNICAL REPORT
the soil through root growth and decomposition of litter, and stimulate increased burrowing activity of the soil fauna. This has the effect of ‘puffing up’ the soil volume and increasing porosity. If necessary, tillage or ripping may break up compacted layers.
SOIL QUALITY MONITORING TECHNICAL REPORT PAGE 43 OF 48
Appendix 2
1. Sampling and analytical methods
1.1 Soil sampling
The standard sampling procedures used were developed as part of the Ministry for the Environments 500 soil project to provide and consistent approach to soil quality monitoring. The use of these standard procedures allows comparisons to be made between different soil types and between similar soil types in different regions.
A 50 m transect is laid out at each site. Soil cores 2.5 cm diameter to a depth of 10 cm are taken every 2 m along the transect. The 25 individual cores are bulked and mixed before chemical and biochemical analyses at the Landcare Research laboratory at Palmerston North.
Three undisturbed soil samples for physical analyses were obtained from each site at 10, 20 and 30 m positions along the transect by pressing steel liners 75 mm depth by 100 mm diameter into the top 10 cm of soil. Following careful excavation, the liner and soil cores are removed as a unit. The core samples are then bagged and loaded into padded crates for transportation to the Landcare Research laboratory in Hamilton. Subsamples of the cores are then taken for particle size analyses, bulk density and moisture release characteristics.
Samples for aggregate stability measures are taken from the same transect positions as the soil cores. A vertical block of soil 10 cm deep and approximately 10 x 10 cm square are cut from a fresh soil face using a knife and a trenching spade. Samples are bagged and sent to Crop and Food Research, Lincoln, for analyses. Where necessary, the samples are stored at 5°C awaiting analyses.
1.2 Analyses
Chemical properties Total C and N are determined by dry combustion of air-dried, finely ground soils using a Leco 2000 CNS analyser (Blakemore et al. 1987). Olsen P is determined by extracting <2-mm air-dry soils for 30 min with 0.5 M NaHCO3 at pH 8.5 (Olsen et al. 1954) and measuring the PO4
3- concentration by the molybdenum blue method. Soil pH was measured in water using glass electrodes and a 2.5:1 water-to-soil ratio (Blakemore et al. 1987).
Exchangeable cations are determined using “QuickTest” methodology. The shaking extraction (1:50 soil:extractant, 1M ammonium acetate, pH 7.0, 1 hour shake) has been adapted from the method described by Daly et al. (1984). Caesium is added to eliminate ionization interference in the determination of potassium and sodium, and strontium was added to prevent chemical interference in the determination of calcium and magnesium by atomic absorption spectrometry. Concentrations are presented as centimoles of
PAGE 44 OF 48 SOIL QUALITY MONITORING TECHNICAL REPORT
positive charge per kg (cmol(+)/kg). This has the same numeric value as the old meq/100g. These values are then converted to QuickTest units if required.
Biochemical properties Potentially mineralisable N is estimated by the anaerobic (waterlogged) incubation method; the increase in NH+
4-N concentration is measured after incubation for 7 days at 40°C and extraction in 2 M KCl (Keeney & Bremner 1966). This assay also provides data on NH4
+-N and NO3--N concentrations at
the start of incubation.
Physical properties Water release is determined by drainage on pressure plates at 5, 10, 100 and 1500 kPa (Klute 1986). Dry bulk density is measured on a subsampled core dried at 105°C (Klute 1986) and the remaining soil is analysed for particle size and density by the pipette method. Readily available water, total available water, macroporosity (-5 kPa), air capacity (-10 kPa) and total porosity are calculated as described by Klute (1986). Aggregate stability is determined by wet sieving the 2–4 mm aggregates for 20 min on a stack of sieves. The weight of aggregates retained by the 2-mm, 1-mm and 0.5-mm mesh are recorded and used to derive the mean weight diameter (m.w.d.) (Kemper & Rosenau 1986).
As specified by the Regional Council Land Monitoring Forum (Hill et al. 2003), macroporosity is determined at –10 kPa. However, to be consistent with soil physics terminology this measure is more correctly termed “air capacity”. For completeness, both measures are reported here – the macroporosity calculated from the tension at –5 kPa, and the air-capacity calculated from the tension at –10 kPa.
As a soil quality indicator, the soil weight is measured after oven drying and the weight and volume of any stones is subtracted. The measure is then more correctly called ‘fine earth dry bulk density’.
SOIL QUALITY MONITORING TECHNICAL REPORT PAGE 45 OF 48
Appendix 3
1. Statistics and data display
Most data is expressed on a weight/volume or volume/volume basis to allow comparison between soils with differing bulk density. Where appropriate, data from the same land-use category or soil type are combined to allow statistical testing.
Collation and presentation of regional and national soil quality data The data from all 116 sites in the Greater Wellington region sampled using the 500 Soils Project protocol has been combined and sorted according to land use and soil order. The values for individual soil quality indicators have been compared against those suggested by Sparling et al. (2003), specific to land use and soil order. The number of sites, and the number of individual characteristics not meeting the target ranges are used to provide two measures of overall soil quality in the region. The same procedures were applied to the combined data of 584 sites from the 9 other regions in the 500 Soils Project data (predominantly from North Island) providing a comparison of soil quality in the Wellington Region with the rest of the country.
The data has been grouped by land use category. For each land-use category, the proportion of sites meeting or not meeting soil quality targets was calculated using the formula
100/ ×= NCP
where P is the proportion (%) of sites not meeting targets, C is the count of sites exceeding the target range on one or more indicators, and N is the total number of sites sampled. The proportion of the Greater Wellington Region under the 5 land use-categories (dairy pasture, sheep-beef pasture, horticulture and cropping, plantation forests and indigenous vegetation), was supplied estimated from the National Land cover Database. The proportion of concern can then be calculated by multiplying by P derived as above:
AtPAc ×=
where Ac is the area of concern, P is the proportion of sites of concern, and At is the total area. The calculation was completed for each land use individually, and also using all land uses combined to obtain a figure for the whole region.
For each land use, the proportion of sites not meeting the target ranges suggested for each of the 7 indicators was calculated:
100/ ×= NiIcPi
where Pi is the proportion of sites not meeting the target for that particular indicator, Ic is the count of sites exceeding the target range, and Ni is the total number of sites sampled for that indicator.
PAGE 46 OF 48 SOIL QUALITY MONITORING TECHNICAL REPORT
Appendix 4
1. Site sampling strategy
1.1 Field verification of sample site suitability
Each sample site was visually checked for potential anthropogenic impacts upon arrival at site to verify the site’s compatibility with the project objectives. If the sample site proved unsuitable or a more appropriate sample site was identified nearby, the original sample site was replaced with a new site within the same target soil type.
Similarly, a suitability verification process was followed in selecting the specific sampling locations at each sample site. This comprised:
• Avoiding the collection of samples from low-lying areas, as these soils could have higher than background levels of the target analytes due to the concentrating effect of receiving run-off from surrounding raised areas.
• Staying away from potential sources of contamination, such as roads, buildings, drains, etc.
• Avoiding areas where the ground surfaces showed signs of disturbance.
• Relocating to another area if subsurface signs of soil disturbance (such as interrupted stratigraphy or anthropogenic inclusions) were observed in the pit excavated for soil profiling purposes.
1.2 Soil profiling
A test pit was dug with a spade to a depth of 500 mm (ground conditions permitting) at each sample site, to determine the soil profile. The soil profile was then photographed and logged in accordance with the New Zealand Soil Classification System, cross-referenced to the New Zealand Geomechanics Society Soil Classification System.
The soil logs are included in the sample site briefs in Appendix A and the soil profile photographs are presented in Appendix E.
1.3 Positional location of sample sites
At each sample site the location of the test pit was recorded using a geographical positioning system (GPS) handheld receiver. Where dense forest canopy prevented satellite reception a GPS reading was collected at the bush entrance/exit point.
Where sites previously sampled were being revisited in this investigation, the original sampling locations were relocated using the GPS receiver.
SOIL QUALITY MONITORING TECHNICAL REPORT PAGE 47 OF 48
1.4 Sample collection
Four soils samples were collected at each sample site using a cardinal sampling layout as shown below.
Sampling locations were spaced approximately 15 m apart, unless site access constraints dictated otherwise. Due to the gravely nature and/or firmness of the soils in most sample locations, a stainless steel hand auger was selected to collect soil samples in place of a push-tube. Soil was collected from a sample depth ranging between 0-150 mm. At some sample locations more than one auger progression was required in order to obtain enough soil mass to fill the sample collection jar from within the top 150 mm of soil profile. Any dense root or thick leaf litter material at the surface was excluded from the sample by taking a shallow hand auger sample and discarding the unwanted surface material The sample references used consisted of: the Main Soil Type number (the sample site letter) and the sample number. For example, the samples collected at Main Soil Type 1, sample site A was labelled 1(A)1, 1(A)2, 1(A)3 and 1(A)4. The four samples were laboratory composited and analysed accordingly.
1.5 Field quality control (QC) samples
Field QC samples were collected during the site sampling work as follows:
• One set of duplicate soil samples was collected from each of the Main Soil Types 1, 3,4, and 5.
• Equipment rinsate blanks comprising rinse water from the hand auger were collected at one sample site in each of the Main Soil Types 1, 3, 4, 5.
• One trip blank was included with the sample containers dispatched from the laboratory, stored with the collected samples and then returned to the laboratory for analysis.
The results of the QC sample analyses are included in Section 3.
1.6 Sample handling and transport
All samples obtained were handled and transported to the laboratory in accordance with the URS Field Procedures. The procedures include:
• The use of laboratory supplied containers fit for purpose, which were 350 ml glass jars with polyethylene seals.
• Use of clean nitrile gloves at each site when handling the soils.
• Prior to sampling soils at each site, the hand auger was cleaned using a scrubbing brush and a three (3) bucket potable water wash system comprising dirty rinse, Decon rinse and a final clean rinse. The hand auger was then left to air dry.
PAGE 48 OF 48 SOIL QUALITY MONITORING TECHNICAL REPORT
• Labelling soil samples with unique numbers.
• Storage and transport of samples in dedicated chilly bins chilled to a target nominal temperature of 4oC.
• The use of Chain of Custody documentation to provide an auditable trail of sample transport history.
The samples collected were dispatched by courier to the laboratory on the day of collection for analysis.
Hill Laboratories of Hamilton provided the laboratory services used in this investigation. Hill Laboratories is an IANZ accredited laboratory.
The four samples from each site were combined in the laboratory to form a single composite sample prior to analysis. The composite soil samples were analysed by relevant methods for the following analytes: arsenic (As), soluble boron (B), cadmium (Cd), chromium (Cr), copper (Cu), lead (Pb), mercury (Hg), nickel (Ni), zinc (Zn), and total petroleum hydrocarbons (TPH).