Soil properties influencing erodibility of soils in the ...
12
See discussions, stats, and author profiles for this publication at: https://www.researchgate.net/publication/320868520 Soil properties influencing erodibility of soils in the Ntabelanga area, Eastern Cape Province, South Africa Article · November 2017 DOI: 10.1080/09064710.2016.1220624 CITATIONS 0 READS 361 1 author: Some of the authors of this publication are also working on these related projects: Quantification and characterisation of soil organic carbon in sediments from different soil types View project Baby spinach production View project Cosmas Parwada Women's University in Africa 50 PUBLICATIONS 165 CITATIONS SEE PROFILE All content following this page was uploaded by Cosmas Parwada on 07 December 2017. The user has requested enhancement of the downloaded file.
Transcript of Soil properties influencing erodibility of soils in the ...

See discussions, stats, and author profiles for this publication at: https://www.researchgate.net/publication/320868520
Soil properties influencing erodibility of soils in the Ntabelanga area, Eastern
Cape Province, South Africa
Article · November 2017
DOI: 10.1080/09064710.2016.1220624
CITATIONS
0READS
361
1 author:
Some of the authors of this publication are also working on these related projects:
Quantification and characterisation of soil organic carbon in sediments from different soil types View project
Baby spinach production View project
Cosmas Parwada
Women's University in Africa
50 PUBLICATIONS 165 CITATIONS
SEE PROFILE
All content following this page was uploaded by Cosmas Parwada on 07 December 2017.
The user has requested enhancement of the downloaded file.

Full Terms & Conditions of access and use can be found athttp://www.tandfonline.com/action/journalInformation?journalCode=sagb20
Download by: [University of Fort Hare Library] Date: 18 August 2016, At: 02:45
Acta Agriculturae Scandinavica, Section B — Soil & PlantScience
ISSN: 0906-4710 (Print) 1651-1913 (Online) Journal homepage: http://www.tandfonline.com/loi/sagb20
Soil properties influencing erodibility of soils in theNtabelanga area, Eastern Cape Province, SouthAfrica
Cosmas Parwada & Johan Van Tol
To cite this article: Cosmas Parwada & Johan Van Tol (2016): Soil propertiesinfluencing erodibility of soils in the Ntabelanga area, Eastern Cape Province,South Africa, Acta Agriculturae Scandinavica, Section B — Soil & Plant Science, DOI:10.1080/09064710.2016.1220614
To link to this article: http://dx.doi.org/10.1080/09064710.2016.1220614
Published online: 18 Aug 2016.
Submit your article to this journal
View related articles
View Crossmark data

Soil properties influencing erodibility of soils in the Ntabelanga area, EasternCape Province, South AfricaCosmas Parwadaa and Johan Van Tola,b
aDepartment of Agronomy, University of Fort Hare, Alice, South Africa; bDepartment of Soil- and Crop- and Climate Sciences, University ofthe Free State, Bloemfontein, South Africa
ABSTRACTSoil erosion has serious off-site impacts caused by increased mobilization of sediment anddelivery to water bodies causing siltation and pollution. To evaluate factors influencing soilerodibility at a proposed dam site, 21 soil samples collected were characterized. The soilswere analyzed for soil organic carbon (SOC), exchangeable bases, exchangeable acidity, pH,electrical conductivities, mean weight diameter and soil particles’ size distribution. Cationexchange capacity, exchangeable sodium percentage, sodium adsorption ratio, dispersionratio (DR), clay flocculation index (CFI), clay dispersion ratio (CDR) and Ca:Mg ratio were thencalculated. Soil erodibility (K-factor) estimates were determined using SOC content andsurface soil properties. Soil loss rates by splashing were determined under rainfall simulationsat 360 mmh−1 rainfall intensity. Soil loss was correlated to the measured chemical andphysical soil properties. There were variations in soil form properties and erodibility indicesshowing influence on soil loss. The average soil erodibility and SOC values were0.0734 t MJ−1 mm−1 and 0.81%, respectively. SOC decreased with depth and soil lossincreased with a decrease in SOC content. SOC significantly influenced soil loss, CDR, CFI andDR (P < .05). The soil loss rate was 5.60 t/ha per 8 minute rainstorm of 360 mmh−1. Additionof organic matter stabilize the soils against erosion.
ARTICLE HISTORYReceived 13 June 2016Accepted 29 July 2016
KEYWORDSSoil erosion; siltation;soil organic carbon;characterization; simulation
Introduction
Soil erosion is the most widespread form of land degra-dation worldwide (Bridges & Oldeman 1999). The highheterogeneity of soil erosion causal factors combinedwith often generalized data is an obstacle for effectivecontrol (Cai et al. 2004). Effective controlling of soilerosion still remains a challenge in most parts of theworld especially in the developing countries. In SouthAfrica, about 85% of land is threatened by soilerosion (Van Rensburg 2008) and the estimatedaverage soil erosion rates are more than 4.1 t/ha/yr(Lu et al. 2003). Soil erosion has serious off-site effectsrelated to increased mobilization of sediments anddelivery to rivers and dams. A case is where thestorage capacity of the Welbedacht Dam near Dewets-dorp in the Free State, South Africa, was rapidlyreduced by more than 86% from its original storagecapacity within 20 years of its completion in 1973(DWA 2011). Regardless of such soil erosion back-ground, the Government of South Africa through theDepartment of Water Affairs has proposed to build amulti-purpose dam along the Tsitsa River in Ntabe-langa. Soil erosion data collected at large spatial
context characterized the soils in the area as highlyunstable and easily erodible. The Ntabelanga area hasvarious soil types with varying degrees of sensitivityto soil erosion (Van Tol et al. 2014). High rates of soilerosion in the area will shorten the dam lifespanthrough siltation if unchecked (Parwada & van Tol2016). Efforts to reduce soil erosion in Ntabelanga arefailing (Laker 2004). The soil sedimentation problemmay get worse in future due to population increaseand denudation processes associated with climaticchanges (Le Roux et al. 2008). Considering the increas-ing threat of sedimentation of water bodies, it is impor-tant to identify source areas and key processes ofsediment transport from the field to the reservoirs.
Soil erodibility is the susceptibility of soil to erosion,which closely relates to a range of soil physical andchemical properties (Vrieling 2006; Ezeabasili et al.2014). The soil physical properties may influence soilerosion through changing soil infiltration capacityand soil shear strength (Li et al. 2010). Soil organiccarbon (SOC) content and Fe oxides content mayaffect soil erodibility through changing soil
© 2016 Informa UK Limited, trading as Taylor & Francis Group
CONTACT Cosmas Parwada [email protected] Department of Agronomy, University of Fort Hare, Alice, South Africa
ACTA AGRICULTURAE SCANDINAVICA, SECTION B — SOIL & PLANT SCIENCE, 2016http://dx.doi.org/10.1080/09064710.2016.1220614

aggregation. Sun et al. (2013) selected the degree ofaggregate dispersibility and the ratio of collapsingrate to infiltration rate as indices to predict the possi-bility of the occurrence of erosion (Sun et al. 2013).Other researchers prefer to use soil erodibility (incor-porating aggregate stability) factor as a simpler andmore feasible factor for erosion prediction (Dimoyian-nis et al. 2006; Yan et al. 2010). The breakdown ofunstable aggregates results in pore collapse, finer par-ticles and microaggregates that play significant roles insoil erosion (Yan et al. 2010).
Chemical dispersion of clay particles and slaking orphysical disintegration of soil aggregates increasewater runoff (Amezketa et al. 2004). The relative impor-tance of dispersion and slaking depends on various soilproperties, particularly soil exchangeable sodium per-centage (ESP), the rate of soil wetting and drying, andthe electrical conductivity (EC) of the applied water. Dis-persion of soil clays is induced by low electrolyte con-centrations (lower than the soil’s flocculation value)and high sodium adsorption ratio (SAR) and pH valuesin the soil (Reinks et al. 2000). Soil erosion has beendirectly linked to the rate and volume of water-dispersi-ble clay in a soil. Potential soil erosion in areas ofvery high rainfall has been estimated using water-dis-persible clay and its indices (Amezketa et al. 2004;Igwe & Agbatah 2008). The clay dispersion ratio(CDR) derived from the clay content, water-dispersibleclay (WDC) and the dispersion ratio (DR) being anindex from water-dispersible silt and clay and theircorresponding total forms has also been successfullyused to predict erosion by water (Igwe & Udegbunam2008). Igwe (2005) concluded that the CDR and the DRwere good indices for predicting erodibility in somesoils. Whilst a wide range of soil properties havebeen linked to the rate at which soil disperses, Igweet al. (1995) concluded that organic carbon and Feoxides are important in controlling flocculation anddeflocculation in soil.
The causes of soil erosion are mostly generalized butfor effective control measures and technologies, soundknowledge on the specific site and soil properties isrequired (Ojo 2000). Site and soil characteristicschange over short distances and time hence specificsite characterization is essential before prescribingsoil conservation measures, road construction anddam construction. Currently, there are limited data onthe intrinsic soil properties in Ntabelanga, hence theneed to characterize the soils in this regard. In thisstudy, we hypothesized that in Ntabelanga, soil erod-ibility is more influential to soil erosion than erosivity.Therefore, the objectives of this study were to (1)characterize representative soils around the proposed
dam site for both chemical and physical propertiesand (2) determine soil erodibility indices and theirrelationship with the level of soil loss.
Materials and methods
Description of the study area
The study was conducted in the Ntabelanga area in theEastern Cape Province of South Africa and is locatedabout 626 km south of Pretoria. Ntabelanga is locatedon 31° 7′ 35.9′′ S and 28° 40′ 30.6′′ E and falls withinthe South Eastern Uplands Aquatic Ecoregion and theMzimvubu to Kieskamma Management Area (WMA).It is in the sub-escarpment Grassland and sub-escarpment Savanna Bioregions (Mucina & Rutherford2006). Ntabelanga receives an annual rainfall total ofabout 749 mm, with most of it falling in Decemberand January. The lowest (15 mm) average rainfall isreceived in June and the highest (108 mm) inJanuary. The area is underlain by sedimentary rocksof the Tarkastad subgroup and Beaufort karoo super-group with post karoo doleritic intrusions. There arealso traces of mudflake conglomerates. Sub-humidgrasslands in Ntabelanga, even with their dense grasscover, suffer from severe gully erosion (Sonneveldet al. 2005). The area is characterized by highly unstablesoils that are prone to erosion as evidenced by exten-sive areas of severe gully erosion on the inter-fluvialareas adjacent to stream channels. The erosional andpiping characteristics in Ntabelanga are suggestive ofthe presence of dispersive soils (DWA 2013).
Site selection and soil sampling
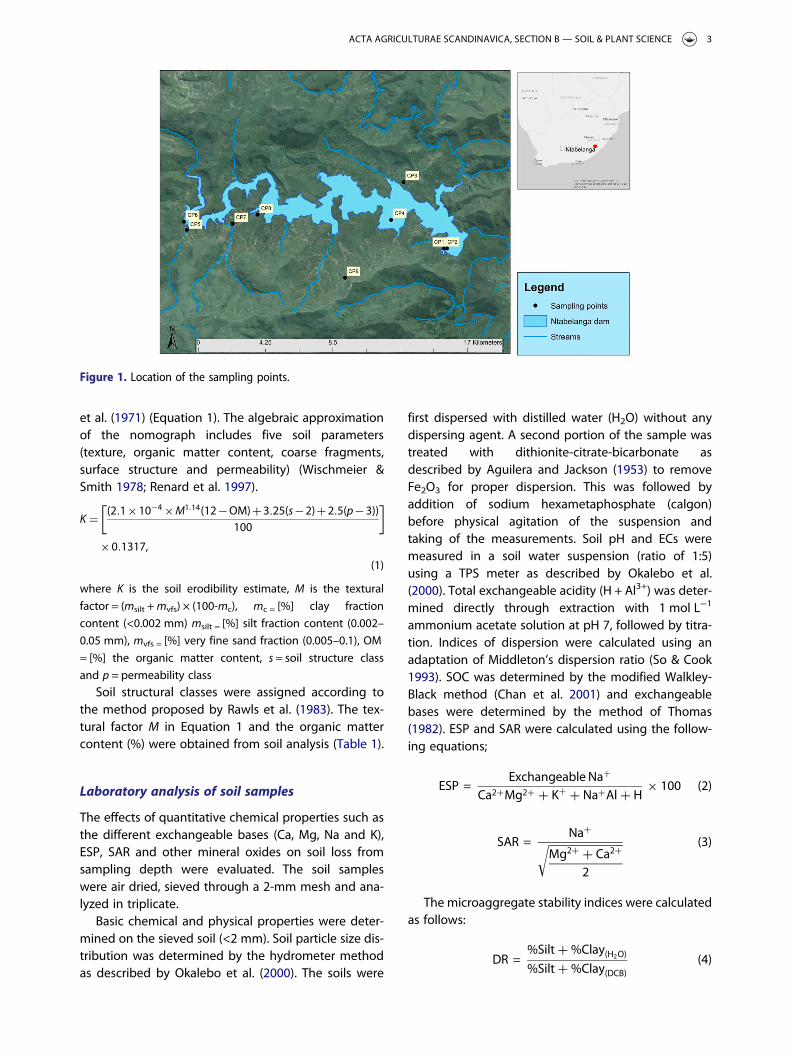
Twenty-one soil samples were randomly collected fromnine profiles representing the dominant soil forms(G horizon, Katspruit, Oakleaf, Valsrivier, Hutton,Sterkspruit and Glenrosa) and horizons in the area(Soil Classification. Taxonomic System for South Africa1991). The soil profiles and horizons varied in depth;six were deeper than 30 cm and three shallow (i.e.<30 cm). Some of the sampling points were severelyeroded and lacked the A-horizon and others wererocky just below the A-horizon. Depending on thesoil profile depth, soils were sampled from 0–5, 5–30,30–50 and 0–50 cm (Figure 1).
Soil erodibility estimates (K-factor) for thesampled locations
The measurement of the K-factor was done using thesoil erodibility nomograph as proposed by Wischmeier
2 C. PARWADA AND J. VAN TOL
et al. (1971) (Equation 1). The algebraic approximationof the nomograph includes five soil parameters(texture, organic matter content, coarse fragments,surface structure and permeability) (Wischmeier &Smith 1978; Renard et al. 1997).
K = (2.1×10⁻⁴×M1.14(12−OM)+3.25(s−2)+2.5(p−3))100
[ ]
×0.1317,
(1)
where K is the soil erodibility estimate, M is the textural
factor = (msilt +mvfs) × (100-mc), mc = [%] clay fraction
content (<0.002 mm) msilt = [%] silt fraction content (0.002–
0.05 mm), mvfs = [%] very fine sand fraction (0.005–0.1), OM
= [%] the organic matter content, s = soil structure class
and p = permeability class
Soil structural classes were assigned according tothe method proposed by Rawls et al. (1983). The tex-tural factor M in Equation 1 and the organic mattercontent (%) were obtained from soil analysis (Table 1).
Laboratory analysis of soil samples
The effects of quantitative chemical properties such asthe different exchangeable bases (Ca, Mg, Na and K),ESP, SAR and other mineral oxides on soil loss fromsampling depth were evaluated. The soil sampleswere air dried, sieved through a 2-mm mesh and ana-lyzed in triplicate.
Basic chemical and physical properties were deter-mined on the sieved soil (<2 mm). Soil particle size dis-tribution was determined by the hydrometer methodas described by Okalebo et al. (2000). The soils were
first dispersed with distilled water (H2O) without anydispersing agent. A second portion of the sample wastreated with dithionite-citrate-bicarbonate asdescribed by Aguilera and Jackson (1953) to removeFe2O3 for proper dispersion. This was followed byaddition of sodium hexametaphosphate (calgon)before physical agitation of the suspension andtaking of the measurements. Soil pH and ECs weremeasured in a soil water suspension (ratio of 1:5)using a TPS meter as described by Okalebo et al.(2000). Total exchangeable acidity (H + Al3+) was deter-mined directly through extraction with 1 mol L−1
ammonium acetate solution at pH 7, followed by titra-tion. Indices of dispersion were calculated using anadaptation of Middleton’s dispersion ratio (So & Cook1993). SOC was determined by the modified Walkley-Black method (Chan et al. 2001) and exchangeablebases were determined by the method of Thomas(1982). ESP and SAR were calculated using the follow-ing equations;
ESP =Exchangeable Na+
Ca2+Mg2+ + K+ + Na+Al+ H× 100 (2)
SAR =Na+���������������
Mg2+ + Ca2+
2
√ (3)
The microaggregate stability indices were calculatedas follows:
DR =%Silt+%Clay(H2O)
%Silt+%Clay(DCB)(4)
Figure 1. Location of the sampling points.
ACTA AGRICULTURAE SCANDINAVICA, SECTION B — SOIL & PLANT SCIENCE 3
CFI = [%Clay(DCB) − %Clay(H2O)]
%Clay(DCB)× 100 (5)
The CFI is an effective index in predicting soil erod-ibility and a good microaggregate index (Igwe et al.1995). Soils high in CFI are well aggregated and willnot be easily dispersed in water.
CDR = %Clay(H2O)
%Clay(DCB)× 100 (6)
The higher the CDR and DR, the more the ability ofthe soil to disperse and lost in runoff.
Ca2+ : Mg2+ ratio = Ca2+
Mg2+(7)
Aggregate stability
Soil samples were air dried and large clods were brokenby hand. The air dried material was passed through a5-mm sieve. Visible organic materials and debris werediscarded. The samples were then oven dried at105°C for 24 hours. Aggregate stability was measuredaccording to Le Bissonnais (1996).
After oven drying, 5 g of soil samples wereimmersed in 50 mL deionized water for 10 minutes.Three replicates were used per sample. The waterwas sucked off with a pipette, and the material wasgently transferred to a 50 µm sieve previouslyimmersed in ethanol. The sieve was gently moved upand down in ethanol five times to separate the frag-ments <50 µm from those >50 µm. The remaining>50 µm fraction was oven dried at 105°C for 24 hoursand gently sieved by hand on a stack of sieves of2000, 1000, 500, 200, 100 and 50 µm pore size. Theweight of each fraction was then measured, theweight of the soil fraction <50 µm was calculated asthe difference between the initial weight and thesum of the weight of the other six fractions andexpressed as the mean weight diameter (MWD). TheMWD was calculated using the following equation
(Hillel 2004)MWD =
∑ni=1
wixi , (8)
where xi =mean diameter of the ith particular sizerange of aggregates separated by sieving and wi =the weight of aggregates in ith size range as a fractionof the total dry weight of the sample analyzed.
Soil loss simulation
Soil loss was determined by rainfall simulation. Rainfallwas applied as 8 minute single rainstorm at360 mmh−1 intensity. Three runs of rainfall simulationswere conducted per sample. A rainfall simulator forerosion tests (LUW, Eijelkamp Equipment, 6897 ZGGiesbeck, the Netherlands) was used. The simulatorhad 49 capillary tubes and applied raindrops of5.9 mm in diameter. The splash cups containing thesoil were slowly pre-wetted from the bottom with tapwater until saturated and then placed under the rainfallsimulator. The samples were subjected to simulatedrainfall at 360 mmh−1. The high-intensity rainfall wasused to compensate for the short falling distance of0.4 m, of each simulated raindrop and the resultinglow volume specific kinetic energy of the appliedshower as suggested by Martin et al. (2010). Thetime-specific energy of the simulated rain was1440 J m−2 hr−1. Natural rainfall events with this time-specific kinetic energy approximate natural rainfallintensities of about 60 mmh−1 (Martin et al. 2010).After each rainstorm, the splash cup was removedfrom the splash plate. Splashed sediment waswashed out of the plate into a jar, oven dried at105°C for 24 hours and weighed. The weight was con-verted from soil loss in grams per splash cup area(0.07 m2) to tonnes per hectare. The following formulawas used:
S= D100×A
t/ha per 8 minute rainstorm of 360 mmh−1,
(9)
Table 1. Surface soil structure class, permeability class and erodibility factor (K ) of the Ntabelanga soils.Location Horizon Soil form Surface soil structure class Permeability class K-factor (t ha h ha−1 MJ−1 mm−1)
CP1 ot.s Ka (2) Fine granular (2) Moderate fast 0.0465CP2 ml.s Bo (1) Very fine granular (6) Very slow 0.0596CP3 ot.s Oa (2) Fine granular (4) Moderate low 0.0519CP4 ot Va (1) Very fine granular (2) Moderate fast 0.0982CP5 ot Hu (1) Very fine granular (2) Moderate fast 0.1036CP6 ot Ss (4) Blocky (4) Moderate low 0.0876CP7 so – (4) Blocky (6) Very slow 0.0866CP8 ot Ka (1) Bery fine granular (6) Very slow 0.0477CP9 ot Gs (3) Very coarse (2) Moderate fast 0.0693
Note: ot = orthic A, ml = melanic A, vp = pedocutanic B, re = red apedal B, so = saprolite (N.B. was found on the surface), gh = G horizon, Ka = Katspruit, Oa =Oakleaf, Va = Valsrivier, Hu = Hutton, Ss = Sterkspruit, Gs = Glenrosa.
4 C. PARWADA AND J. VAN TOL
where S is the sediment yield in t/ha, D is the measuredsediments from the splash plate in grams and A is thesurface area of the splash cup.
Statistical analysis of erodibility
Pair-wise correlations between soil loss and theobserved soil properties were done using JMP. 11.0.0Statistical software (SAS Institute, Inc., Cary, NC, USA,2010).
Results and discussion
The higher the soil erodibility estimate value the higherthe rate of soil loss. The average erodibility estimate (K-factor) of the soils was 0.0734 t ha ha−1MJ−1 mm−1. Thesoil forms, ranked according to their levels of erodibility,were as follows: Hu>Va>Ss>Gs>Bo>Oa>Ka (Table 1).
The highest and lowest soil erodibility estimateswere observed in Hutton and Katspruit soil forms,respectively (Table 1). Generally, the Hutton soil formsare not characterized by the dominance of smectiticclays minerals (Fey & Gilkes 2010) with a low erodibility.Singer (1994) reported decreasing aggregate stabilitywith increasing smectite and inversely with kaolinitecontent. Again Wakindiki and Ben-Hur (2002) notedsoils that contain smectite in contrast to the soils thatcontain kaolinite are more susceptible to watererosion. The Katspruit soil forms are characteristicallypoorly drained (Van Huyssteen et al. 2010) with moder-ate to high erodibity. The results were not consistentwith these observations meaning erodibility of thesoils was not influenced by the clay mineralogy.
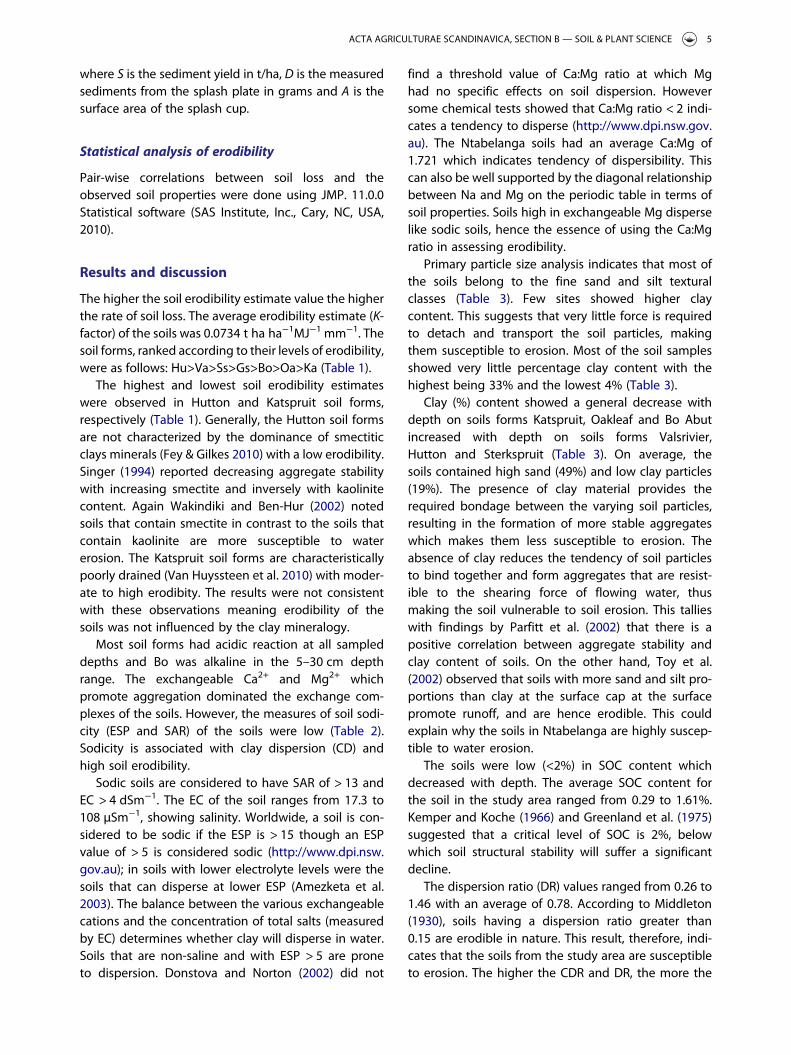
Most soil forms had acidic reaction at all sampleddepths and Bo was alkaline in the 5–30 cm depthrange. The exchangeable Ca2+ and Mg2+ whichpromote aggregation dominated the exchange com-plexes of the soils. However, the measures of soil sodi-city (ESP and SAR) of the soils were low (Table 2).Sodicity is associated with clay dispersion (CD) andhigh soil erodibility.
Sodic soils are considered to have SAR of > 13 andEC > 4 dSm−1. The EC of the soil ranges from 17.3 to108 µSm−1, showing salinity. Worldwide, a soil is con-sidered to be sodic if the ESP is > 15 though an ESPvalue of > 5 is considered sodic (http://www.dpi.nsw.gov.au); in soils with lower electrolyte levels were thesoils that can disperse at lower ESP (Amezketa et al.2003). The balance between the various exchangeablecations and the concentration of total salts (measuredby EC) determines whether clay will disperse in water.Soils that are non-saline and with ESP > 5 are proneto dispersion. Donstova and Norton (2002) did not
find a threshold value of Ca:Mg ratio at which Mghad no specific effects on soil dispersion. Howeversome chemical tests showed that Ca:Mg ratio < 2 indi-cates a tendency to disperse (http://www.dpi.nsw.gov.au). The Ntabelanga soils had an average Ca:Mg of1.721 which indicates tendency of dispersibility. Thiscan also be well supported by the diagonal relationshipbetween Na and Mg on the periodic table in terms ofsoil properties. Soils high in exchangeable Mg disperselike sodic soils, hence the essence of using the Ca:Mgratio in assessing erodibility.
Primary particle size analysis indicates that most ofthe soils belong to the fine sand and silt texturalclasses (Table 3). Few sites showed higher claycontent. This suggests that very little force is requiredto detach and transport the soil particles, makingthem susceptible to erosion. Most of the soil samplesshowed very little percentage clay content with thehighest being 33% and the lowest 4% (Table 3).
Clay (%) content showed a general decrease withdepth on soils forms Katspruit, Oakleaf and Bo Abutincreased with depth on soils forms Valsrivier,Hutton and Sterkspruit (Table 3). On average, thesoils contained high sand (49%) and low clay particles(19%). The presence of clay material provides therequired bondage between the varying soil particles,resulting in the formation of more stable aggregateswhich makes them less susceptible to erosion. Theabsence of clay reduces the tendency of soil particlesto bind together and form aggregates that are resist-ible to the shearing force of flowing water, thusmaking the soil vulnerable to soil erosion. This tallieswith findings by Parfitt et al. (2002) that there is apositive correlation between aggregate stability andclay content of soils. On the other hand, Toy et al.(2002) observed that soils with more sand and silt pro-portions than clay at the surface cap at the surfacepromote runoff, and are hence erodible. This couldexplain why the soils in Ntabelanga are highly suscep-tible to water erosion.
The soils were low (<2%) in SOC content whichdecreased with depth. The average SOC content forthe soil in the study area ranged from 0.29 to 1.61%.Kemper and Koche (1966) and Greenland et al. (1975)suggested that a critical level of SOC is 2%, belowwhich soil structural stability will suffer a significantdecline.
The dispersion ratio (DR) values ranged from 0.26 to1.46 with an average of 0.78. According to Middleton(1930), soils having a dispersion ratio greater than0.15 are erodible in nature. This result, therefore, indi-cates that the soils from the study area are susceptibleto erosion. The higher the CDR and DR, the more the
ACTA AGRICULTURAE SCANDINAVICA, SECTION B — SOIL & PLANT SCIENCE 5
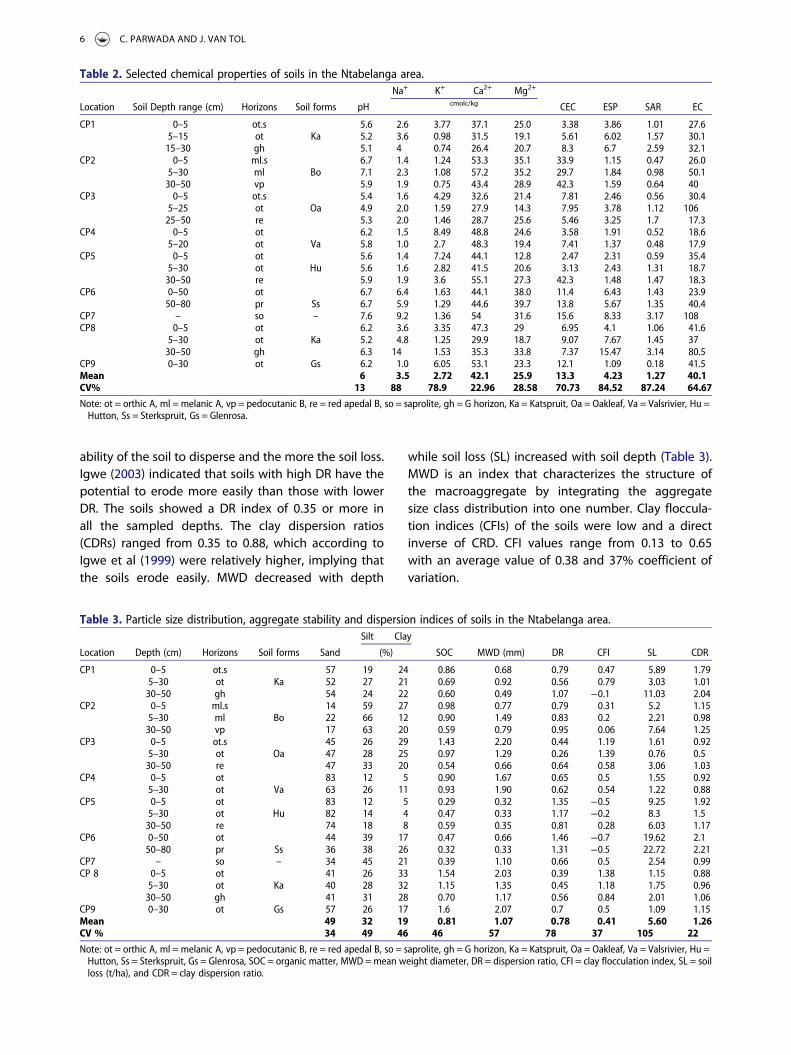
ability of the soil to disperse and the more the soil loss.Igwe (2003) indicated that soils with high DR have thepotential to erode more easily than those with lowerDR. The soils showed a DR index of 0.35 or more inall the sampled depths. The clay dispersion ratios(CDRs) ranged from 0.35 to 0.88, which according toIgwe et al (1999) were relatively higher, implying thatthe soils erode easily. MWD decreased with depth
while soil loss (SL) increased with soil depth (Table 3).MWD is an index that characterizes the structure ofthe macroaggregate by integrating the aggregatesize class distribution into one number. Clay floccula-tion indices (CFIs) of the soils were low and a directinverse of CRD. CFI values range from 0.13 to 0.65with an average value of 0.38 and 37% coefficient ofvariation.
Table 2. Selected chemical properties of soils in the Ntabelanga area.
Location Soil Depth range (cm) Horizons Soil forms pH
Na+ K+ Ca2+ Mg2+
CEC ESP SAR ECcmolc/kg
CP1 0–5 ot.s 5.6 2.6 3.77 37.1 25.0 3.38 3.86 1.01 27.65–15 ot Ka 5.2 3.6 0.98 31.5 19.1 5.61 6.02 1.57 30.115–30 gh 5.1 4 0.74 26.4 20.7 8.3 6.7 2.59 32.1
CP2 0–5 ml.s 6.7 1.4 1.24 53.3 35.1 33.9 1.15 0.47 26.05–30 ml Bo 7.1 2.3 1.08 57.2 35.2 29.7 1.84 0.98 50.130–50 vp 5.9 1.9 0.75 43.4 28.9 42.3 1.59 0.64 40
CP3 0–5 ot.s 5.4 1.6 4.29 32.6 21.4 7.81 2.46 0.56 30.45–25 ot Oa 4.9 2.0 1.59 27.9 14.3 7.95 3.78 1.12 10625–50 re 5.3 2.0 1.46 28.7 25.6 5.46 3.25 1.7 17.3
CP4 0–5 ot 6.2 1.5 8.49 48.8 24.6 3.58 1.91 0.52 18.65–20 ot Va 5.8 1.0 2.7 48.3 19.4 7.41 1.37 0.48 17.9
CP5 0–5 ot 5.6 1.4 7.24 44.1 12.8 2.47 2.31 0.59 35.45–30 ot Hu 5.6 1.6 2.82 41.5 20.6 3.13 2.43 1.31 18.730–50 re 5.9 1.9 3.6 55.1 27.3 42.3 1.48 1.47 18.3
CP6 0–50 ot 6.7 6.4 1.63 44.1 38.0 11.4 6.43 1.43 23.950–80 pr Ss 6.7 5.9 1.29 44.6 39.7 13.8 5.67 1.35 40.4
CP7 – so – 7.6 9.2 1.36 54 31.6 15.6 8.33 3.17 108CP8 0–5 ot 6.2 3.6 3.35 47.3 29 6.95 4.1 1.06 41.6
5–30 ot Ka 5.2 4.8 1.25 29.9 18.7 9.07 7.67 1.45 3730–50 gh 6.3 14 1.53 35.3 33.8 7.37 15.47 3.14 80.5
CP9 0–30 ot Gs 6.2 1.0 6.05 53.1 23.3 12.1 1.09 0.18 41.5Mean 6 3.5 2.72 42.1 25.9 13.3 4.23 1.27 40.1CV% 13 88 78.9 22.96 28.58 70.73 84.52 87.24 64.67
Note: ot = orthic A, ml = melanic A, vp = pedocutanic B, re = red apedal B, so = saprolite, gh = G horizon, Ka = Katspruit, Oa = Oakleaf, Va = Valsrivier, Hu =Hutton, Ss = Sterkspruit, Gs = Glenrosa.
Table 3. Particle size distribution, aggregate stability and dispersion indices of soils in the Ntabelanga area.
Location Depth (cm) Horizons Soil forms Sand
Silt Clay
SOC MWD (mm) DR CFI SL CDR(%)
CP1 0–5 ot.s 57 19 24 0.86 0.68 0.79 0.47 5.89 1.795–30 ot Ka 52 27 21 0.69 0.92 0.56 0.79 3.03 1.0130–50 gh 54 24 22 0.60 0.49 1.07 −0.1 11.03 2.04
CP2 0–5 ml.s 14 59 27 0.98 0.77 0.79 0.31 5.2 1.155–30 ml Bo 22 66 12 0.90 1.49 0.83 0.2 2.21 0.9830–50 vp 17 63 20 0.59 0.79 0.95 0.06 7.64 1.25
CP3 0–5 ot.s 45 26 29 1.43 2.20 0.44 1.19 1.61 0.925–30 ot Oa 47 28 25 0.97 1.29 0.26 1.39 0.76 0.530–50 re 47 33 20 0.54 0.66 0.64 0.58 3.06 1.03
CP4 0–5 ot 83 12 5 0.90 1.67 0.65 0.5 1.55 0.925–30 ot Va 63 26 11 0.93 1.90 0.62 0.54 1.22 0.88
CP5 0–5 ot 83 12 5 0.29 0.32 1.35 −0.5 9.25 1.925–30 ot Hu 82 14 4 0.47 0.33 1.17 −0.2 8.3 1.530–50 re 74 18 8 0.59 0.35 0.81 0.28 6.03 1.17
CP6 0–50 ot 44 39 17 0.47 0.66 1.46 −0.7 19.62 2.150–80 pr Ss 36 38 26 0.32 0.33 1.31 −0.5 22.72 2.21
CP7 – so – 34 45 21 0.39 1.10 0.66 0.5 2.54 0.99CP 8 0–5 ot 41 26 33 1.54 2.03 0.39 1.38 1.15 0.88
5–30 ot Ka 40 28 32 1.15 1.35 0.45 1.18 1.75 0.9630–50 gh 41 31 28 0.70 1.17 0.56 0.84 2.01 1.06
CP9 0–30 ot Gs 57 26 17 1.6 2.07 0.7 0.5 1.09 1.15Mean 49 32 19 0.81 1.07 0.78 0.41 5.60 1.26CV % 34 49 46 46 57 78 37 105 22
Note: ot = orthic A, ml = melanic A, vp = pedocutanic B, re = red apedal B, so = saprolite, gh = G horizon, Ka = Katspruit, Oa = Oakleaf, Va = Valsrivier, Hu =Hutton, Ss = Sterkspruit, Gs = Glenrosa, SOC = organic matter, MWD =mean weight diameter, DR = dispersion ratio, CFI = clay flocculation index, SL = soilloss (t/ha), and CDR = clay dispersion ratio.
6 C. PARWADA AND J. VAN TOL
The dispersion ratio was positively and significantlycorrelated to soil loss; as the DR increased, the rate ofsoil loss also increased (Table 4).
Clay flocculation index (CFI) showed a negative sig-nificant correlation with soil loss. CFI also correlates sig-nificantly with CR, CDR and SOC and may be the bestindex to describe the degree of soil loss. The impli-cation of this is that CFI alone could be used topredict soil erosion hazard and as CFI increases thereis a corresponding increase in erosion hazard. CRDnegatively correlated with CFI, SOC and MWD, thusconfirming the role played by clay and organicmatter content in the aggregation of soil. A review ofsoil science literature suggests that soils with SOClevels of 5% should achieve stability (http://www.tree-power.org/soils). Bann and Field (2010) also notedthat addition of organic matter to duplex soilsincreased soil porosity, thereby increasing infiltrationand water-holding capacity of the soil and less poten-tially erosive runoff.
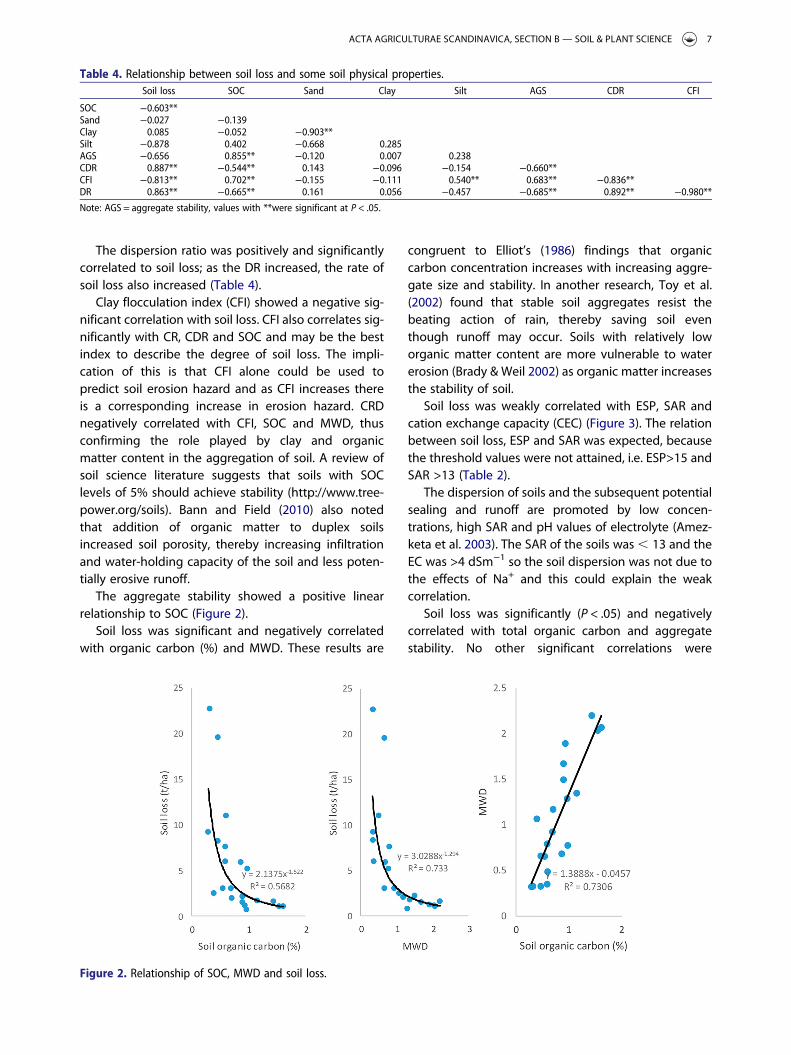
The aggregate stability showed a positive linearrelationship to SOC (Figure 2).
Soil loss was significant and negatively correlatedwith organic carbon (%) and MWD. These results are
congruent to Elliot’s (1986) findings that organiccarbon concentration increases with increasing aggre-gate size and stability. In another research, Toy et al.(2002) found that stable soil aggregates resist thebeating action of rain, thereby saving soil eventhough runoff may occur. Soils with relatively loworganic matter content are more vulnerable to watererosion (Brady & Weil 2002) as organic matter increasesthe stability of soil.
Soil loss was weakly correlated with ESP, SAR andcation exchange capacity (CEC) (Figure 3). The relationbetween soil loss, ESP and SAR was expected, becausethe threshold values were not attained, i.e. ESP>15 andSAR >13 (Table 2).
The dispersion of soils and the subsequent potentialsealing and runoff are promoted by low concen-trations, high SAR and pH values of electrolyte (Amez-keta et al. 2003). The SAR of the soils was, 13 and theEC was >4 dSm−1 so the soil dispersion was not due tothe effects of Na+ and this could explain the weakcorrelation.
Soil loss was significantly (P < .05) and negativelycorrelated with total organic carbon and aggregatestability. No other significant correlations were
Table 4. Relationship between soil loss and some soil physical properties.Soil loss SOC Sand Clay Silt AGS CDR CFI
SOC −0.603**Sand −0.027 −0.139Clay 0.085 −0.052 −0.903**Silt −0.878 0.402 −0.668 0.285AGS −0.656 0.855** −0.120 0.007 0.238CDR 0.887** −0.544** 0.143 −0.096 −0.154 −0.660**CFI −0.813** 0.702** −0.155 −0.111 0.540** 0.683** −0.836**DR 0.863** −0.665** 0.161 0.056 −0.457 −0.685** 0.892** −0.980**Note: AGS = aggregate stability, values with **were significant at P < .05.
Figure 2. Relationship of SOC, MWD and soil loss.
ACTA AGRICULTURAE SCANDINAVICA, SECTION B — SOIL & PLANT SCIENCE 7

observed between soil loss and other measured soilproperties (Table 5).
Aggregate stability was positively correlated to totalorganic carbon. The results showed a linear relation-ship between soil aggregate stability and totalorganic matter. This agrees with Ekwue (1990) andKing and Evans (1986) who also found the samelinear relationship.
The results showed that Ntabelanga is dominatedby sandy soils low in clay content. On average, thesoils were classified as loam (49% sand, 32% silt and19% clay). The soils are low in total organic carbon(<2%) and soil loss was classified as low (5 to 12 t/hain 8 min single rainstorm of 360 mm h−1). The loworganic carbon greatly influenced the soil erodibility.Soil loss was inversely related to SOC and MWD. Soilloss increased with reduced levels of SOC (%). Thegreater the soil loss, the lower the SOC (%). Soil losswas reduced with an increase in the MWD.
Soil erodibility indices such as MWD, CD, CDR andCFI were influenced by the SOC of the soils. TheMWD (mm) increased with increased levels of SOCwhile the DR and CDR increased with a decrease inthe SOC. CFI of the soils showed to increase with anincreased level of SOC. The SOC increased as the SARvalue increased.
The soils were characterized by low ESP and SARvalues. Most of the soils that contained low amount
of exchangeable Na+ did not influence the soil loss.The soils were not sodic.
It is evidenced from this study that high rates of soilloss in Ntabelanga is mainly due to the low content oforganic carbon in the soil. Therefore in order to stabil-ize the soils against water erosion, land managementpractices that promote accumulation and addition oforganic matter in the soils may be recommended.
Disclosure statement
No potential conflict of interest was reported by the authors.
Funding
The authors gratefully acknowledge the Agricultural ResearchCouncil for funding received for the study as well as the WaterResearch Commission for financial support to the first author.This work was supported by the Agricultural ResearchCouncil; Green village project.
Notes on contributors
Cosmas Parwada is a lecturer in the Crop Science Depart-ment at Bindura University of Science Education, Zimbabwe.He has a number of research publications in crop and soilmanagement and currently a Ph.D. in soil science candidateat the University of Fort Hare, South Africa.
Figure 3. Relationship of soil loss with ESP, sodium adsorption ratio and CEC.
Table 5. Relationship between soil loss and some soil chemical properties.SOC ECC EC AGS Ca2+ Mg2+ K Na SAR ESP pH
SL −0.60** −0.24 0.01 −0.66** −0.03 −0.01 −0.006 0.04 0.10 0.09 0.20AGS 0.85** 0.15 −0.18 1.00 −0.38 −0.42 −0.28 −0.48 −0.33 −0.11 0.06SOC 1.00 −0.03 −0.08 0.85** −0.28 −0.31 −0.16 −0.50* −0.45* −0.23 −0.12CDR −0.54* −0.33 −0.09 0.66* −0.07 −0.06 −0.09 0.05 0.12 0.10 0.10CFI 0.70** 0.33 −0.18 −0.81** −0.19 −0.17 −0.09 −0.13 0.003 0.13 −0.31DR −0.67** −0.34 0.11 0.86** 0.12 0.11 0.04 0.08 −0.01 −0.09 0.25
Note: SL = soil loss, SOC = total organic carbon, AGS = aggregate stability.Pair values with * and ** were significant at P < .001 and P < .05, respectively.
8 C. PARWADA AND J. VAN TOL
Dr Johan Van Tol is a senior lecturer in the Department ofSoil-and Crop and Climate Science at the University of theFree State, South Africa, formerly with the University of FortHare, South Africa. He is a vibrant researcher and hasvarsity expertise in Agronomy, Soil Science and Hydrology.
References
Aguilera NH, Jackson ML. 1953. Iron oxide removal from soilsand clays. Soil Sci Soc Am Proc. 17:359–364.
Amezketa E, Aragues R, Carranza R, Urgel B. 2003. Chemical,spontaneous and mechanical dispersion of clays in arid-zone soils. Span J Agric Res. 1:95–107.
Amezketa E, Aragues R, Gozol R. 2004. Infiltration of water indisturbed soil columns as affected by clay dispersion andaggregate slaking. Span J Agric Res. 2:459–471.
Available from: http://www.treepower.org/soils/soilorganicmatter.html. [cited 2016 Jul 7]: 6.12PM
Bann GR, Field J. 2010. Dryland Salinity on the uplands ofsouthern Australia: a top-down soil degradation process, ora bottom-up deep hydrology (groundwater) process? In:Gilkes RJ, Prakongkep N, editors. World Congr. Soil Sci.Brisbane: Conference organizing committee; p. 17–20.
Brady CN, Weil RR. 2002. The nature and properties of soils.13th ed. Upper Saddle River (NJ): Prentice Hall.
Bridges EM, Oldeman LR. 1999. Global assessment of human-induced soil degradation. Arid Soil Res Reh. 13:319–325.
Cai Q, Zhu Y, Wang S. 2004. Research on processes and factorsof rill erosion. Adv Water Sci. 15:12–18.
Chan KY, Bowman A, Oates A. 2001. Oxidizable organiccarbon fractions and soil quality changes in an oxicPaleustalf under different pasture ley. Soil Sci. 166:61–67.
Dimoyiannis D, Valmis S, Danalatos NG. 2006. Interrill erosionon cultivated Greek soils: modelling sediment delivery.Earth Surf Process Landf. 31:940–949.
Donstova KM, Norton LD. 2002. Clay dispersion, infiltrationand erosion as influenced by exchangeable Ca and Mg.Soil Sci Am J. 167:184–193.
DWA (Department of Water Affairs). 2011. Budget votespeech for the Departments of Water and EnvironmentalAffairs by the Minister of Water and EnvironmentalAffairs, Minister BEE Molewa, in the National Council ofProvinces (NCOP) on 23 June 2011. Pretoria: Departmentof Water Affairs.
DWA (Department of Water Affairs). 2013. Feasibility study:Mzimvubu Water Project. Newsletter 1, August.
Ekwue EI. 1990. Organic-matter effects on soil strength prop-erties. Soil Tillage Res. 16:289–297.
Elliot ET. 1986. Aggregate structure and carbon, nitrogen, andphosphorus in native and cultivated soils. Soil Sci Soc Am J.50:627–633.
Ezeabasili ACC, Okoro BU, Emengini EJ. 2014. Relative erod-ibility of some soils from Anambra basin. Sky J Soil SciEnviron Manage. 3:083–090.
Fey M, Gilkes R. 2010. A short guide to the soils of SouthAfrica, their distribution and correlation with WorldReference Base soil groups. Proceedings. 32–35. [cited2014 Nov 12]. Available from: http://www.ldd.go.th/swcst/Report/soil/symposium/pdf/2503.pdf
Greenland DJ, Rimmer D, Payne D. 1975. Determination of thestructural stability class of English & Welsh soils, using awater coherence test. J Soil Sci. 26:294–303.
Hillel D. 2004. Introduction to environmental soil physics.Amsterdam: Elsevier Academic Press; p 494. Availablefrom: http://www.dpi.nsw.gov.au
Igwe CA. 2003. Erodibility of soils of the upper rainforest zone,Southeastern Nigeria. Land Degrad Dev. 14:323–334.
Igwe CA. 2005. Erodibility in relation to water-dispersible clayfor some soils of eastern Nigeria. Land Degr Dev. 16:87–96.
Igwe CA, Agbatah C. 2008. Clay and silt dispersion in relationto some physicochemical properties of derived savannasoils under two tillage management practices in southeast-ern Nigeria. Acta Agric Scand, B. 58:17–26.
Igwe CA, Akimigbo FOR, Mbagwu JSC. 1995. The use of somesoil aggregate indices to assess potential soil loss in soils ofsoutheastern Nigeria. Inter Agrophy. 9:95–100.
Igwe CA, Akamigbo FOR, Mbagwu DSC. 1999. Chemical andmineralogical properties of soils in southeastern Nigeriain relation to aggregate stability. Geoderma. 92:111–123.
Igwe CA, Udegbunam ON. 2008. Soil properties influencingwater-dispersible clay and silt in an Ultisol in southernNigeria. Inter Agrophy. 22:319–325.
Kemper WD, Koche EJ. 1966. Aggregate stability of Soils fromWestern United States and Canada. USDA Technical Report1355, Washington DC.
King JA, Evans EJ. 1986. The growth of spring barley related tosoil tilth produced on restoration opencast and unminedland. Soil Tillage Res. 86:73–83.
Laker MC. 2004. Advances in soil erosion, soil conservation,land suitability evaluation and land use planning researchin South Africa. South Afr J Plant Soil. 21:345–368.
Le Bissonnais Y. 1996. Aggregate stability and assessment ofsoil crustability and erodibility. 1. Theory andMethodology. Euro J Soil Sci. 47:425–437.
Le Roux JJ, Morgenthal TL, Summer PD, Pretorious DJ. 2008.Water erosion prediction at national scale for SouthAfrica. Water SA. 34:305–314.
Li J, Cai Q, Sun L. 2010. Reviewing on factors and thresholdconditions of rill erosion. Prog In Geo. 29:1319–1325.
Lu H, Prosser IP, Moran CJ, Gallant JC, Prestley G, StevensonJG. 2003. Predicting sheetwash and rill erosion over theAustralian continent. Austr J Soil Res. 41:1037–1062.
Martin C, Pohl M, Alewell C, Korner C, Rixen C. 2010. Interrillerosion at disturbed alpine sites: effects of plant functionaldiversity and vegetation cover. Basic Appl Ecol. 11:619–626.
Middleton HE. 1930. Properties of soil which influence soilerosion. USDA Tech Bull No. 178. Washington, DC: UnitedState Department of Agriculture.
Mucina L, Rutherford MC. 2006. The vegetation of SouthAfrica, Lesotho and Swaziland. Strelitzia 19. Pretoria,South Africa: South Africa National Biodiversity Institute.
Ojo FO. 2000. Soil physical characteristics and Gully Erosion[Unpublished B.Sc. Thesis] Department of Geography,A.B.U. Zaria.
Okalebo JB, Gathua K, Woomer PL. 2000. Laboratory methodsof soil and plant analysis: a working manual. TSBF-KARI-UNESCO, Nairobi, Kenya.
Parfitt RL, Parshotam A, Salt GJ. 2002. Carbon turnover in twosoils with contrasting mineralogy under long-term maizeand pasture. Aust J Soil Res. 40:127–136.
Parwada C, Van Tol J. 2016. The nature of soil erosion andpossible conservation strategies in Ntabelanga area,Eastern Cape Province, South Africa. Acta Agr Sca,
ACTA AGRICULTURAE SCANDINAVICA, SECTION B — SOIL & PLANT SCIENCE 9
Section B- Soil & Plant Sci Process and Its InfluencingFactors. Chin Geogra Sci. 23(4):389–402.
Rawls WJ, Brakensiek DL, Miller N. 1983. Green-Ampt in-filtration parameters from soil data. ASCE J Hyd Engr.109:62–70.
Reinks SM, Botha GA, Hughes JC. 2000. Some physical andchemical properties of sediments exposed in a gully(donga) in northern Kwazulu-Natal, South Africa and theirrelationship to the erodibility of the colluvial layers.Catena. 39:11–31.
Renard KG, Foster GR, Weesies GA, McCool DK, Yoder DC.1997. Predicting soil erosion by water. A guide to conserva-tion planning with the Revised Universal Soil Loss Equation(RUSLE). Agricultural Handbook No. 703. Washington DC:U.S. Department of Agriculture, 384 pp.
Singer A. 1994. Clay mineralogy as affecting dispersivity andcrust formation in Aridisols. In ‘Transactions of 15th worldcongress of soil science. Acapulco, Mexico’ (Ed. J.D.Etchevers.), 8a: 37–46. (International Society of SoilScience, Mexican Society of Soil Science: Mexico).
So HB, Cook GD. 1993. The effects of slaking and dispersion onthe hydraulic conductivity of clay soils. Catena Supl. 24:55–64.
Soil classification. A taxonomic system for South Africa. 1991.A Report on a Research Project Conducted under theAuspices of the Soil and Irrigation Research Institute.Department of Agricultural Development Pretoria. Pages20, 80, 138, 150, 166 and 184.
Sonneveld MPW, Everson TM, Veldkamp A. 2005. Multi-scaleanalysis of soil erosion dynamics in KwaZulu-Natal, SouthAfrica. Land Degrad Dev. 16:287–301.
Sun L, Fang H, Qi D, Li J, Cai Q. 2013. A Review on Rill ErosionSonneveld MPW, Everson TM, Veldkamp, A. (2005). Multi-scale analysis of soil erosion dynamics in KwaZulu-Natal,South Africa. Land Degrad Dev. 16:287–301.
Thomas GW. 1982. Exchangeable Cations. In: Page AL, MillerRH, Keeney DR, editors. Methods of soil analysis. Part2. Chemical and Microbiological Properties. Madison (WI):Soil Science Society of America; p. 167–180.
Toy JT, George RF, Kenneth GR. 2002. Soil erosion. New York(NY): Wiley.
Van Huyssteen E, Meiklejohn C, Coetzee M, Goss H, Oranje M.2010. An overview of South Africa’s metropolitan areas-dualistic, dynamic and under threat & hellip. Eur SpatialRes Policy. 17:23–40.
Van Rensburg LD. 2008. Advances in soil physics: Applicationin irrigation and dry land crop production. South Afr J PlantSoil. 27:9–18.
Van Tol JJ, Akpan W, Lange D, Bokuva C, Kanuka G, Ngesi S,Rowntree KM, Bradely G, Maroyi A. 2014. Conceptualisinglong term monitoring to capture environmental, agricul-tural and socio-economic impacts of the Mzimvubuwater project in the Tsitsa River. Report to the WaterResearch Commission South Africa.
Vrieling A. 2006. Satellite remote sensing for water erosionassessment: a review. Catena. 65:2–18.
Wakindiki IIC, Ben-Hur M. 2002. Soil mineralogy and textureeffects on crust micromorphology, infiltration anderosion. Soil Sci Am J. 66:897–905.
Wischmeier W, Smith D. 1978. Predicting rainfall erosionlosses: a guide to conservation planning. AgriculturalHandbook No. 537. Washington (DC): U.S. Department ofAgriculture.
Wischmeier WH, Johnson CB, Cross BV. 1971. A soil erodibilitynomograph for farmland and construction sites. Soil WaterConser. 26:189–193.
Yan FL, Shi ZH and Li ZX. 2010. Wetting rate and clay contenteffects on interrill erosion in Utisols of Southeastern China.Pedo. 20:129–136.
10 C. PARWADA AND J. VAN TOL
View publication statsView publication stats