Soil moisture retrieval using ALOS PALSAR - Earth...
31
Soil moisture retrieval using ALOS PALSAR T. J. Jackson, R. Bindlish and M. Cosh USDA ARS Hydrology and Remote Sensing Lab, Beltsville, MD J. Shi University of California Santa Barbara, CA November 6, 2008
Transcript of Soil moisture retrieval using ALOS PALSAR - Earth...

Soil moisture retrieval using ALOS PALSAR
T. J. Jackson, R. Bindlish and M. CoshUSDA ARS Hydrology and Remote Sensing Lab, Beltsville, MD
J. ShiUniversity of California Santa Barbara, CA
November 6, 2008

Project Background • Radar remote sensing provides very high
spatial resolution data that can be used to estimate soil moisture.
• Robust retrieval methods have not been developed.
• Limitations of previous satellites systems have been the wavelength and the number of independent radar parameters.
• ALOS PALSAR includes a low frequency and multiple polarizations that may lead to improved soil moisture retrievals.
• Scaling from PALSAR to SMAP

Outline• Soil Moisture Active Passive (SMAP) Mission
– Mission description– Role of PALSAR
• Cloud Land Surface Interaction Campaign (CLASIC)– PALS/PALSAR– Soil moisture retrieval
• SMAP Validation Experiment 2008 (SMAPVEX08)

Soil Moisture Active Passive (SMAP) Satellite

Soil Moisture Active Passive Mission (SMAP)
• NASA• One of the first missions
resulting from the NRC Decadal Survey
• L-band: microwave radar (1-3 km), microwave radiometer (40 km)– 40 degrees incidence angle– Polarimetric
• Three day global coverage
• Launch 2013

SMAP Mission Concept• Radiometers and radars each have
advantages and disadvantages for soil moisture. – Limited spatial resolution of the radiometer
and the robustness of the radar algorithms
• SMAP will attempt to overcome these with:– A technology that provides a large aperture
low mass/volume antenna (deployable mesh) – Enhanced resolution by combining high
accuracy radiometer retrieval with high resolution radar (10 km product)

SMAP Science and Applications
1. Ecosystem Response (Variability and Change)2. Agricultural and Ecosystem Productivity3. Wild-Fires4. Mineral Dust Production
Land-Use, Ecosystems, and Biodiversity
1. Heat Stress and Drought2. Vector-Borne and Water-Borne Infectious DiseaseHuman Health and Security
1. Longer-Term and More Reliable Atmospheric ForecastsClimate / Weather
1. Floods and Drought Forecasts2. Available Water Resources Assessment3. Link Terrestrial Water, Energy and Carbon Cycles
Water Resources and Hydrological Cycle
Cited SMAP ApplicationsDecadal Survey Panels
• Societal benefit and applications will impact mission development and implementation
• Applications that utilize SMAP (and SMOS) observations will be of great interest to NASA and supported under a variety of programs
*Material from SMAP Science Team

SMAP Status
• NRC Decadal Survey Report (Jan. 2007)• NASA prioritization (Feb. 2008)• SMAP Project and Program (March 2008)• Science Team Selected (October 2008)• Launch 2013

SMAP Synergy With Other Missions/Applications
• A great decade for low frequency microwave remote sensing!• SMAP provides continuity for L-band measurements of
ALOS, SMOS, and Aquarius, and synergy with GPM and GCOM-W
0
0.2
0.4
0.6
0.8
1
1.2
2006 2008 2010 2012 2014 2016 2018 2020
SMAPGPM
GCOM-WAquarius
SMOSALOS
Estimated Mission Timeline
*Material from SMAP Science Team
100 km 10 km 1 km
Day
Week
Month ALOSSAR
Aquarius
SMOS SMAP Radar-Radiometer
ClimateClimate ApplicationsApplications
Weather ApplicationsWeather Applications
CarbonCarbon CycleCycleApplicationsApplications
Resolved Spatial Scales
Res
olve
d T
empo
ral S
cale
s
Radiom
eter
RadarEvolution of L-Band Sensing
Evolution of L-Band Remote Sensing
*Material from SMAP Science Team

Relevant Issues (PALSAR/SMAP)• RFI information for design• Data resource for algorithm design and
validation. – How do high resolution SAR data (PALSAR)
scale to 1-3 km (SMAP)? Can we use PALSAR to simulate SMAP radar?
• Field experiments with SMAP simulator and concurrent PALSAR coverage. (challenge)– CLASIC– SMAPVEX08
CLASIC • June 2007 Southern Great Plains
Oklahoma (included the LW)• Intensive ground sampling of soil
moisture over a one month period • Aircraft coverage with the Passive Active
L-band System (PALS) (SMAP Simulator)
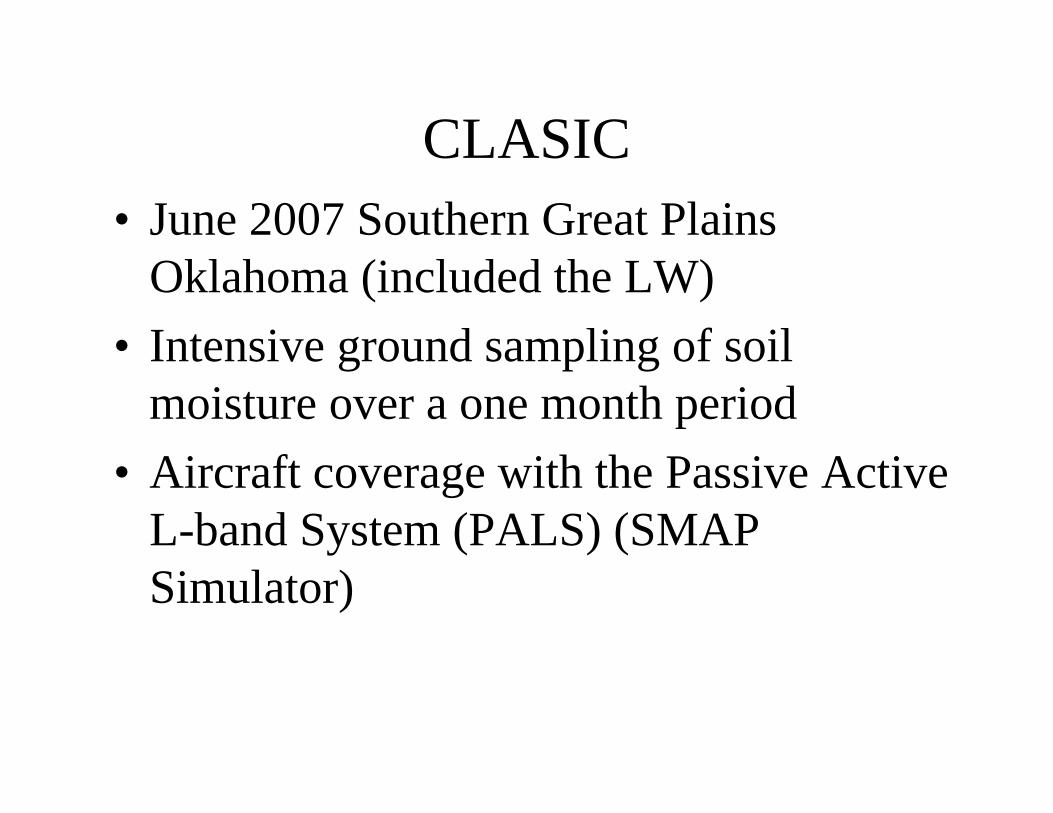
Single beam
Fixed angle (40 degrees)
Spatial resolutions ~ 0.3(Altitude)
First deployment of new antenna

PALS Experiment Design over the Little Washita Watershed
• 8 lines in east-west direction
• Spatial resolution ~400 m
• 11 flights• Predominantly
pasture and dry winter wheat

9ALOS FS
8LW
76FC, LW
543
1615141312FC, LW
11LW
10FS
23FC
22212019FC, LW
1817
302928272625FC
24FC, CF
7LW
6FC, LW
5FC, LW
4LW
3FC, LW
21FC, LW ALOS LW
CLASIC Radar Coverage June-July 2007
Legend: Blue=PALS, Green=ALOS and PALS
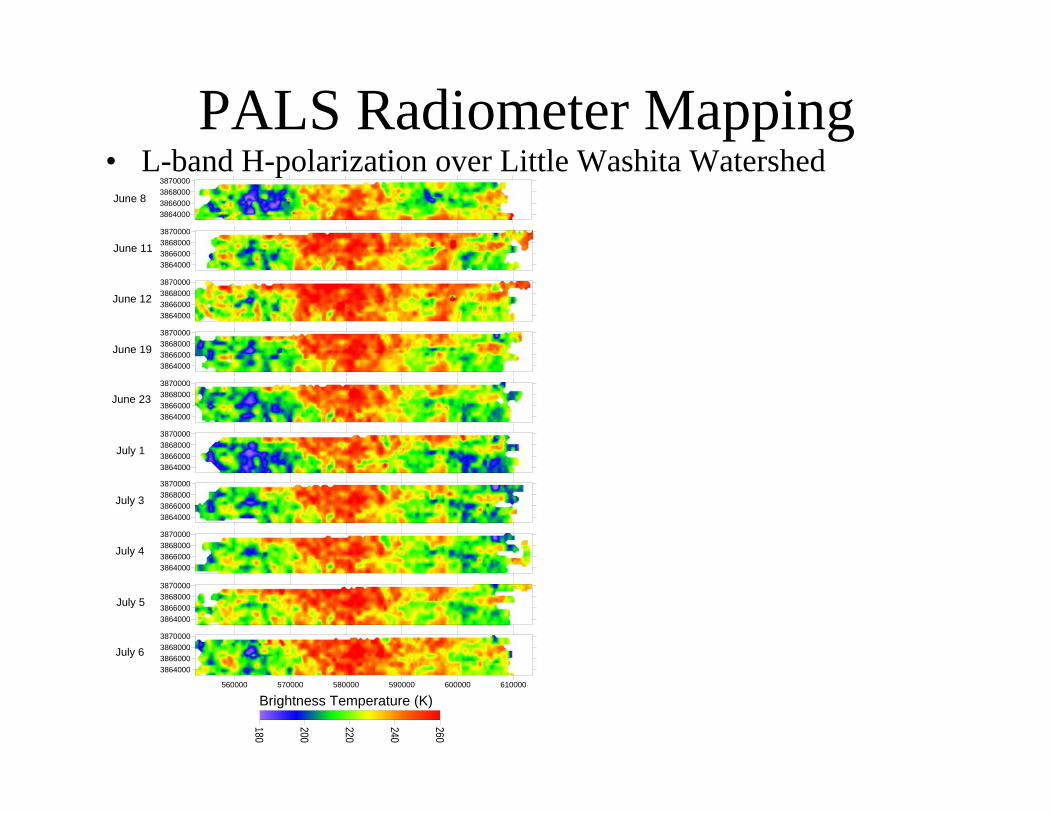
PALS Radiometer Mapping• L-band H-polarization over Little Washita Watershed
3864000386600038680003870000
June 8
180
200
220
240
260
3864000386600038680003870000
June 11
3864000386600038680003870000
June 12
3864000386600038680003870000
June 19
3864000386600038680003870000
June 23
3864000386600038680003870000
July 1
3864000386600038680003870000
July 3
3864000386600038680003870000
July 4
3864000386600038680003870000
July 5
560000 570000 580000 590000 600000 610000
3864000386600038680003870000
July 6
Brightness Temperature (K)

PALS Radiometer and Radar Mapping• L-band H-polarization and HH over Little Washita Watershed
3864000386600038680003870000
June 8
180
200
220
240
260
3864000386600038680003870000
June 11
3864000386600038680003870000
June 12
3864000386600038680003870000
June 19
3864000386600038680003870000
June 23
3864000386600038680003870000
July 1
3864000386600038680003870000
July 3
3864000386600038680003870000
July 4
3864000386600038680003870000
July 5
560000 570000 580000 590000 600000 610000
3864000386600038680003870000
July 6
Brightness Temperature (K)
3864000386600038680003870000
-20
-18
-16
-14
-12
-10
June 8
3864000386600038680003870000
June 11
3864000386600038680003870000
June 19
June 23
3864000386600038680003870000
July 1
Backscatter Coefficient
3864000386600038680003870000
July 3
3864000386600038680003870000
July 4
3864000386600038680003870000
July 5
3864000386600038680003870000
July 6
560000 570000 580000 590000 600000 610000
3864000386600038680003870000
July 7
June 123864000386600038680003870000
3864000386600038680003870000

PALSAR FBD– Little Washita July 1, 2007
hh=r,b hv=g70 kmSwath
34.3 deg
Incidence Angle
HH+HV
Polarization
14 MHz
Bandwidth
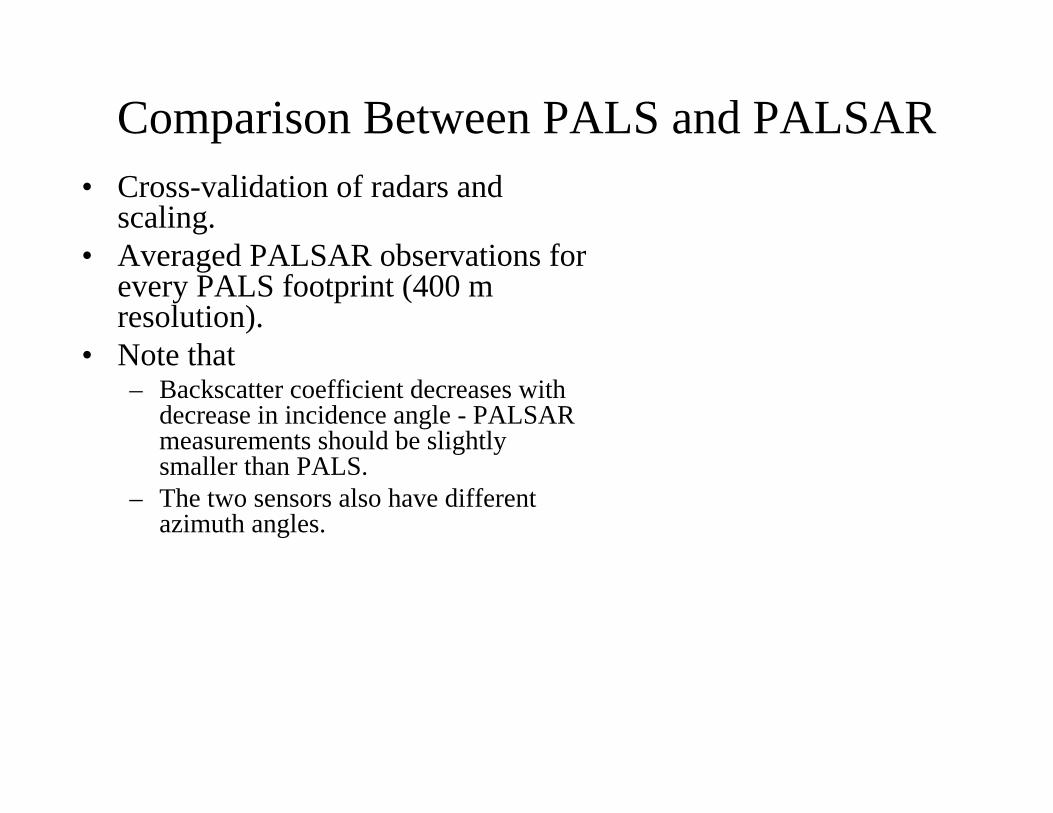
Comparison Between PALS and PALSAR• Cross-validation of radars and
scaling.• Averaged PALSAR observations for
every PALS footprint (400 m resolution).
• Note that– Backscatter coefficient decreases with
decrease in incidence angle - PALSAR measurements should be slightly smaller than PALS.
– The two sensors also have different azimuth angles.
-35
-30
-25
-20
-15
-10
-5
0-35 -30 -25 -20 -15 -10 -5 0
PALSAR Sigma0
PAL
S S
igm
a0
HH (SEE=1.80)
HV (SEE=1.91)
• Some of the scatter can be attributed to the sub-pixel variability and noise. Resolution : PALSAR (12.5 m), PALS (400 m).
• Good agreement between the two sensors without significant bias indicates comparative calibration and possibly linear scaling.
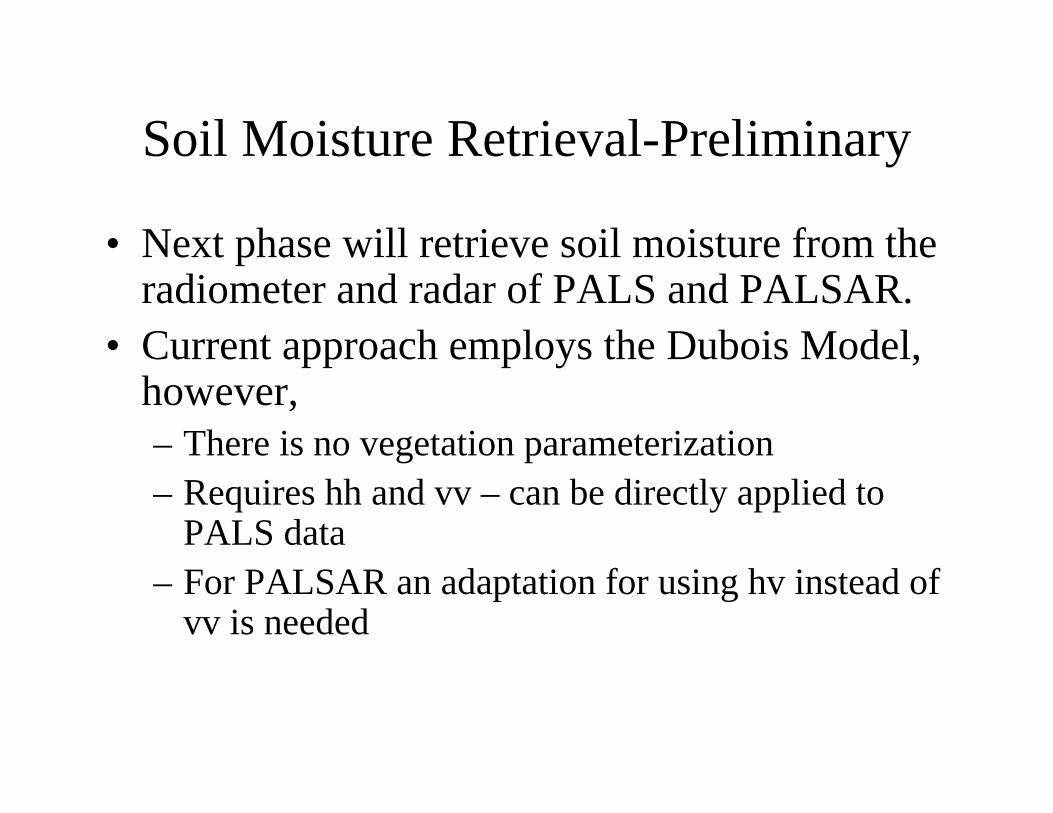
Soil Moisture Retrieval-Preliminary
• Next phase will retrieve soil moisture from the radiometer and radar of PALS and PALSAR.
• Current approach employs the Dubois Model, however, – There is no vegetation parameterization– Requires hh and vv – can be directly applied to
PALS data– For PALSAR an adaptation for using hv instead of
vv is needed

SMAP Validation Experiment 2008(SMAPVEX08)
• Support for SMAP science issues• Primary study area will be the Delmarva
peninsula (Choptank Watershed).• Multiple flights over a two week period (Sept.
29-Oct. 13, 2008)• Two aircraft; four sensors• Spatial resolutions of 1 and 3 km (more typical
of SMAP than in CLASIC)

SMAPVEX08 Choptank Site
100 km

SMAP Validation Experiment 2008(SMAPVEX08)
• Support for SMAP science issues• Primary study area will be the Delmarva
peninsula (Choptank Watershed). • Multiple flights over a two week period (Sept.
29-Oct. 13, 2008)• Two aircraft; four sensors• Spatial resolutions of 1 and 3 km (more typical
of SMAP than in CLASIC)
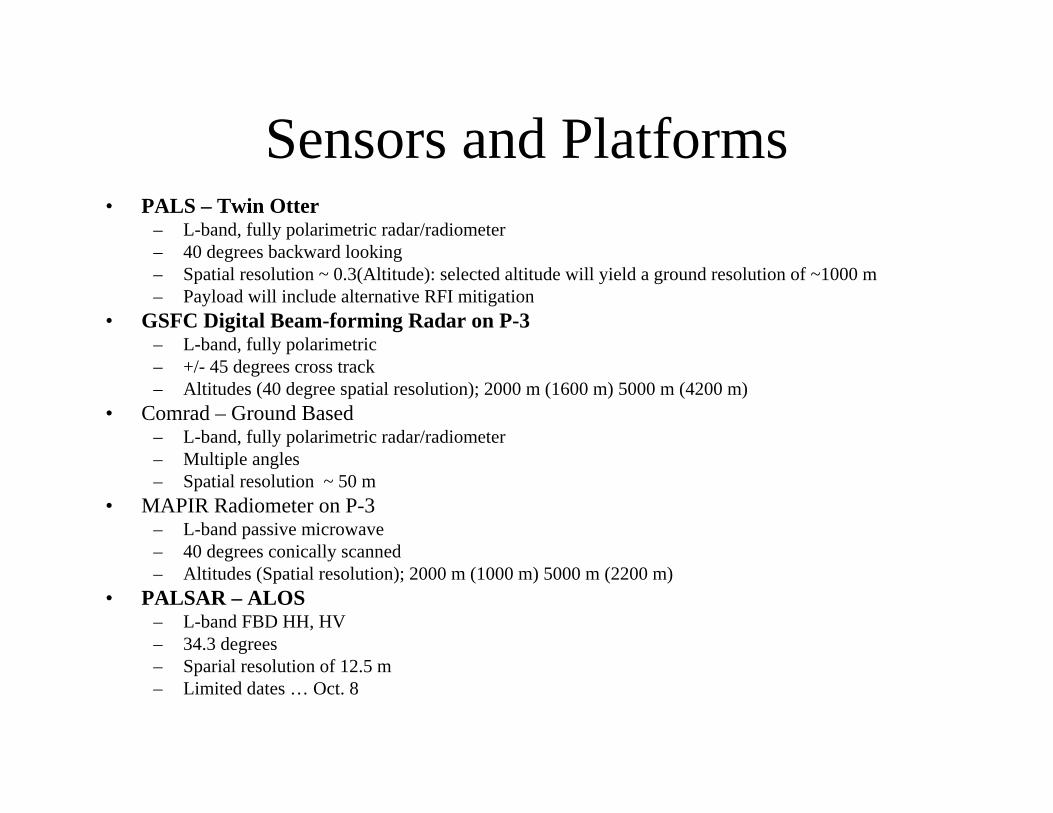
Sensors and Platforms• PALS – Twin Otter
– L-band, fully polarimetric radar/radiometer– 40 degrees backward looking– Spatial resolution ~ 0.3(Altitude): selected altitude will yield a ground resolution of ~1000 m– Payload will include alternative RFI mitigation
• GSFC Digital Beam-forming Radar on P-3– L-band, fully polarimetric– +/- 45 degrees cross track– Altitudes (40 degree spatial resolution); 2000 m (1600 m) 5000 m (4200 m)
• Comrad – Ground Based– L-band, fully polarimetric radar/radiometer– Multiple angles– Spatial resolution ~ 50 m
• MAPIR Radiometer on P-3– L-band passive microwave– 40 degrees conically scanned– Altitudes (Spatial resolution); 2000 m (1000 m) 5000 m (2200 m)
• PALSAR – ALOS– L-band FBD HH, HV– 34.3 degrees– Sparial resolution of 12.5 m– Limited dates … Oct. 8

SMAPVEX08
PALS and COMRAD

Sensors and Platforms• PALS – Twin Otter
– L-band, fully polarimetric radar/radiometer– 40 degrees backward looking– Spatial resolution ~ 0.3(Altitude): selected altitude will yield a ground resolution of ~1000 m– Payload will include alternative RFI mitigation
• GSFC Digital Beam-forming Radar on P-3– L-band, fully polarimetric– +/- 45 degrees cross track– Altitudes (40 degree spatial resolution); 2000 m (1600 m) 5000 m (4200 m)
• Comrad – Ground Based– L-band, fully polarimetric radar/radiometer– Multiple angles– Spatial resolution ~ 50 m
• MAPIR Radiometer on P-3– L-band passive microwave– 40 degrees conically scanned– Altitudes (Spatial resolution); 2000 m (1000 m) 5000 m (2200 m)
• PALSAR – ALOS– L-band FBD HH, HV– 34.3 degrees– Sparial resolution of 12.5 m– Limited dates … Oct. 8
PALSAR 34.3o
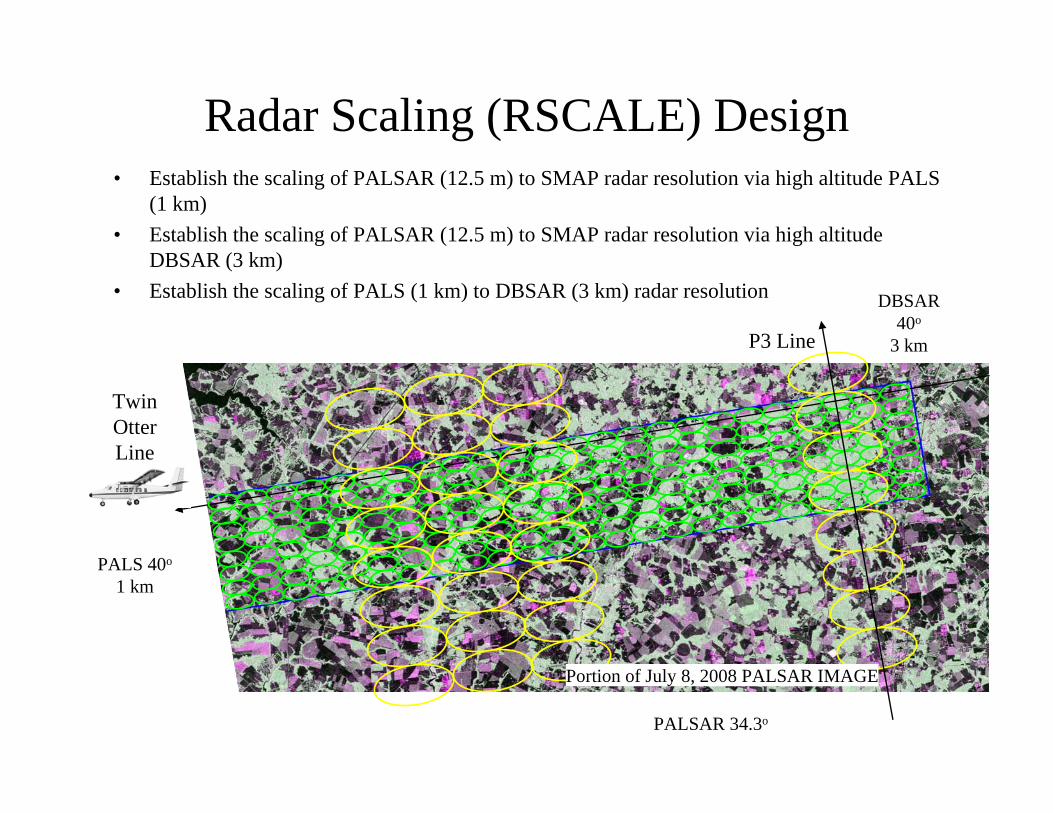
Radar Scaling (RSCALE) Design
P3 Line
TO Line
Portion of July 8, 2008 PALSAR IMAGE
PALS 40o
1 km
Twin Otter Line
DBSAR 40o
3 km
• Establish the scaling of PALSAR (12.5 m) to SMAP radar resolution via high altitude PALS (1 km)
• Establish the scaling of PALSAR (12.5 m) to SMAP radar resolution via high altitude DBSAR (3 km)
• Establish the scaling of PALS (1 km) to DBSAR (3 km) radar resolution
May 23, 2008
July 8, 2008
Aug 23, 2008
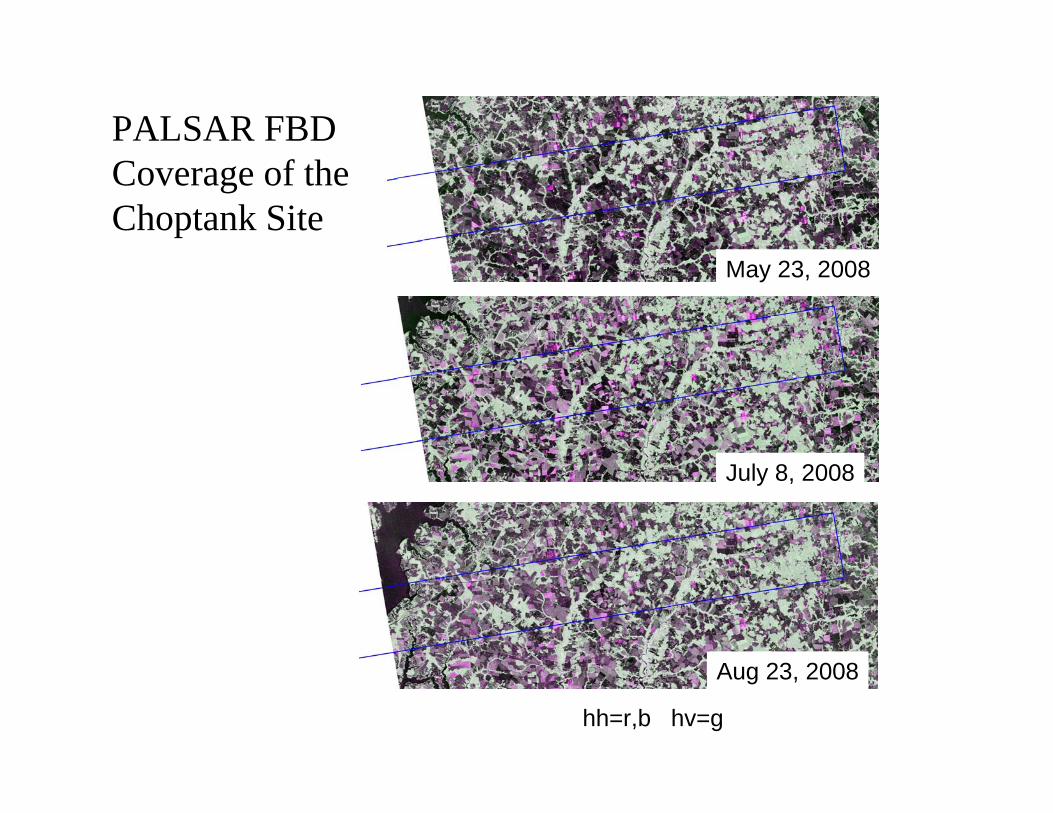
PALSAR FBD Coverage of the Choptank Site
hh=r,b hv=g
PALSAR FBD Coverage of the Choptank Site
• October 8 data acquisition was cancelled due to a re-tasking a few days before. Our request was the default mode for this cycle.
• No “disaster” we could identify.• We only found out by checking acquisition
planning schedule … never contacted.• Asked for a reversal…...• There is a need for improvement in the
communications and prioritization.• Future plans.

SMAP Major Field Campaignsver. 10/08
SMAPVEX082008
2015
SMAPVEX142014
SMAPVEX13SMAP2013
GCOM-W2012
SMAPVEX112011
EuropeSMAPVEX10
AquariusAustralia
SMAPVEX10Australia
2010
AustraliaAustraliaEurope/Canada
SMOS2009
4321Year/Quarter
• SMAPVEX08– High priority design/algorithm issues
• Australia 2009-2010– 4 one-week campaigns to span four
seasons– Aircraft Radar/Radiometer– Separate SMOS validation
• Europe 2009-2010 (and Canada)– SMOS validation…launch delays
possible– No radar
• SMAPVEX10:CLASIC– Spring-Summer 2010– Oklahoma– SMOS and Aquarius available– Focus of algorithm validation
• SMAPVEX11– Focus on different problems; FT,
regions, seasons• SMAPVEX13 and 14
– SMAP product validationSatellite Launch in Red