Soil method performance asbestos eia annapolis 2011 09 16
129
Ed Cahill National Director Asbestos Lab Services [email protected] EMSL Analytical, Inc. 200 Route 130 North, Cinnaminson, NJ 08108 856-303-2565 www.emsl.com
Transcript of Soil method performance asbestos eia annapolis 2011 09 16

Ed Cahill
National Director Asbestos Lab Services
EMSL Analytical, Inc.
200 Route 130 North, Cinnaminson, NJ 08108
856-303-2565 www.emsl.com

Asbestos in Soil

Soil is a Great Hiding Place
1% Unconsolidated Chrysotile
1% Consolidated Chrysotile
3
Copyright 2011 EMSL Analytical, Inc.

Soil is a Great Hiding Place for Asbestos
1% asbestos
4
Copyright 2011 EMSL Analytical, Inc.

Asbestos
Contamination
Sources of Asbestos in Soil
Natural Occurrences
of Asbestos (NOA) Copyright 2011 EMSL Analytical, Inc.
5

Asbestos Contamination
Copyright 2011 EMSL Analytical, Inc.
6

7
Copyright 2011 EMSL Analytical, Inc.

8
Copyright 2011 EMSL Analytical, Inc.

9
Copyright 2011 EMSL Analytical, Inc.

Natural Occurrences of Asbestos (NOA)
Copyright 2011 EMSL Analytical, Inc.
10

Staten Island Serpentinite
Copyright 2011 EMSL Analytical, Inc.
I 278 road cut. Up to 50% Chrysotile
Picture and info: Brooklyn CUNY.edu
Why is Soil so Hard to Analyze?
Copyright 2011 EMSL Analytical, Inc.
12

Why is Soil so Hard to Analyze?
Non-Homogeneity
Grain size
Copyright 2011 EMSL Analytical, Inc.
13
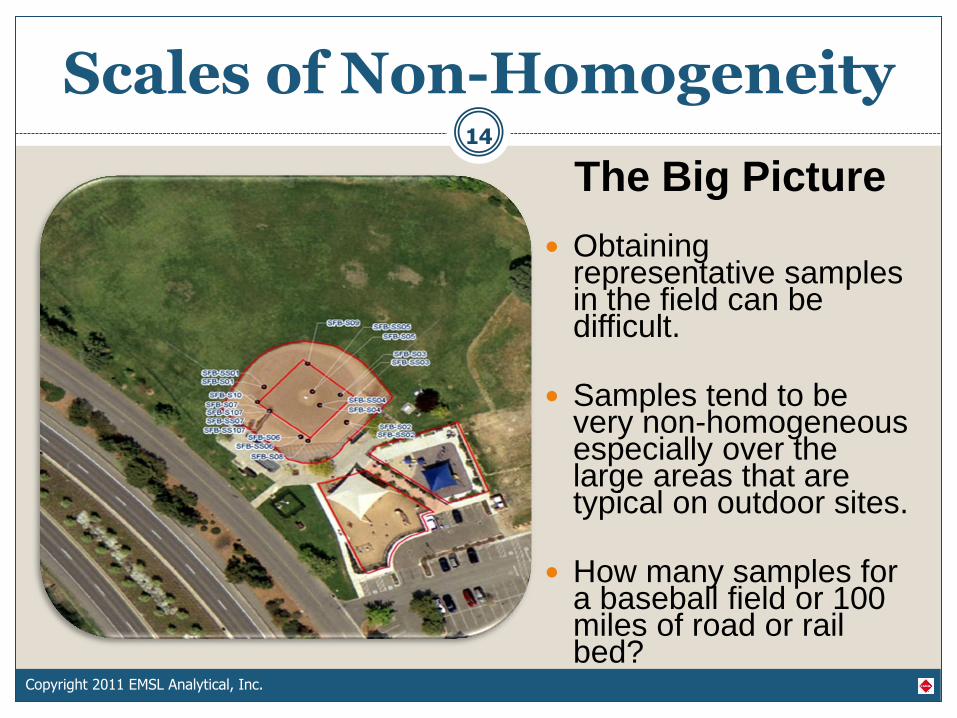
Scales of Non-Homogeneity
The Big Picture
Obtaining representative samples in the field can be difficult.
Samples tend to be very non-homogeneous especially over the large areas that are typical on outdoor sites.
How many samples for a baseball field or 100 miles of road or rail bed?
Copyright 2011 EMSL Analytical, Inc.
14

Scales on Non-Homogeneity
The Medium
Picture
How deep to go?
What layers to
include?
Copyright 2011 EMSL Analytical, Inc.
15
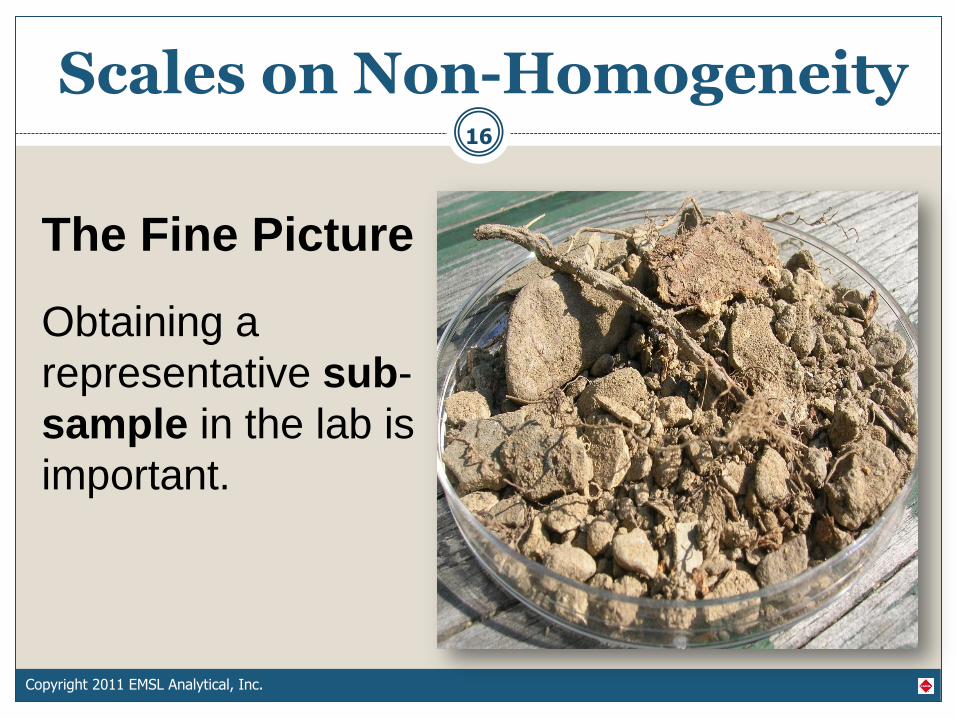
Scales on Non-Homogeneity
The Fine Picture
Obtaining a
representative sub-
sample in the lab is
important.
Copyright 2011 EMSL Analytical, Inc.
16

Scales on Non-Homogeneity
The presence of even sand sized quartz crystals are a problem.
The Very Fine Picture
stereoscopic view of play sand
Copyright 2011 EMSL Analytical, Inc.
17

In Summary
Soil is a problem matrix for field and lab personnel alike.
Careful sampling plans are needed to reduce inconsistencies, and help to carefully define …… “What is the sample?”
The Analytical method used needs to address potential non homogeneity and grain size
Copyright 2011 EMSL Analytical, Inc.
18

Analytical Choices What Method to Choose?
Copyright 2011 EMSL Analytical, Inc.
19

Limitations of “Standard” PLM
EPA PLM Method (EPA/600/R-93/116) Method for the Determination of Asbestos in Bulk Building Materials
• As the title suggests and the method explains, this is a method for relatively homogenous bulk building materials, not soil.
• The final version of this method is quite flexible though and matrix modification prior to analysis is described
Copyright 2011 EMSL Analytical, Inc.
20

Sieving Milling
Copyright 2011 EMSL Analytical, Inc.
Two Approaches to Soil

Scenario 1 - Contamination of Soil with ACM
The Main Sieve Methods Available
Copyright 2010 EMSL Analytical, Inc.
Some of the sieving Methods available
• EPA Region 1 Screening Protocol
“Protocol for Screening Soil and Sediment Samples for Asbestos Content” used by the EPA Region 1 Lab
- low tech screening method, semi-quantitative at best.
- been around since 1994, revised ’97 and ’99
- stereoscopic (20X mag) estimate of % Asbestos
• ASTM Sieve Method for Soil
Best option yet for sieving protocol for soil, yet to be published

Copyright 2011 EMSL Analytical, Inc.
The soil is sub-sampled (only particles < 16mm) Wet sieved through a 60 mesh (250 micron) sieve Only the >250 micron fraction is analyzed Stereoscope (20-40X) used to quantify, and PLM
used to identify Note: This is a screening method. Qualitative or Semi-Quantitative at best
EPA Region 1 Screening Protocol
Scenario 1 - Contamination of Soil with ACM
EPA Region 1 Protocol

Sample Size 250 cc or less
Sieve Stack
• 19 mm (3/4”)
• 2 mm
• 106 micron
DRAFT ASTM Sieve Method
Copyright 2011 EMSL Analytical, Inc.
24
Anything larger than 19 mm is not considered part of the sample

1) Sample is dried
2) Weighed
3) Dry Sieved (wet sieving is optional) on sieve shaker for 5 minutes
ASTM Sieve Method
Copyright 2011 EMSL Analytical, Inc.
25

ASTM Sieve Method
Coarse and Medium Fractions still too large for straight PLM
4) Weigh each fraction 5) Analyze each fraction
Copyright 2011 EMSL Analytical, Inc.
26
This is a common type of sample (mini clods))

ASTM Sieve Method
The fine fraction is
fine enough and
homogenous enough
for a PLM slide prep
and analysis
Copyright 2011 EMSL Analytical, Inc.
27

Wet or Dry? 28
Copyright 2011 EMSL Analytical, Inc.
Pros • Washes the suspect
ACM making for easier detection
• Breaks down matrix to its smallest components

Wet Sieving Can Be Better for Some Soils
29
Copyright 2011 EMSL Analytical, Inc.
Cons • More labor intensive • More time (drying) • Even more time and possible
fiber loss as fine fraction needs to be sedimented
• Water disposal an issue

“Typical” soil sample
on sieve stack
DRY Sieving on an Automatic sieve shaker
30
Copyright 2011 EMSL Analytical, Inc.
Comparison of Dry vs. Wet Sieving

Coarse, Medium and Fine Fractions 31
Copyright 2011 EMSL Analytical, Inc.
soil clods fail to make it through the 2mm sieve

Sieve Stack Coarse, Medium
32
Copyright 2011 EMSL Analytical, Inc.
Wet Sieving of Same Sample

The Same Sample ! 33
Copyright 2011 EMSL Analytical, Inc.
Coarse 86%
Medium 12%
Fine 1%
Dry Sieving
Coarse 34%
Medium 26%
Fine 40%
Wet Sieving

Dry vs. Wet Sieving 34
Copyright 2011 EMSL Analytical, Inc.
0.00
10.00
20.00
30.00
40.00
50.00
60.00
70.00
80.00
90.00
100.00
>2mm >106µm <106µm
DRY WET

HAND PICKING SUSPECT ACM
OUT OF COARSE AND MEDIUM FRACTIONS.
35
Copyright 2011 EMSL Analytical, Inc.
Visual and Stereomicroscopic Analysis

ASTM Analysis 36
Copyright 2011 EMSL Analytical, Inc.

THE ASBESTOS % FOR EACH TYPE OF ACM IS DETERMINED. THE PERCENT ASBESTOS IS EXTRAPOLATED TO THAT FRACTION, AND THEN TO THE ENTIRE SAMPLE.
37
Copyright 2011 EMSL Analytical, Inc.

If all three fractions are non detect by PLM then a
TEM analysis is performed.
Optional drop mount Qualitative only (detect/non
detect). This enable us to find asbestos that is not
visible by light microscopy
If drop mount is positive then
grav reduction followed by
Quantitative TEM analysis
Structures/µg
ASTM Sieve Method
Copyright 2011 EMSL Analytical, Inc.
38

TEM Quantitative Analysis
100 to 250 mg of the material from the fine fraction is gravimetrically reduced via muffle furnace and acid treatment.
Filtered onto a 0.2µm PC or 0.22µm MCE filter
TEM examination using a direct method consistent with Test Method D6281.
Results reported in Structures per microgram
Is that a useful number?
39
Copyright 2011 EMSL Analytical, Inc.

Sieving Milling
Copyright 2011 EMSL Analytical, Inc.
Two Approaches to Soil

Copyright 2011 EMSL Analytical, Inc.
The MILLING Approach
Disk pulverizer/plate grinder Cross Beater Mill Freezer mill Ball mill, etc.…….

Determination of Asbestos Content of Serpentine Aggregate
This is the current de facto standard for milling methods.
1. One pint (473cc) sample
2. milled to 200 mesh (74 microns)
3. PLM
CA Air Resources Board (CARB) Method 435
Copyright 2011 EMSL Analytical, Inc.
42

Milled to reduce the nominal particle size to 75 microns
The sample is dried in a drying oven and material >3/8” is removed by sieving
CARB 435 Method
Copyright 2011 EMSL Analytical, Inc.
43

CARB 435 After milling, the sample is analyzed by a PLM 400 or 1000 point count (0.25% or 0.1%)
Copyright 2011 EMSL Analytical, Inc.

Copyright 2011 EMSL Analytical, Inc.
Analyzed by TEM at 20,000X
TEM CARB Method

How Do They Compare?
Copyright 2011 EMSL Analytical, Inc.
46

Study Design
Test the performance of three common
methods for asbestos analysis of soil.
• Soil spiked at 0.1% and 1% by weight • Analysis by
1. “standard” EPA 600 R-93/116 2. ASTM Sieve Method 3. CARB Method 435
Copyright 2011 EMSL Analytical, Inc.
47

Phase I
Spiking with Unconsolidated Asbestos
Two chrysotile sources were used
1. The majority was chrysotile asbestos (Plastibest-20) from the Jeffrey mine in Canada. It was left over from an old ingestion study performed by NIEHS. Thanks Jim Millette!
2. Chrysotile from Salt River Canyon in Arizona (just south of Chrysotile, Arizona).
Copyright 2011 EMSL Analytical, Inc.
48

Phase 1
Unconsolidated Asbestos
Phase 2
Consolidated (ACM) Asbestos
49
Copyright 2011 EMSL Analytical, Inc.
The Big Plan

Asbestos Characterization
Copyright 2011 EMSL Analytical, Inc.
50

Asbestos Characterization
Copyright 2011 EMSL Analytical, Inc.
51
Fiber Size Data for Data Plastibest-20 – 100 fibers by TEM at 20K Mag
Fiber Length (microns)
0
2
4
6
8
10
12
14
16
18
Approx. 20% of fibers are optically visible (> 0.2 microns in width)

Asbestos Characterization
Copyright 2011 EMSL Analytical, Inc.
52
0
5
10
15
20
25
30
Fiber Size Data for Arizona Chrysotile – 100 fibers by TEM at 20K Mag
Fiber Length (microns)
Approx. 13% of fibers are optically visible (> 0.2 microns in width)

Spiking
Copyright 2011 EMSL Analytical, Inc.
53
• Seven Blanks
• Seven samples at 0.1%
• Seven samples at 1%
ASTM Sieve Method EPA 600 CARB Method 435
To eliminate the variability of possible non-homogeneity, no
sub-sampling was performed. 63 individual samples were
prepared.

Phase 1 Samples
Copyright 2011 EMSL Analytical, Inc.
54

Analyst Credentials 55
Copyright 2011 EMSL Analytical, Inc.
Samples submitted blindly to 6 separate
analysts at separate locations including
external labs.
• minimum 10 years experience PLM
• 2 have over 30 years exp.
• 2 attended McCrone PLM course
• 2 have BS Geology
• 1 MS Analytical mineralogy

56
Copyright 2011 EMSL Analytical, Inc.
Phase 1 EPA 600 Method Results

EPA 600 Results for Blanks Phase I
Copyright 2011 EMSL Analytical, Inc.
57
Analyst 1 Analyst 2 Analyst 3 Analyst 4 Analyst 5 Analyst 6
Sample Number
Asbestos % Actual Result
% Recovery Result
% Recovery Result
% Recovery Result
% Recovery Result
% Recovery Result
% Recovery
EPA 600 2 0.00 0 NA 0 NA 0 NA 0 NA 0 NA 0 NA
EPA 600 3 0.00 0 NA 0 NA 0 NA 0 NA trace NA 0 NA
EPA 600 9 0.00 0 NA 0 NA 0 NA 0 NA 0 NA 0 NA
EPA 600 13 0.00 0 NA 0 NA 0 NA 0 NA 0 NA 0 NA
EPA 600 16 0.00 0 NA 0 NA 0 NA 0 NA trace NA 0 NA
EPA 600 17 0.00 trace NA 0 NA 0 NA 0 NA 0 NA 0 NA
EPA 600 19 0.00 0 NA 0 NA 0 NA 0 NA 0 NA 0 NA

0
1
2
3
4
5
6
7
8
1 2 3 4 5 6 7Sample
Perc
ent
Asb
est
os
Copyright 2011 EMSL Analytical, Inc.
58
Each color represents an analyst
Overall Percent Recovery: 2063 % Overall (pooled) RSD: 0.51
EPA 600 Results at 0.1% Phase I

Sample
Perc
ent
Asb
est
os
Copyright 2011 EMSL Analytical, Inc.
59
0
5
10
15
20
25
30
1 2 3 4 5 6 7
Overall Percent Recovery: 835 % Overall (Pooled) RSD: 0.56
EPA 600 Results at 1% Phase I

EPA 600 Summary Phase I
60
Copyright 2011 EMSL Analytical, Inc.
Overall (Pooled) Percent Recovery : 1574 %
Overall (Pooled) RSD : 0.54

ASTM Sieve Method Results
Copyright 2011 EMSL Analytical, Inc.
61
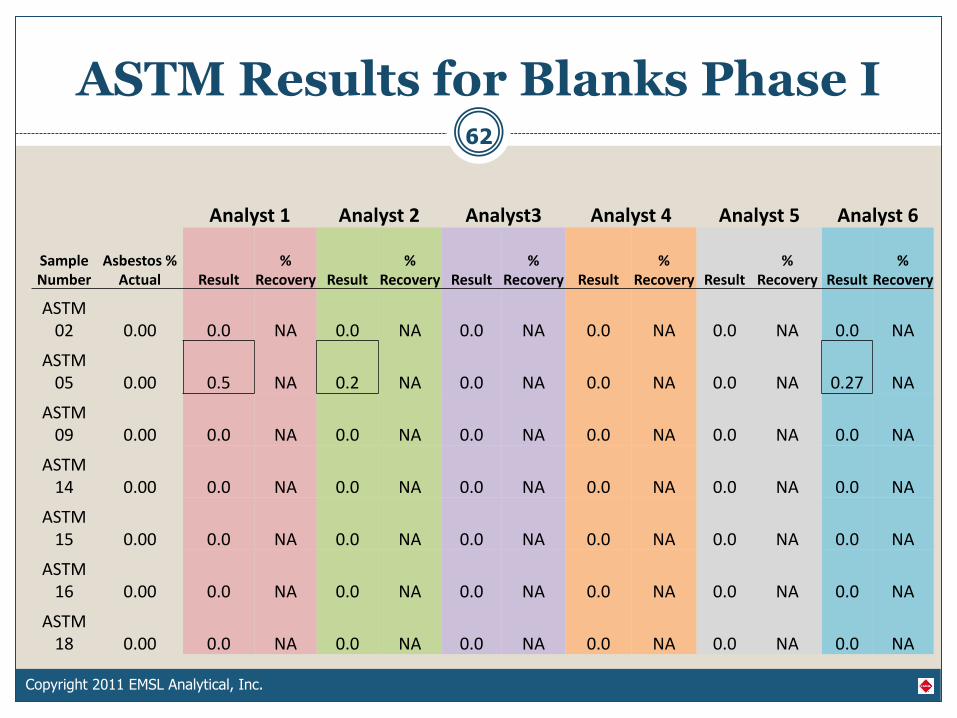
ASTM Results for Blanks Phase I
Copyright 2011 EMSL Analytical, Inc.
62
Analyst 1 Analyst 2 Analyst3 Analyst 4 Analyst 5 Analyst 6
Sample Number
Asbestos % Actual Result
% Recovery Result
% Recovery Result
% Recovery Result
% Recovery Result
% Recovery Result
% Recovery
ASTM 02 0.00 0.0 NA 0.0 NA 0.0 NA 0.0 NA 0.0 NA 0.0 NA
ASTM 05 0.00 0.5 NA 0.2 NA 0.0 NA 0.0 NA 0.0 NA 0.27 NA
ASTM 09 0.00 0.0 NA 0.0 NA 0.0 NA 0.0 NA 0.0 NA 0.0 NA
ASTM 14 0.00 0.0 NA 0.0 NA 0.0 NA 0.0 NA 0.0 NA 0.0 NA
ASTM 15 0.00 0.0 NA 0.0 NA 0.0 NA 0.0 NA 0.0 NA 0.0 NA
ASTM 16 0.00 0.0 NA 0.0 NA 0.0 NA 0.0 NA 0.0 NA 0.0 NA
ASTM 18 0.00 0.0 NA 0.0 NA 0.0 NA 0.0 NA 0.0 NA 0.0 NA

63
Copyright 2011 EMSL Analytical, Inc.
TEM Drop
Mount
Analyst 1
PLM Results TEM Results
Label # Analyst 1 True % Drop Mount Detect/Non
Detect
ASTM 02 0.00 0.0 ND
ASTM 05 0.50 0.0 ND
ASTM 09 0.00 0.0 ND
ASTM 14 0.00 0.0 ND
ASTM 15 0.00 0.0 ND
ASTM 16 0.00 0.0 ND
ASTM 18 0.00 0.0 ND
ASTM 01 2.46 0.1 Detect
ASTM 03 2.75 0.1 Detect
ASTM 04 1.67 0.1 Detect
ASTM 07 2.44 0.1 Detect
ASTM 13 2.25 0.1 Detect
ASTM 17 4.74 0.1 Detect
ASTM 18 3.96 0.1 Detect
ASTM 06 8.65 1.0 Detect
ASTM 07 7.52 1.0 Detect
ASTM 11 7.57 1.0 Detect
ASTM 12 4.30 1.0 Detect
ASTM 19 7.45 1.0 Detect
ASTM 20 8.61 1.0 Detect
ASTM 21 6.20 1.0 Detect

Sample
Perc
ent
Asb
est
os
Copyright 2011 EMSL Analytical, Inc.
64
0.00
0.50
1.00
1.50
2.00
2.50
3.00
3.50
4.00
4.50
1 2 3 4 5 6 7
Overall Percent Recovery : 1432 % Overall (Pooled) RSD : 0.39
ASTM Results at 0.1% Phase I

Sample
Perc
ent
Asb
est
os
Copyright 2011 EMSL Analytical, Inc.
65
0.0
2.0
4.0
6.0
8.0
10.0
12.0
14.0
16.0
1 2 3 4 5 6 7
Overall Percent Recovery : 569 % Overall (Pooled) RSD : 0.23
ASTM Results at 1% Phase I

Summary of ASTM Results - Phase I
66
Copyright 2011 EMSL Analytical, Inc.
Overall (Pooled) Percent Recovery: 1090 %
Overall (Pooled) RSD: 0.32

ASTM Round Robin Results Soil spiked with 0.2% Asbestos
Lab A Lab B Lab C Lab D Mean
% asbestos in
>2mm fraction *
0.5 0.75 0.72 2.0 0.99
% asbestos in 2mm
– 100um fraction *
2.0 2.5 0.87 3.7 2.3
% asbestos in
<100um fraction *
0.5 0.5 0 0.25 0.31
Total percent
asbestos *
1.7 2.15 0.73 3.1 1.9
% asbestos by
point-count
0.5 0.5 0.25 0.25 0.375
Drop mount
estimate
Trace <0.1 1% Trace <1%
Structures per
microgram
5,700 520 15,000 7,700 7,200
950% recovery
Copyright 2011 EMSL Analytical, Inc.
67

CARB Method 435 Results
Copyright 2011 EMSL Analytical, Inc.
68

CARB 435 Results on Blanks Phase I
Copyright 2011 EMSL Analytical, Inc.
69
Analyst 1 Analyst 2 Analyst 3 Analyst 4 Analyst 5 Analyst 6
Sample Number
Asbestos % Actual Result
% Recovery Result
% Recovery Result
% Recovery Result
% Recovery Result
% Recovery Result
% Recovery
CARB 3 0.00 0 NA 0 NA 0 NA 0 NA 0 NA 0 NA
CARB 7 0.00 0 NA 0 NA 0 NA 0 NA 0 NA 0 NA
CARB 8 0.00 0 NA 0 NA 0 NA 0 NA 0 NA 0 NA
CARB 10 0.00 0 NA 0 NA 0 NA 0 NA 0 NA 0 NA
CARB 11 0.00 0 NA 0 NA 0 NA 0 NA 0 NA 0 NA
CARB 14 0.00 0 NA 0 NA 0 NA 0 NA 0 NA 0 NA
CARB 18 0.00 0 NA 0 NA 0 NA 0 NA 0 NA 0 NA

Copyright 2011 EMSL Analytical, Inc.
70
Sample 0
0.5
1
1.5
2
2.5
3
3.5
4
1 2 3 4 5 6 7
Overall Percent Recovery: 787 % Excluding False Negatives Overall (Pooled) RSD: 0.73
CARB 435 Results at 0.1% Phase I

Copyright 2011 EMSL Analytical, Inc.
71
Per
cen
t A
sbes
tos
Sample
0
2
4
6
8
10
12
14
16
18
1 2 3 4 5 6 7
Overall Percent Recovery: 475 % excluding false negatives Overall (Pooled) RSD: 0.52
CARB 435 Results at 1% Phase I

CARB 435 Performance Phase I
72
Copyright 2011 EMSL Analytical, Inc.
Overall (Pooled) Percent Recovery: 650 %
Overall (Pooled) RSD: 0.64

0
500
1000
1500
2000
2500
EPA ASTM CARB Target
0.1% Spiked Sample 1% Spiked sample
Excluding false negatives
73
Copyright 2011 EMSL Analytical, Inc.
Method Performance Phase I Accuracy
Perc
ent
Reco
very
Perc
ent
Reco
very
0
100
200
300
400
500
600
700
800
900
EPA ASTM CARB Target

0.1% Spiked Sample 1% Spiked sample
Relative Standard Deviation
74
Copyright 2011 EMSL Analytical, Inc.
Method Performance Phase I Precision
Relative Standard Deviation
0
0.1
0.2
0.3
0.4
0.5
0.6
0.7
0.8
EPA ASTM CARB
0
1
2
3
4
5
6
7
EPA ASTM CARB

Score Card Phase I Pooled Data for the Round
EPA600 ASTM Sieve CARB 435 %
Recovery 1540 1090 650
RSD 0.55 0.32 0.64
Copyright 2011 EMSL Analytical, Inc.
75
False Negatives for CARB 435 are a concern

Phase II
Copyright 2011 EMSL Analytical, Inc.
Everything up to this point has compared how the methods perform at detecting and quantifying unconsolidated milled asbestos in soil Now let’s see what happens when we spike with ACM.

Phase II
Spiking with Consolidated Asbestos (ACM)
- Transite supplied by RTI
- Estimated Chrysotile percentage = 14%
Copyright 2011 EMSL Analytical, Inc.
77

78
Copyright 2011 EMSL Analytical, Inc.
Phase II EPA 600 Method Results

EPA 600 - Blanks - Phase II
Analyst 1 Analyst 2 Analyst 3 Analyst 4 Analyst 5 Analyst 6
Sample Number
Asbestos % Actual Result
% Recovery Result
% Recovery Result
% Recovery Result
% Recovery Result
% Recovery Result
% Recovery
EPA 600 1 0.00 0 NA 0 NA 0 NA 0 NA 0 NA 0 NA
EPA 600 8 0.00 0 NA 0.5 NA 0 NA 0 NA 0 NA 0 NA
EPA 600 9 0.00 0.5 NA 0 NA 0 NA 0 NA 0 NA 0 NA
EPA 600 14 0.00 0 NA 0 NA 0 NA 0 NA 0 NA 0 NA
EPA 600 15 0.00 0 NA 0 NA 0 NA 0 NA 0 NA 0 NA
EPA 600 19 0.00 0 NA 0 NA 0 NA 0 NA 0 NA 0 NA
EPA 600 21 0.00 0 NA 0 NA 0.5 NA 0 NA 0 NA 0.5 NA
79
Copyright 2011 EMSL Analytical, Inc.

EPA 600 - 0.1% - Phase II 80
Copyright 2011 EMSL Analytical, Inc.
0
0.5
1
1.5
2
2.5
3
3.5
1 2 3 4 5 6 7
Overall Percent Recovery : 726 % Overall (Pooled) RSD: 0.43

EPA 600 - 1% - Phase II 81
Copyright 2011 EMSL Analytical, Inc.
0
2
4
6
8
10
1 2 3 4 5 6 7
Overall Percent Recovery for this Sample: 214 %
Overall (Pooled) RSD for this Sample: 0.32

EPA 600 Summary Phase II
82
Copyright 2011 EMSL Analytical, Inc.
Overall (Pooled) Percent Recovery 535 %
Overall (Pooled) RSD : 0.38

Phase II ASTM Sieve Method Results
Copyright 2011 EMSL Analytical, Inc.
83

ASTM – Blanks - Phase II 84
Copyright 2011 EMSL Analytical, Inc.
Analyst 1 Analyst 2 Analyst 3 Analyst 4 Analyst 5 Analyst 6
Sample Number
Asbestos % Actual Result
% Recovery Result
% Recovery Result
% Recovery Result
% Recovery Result
% Recovery Result
% Recovery
ASTM 4 0.00 0.0 NA 0.0 NA 0.0 NA 0.0 NA 0.0 NA 0.0 NA
ASTM 8 0.00 0.0 NA 0.0 NA 0.0 NA 0.0 NA 0.0 NA 0.00 NA
ASTM 9 0.00 0.0 NA 0.2 NA 0.0 NA 0.0 NA 0.0 NA 0.0 NA
ASTM 11 0.00 0.0 NA 0.4 NA 0.0 NA 0.0 NA 0.0 NA 0.0 NA
ASTM 12 0.00 0.0 NA 0.0012 NA 0.0 NA 0.0 NA 0.0 NA 0.0 NA
ASTM 17 0.00 0.0 NA 0.0 NA 0.0 NA 0.0 NA 0.0 NA 0.0 NA
ASTM 19 0.00 0.0 NA 0.0 NA 0.0 NA 0.0 NA 0.0 NA 0.0 NA

ASTM - 0.1% - Phase II 85
Copyright 2011 EMSL Analytical, Inc.
0.00
0.50
1.00
1.50
2.00
2.50
3.00
3.50
4.00
1 2 3 4 5 6 7
Overall Percent Recovery: 519 % Overall (Pooled) RSD for this Sample: 0.6

ASTM - 1% - Phase II 86
Copyright 2011 EMSL Analytical, Inc.
0.00
1.00
2.00
3.00
4.00
5.00
6.00
7.00
8.00
9.00
10.00
1 2 3 4 5 6 7
Overall Percent Recovery : 188 %
Overall (Pooled) RSD: 0.4

ASTM Summary Phase II
87
Copyright 2011 EMSL Analytical, Inc.
Overall (Pooled) Percent Recovery: 391 %
Overall (pooled) RSD: 0.5

Phase II CARB Method 435 Results
Copyright 2011 EMSL Analytical, Inc.
88

Phase II - CARB - Blanks 89
Copyright 2011 EMSL Analytical, Inc.
Analyst 1 Analyst 2 Analyst 3 Analyst 4 Analyst 5 Analyst 6
Sample Number
Asbestos % Actual Result
% Recovery Result
% Recovery Result
% Recovery Result
% Recovery Result
% Recovery Result
% Recovery
CARB 1 0.00 0 NA 0 NA 0 NA 0 NA 0 NA 0 NA
CARB 2 0.00 0 NA 0 NA 0 NA 0 NA 0 NA 0 NA
CARB 9 0.00 0 NA 0 NA 0 NA 0 NA 0 NA 0 NA
CARB 11 0.00 0 NA 0.125 NA 0 NA 0 NA 0 NA 0 NA
CARB 16 0.00 0 NA 0 NA 0 NA 0 NA 0 NA 0 NA
CARB 17 0.00 0 NA 0 NA 0 NA 0 NA 0 NA 0 NA
CARB 20 0.00 0 NA 0 NA 0 NA 0 NA 0 NA 0 NA

Phase II - CARB - 0.1% 90
Copyright 2011 EMSL Analytical, Inc.
0
0.2
0.4
0.6
0.8
1
1.2
1.4
1.6
1 2 3 4 5 6 7
Overall Percent Recovery for this Sample: 218 %
Overall (Pooled) RSD for this Sample: 0.65
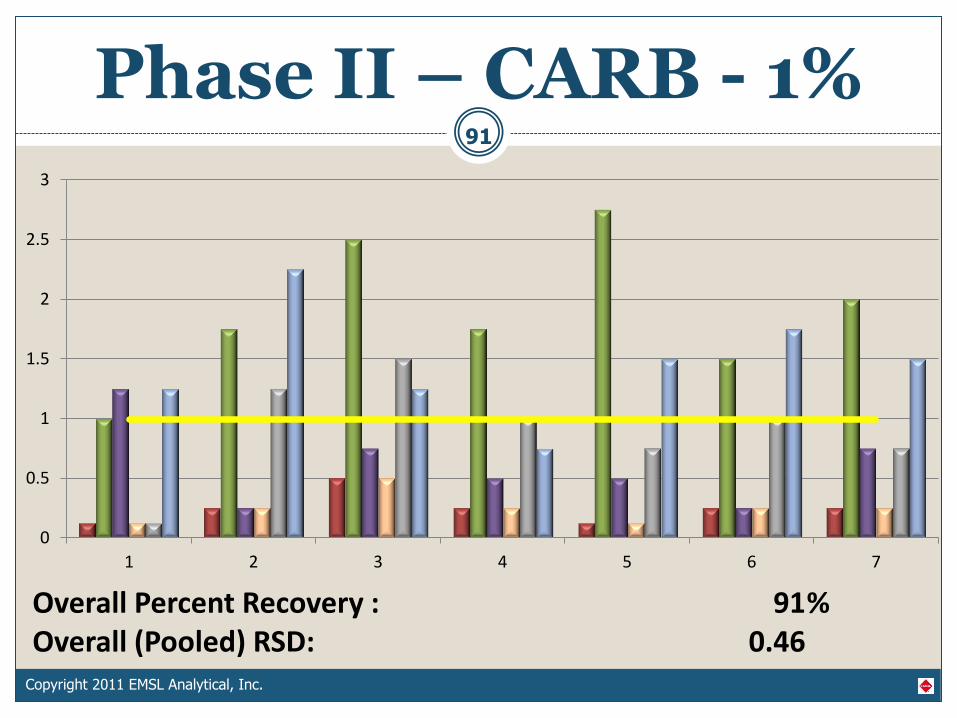
Phase II – CARB - 1% 91
Copyright 2011 EMSL Analytical, Inc.
0
0.5
1
1.5
2
2.5
3
1 2 3 4 5 6 7
Overall Percent Recovery : 91 % Overall (Pooled) RSD: 0.46

Phase II CARB Summary
92
Copyright 2011 EMSL Analytical, Inc.
Overall (Pooled) Percent Recovery : 167 %
Overall (Pooled) RSD: 0.57

Final Score Card 93
Copyright 2011 EMSL Analytical, Inc.
EPA600 ASTM Sieve CARB 435
% Recovery 1540 1090 650 RSD 0.55 0.32 0.64
EPA600 ASTM Sieve CARB 435
% Recovery 535 391 167
RSD 0.38 0.5 .57
Phase I
Phase II

Summing Up
• Well known
• fast / cost effective
• pretty good at finding the
asbestos
Straight EPA 600 Pros Cons
94
Copyright 2011 EMSL Analytical, Inc.
• Gross over estimation,
esp. at low percentages
• Since method not
designed for this matrix
not legally defensible?

Summing Up
• Once published it will be
defensible (“fit for use”)
• Allows for a forensic analysis as
it does not alter the asbestos or
ACM as it exists in the sample
• TEM follow up on NAD
circumvents to some extent the
0.25 micron width limitation
ASTM Sieve Method Pros Cons
95
Copyright 2011 EMSL Analytical, Inc.
• Most time consuming
• potential cross
contamination due to sieves
(difficult to clean)
• cost
•Course and medium fraction
still not amenable to PLM
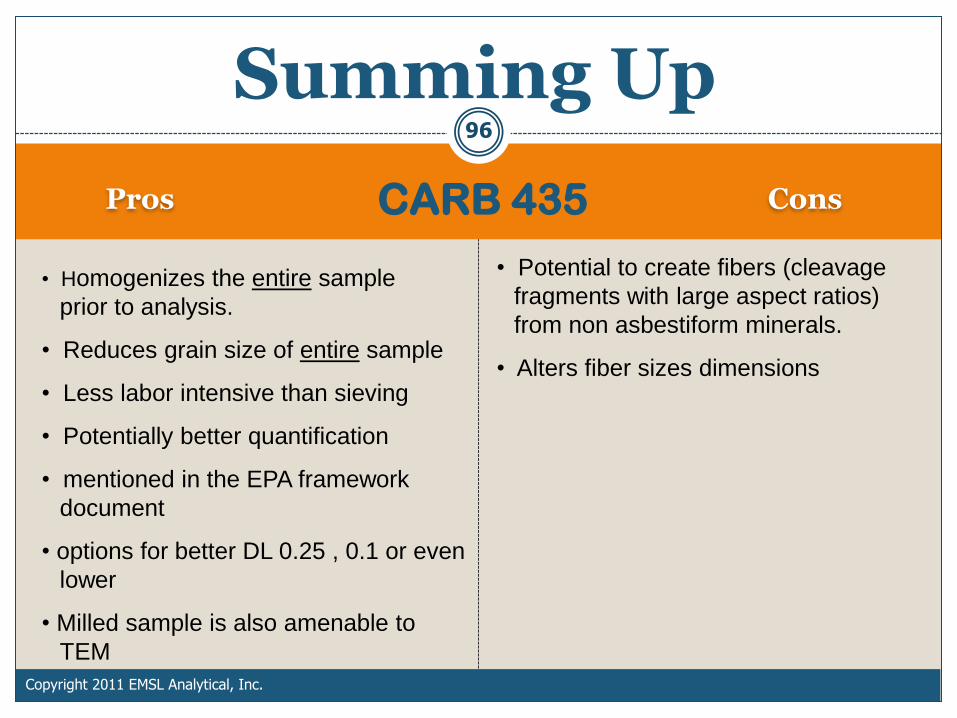
Summing Up
• Homogenizes the entire sample
prior to analysis.
• Reduces grain size of entire sample
• Less labor intensive than sieving
• Potentially better quantification
• mentioned in the EPA framework
document
• options for better DL 0.25 , 0.1 or even
lower
• Milled sample is also amenable to
TEM
CARB 435 Pros Cons
96
Copyright 2011 EMSL Analytical, Inc.
• Potential to create fibers (cleavage
fragments with large aspect ratios)
from non asbestiform minerals.
• Alters fiber sizes dimensions

97
Copyright 2011 EMSL Analytical, Inc.
• CARB 435 mentioned
• 1% is not an appropriate action level for asbestos in soil

Thanks!
• Jim Millette of MVA
• Owen Crankshaw and Todd Ennis at RTI
• Alan Segrave and BV
• Howard Varner and EHS
98
Copyright 2011 EMSL Analytical, Inc.

Real World Test Drive of the Methods
99
Copyright 2011 EMSL Analytical, Inc.
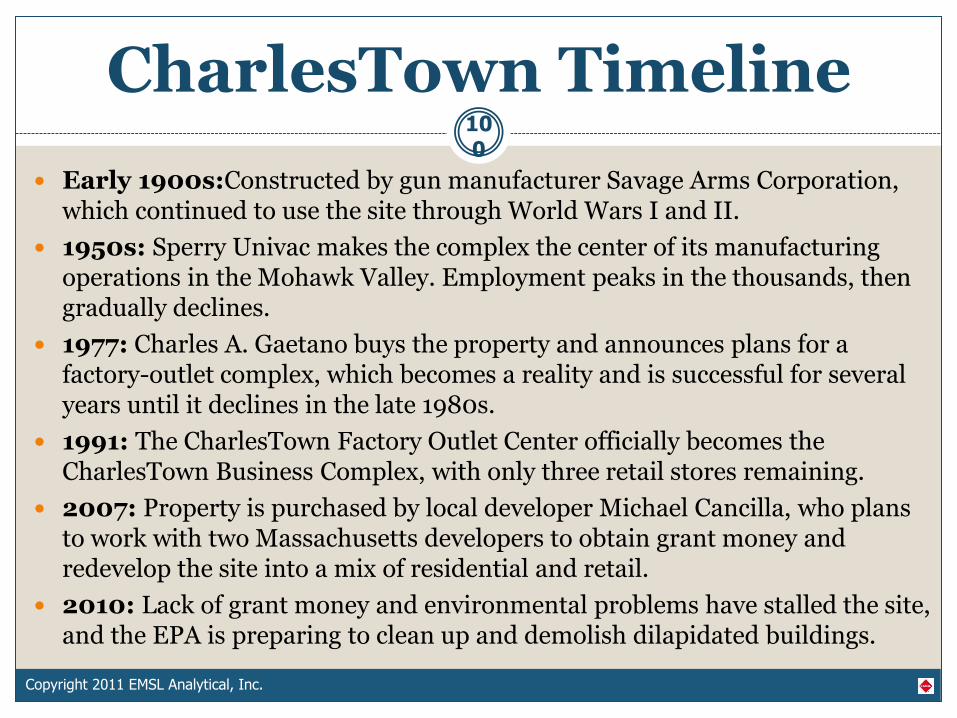
CharlesTown Timeline
Early 1900s:Constructed by gun manufacturer Savage Arms Corporation, which continued to use the site through World Wars I and II.
1950s: Sperry Univac makes the complex the center of its manufacturing operations in the Mohawk Valley. Employment peaks in the thousands, then gradually declines.
1977: Charles A. Gaetano buys the property and announces plans for a factory-outlet complex, which becomes a reality and is successful for several years until it declines in the late 1980s.
1991: The CharlesTown Factory Outlet Center officially becomes the CharlesTown Business Complex, with only three retail stores remaining.
2007: Property is purchased by local developer Michael Cancilla, who plans to work with two Massachusetts developers to obtain grant money and redevelop the site into a mix of residential and retail.
2010: Lack of grant money and environmental problems have stalled the site, and the EPA is preparing to clean up and demolish dilapidated buildings.
100
Copyright 2011 EMSL Analytical, Inc.

Savage Arms 101
Copyright 2011 EMSL Analytical, Inc.

102
Copyright 2011 EMSL Analytical, Inc.
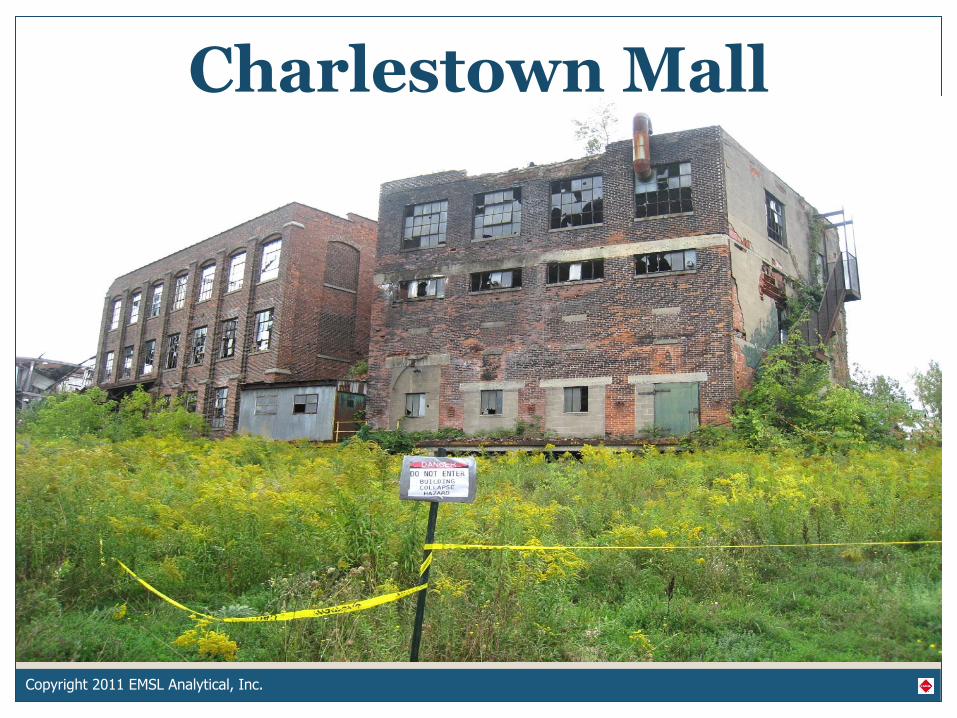
Charlestown Mall

Photo Taken by NY DOL on First Walk Through of Site
103
Copyright 2011 EMSL Analytical, Inc.

104
Copyright 2011 EMSL Analytical, Inc.
Charlestown Mall

105
Copyright 2011 EMSL Analytical, Inc.
Utica NY
Charlestown Mall
106
Copyright 2011 EMSL Analytical, Inc.
Charlestown Mall

107
Copyright 2011 EMSL Analytical, Inc.

Perimeter Air Samples 108
Copyright 2011 EMSL Analytical, Inc.

Controlled Demo 109
Copyright 2011 EMSL Analytical, Inc.

School Across the Street 110
Copyright 2011 EMSL Analytical, Inc.

111
Copyright 2011 EMSL Analytical, Inc.

Non-Scientific Study
4 grab samples collected from various areas
No careful sampling pan :o(
Unlike the formal study these samples need to be riffle split (remember non homogeneity issue) into 3 separate sub-samples for
EPA 600
CARB 435
ASTM Sieve Method
112
Copyright 2011 EMSL Analytical, Inc.

Riffle Splitting
One way to
help
homogenize
the samples
either in the
field or after
submittal to
the lab
Copyright 2011 EMSL Analytical, Inc.

Charlestown Nuggets 114
Copyright 2011 EMSL Analytical, Inc.

Conclusions? 115
Copyright 2011 EMSL Analytical, Inc.
0
1
2
3
4
5
6
1CN 1GV 2CN 2GV 3CN 3GV 4CN 4GV
EPA 600
CARB 435
ASTM Sieve
All conclusions need to be taken with a grain (block?) of salt. Remember that each sample was split into 3 sub-samples. Each sample is therefore a unique sample unto itself.
• CARB seemed to miss asbestos at low percentages
• Generally good agreement between EPA 600 and ASTM

Copyright 2011 EMSL Analytical, Inc.
Another Approach Fiber Releasability
• Determining the percentage of asbestos in
soil is useful for knowing that there is a
potential for exposure.
• But it does not give us a clue as to what the
risk actually is.
• 1% is not an acceptable action level to use
for asbestos in soil

Copyright 2011 EMSL Analytical, Inc.
Fiber Releasability Risk Assessment
• If we can determine the amount of
respirable asbestos fibers that are
released from a soil upon agitation
then we have an insight into risk
• The EPA is all about minimizing risk to
the population.

Risk Assessment Methods
The Elutriator Method
Copyright 2011 EMSL Analytical, Inc.
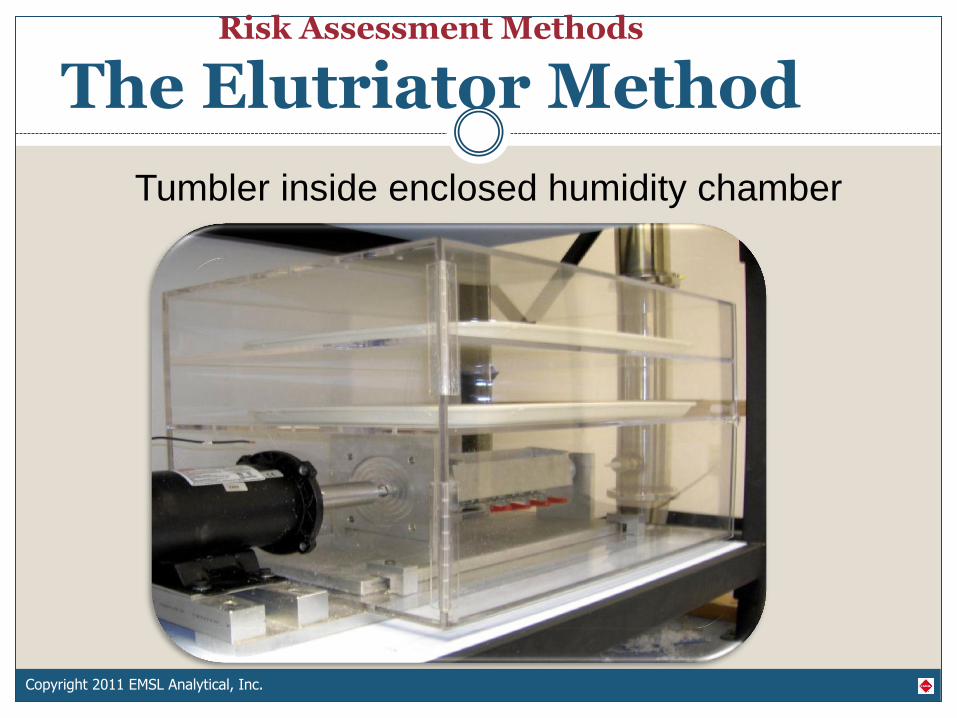
The Elutriator Method Superfund EPA 540-R-97-028 With this method a soil sample is gravimetrically tracked through sieving into course and fine fractions The fine fraction is then tumbled in a closed chamber and any respirable dust generated is collected on air cassettes Analysis is performed by ISO 10312 counting rules This method is peer reviewed and (arguably) acceptable for risk assessment studies

Copyright 2011 EMSL Analytical, Inc.
Tumbler
apparatus
filled with
soil
Risk Assessment Methods
The Elutriator Method
Copyright 2011 EMSL Analytical, Inc.
Tumbler inside enclosed humidity chamber
Risk Assessment Methods
The Elutriator Method

Copyright 2011 EMSL Analytical, Inc.
Isokinetic sampling at
top of elutriator stack to
catch only the
respirable fraction of
fibers released from
the soil.
ISO 10312 Analysis
Results in structures/g
Risk Assessment Methods
The Elutriator Method

Copyright 2011 EMSL Analytical, Inc.
Field Alternatives to the Elutriator
The EPA uses other techniques in the field
that also collect and measure releasable
fibers from soil.
• Activity Based air Sampling (ABS)
• Releasable Asbestos Field (RAF) Unit
• Fluidized Bed Asbestos Segregator(FBAS)

Copyright 2011 EMSL Analytical, Inc.
Activity Based Air Sampling
Personnel (and sometimes area) monitoring
is performed while samplers mimic likely
activity for that location.
Activity Based Air Sampling

RAF Unit
Copyright 2011 EMSL Analytical, Inc.

Copyright 2011 EMSL Analytical, Inc.
RAF Unit

Fluidized Bed
Copyright 2011 EMSL Analytical, Inc.
Air is injected at a precise flow rate to get the soil sample behaving like a fluid.
Then air samples are collected from above.

Fluidized Bed
Copyright 2011 EMSL Analytical, Inc.

Fluidized Bed
Copyright 2011 EMSL Analytical, Inc.

Summing Up
Copyright 2011 EMSL Analytical, Inc.
“I see building material debris in the soil. Does it have asbestos and if so how much? Do I need to dispose of it as hazardous waste?”
ASTM Sieving Method
“I don’t necessarily see suspect asbestos but I think it might be there either from contamination (ex brake shops) or from NOA.”
PLM CARB 435 (down to 0.25% or 0.1%)
TEM CARB 435 (EPA 600 Mass Analysis)
ASTM Sieving Method with TEM
Does the Soil Contain Respirable / Releasable Fibers?
EPA 540-R-97-028 Superfund Method (Elutriator)
Activity based air sampling
RAFS / FBAS
The answer depends on the question…