
Soil Inclusions in Jet Grout Columns - Dan Brown and...
12
DFI JOURNAL Vol. 3 No. 1 May 2009 [33] INTRODUCTION Tuttle Creek Dam is a U.S. Army Corps of Engineers (USACE), Kansas City District (District) project located on the Big Blue River near Manhattan, Kansas, 125 miles (200 km) west of Kansas City. Fig. 1(a) is an aerial photograph of Tuttle Creek Dam and the test section located downstream of the dam. The dam is located 9 miles (14.5 km) upstream of the confluence of the Big Blue and Kansas rivers Tuttle Creek Dam is 137 ft (41.8 m) high earth and rockfill embankment with a length of about 7500 ft (2300 m). It is constructed on 40 to 80 ft (12 to 24 m) of Pleistocene and recent alluvial sediments consisting of a natural fine grained blanket from 8 to 27 ft (2.4 to 5.2 m) thick underlain by 25 to 60 ft (7.6 to 18.3 m) of fine to coarse sands with some gravelly sands at depth. Soil Inclusions in Jet Grout Columns Timothy D. Stark, University of Illinois at Urbana-Champaign, Urbaba, Illinois; [email protected] Paul J. Axtell, Dan Brown and Associates, PLLC, Overland Park, KS; +1 (913) 744-4988; paxtell@danbrown and associates.com Justin R. Lewis, Hayward Baker Inc. John C. Dillon, US Army Corps of Engineers William B. Empson, US Army Corps of Engineers Joseph E.Topi, US Army Corps of Engineers Francke C. Walberg, URS Corporation ABSTRACT Jet grouting has increasingly become one of the ground improvement technologies used to address seepage concerns and to provide strength improvement of soils. The technique of jet grouting uses high pressure/velocity jet fluids to erode the existing soil and then to mix the cuttings with cement slurry to form soilcrete. Excess slurry or spoil is ejected to the surface. If the native soil is not completely mixed with slurry, the resulting columns will have soil inclusions which can reduce the strength of the column and/or increase the permeability of the column. A jet grout test program at Tuttle Creek Dam shows that the completed large diameter columns contain perhaps 40 to 50% or more of native soil that was not broken up and mixed during the jet grout process. The test program included excavation of full-scale columns to a depth of 35 ft (10.7 m) for visual inspection and testing. Additionally, six of the columns were cut or sectioned to investigate the interior of the columns. The observed inclusions include significant amounts of both fine grained (silts and clays) and coarse grained (fine sands and sands) soils. Evidence suggests at least two explanations: (1) fine grained soils can be difficult to erode and break up into small enough particles that can be ejected to the surface, especially if at low natural water content, and (2) when large diameter columns are being excavated, the excavated roof of the cylindrical cavity may be unstable and may collapse. With this roof instability large slabs of material can break off, fall into the slurry and escape the cutting and mixing action of the rotating jets. This paper describes the Tuttle Creek Dam test program, inclusions observed in the completed columns, and suggests potential causes of the inclusions. Tuttle Creek Dam was originally designed and constructed in the 1950s prior to the development of recent earthquake engineering technology which accounts for the behavior of materials subjected to seismic shaking. However, shortly after the upstream slope [FIG 1(a)] Aerial view of Tuttle Creek Dam and downstream test site
Transcript of Soil Inclusions in Jet Grout Columns - Dan Brown and...

DFI JOURNAL Vol. 3 No. 1 May 2009 [33]
INTRODUCTIONTuttle Creek Dam is a U.S. Army Corps of Engineers (USACE), Kansas City District (District) project located on the Big Blue River near Manhattan, Kansas, 125 miles (200 km) west of Kansas City. Fig. 1(a) is an aerial photograph of Tuttle Creek Dam and the test section located downstream of the dam. The dam is located 9 miles (14.5 km) upstream of the confl uence of the Big Blue and Kansas rivers Tuttle Creek Dam is 137 ft (41.8 m) high earth and rockfi ll embankment with a length of about 7500 ft (2300 m). It is constructed on 40 to 80 ft (12 to 24 m) of Pleistocene and recent alluvial sediments consisting of a natural fi ne grained blanket from 8 to 27 ft (2.4 to 5.2 m) thick underlain by 25 to 60 ft (7.6 to 18.3 m) of fi ne to coarse sands with some gravelly sands at depth.
Soil Inclusions in Jet Grout ColumnsTimothy D. Stark, University of Illinois at Urbana-Champaign, Urbaba, Illinois; [email protected]
Paul J. Axtell, Dan Brown and Associates, PLLC, Overland Park, KS; +1 (913) 744-4988;
paxtell@danbrown and associates.com
Justin R. Lewis, Hayward Baker Inc.
John C. Dillon, US Army Corps of Engineers
William B. Empson, US Army Corps of Engineers
Joseph E. Topi, US Army Corps of Engineers
Francke C. Walberg, URS Corporation
ABSTRACT
Jet grouting has increasingly become one of the ground improvement technologies used to address seepage concerns and to provide strength improvement of soils. The technique of jet grouting uses high pressure/velocity jet fl uids to erode the existing soil and then to mix the cuttings with cement slurry to form soilcrete. Excess slurry or spoil is ejected to the surface. If the native soil is not completely mixed with slurry, the resulting columns will have soil inclusions which can reduce the strength of the column and/or increase the permeability of the column. A jet grout test program at Tuttle Creek Dam shows that the completed large diameter columns contain perhaps 40 to 50% or more of native soil that was not broken up and mixed during the jet grout process. The test program included excavation of full-scale columns to a depth of 35 ft (10.7 m) for visual inspection and testing. Additionally, six of the columns were cut or sectioned to investigate the interior of the columns. The observed inclusions include signifi cant amounts of both fi ne grained (silts and clays) and coarse grained (fi ne sands and sands) soils. Evidence suggests at least two explanations: (1) fi ne grained soils can be diffi cult to erode and break up into small enough particles that can be ejected to the surface, especially if at low natural water content, and (2) when large diameter columns are being excavated, the excavated roof of the cylindrical cavity may be unstable and may collapse. With this roof instability large slabs of material can break off, fall into the slurry and escape the cutting and mixing action of the rotating jets. This paper describes the Tuttle Creek Dam test program, inclusions observed in the completed columns, and suggests potential causes of the inclusions.
Tuttle Creek Dam was originally designed and constructed in the 1950s prior to the development of recent earthquake engineering technology which accounts for the behavior of materials subjected to seismic shaking. However, shortly after the upstream slope
[FIG 1(a)] Aerial view of Tuttle Creek Dam and downstream test site

[34] DFI JOURNAL Vol. 3 No. 1 May 2009
failure caused by soil liquefaction occurred at Lower San Fernando Dam in 1971, the USACE began a program to evaluate all its dams based on the evolving technology. Investigations to assess the seismic stability of Tuttle Creek Dam were conducted in the 1980’s and 1990’s and led to the fi nding that seismic rehabilitation was required to assure the project could withstand the design earthquake without an uncontrolled loss of the reservoir.
In September 2005 the District entered into a contract with a ground improvement specialty construction fi rm to construct an upstream cutoff wall to bedrock and construct ground improvement zones under the embankment slopes to address the seismic stability concerns. The cutoff wall was to be constructed by jet grouting and the ground improvement could be by either jet grouting or by the deep mixing method. Prior to beginning actual construction the contractor was to prove the viability of the technology and develop appropriate parameters for the site by conducting a test program downstream of the dam, Fig. 1(b). This paper provides a brief overview of the test program, but focuses on the fi ndings resulting from the excavation, exposure and sectioning of several constructed jet grout columns in the test program. For construction and safety reasons, the District decided to abandon the cutoff wall and focus on stabilization of the downstream slope of the dam. The construction and safety issues involve the appearance of bubbles and grout in the reservoir during some test columns being constructed on the upstream slope of the dam. While other feasible explanations exist, the appearance of bubbles and grout in the reservoir may have suggested that the cohesive blanket just below the embankment materials
could have been damaged, resulting in a change in the active seepage condition at the dam. Note that air was used during the jet grouting process and was recognized as a possible source of the bubbles. Accordingly, the District decided to monitor the active seepage condition and move the ground improvement operation to the downstream slope.
JET GROUTINGUse of jet grout walls as a barrier to water fl ow under dams and other sites has been used increasingly in recent times. (Croce and Modoni, 2007; Burke, 2007, Martin, et al., 2004; Yilmaz, et al., 2007; and Fang, et al., 2006). If installed correctly, jet grout columns may provide a continuous wall of relatively impermeable material. However, the results and effectiveness of jet grout construction can be diffi cult to achieve and assess. Field trials to establish jet grout parameters, column diameter measurements, energy correlations, and assessment of quality of treated soil including the inclusion of untreated soil within the column are required. Clearly, jet grouting is more technically demanding, and less forgiving, than perhaps other ground improvement methodologies, e.g., slurry walls, as this case study suggests.
The jet grouting process begins by drilling a borehole, typically 6 in (150 mm) in diameter. The borehole is held open using drilling mud or grout. Grout is a slurry of cement and water that is mixed in a mixing plant before being introduced to the jet grouting process. Depending on soil type and depth of treatment, among other things, the borehole above the zone to be grouted may be stabilized by installing a casing, usually made of steel or plastic. The soil is excavated during the boring process by return fl ow of drilling fl uid to the surface. The drill bit with jet grouting tool (monitor) is advanced to the bottom of the treatment zone. A fl uid, e.g., air, water, and/or grout, is then ejected from the tool nozzle at high velocities and under high pressure to erode the surrounding soil. The tool is generally rotated at a continuous rate to erode the native soil and create the columnar geometry. After the erosion process on this project, the tool is raised in steps so the grout nozzle is located where the erosion process just occurred. High pressure/velocity grout is injected into the excavated soil slurry zone. Excess grouted slurry and/or spoil is carried to the surface through the annulus between the drill rods and [FIG. 1(b)] Jet grout and soil mix columns during excavation

DFI JOURNAL Vol. 3 No. 1 May 2009 [35]
the borehole or outer steel casing. The injected grout and soil mixture then sets to become a hardened, relatively impermeable mass referred to as soilcrete.
The system of jet grouting used to cut the soil can vary depending on desired geometry, contractor equipment and experience, and subsurface conditions. The three main jet grouting systems are single fl uid, double fl uid and triple fl uid. In the single fl uid system, Fig. 2(a), grout is also used as the cutting fl uid and the cementing agent. Grout is pumped through the drillrod and exits the horizontal nozzle(s) in the monitor at high velocity [approximately 650 ft/sec (200m/sec)]. This energy breaks down the soil matrix and replaces it with a mixture of grout slurry and in situ soil (soilcrete). Single fl uid jet grouting is most effective in cohesionless soils because only one fl uid is being used in this method. However, all three jet grouting techniques are most effective in cohesionless soils. The double fl uid system, Fig. 2(b), uses air and grout ejected from two different nozzles that are placed opposite each other on the rod. The air stream surrounds the grout stream to facilitate erosion. However, some double fl uid systems do not use two nozzles. In the triple fl uid system, Fig. 2(c), air and water are used as cutting fl uids above the grout nozzle. The systems vary from contractor to contractor and are usually proprietary to each one. However, extremely high air, water, and/or grout pressure are required to create large diameter columns.
(a) (b) (c)
[FIG. 2] Diagram illustrating jet grouting systems; (a) single fl uid, (b) double fl uid, (c) triple fl uid (after www.haywardbaker.com)
Downstream Test Section
In 2006 the USACE awarded an option in the contract to conduct a test program downstream of Tuttle Creek Dam. The purpose of the test program was to investigate the viability of using jet grout and the deep mixing method (jet assisted soil mixing) columns for an upstream cutoff barrier (jet
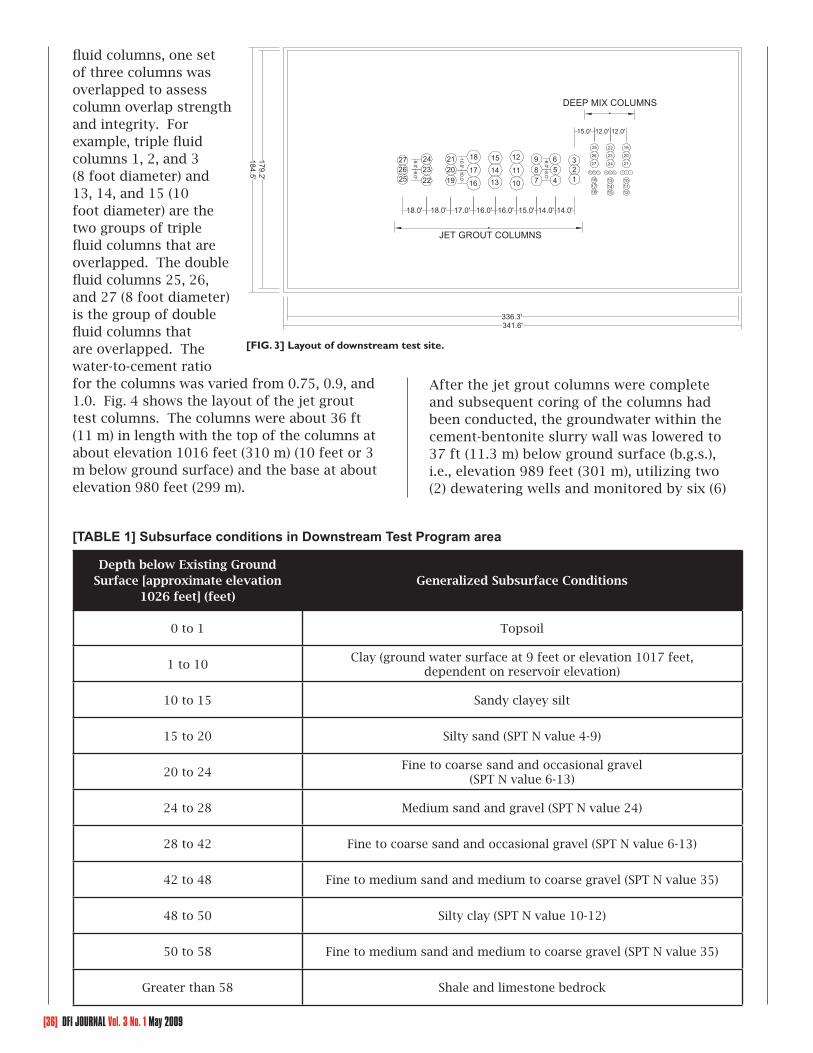
grouting only) and seismic stabilization retrofi t. The test program site is located about 500 feet (150 m) downstream of the dam which is the light colored area in Fig. 1(a). Fig. 3 presents the layout of the test area with the soil mix columns on the right side of the area and the jet grout columns on the left side. The jet grout columns are labeled 1-27 on the left and the soil mix columns are clustered on the right. The test area is approximately 185 feet (56 m) wide and 340 feet (105 m) long. The jet grout and soil mix columns are surrounded by a perimeter cement-bentonite cutoff wall constructed to bedrock which allowed the test section area to be dewatered so the columns could be exposed after curing.
The cutoff wall was installed using self-hardening cement-bentonite slurry with a long reach excavator. The cutoff wall is keyed into bedrock at a depth of about 60 feet (18.3 m). Several existing piezometers, two soil borings 150 feet (45.7 m) apart, cone penetration tests during and after construction of the columns, and observations during the excavation of the columns were used to determine the soil and groundwater conditions present in the test area. The subsurface conditions encountered in the test area are shown in Table 1. The subsurface exploration determined that the test area is underlain by a natural clay/silt blanket followed by sands that coarsen with depth. The ground water table downstream from the toe of the dam is about elevation 1018 feet (310 m). Instrumentation was installed around the test area to monitor in situ conditions during installation of the jet grout and soil mix columns. The instrumentation includes fi fteen (15) Surface Deformation Measuring Points (SDMP), four (4) Deep Settlement Points (DSP), twenty-two (22) Vibrating Wire Piezometers (VWP), and six (6) observation wells.
The jet grouting test program consists of twenty-seven jet grout columns in three groups of nine (see Fig. 3). The target diameters for these columns are from 8 to 10 ft (2.4 to 3.0 m). Columns were installed using both double and triple fl uid jet grouting system. The double fl uid jet grout system was used to create columns 19 through 27 with a target diameter of 8 ft (2.4 m}. The triple fl uid jet grout system was used to create columns 1 to 18 with a target diameters of 8 ft (2.4 m) for columns 1 through 9 and 10 ft (3.0 m) for columns 10 through 18. In each group of double fl uid and triple
[36] DFI JOURNAL Vol. 3 No. 1 May 2009
fl uid columns, one set of three columns was overlapped to assess column overlap strength and integrity. For example, triple fl uid columns 1, 2, and 3 (8 foot diameter) and 13, 14, and 15 (10 foot diameter) are the two groups of triple fl uid columns that are overlapped. The double fl uid columns 25, 26, and 27 (8 foot diameter) is the group of double fl uid columns that are overlapped. The water-to-cement ratio for the columns was varied from 0.75, 0.9, and 1.0. Fig. 4 shows the layout of the jet grout test columns. The columns were about 36 ft (11 m) in length with the top of the columns at about elevation 1016 feet (310 m) (10 feet or 3 m below ground surface) and the base at about elevation 980 feet (299 m).
After the jet grout columns were complete and subsequent coring of the columns had been conducted, the groundwater within the cement-bentonite slurry wall was lowered to 37 ft (11.3 m) below ground surface (b.g.s.), i.e., elevation 989 feet (301 m), utilizing two (2) dewatering wells and monitored by six (6)
Depth below Existing Ground Surface [approximate elevation
1026 feet] (feet)Generalized Subsurface Conditions
0 to 1 Topsoil
1 to 10Clay (ground water surface at 9 feet or elevation 1017 feet,
dependent on reservoir elevation)
10 to 15 Sandy clayey silt
15 to 20 Silty sand (SPT N value 4-9)
20 to 24Fine to coarse sand and occasional gravel
(SPT N value 6-13)
24 to 28 Medium sand and gravel (SPT N value 24)
28 to 42 Fine to coarse sand and occasional gravel (SPT N value 6-13)
42 to 48 Fine to medium sand and medium to coarse gravel (SPT N value 35)
48 to 50 Silty clay (SPT N value 10-12)
50 to 58 Fine to medium sand and medium to coarse gravel (SPT N value 35)
Greater than 58 Shale and limestone bedrock
[TABLE 1] Subsurface conditions in Downstream Test Program area
341.6'336.3'
184.5'179.2'
18.0' 18.0' 17.0' 16.0' 16.0' 15.0' 14.0' 14.0'
12.0' 12.0'15.0'
8.0'8.0'
10.0'10.0'
8.0'8.0' 1
23
456
789
10
11
12
13141518
17
16192021
222324
252627
123456789
101112
131415
161718
19
20
21
22
23
24
25
26
27
JET GROUT COLUMNS
DEEP MIX COLUMNS
[FIG. 3] Layout of downstream test site.
DFI JOURNAL Vol. 3 No. 1 May 2009 [37]
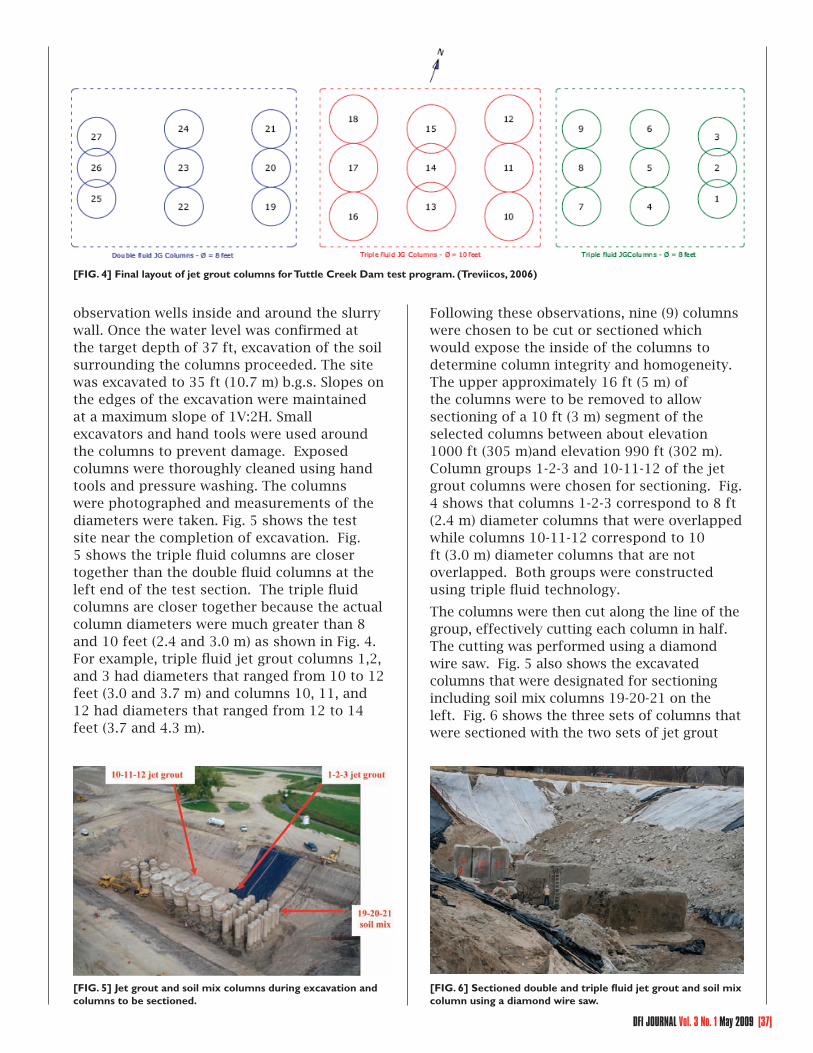
observation wells inside and around the slurry wall. Once the water level was confi rmed at the target depth of 37 ft, excavation of the soil surrounding the columns proceeded. The site was excavated to 35 ft (10.7 m) b.g.s. Slopes on the edges of the excavation were maintained at a maximum slope of 1V:2H. Small excavators and hand tools were used around the columns to prevent damage. Exposed columns were thoroughly cleaned using hand tools and pressure washing. The columns were photographed and measurements of the diameters were taken. Fig. 5 shows the test site near the completion of excavation. Fig. 5 shows the triple fl uid columns are closer together than the double fl uid columns at the left end of the test section. The triple fl uid columns are closer together because the actual column diameters were much greater than 8 and 10 feet (2.4 and 3.0 m) as shown in Fig. 4. For example, triple fl uid jet grout columns 1,2, and 3 had diameters that ranged from 10 to 12 feet (3.0 and 3.7 m) and columns 10, 11, and 12 had diameters that ranged from 12 to 14 feet (3.7 and 4.3 m).
Following these observations, nine (9) columns were chosen to be cut or sectioned which would expose the inside of the columns to determine column integrity and homogeneity. The upper approximately 16 ft (5 m) of the columns were to be removed to allow sectioning of a 10 ft (3 m) segment of the selected columns between about elevation 1000 ft (305 m)and elevation 990 ft (302 m). Column groups 1-2-3 and 10-11-12 of the jet grout columns were chosen for sectioning. Fig. 4 shows that columns 1-2-3 correspond to 8 ft (2.4 m) diameter columns that were overlapped while columns 10-11-12 correspond to 10 ft (3.0 m) diameter columns that are not overlapped. Both groups were constructed using triple fl uid technology.
The columns were then cut along the line of the group, effectively cutting each column in half. The cutting was performed using a diamond wire saw. Fig. 5 also shows the excavated columns that were designated for sectioning including soil mix columns 19-20-21 on the left. Fig. 6 shows the three sets of columns that were sectioned with the two sets of jet grout
[FIG. 5] Jet grout and soil mix columns during excavation and columns to be sectioned.
[FIG. 6] Sectioned double and triple fl uid jet grout and soil mix column using a diamond wire saw.
[FIG. 4] Final layout of jet grout columns for Tuttle Creek Dam test program. (Treviicos, 2006)

[38] DFI JOURNAL Vol. 3 No. 1 May 2009
columns in the foreground and the soil mix columns at the end. The column group closest in Fig. 6 is jet grout columns 10-11-12 (nominal 10 ft or 3 m diameter), middle column group is 1-2-3 (nominal 8 ft or 2.4 m diameter); and back group is 19-20-21 of the soil mixed columns (6 ft or 1.8 m) diameter.
Jet Grouting Parameters
Table 2 presents the jet grouting parameters to construct the two clusters of columns that were sectioned. These two clusters are shown in Fig. 5 and are 1, 2, and 3 and 10, 11, and 12. In Table 2, C/W defi nes the cement to water ratio and B/W defi nes the bentonite to water ratio.
Soil Inclusions in Jet Grout Columns
Exposure of the interior of the jet grout columns revealed soil inclusions of considerable number and size. For example, Fig. 7 shows about 50 to 60% of the interior of the columns is soil. The darker colored inclusions are cohesive soil and the light colored areas, directly in front of the person in the photograph is intact untreated sand. The presence of both sand and clay inclusions in the columns was unexpected based on the results of the core drilling and external appearance of the excavated columns. In addition the amount and size of the inclusions found during the sectioning was surprising. Thus, coring after curing of the soilcrete may not provide a representative view of the amount of soil inclusion in the completed column. In contrast, the soil mix column group of 19-20-21 had few inclusions, and those that it did contain were small and not
deemed detrimental to the column integrity. The soil mix columns were essentially homogeneous soilcrete. Double fl uid system jet grout columns were not sectioned.
Figs. 8 through 12 present close-up photographs of jet grout columns 1, 3, 10, 11, and 12, respectively. Soil inclusions in groups 1-2-3 and 10-11-12 range from clay and silt to entire pockets of sand. Column 3 shown in Fig. 9 shows a large clay inclusion at the lower left corner of the cut face. Fig. 13 presents a close-up of some of the sand inclusions in column #12 as well as voids which apparently were formed by pockets of trapped injected air in the grout slurry prior to hardening. A close inspection of the sand in the inclusions revealed remnants of bedding in the sand that is naturally horizontal. This suggests that large pieces of sand were eroded or fell off the roof of the excavated chamber instead of the
Cluster Number
Station time (sec/1.6 inches)
Rotation Speed (rpm)
Water Qty. (gal/
ft)
Grout Qty. (gal/
ft)
Cement Qty. (lbs/ft)
Specifi c Energy (MJ/m)
Grout Mix (C/W & B/W)
1,2,3 17.5 4-8 244 248 1,239.5 130-140 0.75 & 0.01
10,11,12 32.0 2-4 432 440 2,211 240-250 0.75 & 0.01
[TABLE 2] Jet grouting parameters for sectioned columns
Cluster Number
Dia. (ft)Nozzles
(# & dia. [inches])Water
Pressure (psi)Grout
Pressure (psi)Air Pressure
(psi)
Grout Flow Rate (gal/
min)
1,2,3 8 1 x 0.25 (w)1 x 0.3 (c)
6,525 3,625 145 112.3
10,11,12 10 1 x 0.25 (w)1 x 0.3 (c)
6,525 3,625 145 112.3
[FIG. 7] Close up of sectioned triple fl uid jet grout columns 10-11-12 (10 ft diameter)

DFI JOURNAL Vol. 3 No. 1 May 2009 [39]
sand being eroded and broken up by the action of the air-water jet and then mixed with grout by the action of the grout jet.
In columns 1 (Fig. 8) and 3 (Fig. 9), the inclusions decrease in the top portions because the eroded soil can be removed as a result of its proximity to the extraction point. However, the inclusions increase with depth because of the presence of the grout and the long distance to the extraction point as shown in the photographs. Thus, sampling of the completed columns should focus on the bottom of the columns to investigate inclusions.
COLLECTION AND TESTING OF SOIL SAMPLESTo investigate the mechanism of how the inclusions may have formed, the probable original position of the source material for the inclusions was assessed. Thus, after exposing the jet grout columns, grab samples were obtained from the various inclusion pockets within the columns to compare material classifi cation with classifi cations from the natural stratigraphy. Inclusion samples
1-1
1-2
1-B
3-1 3-2
3-3
3-4
10-110-2
10-3
10-4
10-5
11-4
[FIG. 10] Soil inclusions in triple fl uid jet grout column #10.
[FIG. 11] Soil inclusions in triple fl uid jet grout column #11.
[FIG. 8] Soil inclusions in triple fl uid jet grout column #1.
[FIG. 9] Soil inclusions and vertical hole from post-construction coring in triple fl uid jet grout column #3.

[40] DFI JOURNAL Vol. 3 No. 1 May 2009
included two (2) from column 1 (1-1 and 1-B both clay samples), four (4) from column 3 (3-1, 3-2, 3-3, and 3-4), and fi ve (5) from column 10 (10-1, 10-2, 10-3, 10-4, and 10-5). Figs. 8 through 12 show the location of these grab samples and the inclusions that were sampled.
In addition to sampling the inclusions in the jet grout columns, the soils in the sides of the excavation, see Fig. 5, were sampled to compare with the inclusion soils to aid in assessing the origin of the inclusions. Grab samples were taken along the north slope of the excavation (side with black sheeting on the slope, closest to the dam in Fig. 5). Two (2) locations were sampled, along the alignment of columns 1-2-3 and 10-11-12. Six (6) samples (TP-1 1/2/3 through TP-6 1/2/3) from column line 1-2-3
were taken at depths of 2.5 ft, 7.5 ft, 12.5 ft, 17.5 ft, 22.5 ft, and 27.5 ft. Eight (8) samples (TP-1 10/11/12 through TP-8 10/11/12) from column line 10-11-12 were taken from depths of 2.5 ft, 7.5 ft, 12.5 ft, 15.5 ft, 20.5 ft, 25.5 ft, 30.5 ft, and 35.5 ft. (0.76 m, 2.3 m, 3.8 m, 4.7 m, 6.2 m, 7.8 m, 9.3 m, and 10.8 m).
The grab samples were placed in doubled plastic, sealable bags to prevent mixing of the samples during transport. The grab samples were taken to the University of Illinois at Urbana-Champaign for index property testing. All tests performed were in accordance with ASTM test procedures.
Upon arrival at the soils laboratory in Urbana, Illinois, all samples were removed from their plastic bags and allowed to desiccate/equilibrate to room temperature and humidity. The drying and preparation procedure followed ASTM D 421.
Clay and silt samples were tested to obtain the Atterberg Limits (Liquid Limit and Plastic Limit) using ASTM D 4318. Additionally, a hydrometer test was performed on each clay and silt sample to determine the clay size fraction using the hydrometer test procedure in ASTM D 422.
The sand samples were sieved to obtain the grain size distribution for each sample for comparison purposes. Grain size distribution relationships for all of the samples were plotted based on sieve and hydrometer test results. All procedures followed ASTM D 422 for particle-size analysis.
A generalized subsurface profi le near the downstream test area is presented in Fig. 14
and shows the alluvial foundation soils consist of the following three major units. An upper fi ne grained cohesive blanket, consisting of silt (ML), and clay (CL, CH, and OH) varies from about 8 to 27 feet (2.4 to 8.2 m) thick. This material is referred to as the natural cohesive blanket herein. Below the blanket, layers of loose, fi ne to medium sand to silty sand, and sand with silt (SP, SW, SM, SM- SP, and SM-SW) and medium dense to dense, coarse to gravelly sand are present to bedrock. The fi ne to medium sand and coarse to gravelly sand deposits typically vary in thickness from about 25 feet to 60 feet (7.6 to 18.3 m). Interspersed with the sands are occasional relatively thin layers or lenses of clay and silt typical of recent alluvial deposits.
12-612-5
[FIG. 13] Close-up of sand inclusions in triple fl uid jet grout column #12, see arrow in Fig. 12.
[FIG. 12] Soil inclusions in triple fl uid jet grout column #12.

DFI JOURNAL Vol. 3 No. 1 May 2009 [41]
ELEVATION
(Average Ground Surface Elevation Downstream of Dam – 1025 feet)
El. 1025 feet (312.4 m)
Normally to slightly over-consolidated
Natural Cohesive Blanket -Silt (ML) and Clay (CL, CH, and OH)
El. 1007.5 feet (307.1 m)
Loose Fine to Medium Sand to Sand with Silt (SM, SP, SW) [SPT N-Value 4 – 24]
El. 995 feet (303.3 m)
Medium Dense to Dense Coarse to Gravelly Sand with clay layers and
inclusions(SP, SW, GP, GW)[SPT N-Value 35]
El. 965 feet (294.1 m) Shale Bedrock
[FIG. 14] Generalized subsurface profi le of alluvial foundation at downstream toe
RESULTS OF SOIL TESTINGThe clay and silt samples from both the inclusions and native soils show a range of Atterberg limits and clay size fractions. Fig. 15 shows the sample elevation and index properties of the clay samples along column line 1-2-3 while Fig. 16 shows the index properties along column line 10-11-12. The clay size fractions are indicated by the triangular symbol. Some interesting trends can be discerned from this data. For example, the soil inclusion JG3-1 (Fig. 9)
shows nearly identical Atterberg limits as the insitu soil at a depth of 7.5 feet (2.3 m) (elevation 1017.5 ft or 310 m) (TP-2 7.5 ft 1/2/3). Thus, the inclusion at JG 3-1(at about elevation 990 to 993 ft or 301.8 to 302.7 m) is probably derived from similar material near the top of the column (at about elevation 1015 or 309.4 m). A similar conclusion might be drawn for soil inclusions JG 10-1(at about elevation 997 ft or 303.9 m) and 10-2 (at about elevation 996 ft or 303.6 m) showing similar Atterberg limits as the insitu soil at a depth of 17.5 feet (5.3 m) (about elevation 1007.5 ft or 307.1 m) (TP-4 17.5 ft 10/11/12).
The sand samples were compared based on their grain size distributions instead of Atterberg limits. Five samples were tested in the laboratory in Urbana, Illinois: JG 10-5, TP-5 (10/11/12), TP-6 (10/11/12), TP-7 (10/11/12), and TP-8 (10/11/12). Additionally, three (3) grain size distributions were performed by USACE on samples JG 11-4, JG 12-5, and JG 12-6 at the fi eld laboratory. The various grain size distributions are shown in Fig. 17.
The grain size distributions of the four soil inclusion samples (JG 10-5, JG 11-4, JG 12-5, and JG 12-6) compare favorably with the distribution for TP-5 (10/11/12). This is also evident by comparing the D50 values for samples JG 10-5, JG 11-4, JG 12-5, and JG 12-6 with the D50 value for TP-5 (10/11/12) in Table 3. The values of D50, grain diameter at 50% passing, for samples JG 10-5, JG 11-4, JG 12-5, and JG 12-6 range from 0.14 to 0.23 mm which is a narrow range. The values of D50 for sample TP-5 (10/11/12)
is 0.17 mm which is in excellent agreement with the soil inclusion D50 values. The D50 value for TP-4 (1/2/3) is also in agreement at 0.19 mm but is not used in this comparison because the sample was taken near the soil mix columns at the other end of the test area. However, the agreement between the values of D50 for TP-4 (1/2/3) and TP-5 (10/11/12) also confi rms the uniformity of the shallow sand.
Sample TP-5 (10/11/12) represents the shallow sands at depth of 20.5 ft
0% 10% 20% 30% 40% 50% 60%
LL
LL
LL
LL
LL
LL
PL
PL
PL
PL
PL
PLCF
CF
CF
CF CF
CFCF
CF
CF
TP-1 2.5' 1/2/3
TP-2 7.5' 1/2/3
TP-3 12.5' 1/2/3
JG 1-1 JG 1-B
JG 3-1JG 3-2
JG 3-3
JG 3-4
CF
[FIG. 15] Sample elevation, test pit/sample number, Atterberg limits and clay size fraction for samples from triple fl uid jet grout column line 1-2-3.

[42] DFI JOURNAL Vol. 3 No. 1 May 2009
or 6.2 m (or elevation 1007.5 to 995 feet, (307.1 to 303.3 m), see Fig. 14). which have a fi ner gradation than the deeper sands which are coarser. Thus, the soil inclusion samples JG 10-5, JG 11-4, JG 12-5, and JG 12-6 appear to consist of the fi ne sand from elevation 1007.5 to 995 feet (307.1 to 303.3 m), see Fig. 14. This means the fi ne sand inclusions in JG 10-5, JG 11-4, JG 12-5, and JG 12-6 are below the natural depth of the fi ne sand in the excavation walls, see Fig. 14. However, this depths of these soil inclusions are still higher than the coarse sand (elevation 995 to 965 feet (303.3 m to 294.1 m), see Fig. 14. Thus, it appears that the fi ne sand inclusion fell or sank through the fl uid grout before it set.
[TABLE 3] Values of D50 for sandy soil inclusions and native soil
Sample Elevation (feet) D50 (mm)
JG 10-5 996 0.18
JG 11-4 996 0.23
JG 12-5 997 0.17
JG 12-6 995 0.14
TP-4 (1/2/3) 1009.5 0.19
TP-5 (10/11/12)
1004.5 0.17
TP-6 (10/11/12)
999.5 0.65
TP-7 (10/11/12)
994.5 13.5
TP-8 (10/11/12)
989.5 12.0
DISCUSSION OF RESULTS/HYPOTHESIS FOR SOIL INCLUSIONSFor the clay and silt inclusions found in the excavated jet grout columns there are at least two potential explanations. Typically, sands and coarser materials are more easily erodible than clays and less susceptible to forming inclusions because of a lack of cohesion. For fi ne-grained soils the cohesion, plasticity, and water content or consistency play a major role in the erodability and ability of the jet to break-down and excavate the material. Coring and visual evidence following excavation show the columns
were of signifi cantly reduced diameter in fi ne grained soil layers compared to the diameters in the looser sand layers confi rming a greater diffi culty, or less effi ciency of the jet in cutting those materials. Of course, erodability of the loose sand is a function of sand density. Fig. 14 shows the SPT blowcount of the loose sand layer (elevation 1007.5 to 995 feet or 307.1 to 303.3 m) ranges from 4 to 24. For comparison purposes, the denser lower sand (elevation 307.1 m or 1007.5 ft to 303.3 m or 995 ft) has an average SPT blowcount of 35. Even though the lower dense sand has a signifi cantly higher SPT blowcount, the jet grout column diameters were not signifi cantly smaller in the dense sand than the loose sand. The column diameters only decreased signifi cantly in the cohesive soils in this test section. Thus, cohesionless soils with blowcounts from 4 to 35 are more erodible than the cohesive soils in the test area. This is due to the plasticity and cohesion of the cohesive soils.
Because of this one might logically expect to fi nd small chunks of clay and silt which were not broken up by either the air or water jet or subsequently broken up and mixed by the grout jet. This might explain a portion of the smaller inclusions but the observation of large chunks of intact clays and silts suggest that these inclusions originated from the roof of the excavated column and that the roof was unstable in the presence of a large column diameter. It is likely that the roof, although excavated fl at, became more dome shaped as a
0% 10% 20% 30% 40% 50% 60%
LL
LL
LL
LL
LL
LL
PL
PL
PL
PL
PL
PL
CF
CF
CF
CF
CF
CF
CF
TP-1 2.5' 10/11/12
TP-2 7.5' 10/11/12
TP-3 12.5' 10/11/12
TP-4 17.5' 10/11/12
JG 10-1
JG 10-2
JG 10-3
JG 10-4
PL
LL
PL LL
[FIG. 16] Sample elevation, test pit/sample number, Atterberg limits, and clay size fraction for samples along triple fl uid jet grout column line 10-11-12.

DFI JOURNAL Vol. 3 No. 1 May 2009 [43]
result of the periodic collapse of material into the unhardened grout slurry. As the chunks became dislodged and because they are heavier than the slurry mix in the column below, they sink through the unhardened fl uid grout and are not broken up and mixed by the action of the jets. Larger chunks likely sank faster than smaller particles, much like in a hydrometer test, so that the large inclusions are found nearer to the bottom of the column. This mechanism explains the presence of natural fi ne grained blanket material near the bottom of the hardened columns. This observation could not be confi rmed via spoil return fl ow because the chunks were simply falling through the unhardened grout slurry so the jets were not trying to erode and evacuate the material. If the jet grouting operation did encounter a cohesive layer during the erosion process, the spoil return fl ow usually decreased signifi cantly and “burping” usually occurred. When the spoil return fl ow increased again, it was usually caused by the jet grouting process moving above the cohesive layer and erosion of the sand materials was occurring.
Sands, especially clean sands (<5% fi nes), are highly erodible and should be easily broken up and mixed by the grout jet following their excavation by the air water jet. However, there are large inclusions of intact sand that show little to no cementation (see Figs. 7, 12, and 13). In some of the inclusions the intact natural bedding is still present. All of the
sand inclusions (JG 10-5, JG 11-4, JG 12-5, and JG 12-6 in Fig. 14) have grain size distributions that are comparable with native soil sample TP-5 (10/11/12). The TP-5 (10/11/12) sample was obtained from a depth of 20.5 ft (6.2 m); however, the JG 10-5 inclusion shown in Fig. 10 is clearly at a depth of almost 35 ft (10.7 m). This suggests that the sand blocks became detached at a depth of about 20.5 feet and sunk through the slurry and grout to a depth of almost 35 feet (10.7 m). These large chunks
could have detached from the roof or sides of the excavation. The sand blocks are still intact because they detached after the jet had moved above a depth of 20.5 feet (6.2 m) and/or the blocks are large enough that the jet could not break up the entire block. Figs. 7, 12, and 13 show the large sand inclusions are intact and the sand shows little or no cohesive material. The sand may have a small amount of cementation but the SPT N-values of 4 – 24 suggest the level of cementation is small.
As in the case of the fi ne grained materials, it is clear that the roof of the excavation became unstable during the jet grout process and the jets circulating below were unable to break up the large chunks before they settled past the action of the jets and down into the completed column below. The evidence suggests that for large diameter columns, roof instability is an issue for jet grout construction. It is not clear if this is a phenomenon only observed with the triple jet system or if it can occur with double fl uid systems. Fig. 6 shows the triple fl uid (1, 2, and 3 and 13, 14, and 15) and double fl uid (19, 20, and 21) jet columns that were sectioned. The double fl uid columns (left end of Fig. 6) do not have large soil inclusions as do the two rows of sectioned triple fl uid columns. The double fl uid columns have a smaller diameter than the triple fl uid columns so the results of this test section cannot be extrapolated to conclude that soil inclusion will not occur in double fl uid columns. Only one row of double fl uid columns was
50
60
70
80
90
100y
Wei
ght (
%)
Grain Size Distribution
0
10
20
30
40
0.00.11.010.0
Per
cent
Fin
er b
y
Grain Size (mm)JG 10-5 TP-5 10/11/12 TP-6 10/11/12 TP-7 10/11/12
TP-8 10/11/12 JG 11-4 JG 12-5 JG 12-6
[FIG. 17] Grain size distributions for sandy samples of soil inclusions in triple fl uid columns 10, 11, and 12 and native soil.

[44] DFI JOURNAL Vol. 3 No. 1 May 2009
sectioned while the other double fl uid columns were removed so additional investigation into this issue could not be performed.
It is also not clear from the sectioning of these jet grout columns at what diameter roof stability becomes an issue and what other factors may contribute to the instability. It is further noted that spoil return samples are usually cited as representative and as providing direct evidence of the grout in the column below at the corresponding position of the grout monitor. While spoil does provide a sample of the grout slurry it is obvious from these test results that it may not provide a complete picture of the below ground conditions.
CONCLUSIONS AND RECOMMENDATIONSJet grouting has seen increasing use in recent years in ground improvement efforts to address seepage and strength of soils. The practice has become popular because of its relative ease of installation (compared to excavations) and its versatility. Most practitioners have recognized that jet grouting is perhaps the most technically demanding of the ground improvement techniques available. However, the results of the jet grout test program at Tuttle Creek Dam suggest that the process which takes place below ground is not completely understood and that unforeseen problems can occur. This test program, clearly illustrates it cannot be assumed that triple fl uid jet grouting will produce a homogeneous mass of impermeable material. This conclusion may only be applicable to relatively large diameter jet grout columns as the potential for roof caving in smaller diameter columns was not investigated. Field trials and test programs which include excavation and dissection/sectioning of completed trial columns are essential to demonstrate the jet grout parameters provide the column quality and integrity required for a given project. If the main objective of the completed columns is seepage control, borehole permeability tests may be useful to quantity the affect of the inclusions on the permeability of the completed columns.
REFERENCES1. Burke, G. (2007). “Vertical and Horizontal
Groudwater Barriers using Jet Grout Panels and Columns”, ASCE Geotechnical Special Publication (168), Geo-Denver 2007 Proceedings.
2. Croce, P., and Modoni, G. (2007). “Design of Jet Grout Cut-off Walls”, Ground Improvement, 11(1): 11-19.
3. Fang, Y.S., Kao, C.C., Chou, J., Chain, K.F., Wang, D.R., and Lin, C.T. (2006). “Jet Grouting with the Superjet-midi Method”, Ground Improvement, 10(2): 69-76.
4. Kauschinger et al, (1992). “Jet Grouting: State-of-the-Practice”, Proceedings, Conference on Geotechnical Engineering, Division of Grouting, Soil Improvement and Geosynthetics, ASCE, New York, 1, 169-181.
5. Martin, J.R., Olgun, C.G., Mitchell, J.K., and Durgunoglu, H.T. (2004). “High Modulus Columns for Liquefaction Mitigation”, Journal of Geotechnical and Geoenvironmental Engineering, ASCE, 130(6): 561-571.
6. Modoni, G., Croce, P., and Mongiovi, L. (2006). “Theoretical Modeling of Jet Grouting”, Geotechnique, 56(5): 335-347.
7. Treviicos South. (2006). “Tuttle Creek Dam Foundation Modifi cation Project”, Manhattan, KS, Test Program Construction (Option), Final Report.
8. U.S. Army Corps of Engineers (USACE). (2002). “Final Evaluation Report and Final Environmental Impact Statement for the Tuttle Creek Sam Safety Assurance Program”.
9. Yilmaz, D., Babuccu, F., Batmaz, S., and Kavruk, F. (2007). “Liquefaction Analysis and Soil Improvement in Beydag Dam”, Geotechnical and Geological Engineering.