SOIL FUNGAL COMMUNITIES ASSOCIATED WITH PLANT HEALTH...
158
SOIL FUNGAL COMMUNITIES ASSOCIATED WITH PLANT HEALTH AS REVEALED BY NEXT-GENERATION SEQUENCING LIHUI XU PhD THESIS • SCIENCE AND TECHNOLOGY • 2011
Transcript of SOIL FUNGAL COMMUNITIES ASSOCIATED WITH PLANT HEALTH...

SOIL FUNGAL COMMUNITIES ASSOCIATED WITH PLANT HEALTH AS REVEALED BY NEXT-GENERATION SEQUENCING
LIHUI XUPhD THESIS • SCIENCE AND TECHNOLOGY • 2011
Department of AgroecologyScience and TechnologyAarhus UniversityForsøgsvej 14200 Slagelse
SOIL FUNGAL COMMUNITIES ASSOCIATED WITH PLANT HEALTH AS REVEALED BY NEXT-GENERATION SEQUENCING
LIHUI XUPhD thesis • science anD technology • 2011
Tryk: www.digisource.dkISBN: 978-87-91949-99-9
Ph.d_58448_Lihui_Xu.indd 3 02/12/11 10.25


i
Preface
This thesis is submitted to fulfill the requirements for obtaining the Ph.D. degree
at the Faculty of Science and Technology, Aarhus University. The Ph.D. project was
carried out at Research Centre Flakkebjerg, Department of Agroecology, Faculty of
Science and Technology, Aarhus University.
The present project is based on three main experimental studies resulted in three
manuscripts: (i) Influence of DNA extraction and PCR amplification on amplicon
sequencing-based studies of soil fungal communities; (ii) Soil fungal community
structure along a soil health gradient in pea fields examined using deep amplicon
sequencing; (iii) Fungal community structure in roots, rhizosphere, and bulk soil
associated with plant health as examined by deep amplicon sequencing.
I would like to acknowledge all the people who have been helping me in various
ways.
Foremost, I would like to express my sincere gratitude to my principle
supervisor Dr. Mogens Nicolaisen. His enthusiasm, inspiration, and expert guidance
helped me throughout all the time of my research and thesis writing. I am also greatly
indebted to my co-supervisors Dr. Sabine Ravnskov and Dr. John Larsen for their
thoughtful guidance, wise advice, and enormous encouragement during my Ph.D.
study. It has been a great pleasure working with such a great supervising group.
I am very thankful to all of the technical staff, Anne-Pia Larsen, Ellen
Frederiksen, Henriette Nyskjold, Jette Them Lilholt, Steen Meier, and Tina Tønnersen
for excellent technical assistance in the laboratory and in the greenhouse.
My special thanks go to Kristian Kristensen, Niels Holst, and Bernd
Wollenweber for their valuable advice on statistical analysis.
I sincerely acknowledge Karen O´Hanlon, Stephanie Walter, and Kirsten Jensen
for indispensable proofreading of the thesis and manuscripts.
I would like to thank all the colleagues and friends at Research Centre
Flakkebjerg for their kind assistance and for providing a pleasant working
environment.

ii
I send special thanks to Valeria Bianciotto, Erica Lumini, and Alberto Orgiazzi
at University of Turin, Italy for giving great suggestions on sequence analysis.
I am grateful to Professor Jo Handelsman and the entire Handelsman Lab at
Yale University for their hospitality and for inspiring me in my work. It was my
immense pleasure to stay in your lab. During the three months stay, I managed to
generate new amplicon libraries for pyrosequencing and to learn techniques for
sequence analysis.
Last but not least, I would like to thank my beloved family and friends for their
continuous love and tremendous support at all time.
Lihui Xu
October 2011
iii
Contents
Summary ....................................................................................................................... 1
Sammendrag ................................................................................................................. 3
1 Introduction ............................................................................................................... 5
1.1 The soil environment .......................................................................................... 5
1.1.1 Physical, chemical, and biological components ......................................... 5
1.1.2 Soil functions ................................................................................................ 6
1.1.3 Soil health ..................................................................................................... 7
1.1.4 Root and rhizosphere .................................................................................. 9
1.2 Soil fungi............................................................................................................ 10
1.2.1 Taxonomic groups of soil fungi ................................................................ 11
1.2.2 Soil fungal life cycles .................................................................................. 12
1.2.3 Role of fungi in the soil ecosystem ............................................................ 12
1.2.4 Soil fungal diversity ................................................................................... 14
1.3 Soil-borne pathogens ........................................................................................ 16
1.3.1 Pea root diseases caused by soil-borne fungal pathogens ...................... 16
1.3.2 Interactions among fungal pathogens ...................................................... 18
1.3.3 Management of soil-borne pathogens ...................................................... 19
1.4 Methods to study soil fungal diversity ............................................................ 21
1.4.1 Classical and biochemical-based techniques ........................................... 21
1.4.2 Molecular-based techniques: DNA fingerprinting and microarray ..... 23
1.4.3 Sequencing techniques .............................................................................. 28
1.5 Motivation and objectives ................................................................................ 37
2 Paper I. Influence of DNA extraction and PCR amplification on studies of soil
fungal communities based on amplicon sequencing ............................................... 39
iv
3 Paper II. Soil fungal community structure along a soil health gradient in pea
fields examined using deep amplicon sequencing ................................................... 51
4 Paper III. Fungal community structure in roots, rhizosphere, and bulk soil
associated with plant root health as examined by deep amplicon sequencing ..... 73
5 General discussion ................................................................................................ 127
6 Conclusions and further perspectives ................................................................. 131
References ................................................................................................................. 135

1
Summary
This project investigated fungal communities associated with plant root health
in agricultural soils using next-generation amplicon sequencing.
Initially, DNA extraction and PCR effects on the variation of read abundances
of pyrosequencing generated operational taxonomic units (OTUs) were investigated
using soil samples from a pea field. Results showed that species richness was
consistent among replicates. Variation among dominant OTUs was low across
replicates, whereas rare OTUs showed higher variation among replicates. Results
further indicated that pooling of several DNA extractions and PCR amplicons will
decrease variation among samples.
Soil fungal communities along a soil health gradient in nine pea field soils were
explored. Soil fungal communities from each soil were different and were strongly
dominated by Ascomycota and Basidiomycota. Several soil-borne fungal pathogens
were detected in the bulk soil. Phoma, Podospora, Pseudaleuria and Veronaea, at the
genus level, correlated to the disease severity index (DSI) of pea roots; Phoma was
most abundant in soils with high DSI, whereas Podospora, Pseudaleuria, and
Veronaea were most abundant in soils with low DSI.
Fungal communities in pea plant roots, the surrounding rhizosphere, and bulk
soil from three pea fields were examined in relation to root health. Fungal diversity in
terms of richness was highest in bulk soil and lowest in roots. Fungal communities in
all samples were strongly dominated by Dikarya and differed significantly among the
three environments. Fusarium oxysporum and Aphanomyces euteiches were the likely
causes of pea root rot in the respective fields as assessed by pyrosequencing data and
quantitative PCR. Glomus and Fusarium were significantly more abundant in roots,
whereas Cryptococcus and Mortierella were almost exclusively found in rhizosphere
and bulk soil. A clear correlation was demonstrated between health status of roots and
their fungal communities. The results showed that fungal community structures are
highly variable in response to the three different ecological niches, between healthy
and diseased roots, and across different fields.
The results presented in this project revealed a high diversity of fungal
communities in agricultural soils and provided information on the different functional
fungal groups, including pathogens, and their dynamics in relation to root health. This

2
knowledge will further improve the understanding of soil fungal communities with
regard to plant diseases.

3
Sammendrag
I dette projekt blev jordens svampesamfund undersøgt i relation til planters
sundhed ved hjælp af amplicon pyrosekventering.
Første blev effekten af DNA-ekstraktion og PCR på variation af mængderne af
pyrosekventering genererede operationelle taksonomiske enheder (OTU) undersøgt i
jordprøver fra en ærtemark. Resultaterne viste, at artsrigdommen var stabil mellem
replikater. Variationen blandt dominerende OTU var lav på tværs af replikater, mens
sjældne OTU viste højere variation. Resultaterne viser, at sammenlægning af flere
DNA ekstraktioner og PCR produkter vil mindske variation blandt prøver.
Svampesamfund i ærtejorde med forskellig sygdomspåvirkning blev undersøgt.
Svampesamfundenes sammensætning var afhængig af sygdomstrykket i den enkelte
mark. Samfundene i ni jorde var stærkt domineret af Ascomycota og Basidiomycota,
og flere jordbårne plantepatogener blev påvist i jorden. Især Phoma, Podospora,
Pseudaleuria og Veronaea korrelerede med sygdomstrykket i markerne; Phoma var
mest forekommende i jorde med syge planter, mens Podospora, Pseudaleuria, og
Veronaea var mest udbredt i sunde jorde.
Svampesamfund i ærterødder, deres omgivende rhizosfære, og den tilstødende
bulkjord fra tre ærtemarker blev undersøgt og relateret til rodsundhed. Der blev fundet
størst artsrigdom i jord og mindst i rødder. Svampesamfundene i alle tre miljøer var
stærkt domineret af Dikarya, men varierede signifikant blandt de tre miljøer.
Fusarium oxysporum og Aphanomyces euteiches blev, på baggrund af
pyrosekventering og kvantitativ PCR, vurderet til at være den sandsynlige årsag til
den forekommende rodråd. Glomus og Fusarium var signifikant oftere forekommende
i rødder, mens Cryptococcus og Mortierella næsten udelukkende blev fundet i
rhizosfære- og bulkjord. En klar sammenhæng blev påvist mellem sundhedstilstanden
af rødder og deres svampesamfund. Resultaterne viste, at strukturen af
svampesamfund varierer mellem de forskellige økologiske nicher (rødder, rhizosfære
og den omgivende bulkjord), mellem sunde og syge rødder, og mellem forskellige
marker.
Resultaterne fra dette projekt viser en stor mangfoldighed i svampesamfundene i
landbrugsjorde og klare sammenhænge mellem sygdomstryk i markerne og

4
forekomsten af enkelte svampegrupper. Projektet har medvirket til en øget forståelse
af dynamikken i jordens svampesamfund i relation til plantesygdomme.
5
1 Introduction
1.1 The soil environment
Soil is a highly complex and dynamic environment, in which the biological
activity is mostly dominated by microorganisms. Soil microorganisms have many
beneficial effects, including nitrogen fixation, phosphorous solubilization, and organic
matter decomposition, which together enhance the bioavailability of plant nutrients
essential for primary production in all terrestrial ecosystems (Gomes et al., 2003).
1.1.1 Physical, chemical, and biological components
The properties of a soil ecosystem are the product of intricate interactions
between a physical and chemical matrix of highly variable composition and living
communities composed of essentially all life forms.
Sand, silt and clay are basic soil components determining soil texture, which in
combination with humic substances and biological components provide the physical
structure of the soil. Micro- and macro-aggregates secure an important balance
between water availability and aeration, which is essential for plant growth. Although
soil aggregates provide surfaces for microbial colonial development, clay and
colloidal organic matter have the smallest diameters, and hence present the largest
surface area for interaction with soil microorganisms and their products (Tate, 2000).
The chemical components of soil including organic compounds and inorganic
minerals derived mainly from organic matter decomposition are essential for all soil
organisms. In relation to plant growth, mineral nutrients are divided into
macronutrients (N, P, K, Ca, Mg, and S) and micronutrients (Fe, Mn, B, Zn, Cu, Cl,
and Mo) (Whitehead, 2000). The availability of plant nutrients is strongly dependent
on soil pH and cation exchange capacity of the soil (Lauber et al., 2009; Rousk et al.,
2010).
The soil is a complex ecosystem with a diverse community of organisms
performing vital functions within. The most widely used system for classifying soil
organisms is according to size: macrobiota, mesobiota and microbiota (Wallwork,
1970; Swift et al., 1979). One gram of soil may contain up to 10 billion
microorganisms of possibly thousands of different species (Rossello-Mora & Amann,
2001). Soil microorganisms exist in large numbers and display an enormous diversity
6
of forms and functions. The major microbial groups in soil are fungi, bacteria
(including actinomycetes), algae (including cyanobacteria) and protozoa. All the soil
characteristics interact with each other, and in particular, the biological components
and functions of soils depend on, and emerge from, the physical and chemical
components (Girvan et al., 2003). Microbial biomass plays a dual role in the soil: first,
it is essential for the organic matter decomposition with concurrent release of
nutrients, and second, it is a labile pool of nutrients for plants (Stevenson, 1994).
A complex array of physical, chemical, and biological interactions is involved
in soil organic matter decomposition, ensuring the completion of the biogeochemical
nutrient cycles (Robertson & Paul, 2000).
1.1.2 Soil functions
Soils provide the following basic functions, with the actual combinations and
relative individual importance depending on the specific function in question
(Nortcliff, 2002):
(i) Provide a physical, chemical and biological setting for living organisms
(ii) Regulate and partition water flow, storage and recycling of nutrients and
other elements
(iii) Support biological activity and diversity for plant growth and animal
productivity
(iv) Filter, buffer, degrade, immobilize and detoxify organic and inorganic
substances
(v) Provide mechanical support for living organisms and their structures
These basic soil functions are often combined to provide more general functions,
and soils usually perform several functions simultaneously. These functions refer to
the capacity of a soil to maintain soil ecosystem health (Nortcliff, 2002). The
multifunctional role of soil must be considered for any soil health evaluation. The
ability of soil to perform specific functions depends strongly on climatic conditions,
which vary among climatic zones, but climate also varies at any given location during
the year. Therefore, it is important to consider climate when defining soil health
(Bouma, 2002).
7
To characterize soil function, suitable indicators are necessary to understand the
causal relationship between the soil health indicators and the specific soil functions
under consideration, and to define soil properties. Several physical, chemical, and
biological indicators have been proposed to determine soil health and quality (Arias et
al., 2005).
1.1.3 Soil health
Soil is a reservoir of essential nutrients for plant growth and therefore soil health
is of great importance, particularly in agricultural soils. Soil health is defined as “the
continued capacity of soil to function as a vital living system, within ecosystem and
land-use boundaries, to sustain biological productivity, maintain the quality of air and
water environments, and promote plant, animal, and human health” (Doran et al.,
1996). The concept of soil health refers to the biological, physical and chemical
features which are imperative for long-term, sustainable agricultural productivity with
minimal environmental impact. The term soil health is not synonymous with soil
quality, and they should not substitute each other. Soil quality was defined as “the
capacity of a specific kind of soil to function, within natural or managed ecosystem
boundaries, to sustain plant and animal productivity, maintain or enhance water and
air quality, and support human health and habitation” (Karlen et al., 1997). The two
definitions may appear similar, but soil quality is related to soil functions, while soil
health presents the soil as a finite and dynamic living resource (Doran & Zeiss, 2000).
Due to the multifunctional nature of soil ecosystems, it is difficult to define a healthy
soil without first defining the targeted goals such as plant health, atmospheric balance,
or erosion avoidance. In the present work, plant health is defined as a specific target
goal or aim in order to define a healthy soil. Healthy soils maintain a diverse
community of soil organisms that can help to: (i) control plant diseases as well as
insect and weed pests; (ii) form beneficial symbiotic associations with plant roots (e.g.
nitrogen-fixing bacteria and mycorrhizal fungi); (iii) recycle plant nutrients; (iv)
improve soil structure with positive repercussions for its water- and nutrient-holding
capacity; (v) improve crop production (Arias et al., 2005).
One of the most important objectives in determining soil health is to acquire
indicators for evaluation of the current status of soil. Since soil function is very
complex, one unique indicator is not enough to assess soil health. Doran et al. (1996)

8
proposed a limited number of indicators to describe soil health. Indicators should (i)
encompass ecosystem processes and relate to process-oriented modeling; (ii) integrate
soil physical, chemical, and biological properties and processes; (iii) be accessible to
many users and applicable to field conditions; (iv) be sensitive to variations in
management and climate at an appropriate time-scale; and (v) when possible, be
components of existing soil databases.
The ability of soil to suppress plant diseases can result from several different
mechanisms: the pathogen (i) does not establish or persist, (ii) establishes but causes
little or no damage, or (iii) establishes and causes disease for a while but thereafter the
disease is less important, although the pathogen may persist in the soil (Baker & Cook,
1974). Given a susceptible host, disease suppression is the result of pathogen
suppression (Termorshuizen & Jeger, 2008). Two classical types of suppressiveness
are classified: specific and general suppression (Baker & Cook, 1974). Specific
suppression is caused by individual or selected groups of microorganisms and is
transferable, whereas general suppression is caused by multiple microorganisms and
is not transferable between soils (Weller et al., 2002). Suppressive soils have been
described for many soil-borne pathogens. Several soil-borne pathogens, such as
Fusarium oxysporum (the cause of vascular wilts), Gaeumannomyces graminis (the
cause of take-all disease in wheat), Phytophthora infestans (a cause of foliar disease),
Pythium spp. (a cause of damping-off), have been shown to be suppressible in certain
soils (Martin & Hancock, 1986; Alabouvette et al., 1993; Andrivon, 1994; Hornby et
al., 1998; Weller et al., 2002). The mechanisms by which soils are suppressive to
different pathogens can involve biotic (soil microflora) and/or abiotic factors (soil
physicochemical properties) (Garbeva et al., 2004). Generally, suppressive soils can
be considered as healthy soils (Janvier et al., 2007).
Some biological, physical, and chemical indicators have been used for
determining soil health, such as microbial biomass, microbial activity, carbon cycling,
nitrogen cycling, biodiversity and microbial resilience, bioavailability of contaminants,
and physical and chemical properties (Arias et al., 2005). The validation of the
relevance of the chosen abiotic or biotic indicators in several agronomic situations is
important when describing the soil health and soil suppressiveness (Janvier et al.,
2007).
9
1.1.4 Root and rhizosphere
Plant roots grow mostly within the soil and have wide-ranging, long-lasting
effects on plant populations both above and below ground, and hence are included in
soil biota. Although plant roots are generally considered as a relatively mundane
habitat, their examination revealed an extensive fungal diversity (Vandenkoornhuyse
et al., 2002).
Microbial growth is generally enhanced around plant roots, which is usually
assigned to rhizosphere effect. The rhizosphere, as originally conceived by Hiltner
(1904), was the narrow region of soil surrounding plant roots affected by the living
roots. It is a very dynamic environment where plants, soil, and microorganisms
interact. Plant root exudates are the main food source for microorganisms and the
driving force of their population density and activities (Raaijmakers et al., 2009).
Root exudates have been shown to increase the mass and activity of soil
microorganisms and fauna in the rhizosphere (Butler et al., 2003). Important
parameters, such as the quantity and the quality of available carbon compounds
originating from plants, as well as novel sites for microbial attachment discriminate
rhizosphere from bulk soil (Curl & Truelove, 1986).
Microorganisms in the rhizosphere play crucial roles in plant growth and health.
Microbial communities in the rhizosphere can have deleterious, beneficial, or neutral
effects on the plant. Microorganisms that adversely affect plant growth and health are
pathogenic fungi, oomycetes, bacteria and nematodes, whereas beneficial
microorganisms include mycorrhizal fungi, nitrogen-fixing bacteria, and plant growth
promoting rhizobacteria. Many microorganisms have a neutral effect on the plant, but
are part of the complex food web that utilizes the large amounts of carbon that is fixed
by the plant and released into the rhizosphere (i.e. rhizodeposits) (Raaijmakers et al.,
2009).
Rhizodeposition describes the total carbon transfer from plant roots to soil and
comprises water-soluble exudates, secretions, lysates from dead cells and mucilage
(Grayston et al., 1997). Plant roots may release massive amounts of organic
compounds via rhizodeposition, which ultimately may lead to benefits provided by
some microorganisms. Therefore, rhizodeposits play an important role in the
regulation of symbiotic and protective associations between plants and soil
microorganisms (Lambers et al., 2009).

10
The rhizosphere fungal community has been examined and saprotrophic fungi
with representatives from all major terrestrial phyla - Ascomycota, Basidiomycota and
Zygomycota have been identified (Gomes et al., 2003; Renker et al., 2004; Vujanovic
et al., 2007). The saprotrophic fungi of the rhizosphere may be involved in the
degradation of both simple root exudates and the more complex compounds in
sloughed-off root cells (Buée et al., 2009a).
Mycorrhizal interactions influence the species composition, diversity, and
stability of microbial communities. The area of soil under the influence of
mycorrhizal roots as opposed to non-mycorrhizal roots and extraradical mycelium
was defined as the mycorrhizosphere (Rambelli, 1973). The term “mycorrhizosphere”
was coined to describe the unique properties of the rhizosphere surrounding and
influenced by mycorrhizas (Linderman, 1988). Mycorrhizal fungi frequently stimulate
plants to reduce root biomass while simultaneously expanding nutrient uptake
capacity, by extending mycelium far beyond root surfaces and proliferating in soil
pores that are too small for root hairs to enter (Johnson & Gehring, 2007). Mycelial
networks of mycorrhizal fungi can connect plant root systems and soil particles over
broad areas. These fungi often comprise the largest portion of soil microbial biomass
(Olsson et al., 1999; Hogberg & Hogberg, 2002). Therefore, mycorrhizal symbioses
structure the physical and chemical composition in the rhizosphere, and impact the
biological communities and ecosystems.
1.2 Soil fungi
Soil fungi are an immensely diverse group of organisms, which exist in a wide
range of forms from the microscopic single-celled yeasts to large macrofungi. Fungi
are usually the most abundant component of the soil microorganisms in terms of
biomass (Lin & Brookes, 1999). In an ecological classification of the soil fungi, a
number of groups can be differentiated, such as obligate saprophytes, root inhabiting
fungi, mycoparasitic fungi, nematophagous fungi, and insect pathogenic fungi. The
specialized plant parasites, together with mycorrhizal fungi, have been grouped
together as root inhabiting fungi. The remainder of the root infecting fungi, together
with the obligate saprophytes, have been designated as soil inhabiting fungi (Garrett,
1950). The following introduction of soil fungi will be presented as a combination of
root inhabiting fungi and soil inhabiting fungi.

11
1.2.1 Taxonomic groups of soil fungi
Soil fungi comprise all major fungal phyla, Ascomycota, Basidiomycota,
Chytridiomycota, Glomeromycota, Zygomycota, and Oomycota (not true fungi)
(Webster, 1980).
The fungal group Ascomycota is characterized by the presence of an ascus, a
microscopic sexual structure in which nonmotile spores (ascospores) are formed.
However, some species of Ascomycota are asexual, and they do not form asci or
ascospores. Examples of Ascomycota include Fusarium sp., Aspergillus sp.,
Penicillium sp., and Trichoderma sp. Basidiomycota are filamentous fungi which
form hyphae (except for those forming yeasts) and reproduce sexually through the
formation of specialized basidia and basidiospores. However, some Basidiomycota
reproduce asexually, and may or may not also reproduce sexually. Examples are
Cryptococcus sp., Rhizoctonia sp., Rhodotorula sp., and Sistotrema sp.
Chytridiomycota (chytrids) is the only true fungi that reproduces with motile spores
(zoospores), which are typically propelled by a single, posteriorly directed flagellum
(James et al., 2006). These organisms are often referred to as chytrid fungi or chytrids.
The majority of chytrid species occur in terrestrial habitats (Barr, 2001) such as forest,
agricultural and desert soils, as saprotrophs of refractory substrata including pollen,
chitin, keratin and cellulose. Chytrids are also obligate parasites of a wide variety of
vascular plants in soil, such as potatoes (Synchytrium) and cucurbits (Olpidium).
Glomeromycota have generally coenocytic mycelia and reproduce asexually through
blastic development of the hyphal tip to produce glomerospores (Schussler et al.,
2001). The Glomeromycota, such as the members of the Glomus genus comprise
ubiquitous symbionts of a multitude of plants which form arbuscular mycorrhiza.
Zygomycota are able to reproduce both sexually and asexually. During sexual
reproduction, zygospores develop in zygosporangia following gametangial fusion.
Sexual reproduction is haploid-dominant, while asexual reproduction makes use of
aplanospores. With asexual reproduction, asexual spores called sporangiospores are
produced either endogenously in sporangia or exogenously. For example,
Conidiobolus sp. and Mortierella sp. Oomycota from the kingdom Chromista (or
Straminipila) are filamentous, fungus-like eukaryotic microorganisms, which
reproduce both sexually and asexually. Most of the oomycetes (syn.
peronosporomycetes) produce two morphologically distinct types of spores, which are
12
asexual, self-motile spores called zoospores, and the sexual spores called oospores.
The class oomycetes comprises organisms which resemble fungi with regard to both
morphological and physiological traits, but they are phylogenetically related to
diatoms, chromophyte algae and other heterokont protists (Dick et al., 1999). Notable
examples are Aphanomyces euteiches, Phytophthora infestans and Pythium ultimum.
1.2.2 Soil fungal life cycles
Composition and abundance of soil fungal communities can be influenced by
fungal life cycles and different forms of fungal structures in variable fungal phyla.
Fungi are present in soil as both actively growing organisms and as dormant
propagules (Warcup, 1951). The majority soil fungi are present as mycelium, sexual
or asexual spores, chlamydospores or sclerotial bodies (Bridge & Spooner, 2001).
Only mycelial states tend to have considerable metabolic activity, while the latter
stages are dormant survival structures with little activity and limited importance in
soil metabolism. For example, the life cycle of Aphanomyces euteiches includes
asexual and sexual stages that occur only in soil and allow an efficient dissemination
and conservation of the parasite. The infection of plant roots is initiated by oospore
germination in close vicinity of a plant host. Aphanomyces spp. can survive in soil as
oospores, which are generally associated with organic debris and are found primarily
in the plowed layer of soil (Pfender, 2001). Chlamydospores are the survival
structures of e.g. Fusarium solani and Fusarium oxysporum in naturally infested soil.
Pythium spp. are common soil inhabitants that persist in root debris as oospores or
thick-walled sporangia (Kraft & Pfleger, 2001). Phoma medicaginis var. pinodella
only produces pycnidiospores during the epidemic phase, but can survive in the
ground as the form of chlamydospores over a long period of time (Allard et al., 1993).
When analyzing soil fungal communities, it is important to consider that the
relative abundance of fungi may depend on the specific environment and stage in the
fungal life cycles at the time of sampling.
1.2.3 Role of fungi in the soil ecosystem
Soil fungi play fundamental roles in nutrient cycling processes in most
terrestrial ecosystems, notably through forming symbiotic associations such as

13
mycorrhiza with plants and through organic matter decomposition (Stajich et al.,
2009).
Soil fungi can be classified into two main general functional groups based on
the mode of nutrition: saprophytic fungi (living on dead organic matter) or symbiotic
fungi (living in association with a host in a mutual, pathogenic or parasitic relation).
Some fungi are obligate saprotrophs or symbionts, whereas others are facultative in
relation to energy supply.
Saprophytic fungi are decomposers that convert dead organic material into
fungal biomass, carbon dioxide (CO2), and small molecules such as organic acids.
There are many forms of dead organic matter, such as leaf litter, dung, dead animals,
and wood. Saprotrophic fungi generally obtain their nutrients by decomposing
recalcitrant organic residues with a high cellulose and lignin content (De Boer et al.,
2005). Moreover, saprotrophic fungi release nutrients that can also be used by other
soil living organisms, making the fungi vital to the health of soil ecosystems.
Arbuscular mycorrhiza (AM) and ectomycorrhiza (ECM) are two major types of
symbiotic plant-fungus associations. AM is the most common mycorrhizal type being
found associated with about 80% of all terrestrial plants, while ECM is formed by
only approximately 8,000 plants species (Smith & Read, 2008). AM fungi are obligate
biotrophs which colonize a wide range of land plant species and can be found in all
ecosystems. The presence of AM fungi at the interface between plant roots and soil
makes them an important functional group of soil fungi which strongly influences
ecosystem processes (Gianinazzi et al., 2010). AM fungi play a vital role in plant
phosphorus supply, whilst the host plant provides carbon assimilates reciprocally
(Smith & Read, 2008). AM fungi can protect the plants from pathogens (Whipps,
2004), and can influence plant growth traits (StreitwolfEngel et al., 1997).
Furthermore, AM fungal diversity can determine plant community structure,
ecosystem variability and productivity (van der Heijden et al., 1998). The beneficial
effects of AM fungi on plant performance and soil health are essential for the
sustainable management of agricultural ecosystems (Jeffries et al., 2003; Barrios,
2007).
The occurrence of pathogenic or parasitic fungi can cause reduced plant
production or even plant death when they colonize roots. Soil-borne pathogens can
result in economically important losses in a wide variety of plants. For example, the
genera Fusarium and Verticillium cause vascular wilt diseases and lead to a
14
particularly fast and effective killing of their hosts (Tarkka et al., 2008). AM fungi
and some root pathogens such as Aphanomyces euteiches, are biotrophs with similar
trophic requirements, but they show different functions (Graham, 2001).
The ecological roles of distinct fungi can be difficult to classify, as shifts in the
functionality of different species can occur in response to resource availability and
other variable factors (Termorshuizen & Jeger, 2008). For example, Fusarium sp.
displayed from parasitic to saprotrophic behavior in grassland systems differing
management regimes (Wilberforce et al., 2003). While functional groups remain a
powerful concept in describing the role of fungi in soil ecosystems, pathogens
however have the ability to switch growth strategies under different circumstances
(Kjøller & Struwe, 1992).
1.2.4 Soil fungal diversity
Soil microbial diversity comprises species diversity, genetic diversity, and
ecosystem biodiversity (Solbrig, 1991). Species diversity consists of two components:
the total number of species present (species richness) and the distribution of
individuals among species (species evenness or equitability) (Øvreås, 2000). The
concepts of species diversity were defined as: species diversity within and among
communities (α- and β-diversity), and total species diversity in a set of communities
(γ-diversity) (Whittaker, 1960; Whittaker, 1972). Diversity has been partitioned into
local diversity (α) and regional diversity (γ), with the two linked by the extent of
species composition variations over space (β) considering the relationship between
species diversity and scale (Godfray & Lawton, 2001). The relationship between the
three quantities has been described as additive (γ = + β) (Lande, 1996; Loreau,
2000).
A measure of species diversity should be nonparametric and statistically
accurate. Species richness, Shannon information, and Simpson diversity are the three
most commonly used nonparametric measures of species diversity (Lande, 1996).
Simpson index is a diversity index biased towards evenness (Magurran, 1988), while
Shannon index is more biased towards richness. Therefore, microbial diversity has
generally been compared using different indices to ensure that the diversity ordering
is robust. Futhermore, some classic indices of compositional similarity are sensitive to
sample size, especially for assemblages with numerous rare species, and are based
15
only on presence-absence data, thus accurate estimators for them are unattainable
(Chao et al., 2005). Estimators were proposed by Chao et al. (2005) for these indices,
which include the effect of unseen shared species, based on either (replicated)
incidence- or abundance-based sample data.
The resilience capacity of the soil is positively associated with the soil microbial
diversity (Arias et al., 2005). Microbial diversity is also considered as one of the main
components of soil suppressiveness to soil-borne diseases (Garbeva et al., 2004).
However, the relationship between soil biodiversity and disease suppression is unclear
and the assumption that the soil becomes more suppressive when diversity increases is
untested (Reeleder, 2003).
Soil is a habitat of high fungal diversity (Blackwell, 2011). Extensive studies
examined the fungal diversity in different soil types with various methods, such as
soil planted maize or potato with denaturing gradient gel electrophoresis (DGGE)
(Gomes et al., 2003; Manici & Caputo, 2009), or potato farm or forest soil or tallgrass
prairie soil with 454 pyrosequencing (Buée et al., 2009b; Jumpponen et al., 2010;
Lumini et al., 2010; Sugiyama et al., 2010). Generally, 454 pyrosequencing has a
much higher resolution than fingerprinting-based methods. Non-parametric index
Chao1 estimated that the OTU richness at 97% sequence similarity close to 2240 (±
360) in forest soil (Buée et al., 2009b), 1652 OTUs in other forest soils (Lim et al.,
2010), an average of 1,674 OTUs in organic and conventional potato farms
(Sugiyama et al., 2010). In these studies, forest soils and agricultural soils had
relatively similar fungal diversity based on the estimated number of OTUs. However,
the use of different primers, differences in the processing of sequences and the level
of detail reported make precise comparisons difficult.
Generally, previous studies showed that majority of fungi in soil belonged to
Dikarya (Ascomycota and Basidiomycota) (Buée et al., 2009b; Jumpponen et al.,
2010; Sugiyama et al., 2010). Buée et al. (2009b) found that 81% of the fungi in
forest soils belonged to the Dikarya, and identified the Agaricomycetes as the
dominant fungal class, and Ceratobasidium sp., Cryptococcus podzolicus, Lactarius
sp., and Scleroderma sp. as the most abundant species using primers from nuclear
ribosomal internal transcribed spacer-1 (ITS1). As the most abundant OTUs,
Jumpponen et al. (2010) identified Basidiomycota, Ascomycota, basal fungal lineages
and Glomeromycota in order of decreasing frequency in tallgrass prairie soil by
pyrosequencing of ITS2 region. Sugiyama et al. (2010) found most of the major
16
fungal phyla in potato fields including a variety of known potato fungal pathogens
(e.g., Alternaria spp., Ulocladium spp., Pythium ultimum and Alternaria solani) using
primers from ITS1 region. Obviously, the choice of primer and different environments
might have crucial influence on the study of soil fungal diversity.
Soil fungal diversity can be influenced by several factors, such as soil pH, soil
type, plant species, soil depth, and management strategies. Soil pH has a relatively
weak effect on fungal diversity compared to bacterial diverstity (Rousk et al., 2010).
Berg & Smalla (2009) reviewed that plant species and soil type cooperatively shape
the structure and function of microbial communities in the rhizosphere. Jumpponen et
al. (2010) found that the fungal community differed across vertical profiles, and
diversity estimator decreased with increasing depth. Organic potato farms showed a
slightly higher diversity and evenness within the fungal community compared with
conventional farming (Sugiyama et al., 2010). In conclusion, soil fungal diversity
varies under different circumstances. More studies of soil fungal diversity into
different angles will improve the understanding of the structure of soil fungal
communities.
1.3 Soil-borne pathogens
Soil-borne pathogens often become injurious, hampering plant root growth, and
reducing crop yield and quality substantially (Weller et al., 2002). Some of these
pathogens are especially challenging since they often survive in soil for several years
and each plant species is often susceptible to more than one pathogen (Fitt et al.,
2006). Many soil-borne fungi and fungus-like organisms persist in the soil under
unfavorable conditions for extended periods, because they produce resilient survival
structures such as melanized mycelium, chlamydospores, oospores, or sclerotia (Kraft
& Pfleger, 2001). It is difficult to predict, detect, and diagnose many plant diseases
caused by soil-borne pathogens before serious damage occurs. Generally, soil is a
complex environment, which makes it challenging to predict all the ongoing disease
dynamics.
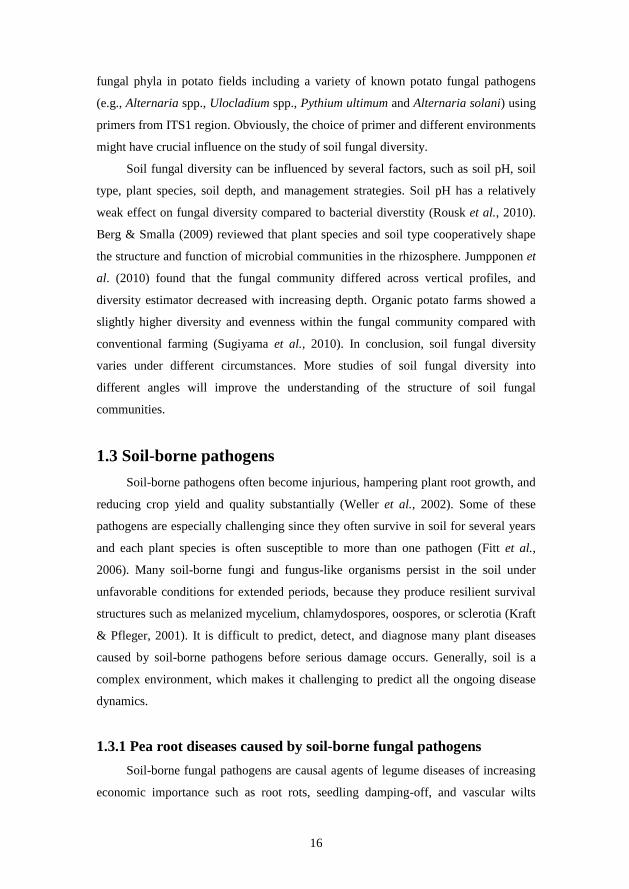
1.3.1 Pea root diseases caused by soil-borne fungal pathogens
Soil-borne fungal pathogens are causal agents of legume diseases of increasing
economic importance such as root rots, seedling damping-off, and vascular wilts
17
(Lichtenzveig et al., 2006). A root disease is the result of an interaction among the
pathogen, the host, and environmental conditions which are conducive to disease
development. Fungi are the most common causal agents of pea diseases (Kraft &
Pfleger, 2001). Field pea (Pisum sativum L.), grown for fodder and for human
consumption is subject to a number of soil-borne diseases the severity of which
increases in severity as pea cropping intensifies (Bødker et al., 1993a). These diseases,
commonly referred to as the pea root rot complex, are caused by single or multiple
pathogens, including Alternaria alternata, Aphanomyces euteiches, Fusarium
oxysporum f. sp. pisi, F. solani f. sp. pisi, Mycosphaerella pinodes, Phoma
medicaginis var. pinodella (formerly Ascochyta pinodella), Pythium spp., Rhizoctonia
solani, Sclerotinia sclerotiorum, and Thielaviopsis basicola (Bødker et al., 1993b;
Persson et al., 1997; Bretag et al., 2006; Gaulin et al., 2007). These pathogens, either
individually or in combination, cause symptoms such as seed decay, root rot, foot rot,
seedling blight, or wilt (Figure 1).
(a) (b)
Figure 1. Pea fields with diseased plants (a), and healthy plants (b) in Denmark 2008.
One of the most widespread and destructive diseases of pea is Aphanomyces
root rot caused by A. euteiches, also known as common root rot, which occurs most
frequently and severely in wet soils. Aphanomyces root rot has been recognized as a
serious soil-borne disease in several American states and in Europe (Allmaras et al.,
2003; Levenfors et al., 2003). The disease starts with the yellowing of root tissue. At a
later stage, infected roots become brown and the hypocotyl darkens at the soil line.

18
The pathogen infects the cortex of primary and lateral roots and oospores are formed
within the root tissues.
Fusarium root rot caused by F. solani can occur in conjunction with other root
diseases of pea such as Aphanomyces, Rhizoctonia, or Pythium root rot (Kraft &
Pfleger, 2001). Fusarium wilt of pea caused by F. oxysporum can often be severe
when short rotations with other crops are practiced (Kraft, 1994), eventually resulting
in wilted plants. Pea diseases caused by Pythium spp. are most often categorized as
damping-off, seed rot, or root rot (Martin & Loper, 1999). T. basicola causes
Thielaviopsis root rot, and the pathogen is widely distributed with an extensive host
range (Lucas, 1958). It causes a very characteristic black rot of the entire root system
and stem base. Severe infection can result in wilting of lower leaves and stunting of
plants (Bødker et al., 1993b). Diseases caused by Ascochyta spp. are characterized by
leaf, stem, and pod lesions as well as discoloration of the cotyledon, hypocotyl, and
root areas. In 1927, L. K. Jones clarified and described the disease symptoms and
mycological characteristics of the three Ascochyta species that cause diseases of pea:
Ascochyta pisi Lib., which causes leaf and pod spot; Mycosphaerella pinodes (Berk.
& Bloxam) Vestergr., the perfect stage of A. pinodes, which causes blight; and A.
pinodella, which is now designated as P. medicaginis var. pinodella (L. K. Jones)
Boerema, which causes foot rot (Bretag & Ramsey, 2001).
1.3.2 Interactions among fungal pathogens
Disease complex involving several different pathogenic species cause similar
symptoms on the same host plant. Co-occurring plant pathogens may interact with
each other through antagonism and/or synergism. Species utilizing the same resource
have the potential to affect each other in two main ways: antagonism, where one
pathogen has a negative effect on the development of the other, and synergism, where
one pathogen promotes the development of the other (Begon et al., 2006). Different
interaction mechanisms, such as competition for space or nutrients, altered host
susceptibility through induced resistance or toxin production by one pathogen
suppressing the development of the other, may result in different effects (Le May et
al., 2009).
Interactions among pathogens might be one of the major forces shaping
pathogen community structures, and hence the dynamics and severity of diseases in

19
the field. Le May et al. (2009) studied the effects of co-occurrence on the
development of pathogens and disease severity of pea using two pathogens (M.
pinodes and P. medicaginis var. pinodella), and showed that the presence of the two
pathogens on the same host plant organ limited the disease development and their
reproduction, however, damages increased by a subsequent inoculation of the other
pathogen. Also when pea roots are infected by Aphanomyces spp., other soil-borne
fungi are generally involved in the disease complex. When Aphanomyces spp. are
present at low or moderate inoculum levels, infection of roots by fungi such as
Fusarium or Pythium spp. can increase disease severity (Pfender, 2001). For example,
co-inoculation of pea seedlings with A. euteiches and a nonpathogenic isolate of F.
solani resulted in significantly greater disease severity of pea root rot than inoculation
with A. euteiches alone (Peters & Grau, 2002). Antagonism between pathogens and
other microorganisms can be exploited by the use of biocontrol agents to limit
diseases, see the following section.
1.3.3 Management of soil-borne pathogens
Management of soil-borne diseases requires comprehensive knowledge of the
pathogen, the host plant, and the environmental conditions that favor infection. A
better understanding of the pathogen-host-environment dynamics will assist in the
design of improved disease management strategies.
Generally, soil-borne disease control strategies include host resistance, cultural
control, chemical control and biological control. Disease-resistant cultivars are an
obvious and effective control method because resistance to pathogens can be long
lasting. A plant can express resistance through the action of a single gene that confers
immunity or through multiple genes that result in a broad resistance to many
pathogens. For example, differential cultivars resistant to different races of F.
oxysporum have been widely used (Kraft, 1994). Cultural control methods involve
two main aspects: reducing inoculum in the environment of the host plant, and
creating environmental conditions unfavorable for disease development. The use of
organic matter has been proposed, for both conventional and organic agriculture
systems, to decrease the incidence of plant diseases caused by soil-borne pathogens
(Bonanomi et al., 2007). Increased crop diversity in rotations can also reduce root
disease severity of field pea (Bailey et al., 2001; Lupwayi & Kennedy, 2007). Crop

20
management such as crop rotation, residue retention and sowing time, is the main
method used to reduce the severity of Ascochyta blight of field pea and to minimize
yield losses, although with varying degrees of success (McDonald & Peck, 2009).
Agricultural chemicals can sometimes be used to manage soil-borne pathogens, such
as pre-plant fumigants or fungicide-treated seeds. For example, Pythium control is
improved by planting seed that has been treated with a fungicidal seed protectant
(Kraft & Papavizas, 1983).
Biological control uses a natural antagonist of a pathogen in order to reduce the
level or prevalence of a disease (Baker, 1987). Biological control agents containing
viable antagonistic organisms can be used to combat pathogens. At present, only
cultural and prophylactic methods of disease management, such as crop rotation and
bioassay methods to detect any potential inoculum in soil before sowing, are
recommended for the control of Aphanomyces root rot (Vandemark et al., 2000).
Additionally, organic amendments applied to field soils were shown to confer control
of soil-borne diseases caused by A. euteiches (Lumsden et al., 1983; Fritz et al., 1995;
Stone et al., 2003). Also, microbial antagonists or plant beneficial microorganisms
can limit Aphanomyces root rot. For example, inoculation of soil with bacteria such as
Pseudomonas aureofaciens (Carruthers et al., 1994) or Burkholderia cepacia
(Heungens & Parke, 2000) was demonstrated to control A. euteiches infection.
Likewise, AM fungi are able to reduce development of pea root rot caused by A.
euteiches (Larsen & Bødker, 2001; Bødker et al., 2002; Thygesen et al., 2004).
Alabouvette et al. (2009) found that Pseudomonas spp. and Trichoderma spp.
are the two most widely studied groups of biological control agents against F.
oxysporum. In addition, non-pathogenic F. oxysporum strains can be used to control
wilt induced by pathogenic strains. However, the success of biological control
depends not only on plant-microbial interactions but also on the ecological fitness of
the biological control agents (Alabouvette et al., 2009). Some Rhizobium
leguminosarum bv. viceae strains have the potential for biological control of Pythium
damping-off of field pea (Bardin et al., 2004). A strain of Clonostachys rosea was
identified as a mycoparasite against most of the pathogens causing pea root rot
complex, and can be used as a biological control agent of pea diseases (Xue, 2003).
However, effective biological control requires careful matching of antagonists to
pathosystems (Cunniffe & Gilligan, 2011). In addition, control of soil-borne

21
pathogens can be achieved by disease-suppressive soils (Schroth & Hancock, 1982;
Weller et al., 2002).
1.4 Methods to study soil fungal diversity
Fungal species diversity comprises species richness, abundance, evenness, and
distribution (Trevors, 1998; Øvreås, 2000). Methods to measure microbial diversity in
soil can be categorized into classical techniques, biochemical-based techniques, and
molecular-based techniques (Kirk et al., 2004). In general, molecular-based methods
consist of DNA fingerprinting, microarray and sequencing techniques.
1.4.1 Classical and biochemical-based techniques
Classical and biochemical techniques include e.g. plate counts, sole carbon
source utilization patterns/community level physiological profiling (CLPP), and fatty
acid methyl ester (FAME) analysis.
1.4.1.1 Plate counts
Traditionally, the diversity of soil microbial communities has been assessed by
culturing techniques that use various culture media specific for different microbial
species. This method is relatively fast, inexpensive, and ensures that only the active,
heterotrophic component of the microbial population is examined. However, it may be
difficult to isolate microorganisms from soil particles, to select specific growth media
(Tabacchioni et al., 2000), and finally, many species are non-culturable using current
culture media formulations (Atlas & Bartha, 1998). All of these limitations can
influence estimations of microbial diversity.
1.4.1.2 Sole carbon source utilization patterns/community level physiological
profiling (CLPP)
The commercially available BIOLOG MicroPlate™ bacterial identification
system was introduced to assess the potential functional diversity of microorganisms
from environmental samples through sole source carbon utilization (SSCU) patterns
(Garland & Mills, 1991). The gram-negative (GN) or gram-positive (GP) plate for
bacteria contains 95 different carbon sources and one control well without a substrate.

22
Metabolism of specific substrates in particular wells results in a color change of
tetrazolium dye. Individual species may be identified based on the specific pattern of
color change on the plate, thus providing an identifiable metabolic fingerprint.
Though there are currently few reports of fingerprinting fungal communities,
fungal specific plates BIOLOG SF-N and SF-P, which contain the same carbon
sources as the corresponding GN or GP plates, can be used for assessment of fungal
activity (Dobranic & Zak, 1999; Buyer et al., 2001; Classen et al., 2003; Grizzle &
Zak, 2006). BIOLOG FF plates have been made available specifically for fungi, and
contain a different set of carbon substrates compared to GN and GP plates, and a
different tetrazolium dye that can be metabolized by fungi (Preston-Mafham et al.,
2002). A method based on the soil FungiLog method (Sobek & Zak, 2003) was
developed in order to evaluate soil fungal functional diversity by examining the
utilization of different N substances (Nitrolog) on the PM3 plate (Biolog Inc.)
(Grizzle & Zak, 2006).
The advantage of CLPPs are, that they can distinguish fungal communities, that
they are relatively simple and reproducible, and that they produce a large amount of
information on metabolic characteristics of the communities (Zak et al., 1994).
However, they can only be applied to culturable microorganisms, particularly fast-
growing microorganisms (Yao et al., 2000), and they reflect the potential, and not the
in situ, metabolic diversity (Garland & Mills, 1991).
1.4.1.3 Fatty acid methyl ester (FAME) analysis
Several studies showed that fungi differ in fatty acid composition with some
fatty acids being specific to certain groups of fungi (Muller et al., 1994; Stahl & Klug,
1996; Zelles, 1997; Kock & Botha, 1998; Larsen et al., 1998). Fatty acid methyl ester
(FAME) analysis provides information on the microbial community composition
based on the fact that different groups of fungi contain different fatty acids (Ibekwe &
Kennedy, 1998). Fatty acids constitute a relatively constant proportion of the cell
biomass and signature fatty acids exist that can differentiate major taxonomic groups
within a microbial community. However, FAME from whole soil may be derived not
only from living fungi, but also from dead cells, humic materials, as well as plant and
root exudates.
The separate measurement of neutral lipid fatty acids (NLFAs) and
phospholipid fatty acids (PLFAs) is very useful for interpretation of perturbation

23
effects on soil and compost microorganisms (Bååth, 2003). PLFAs are constituents of
biological membranes and can be used to estimate biomass of fungi since biovolume
and cell surface are well correlated (Tunlid & White, 1992). NLFAs serve as energy
reserves in many fungi including AM fungi and oomycete fungi, such as A. euteiches.
The NLFA/PLFA ratio has been suggested as an indicator of the fungal nutrient status
or physiological state (Tunlid & White, 1990).
Although FAME analysis does not rely on cultivation of microorganisms, this
method is fraught with limitations. Cellular fatty acid composition can be influenced
by factors such as growth conditions and environmental stresses, moreover, other
organisms can confound the FAME profiles (Graham et al., 1995). Frostegård et al.
(2011) reviewed the use and misuse of PLFA measurements in soils, such as PLFA
interpretation, the extent of turn-over of PLFAs in soil, and the flawed use of diversity
indices to evaluate PLFA patterns.
1.4.2 Molecular-based techniques: DNA fingerprinting and
microarray
Various molecular-based techniques to assess fungal communities in
environmental samples have been developed, and have contributed to a better
understanding of the role of fungi in ecological habitats. Initially, properties such as
guanine plus cytosine (G+C) content (Nusslein & Tiedje, 1999), DNA reassociation
(Torsvik et al., 1996), DNA-DNA and mRNA-DNA hybridization (Schramm et al.,
1996) were used to measure the microbial diversity. However, they are now largely
obsolete due to the emergence of higher-resolution DNA fingerprinting, microarray
and sequencing technologies. The majortity of the molecular techniques currently
used rely on polymerase chain reaction (PCR) (Figure 2).
Selection of PCR target for the required taxonomic resolution is important.
PCR-based methods targeting the ribosomal DNA gene have been extensively used to
investigate fungal communities (Kirk et al., 2004). Comprehensive diversity studies
can be performed using the nuclear small (the 18S rDNA subunit-SSU) or the large
(the 25S or 28S rDNA subunit-LSU) ribosomal DNA gene (Figure 3). They have
been used predominantly in phylogenetic studies to determine evolutionary
relationships between taxa, and these sequences provide critical information for
identifying environmentally amplified rDNA signals (Mitchell & Zuccaro, 2006).

24
These two regions have different levels of sequence variation. The nuclear small
subunit rRNA gene is the most conserved among rRNA genes, and therefore, has only
limited phylogenetic resolution beyond the family level (Horton & Bruns, 2001). The
nuclear large subunit rRNA gene is more variable, especially in domains D2 and D8
in the 28S (Hopple & Vilgalys, 1999), and provides adequate variation to discriminate
sequences at the genus level.
Figure 2. PCR-based approaches for analysis of environmental nucleic acids. DNA is
extracted from the environmental source and is subjected to PCR amplification to produce a
heterogeneous mixture of sequences. These are separated into individual molecules by
cloning or electrophoresis techniques (DGGE/TGGE-denaturing gradient gel
electrophoresis/temperature gradient gel electrophoresis; SSCP-single stranded
conformational polymorphism; (T-) RFLP-(terminal-) restriction fragment length
polymorphism; ARDRA-amplified rDNA restriction analysis; ARISA-amplified ribosomal
intergenic spacer analysis). The electrophoresis techniques give banding patterns that
represent the individually separated sequences, and these profiles can be used to characterize
the PCR-amplified DNA from the environment. They can be used to make diversity
assessments after the molecules have been identified by sequencing or by comparing
electrophoretic mobility of the fragments. The signals on the array and the number of
sequences can be used for estimation of diversity indices (modified from Mitchell & Zuccaro,
2006).
25
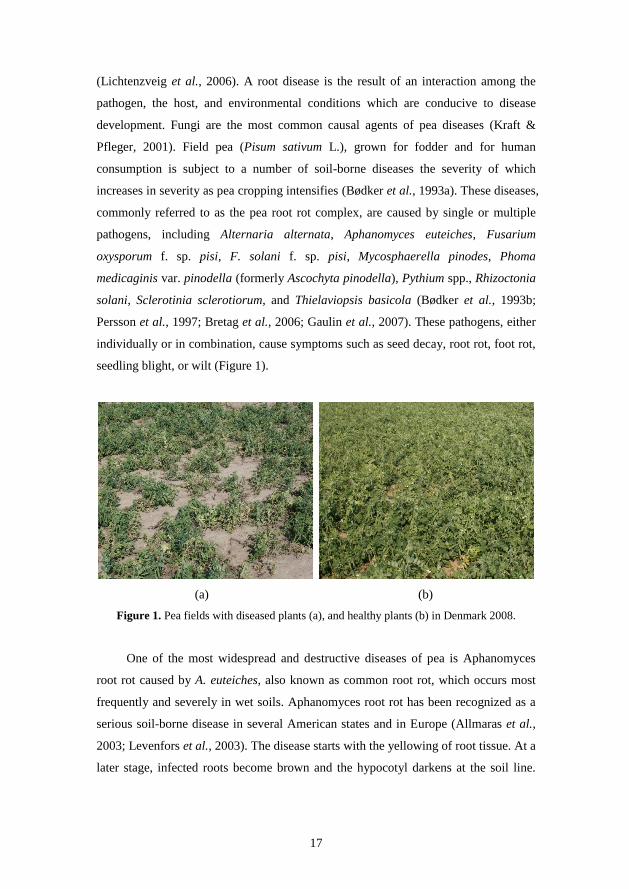
Figure 3. The ribosomal DNA gene cluster contains three main genes (5.8S, 18S, 28S),
interspersed between intergenic spacer (IGS), non-transcribed spacer (NTS), external
transcribed spacer (ETS) and internal transcribed spacer (ITS). The degree of sequence
conservation varies between these genetic regions and within the genes. Relative position of
some primers are as shown above (forward primers) or below (reverse). The 18S rDNA gene
is generally used to discriminate from kingdom to family level, whereas the variation in the
28S rDNA can be used to separate sequences from family to genus level. The ITS region is
highly variable and can most often be used as a DNA barcode for fungal identification at
species level.
Larger sequence variation is required to identify environmental samples at the
species, strain or biovar level. To date, the internal transcribed spacer regions (ITS
regions 1 and 2), which display a large sequence and size variation, have been
validated as a suitable DNA barcode marker for the identification of fungal species
(Seifert, 2008; Seifert, 2009). This nuclear region, which is well-known in molecular
ecology and fungal systematics, is located between the SSU and LSU rRNA genes
and contains two noncoding spacer regions separated by the 5.8S rRNA gene. In fungi
it is typically about 650-900 bp in size, including the 5.8S gene. ITS can be used to
identify sequences at the species level, and even strain level, depending on the
taxonomic group. The variability is due to indels, repetitions, and nucleotide
substitutions, which, however, increase the difficulty of alignments and subsequent
phylogenetic analysis (Bruns, 2001). Moreover, recently evolved species might not
have enough variability within the ITS regions to be identified at the strain or biovar
level.
The most commonly used primers for fungal ITS amplification are the universal
primer pair-ITS1 and ITS4 (White et al., 1990; Gardes et al., 1991), or the fungal
specific-ITS1F (Gardes & Bruns, 1993) and ITS4. In contrast to ITS1F, ITS1
amplifies oomycetes, but can also co-amplifies plant ribosomal sequences. In order to

26
reduce co-amplification bias, specific primers have been designed for specific groups
of fungi, such as ITS4A for ascomycetes (Larena et al., 1999), ITS4B for
basidiomycetes (Gardes & Bruns, 1993), and primer set NSI1 and NLB4 for
Dikaryomycota (Martin & Rygiewicz, 2005).
1.4.2.1 Denaturing gradient gel electrophoresis (DGGE)/temperature gradient
gel electrophoresis (TGGE)
Denaturing gradient gel electrophoresis (DGGE) and temperature gradient gel
electrophoresis (TGGE) are two similar methods for studying microbial communities
(Muyzer et al., 1993). They utilize either a chemical or temperature gradient to
denature the sample as it moves across a polyacrylamide gel. DGGE and TGGE can
be applied to nucleic acids such as DNA and RNA, and less commonly to proteins.
Mixtures of PCR products with the same length differing only in sequence can be
separated by this technique. This method has the strength of being applicable to
multiple parallel samples concurrently, which enables the study of changes in
microbial populations from natural ecosystems (Muyzer, 1999). Another main
advantage is that they provide the possibility to further analyze sequences from
fingerprints using molecular methods, and thus to identify individual bands
(Valaskova & Baldrian, 2009). However, some limitations can influence the final
results, such as variable extraction efficiency of DNA (Theron & Cloete, 2000) and
amplification bias (von Wintzingerode et al., 1997). Additionally, one band may not
necessarily represent one species (Gelsomino et al., 1999), and one species may result
in multiple bands (Niemi et al., 2001).
1.4.2.2 Single strand confirmation polymorphism (SSCP)
Single strand confirmation polymorphism (SSCP) also relies on electrophoretic
separation based on differences in DNA sequences under certain experimental
conditions. Single-stranded DNA molecules are separated based on differences in
their secondary structures (Lee et al., 1996). When DNA fragments are of same size
and denaturant is absent, folding, and thus mobility, will be dependent on the DNA
sequences. As an example, SSCP has been used to study mycorrhizal fungi in roots
(Simon et al., 1993; Kjøller & Rosendahl, 2000). This technique has the same
limitations as DGGE, as one sequence may be represented by more than one band on

27
the gel due to the variant folding of single-stranded DNA molecules (Tiedje et al.,
1999).
1.4.2.3 Restriction fragment length polymorphism (RFLP)/amplified ribosomal
DNA restriction analysis (ARDRA)/terminal restriction fragment length
polymorphism (T-RFLP)/ribosomal intergenic spacer analysis (RISA)/
automated ribosomal intergenic spacer analysis (ARISA)
Restriction fragment length polymorphism (RFLP) also known as amplified
ribosomal DNA restriction analysis (ARDRA) detects differences in the localization
of restriction sites in DNA sequences. In the case of community analysis, the DNA
sample is digested by restriction enzymes and the resulting restriction fragments are
separated according to their lengths by gel electrophoresis (Liu et al., 1997). Terminal
restriction fragment length polymorphism (T-RFLP) uses a similar principle as RFLP
with the exception that one PCR primer is labeled with a fluorescent dye. This
technique for profiling of microbial communities is based on the position of the
restriction site closest to a labeled end of an amplified gene. A mixture of PCR
amplified variants of a single gene is digested using one or more restriction enzymes,
and the individual resulting terminal fragments are separated and detected using a
DNA sequencer. This technique has been widely used for describing fungal species
richness and structure (Brodie et al., 2003; Avis et al., 2010) and for identifying
species in a community (Buchan et al., 2003). T-RFLP has a relatively high resolution,
however, it may overestimate the diversity due to incomplete digestion by restriction
enzymes (Osborn et al., 2000). Moreover, different species have different gene copy
numbers, which could bias the results (Liu et al., 1997).
Ribosomal intergenic spacer analysis (RISA) and automated ribosomal
intergenic spacer analysis (ARISA) are similar in principle to RFLP and T-RFLP.
These methods separate sequences differing in length, thus providing ribosomal-based
fingerprinting of microbial communities. ARISA has become a commonly used
molecular technique for the study of microbial populations in environmental samples.
It has been used to examine and compare the composition of fungal communities
associated with different ecological samples (Ranjard et al., 2001; Torzilli et al., 2006;
Gillevet et al., 2009; Slabbert et al., 2010). ARISA is a relatively high-resolution,
highly reproducible and robust method for assessing and discriminating between
microbial communities.
28
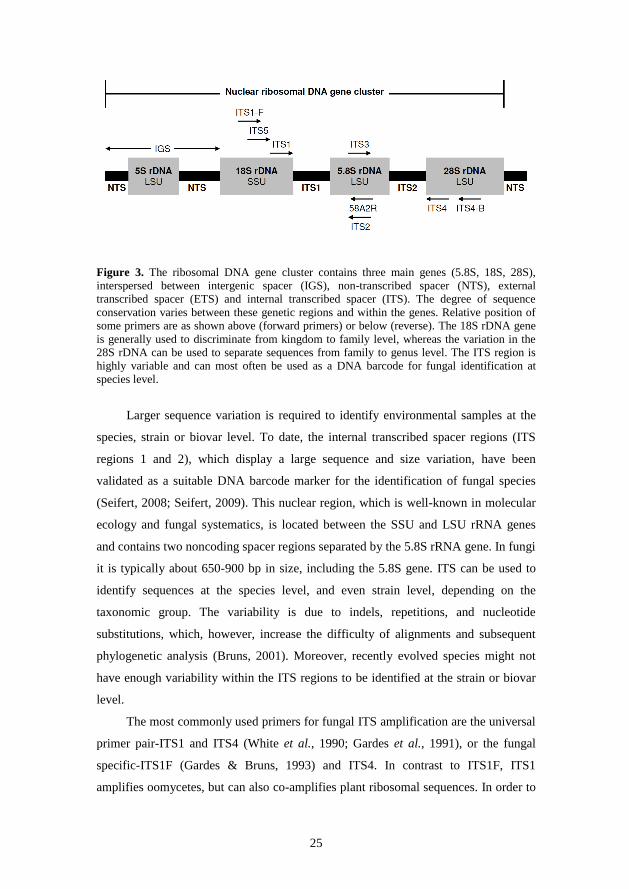
1.4.2.4 DNA microarray
A DNA microarray (also commonly known as gene chip, DNA chip, or biochip)
consists of an array of DNA spots attached to a solid surface. Each DNA spot contains
a specific DNA sequence, known as probes, which are used to hybridize to a target of
DNA, cDNA or cRNA from e.g. an environmental sample. Since an array can contain
tens of thousands of probes, a microarray experiment can test for multiple species in
parallel.
Microarrays have been developed to accommodate many types of studies.
Microbial diagnostic microarrays for microbial community analysis have been
classified into three main categories based on the nature of probe and target molecules
(Zhou, 2003). They are (i) phylogenetic oligonucleotide microarrays (phylochips)
with short oligonucleotides designed against a phylogenetic marker gene, (ii)
functional gene arrays (FGAs) using gene fragments or oligonucleotides targeting
genes with the function of interest as probes, and (iii) community genome arrays
(CGAs) employing whole bacterial genomes as probes. Microbial diagnostic
microarrays represent a powerful tool for the parallel, high-throughput identification
of many microorganisms (Bodrossy & Sessitsch, 2004; Sessitsch et al., 2006). One
major problem of the microarray technique is cross-hybridization between closely
related species and features on the array, however, cross-hybridization quickly
decrease as sequence identities decrease (Shiu & Borevitz, 2008).
Phylochips and FGAs have been widely used to study dynamics and functions
of bacterial communities, and fungal phylochips have mostly been employed for
examining pathogenic fungi (Lievens et al., 2003; Tambong et al., 2006) and fungi in
compost communities (Hultman et al., 2008). Finally, phylochips have the limitation
that they only detect those taxa for which probes are available.
1.4.3 Sequencing techniques
Sequencing techniques rely on the identification of taxa on the basis of sequence
information from e.g. the ITS region. Sequencing can be divided in two main
approaches: cloning followed by Sanger sequencing and the more recent approach of
high throughput sequencing technologies.

29
1.4.3.1 Sanger sequencing
To be able to sequence individual amplicons, Sanger sequencing technology
(Sanger & Coulson, 1975) for studying microbial communities involves cloning of the
amplicons in suitable vectors, typically in bacterial cells, thereby putting a limit on the
number of individuals that can be identified. Large-scale Sanger sequencing has been
used to analyze soil fungal community and in one such study ~1,000 fungal sequences
were obtained (O'Brien et al., 2005). The cloning step and subsequent sequencing are
laborious and expensive. Furthermore, lower intensities and missing termination
variants may lead to sequencing errors accumulating toward the end of long
sequences (Kircher & Kelso, 2010).
1.4.3.2 Next generation sequencing-454 pyrosequencing
Next generation of non-Sanger-based high-throughput sequencing technologies
has advanced DNA sequencing at an unprecedented speed, thereby revolutionizing
today‟s biology (Schuster, 2008). Next-generation sequencing (NGS) technologies
include several sequencing platforms, such as 454 sequencing (used in the 454
Genome Sequencers, Roche Applied Science; Basel), Solexa technology (used in the
Illumina (San Diego) Genome Analyzer), the SOLiD platform (Applied Biosystems;
Foster City, CA, USA), the Polonator (Dover/Harvard), the HeliScope Single
Molecule Sequencer technology (Helicos; Cambridge, MA, USA), the Pacific
Biosciences real-time sequencing (Pacific Biosciences; Menlo Park, CA, USA) and
the Ion semiconductor sequencing (Ion Torrent Systems Inc.; Guilford, CT, San
Francisco, CA & Beverly, MA) (Shendure & Ji, 2008; Metzker, 2010; Rusk, 2011).
454 pyrosequencing, is one of the leading techniques supplanting Sanger sequencing
for comparative genomics and metagenomics, and was the first next-generation
sequencing platform available as a commercial product (Margulies et al., 2005). 454
pyrosequencing provides new solutions to the three bottlenecks - sample preparation,
library construction, sequencing, therefore ensuring overall simplification of the
tedious procedure of Sanger sequencing. It uses a large-scale parallel pyrosequencing
system with the ability to sequence approximately roughly 400-600 megabases of
DNA per 10-hour run on the Genome Sequencer FLX instrument (Figure 4). The
longer read length of 454 pyrosequencing is preferable to the other NGS methods for
fungal identification.

30
The rapid development of 454 pyrosequencing technology and its capability to
sequence any double-stranded DNA has led to its application in a broad range of
different research fields, including de novo whole genome sequencing, re-sequencing
of whole genomes and target DNA regions, metagenomics and transcriptomic analysis
(Table 1). Whole genome sequencing is to sequence the entire genome of an organism,
for example, humans, other animals, or microorganisms such as fungi, bacteria, or
viruses (Green et al., 2008). Amplicon (ultra deep) sequencing aims to detect
mutations at extremely low levels, and target amplified specific DNA regions for
assessments of microbial community diversity (Jumpponen et al., 2010).
Transcriptome sequencing enables small RNA profiling and discovery, analysis of
full-length mRNA transcripts, and mRNA transcript expression analysis (full-length
mRNA, expressed sequence tags (ESTs) and ditags, and allele-specific expression).
Transcriptome sequencing has advanced the study of various areas, including the
discovery of novel genes, single nucleotide polymorphisms (SNPs),
insertions/deletions and splice-variants, the identification of gene space in novel
genomes, the assembly of full-length genes (Barbazuk et al., 2007; Franssen et al.,
2011). Metagenomics is the study of the genomic content in a complex sample. This
approach aims to characterize all the organisms present in a sample and to identify the
function of each organism within a specific environment. Metagenomic samples can
be taken from any ecological niche depending on the research question and have been
taken from the human body, soil samples, extreme environments like deep mines and
the various layers within the ocean (Handelsman, 2004).

31
Figure 4. Overview of the 454 sequencing technology. (a) Genomic DNA is isolated,
fragmented, ligated to adapters and separated into single strands. (b) Fragments are bound to
beads under conditions that favor one fragment per bead, the beads are isolated and
compartmentalized in the droplets of a PCR-reaction-mixture-in-oil emulsion and PCR
amplification occurs within each droplet, resulting in beads each carrying ten million copies
of a unique DNA template. (c) The emulsion is broken, the DNA strands are denatured, and
beads carrying single-stranded DNA templates are enriched (not shown) and deposited into
wells of a fiber-optic slide. (d) Smaller beads carrying immobilized enzymes required for a
solid phase pyrophosphate sequencing reaction are deposited into each well. (e) Scanning
electron micrograph of a portion of a fiber-optic slide, showing fiber-optic cladding and wells
before bead deposition. (f) The 454 sequencing instrument consists of the following major
subsystems: a fluidic assembly (object i), a flow cell that includes the well-containing fiber-
optic slide (object ii), a CCD camera-based imaging assembly with its own fiber-optic bundle
used to image the fiber-optic slide (part of object iii), and a computer that provides the
necessary user interface and instrument control (part of object iii) (from Rothberg & Leamon,
2008).

32
Pyrosequencing of ribosomal RNA amplicons (pyrotags), in particular ITS
rDNA amplicons for fungi, has been applied for profiling the phylogenetic diversity
within microbial communities. The ITS region is widely used for identification of
fungi due to the relatively high variability combined with the flanking conserved
regions (18S and 28S) for primer annealing (Begerow et al., 2010). The ITS region
was tested for its feasibility for characterization of fungal communities using
pyrosequencing, and further, it was validated that the ITS1 region with an average
length of approximately 250 bp proofed adequate for identification of fungi at genus
or even at species level (Nilsson et al., 2009a).
Table 1. Applications using the novel 454 pyrosequencing technique.
Application Research project Reference
Bacterial genome sequencing Mycobacterium tuberculosis (Andries et al., 2005)
Human whole genome
sequencing Homo sapiens (Wheeler et al., 2008)
Metagenomics Microbial community in deep mine (Edwards et al., 2006)
Transcriptome mRNA trancript from Arabidopsis (Weber et al., 2007)
Genome structure Variation in human genome (Korbel et al., 2007)
Amplicon analysis Forest soil fungal community (Buée et al., 2009b)
454 pyrosequencing is still relatively expensive, therefore, methods have been
developed to enable the pooling of several samples in one sequencing reaction.
Tagged PCR primers enable the assignment of DNA sequences in a sequenced pool to
the correct sample once sequencing anomalies are accounted for (miss-assignment
rate < 0.4%). Therefore, the method enables accurate sequencing and assignment of
DNA sequences from multiple sources in a single run, thus reducing expenses
(Binladen et al., 2007) (Figure 5).

33
Figure 5. Structure of an MID containing PCR fragment (Eurofins MWG Operon, Ebersberg,
Germany). Primer A and Primer B are forward and reverse fusion-primers for pyrosequencing.
Depending on the sequencing needs, MID on forward and reverse fusion-primer may be
identical or different. When sequencing from both sides, identical MIDs are recommended for
each PCR fragment. The sequencing key (TCAG) is recognizable by the system software and
the priming sequences. Multiplex Identifiers (MIDs) are used to label the targeted primers.
Treatment of pyrosequencing data generally involves several steps: quality
control, sequence clustering, BLAST (Basic Local Alignment Search Tool) for
identification of individual clusters and subsequent statistical analysis. To date,
methods for prokaryotes have been leading the way in this regard and various
streamlined software pipelines are available. Open-source as well as web-accessible
software packages such as the Ribosomal Database Project (RDP) (Maidak et al.,
2001), Greengenes (DeSantis et al., 2006b), Mothur (Schloss et al., 2009), and
Quantitative Insights Into Microbial Ecology (QIIME) (Caporaso et al., 2010b), have
been developed and are now widely used for microbial community analysis.
Unfortunately, many methods developed for prokaryotes are not appropriate for fungi.
The ITS region is highly variable among fungal species, making it difficult for a
proper alignment of sequenced ITS regions, and thus impacts the discrimination of
fungal species.
Besides self-developed sets of tools (Taylor & Houston, 2011), a variety of
software packages can be used to accomplish reliable quality control of
pyrosequencing data properly. The Lucy DNA sequence quality and vector trimming
tool (Chou & Holmes, 2001) can be used to clean raw sequences. SeqTrim is a high-
throughput pipeline for pre-processing any type of sequence reads, including next-
generation sequencing (Falgueras et al., 2010). To remove bad quality reads,
PyroNoise and AmpliconNoise can be applied to model sequencing noise from the

34
flowgrams using a distance measure (Quince et al., 2009; Quince et al., 2011).
Software specifically developed to detect 16S rRNA gene chimeras is not appropriate
for fungal ITS sequences (Huber et al., 2004; Ashelford et al., 2006).
There are many software packages available for multiple sequence alignment,
such as ClustalW (Larkin et al., 2007), MAFFT (Katoh et al., 2002), MUSCLE
(Edgar, 2004), T-Coffee (Notredame et al., 2000), NAST (DeSantis et al., 2006a),
PyNAST (Caporaso et al., 2010a), or the pairwise alignment program ESPRIT (Sun et
al., 2009). The choice depends on the scalability, speed, and accuracy desired with the
increasing amounts of sequence data, if many sequences are analyzed, alignment may
not be possible or in some cases alignment is difficult (e.g. ITS region).
Various approaches for generating operational taxonomic units (OTUs) have
been selected for different studies, such as BLASTclust (Dondoshansky, 2002) for
forest soil (Buée et al., 2009b), CAP3 (Huang & Madan, 1999) for tallgrass prairie
soil (Jumpponen et al., 2010), CD-HIT for an arable soil (Rousk et al., 2010), and
TGICL (Pertea et al., 2003) for tropical mycorrhizal fungi (Tedersoo et al., 2010),
respectively. Moreover, more recent clustering methods are available, such as
UCLUST (Edgar, 2010) and SEED (Bao et al., 2011).
The most widely used approach to identify fungal taxa represented by OTUs is
BLAST-based similarity searches (Altschul et al., 1997) in Genbank (Benson et al.,
2011). Moreover, open-source software exist (Nilsson et al., 2009b) and custom
curated databases are available now, such as UNITE (Kõljalg et al., 2005) and FESIN
(http://www.bio.utk.edu/fesin/title.htm).
For the subsequent statistical analyses, several programs exist for different
purposes, such as Analytic Rarefaction v1.3 for rarefaction analyses (Hunt Mountain
software, Department of Geology, University of Georgia, Athens, GA, USA),
EstimateS for diversity analyses (Colwell & Coddington, 1994), PC-ORD, PRIMER,
or Vegan for community ordination analyses (McCune & Mefford, 1999; Clarke &
Warwick, 2001; Oksanen et al., 2007), and UniFrac or Phylocom for phylogenetic
community analyses (Lozupone & Knight, 2005; Webb et al., 2008).
Newly developed web-based pipelines for processing fungal pyrosequencing
data such as CLOTU (http://www.bioportal.uio.no) (Kumar et al., 2011), SCATA
(scata.mykopat.slu.se), PlutoF (http://unite.ut.ee), and Metagenomics of Alaskan
Fungi (http://www.borealfungi.uaf.edu), have provided different ways of sequence
clustering and identification.

35
Although pyrosequencing technology has enabled significant progress in the
describing and comparing of complex microbial communities, some aspects are still
challenging and conclusions should be drawn with great caution. In the process of
generating sequence data, besides the commonly known biases in DNA extraction
(Feinstein et al., 2009) and PCR amplification (Meyerhans et al., 1990), several other
different steps can introduce various types of incompletely understood biases.
Above all, the choice of primer, particularly for studying fungal communities, is
critical. Some of the ITS primers appear to introduce taxonomic biases during PCR,
such as ITS1-F, ITS1 and ITS5, which were biased towards amplification of
basidiomycetes, whereas others, e.g. ITS2, ITS3 and ITS4, were biased towards
ascomycetes (Bellemain et al., 2010). Therefore, different primer combinations or
different parts of the ITS region should be analyzed in parallel, and identification of
alternative ITS primers would be advisable (Bellemain et al., 2010).
Pyrosequencing error is another challenge for the assessment of microbial
communities (reviewed by Kircher & Kelso, 2010). Many rare OTUs correspond to
low-abundance taxa that comprise the rare biosphere, i.e. the long tail of the species
abundance distribution (Pedros-Alio, 2007). The majority of low-quality reads
represent the accumulation of small sequencing errors (Reeder & Knight, 2009),
which can lead to artificial inflation of diversity estimates unless relatively stringent
read quality filtering and low clustering thresholds are applied, such as the use of
quality trimming to 0.2% error probability and a clustering threshold of 97% identity
which was used for bacterial studies (Kunin et al., 2010). Tedersoo et al. (2010) also
established 97% sequence similarity of the ITS region as a barcoding threshold for
fungal species. Depth of sequencing is also one of the most pressing aspects, as the
number of required sequences varies from different target regions (Anderson et al.,
2003) and the complexity of the sample. Alignment quality, distance calculation
method, and clustering accuracy (Huse et al., 2010) have a profound effect on
downstream analysis, and hence impact the interpretation of microbial analyses
(Schloss, 2010). In addition, there is concern regarding the relative read abundance
counts when quantifying microbial communities with 454 pyrosequencing. It has been
shown that read abundance is approximately quantitative within species, but between-
species comparisons can be biased by innate sequence structure (Amend et al., 2010a).
Another major limitation in investigating fungal diversity in environmental
samples is a feature of databases, in which large quantities of unidentified and
36
misidentified sequences hinder the utility of BLAST searches. In Genbank, about 20%
of the fungal DNA sequences may be incorrectly identified to species level, and the
majority of sequences lack descriptive and up-to-date annotations (Nilsson et al.,
2006). Despite the availability of pipelines and curated databases, automated BLAST
can also lead to misinterpretation because the representative sequence of each cluster
for BLAST search and the highest-ranked BLAST hits may not be optimal. 454
pyrosequencing requires faster and more powerful computational resources than
Sanger sequencing. Furthermore, metagenomic analysis of microbial communities is
based on the inference from our existing knowledge, thus the uncharacterized species
will hamper in-depth understanding (Hugenholtz & Tyson, 2008).
Despite these limitations, pyrosequencing technologies hold great promise for
comprehensive community analyses and contribute a significant and growing impact
on the understanding of the dynamics and mechanisms of microbial communities in
ecosystems, which will further our understanding of microorganisms and their
important roles.
Concluding remarks:
To date, there is no settled criterion for analyzing environmental next-
generation sequencing data, because many steps of the processing and analysis are
still tentative and differ depending on the scope of the study. However, a proposal on
how NGS studies of fungal communities should be reported and disseminated to the
scientific community has been described (Nilsson et al., 2011). The following
questions have to be considered when analyzing NGS data of fungal communities.
1. Is the initial sequence trimming, filtering, and de-noising good enough to
proceed? How to set the threshold for the processing?
2. How to handle singletons?
3. Is multiple alignment needed/feasible? Which program is more appropriate for
the sequence data at hand?
4. Does the chosen clustering program generate high quality output?
5. Which sequence should be selected as a representative for a given OTU for
BLAST searches? -the longest or randomly selected sequences within each
cluster?
6. What database should be used for taxonomic assignment - a reference database
or a public database or a combination of both? Are the results credible?

37
7. How to interpret the data so as to answer the research questions?
8. Are the results quantitatively or qualitatively comparable to other published
findings?
1.5 Motivation and objectives
Soil health is one of the basic requirements for plant production in agricultural
systems. The balance between pathogenic and beneficial populations forms an
important element in the determination of soil health. Both abiotic and biotic
indicators have been proposed to estimate soil health (Janvier et al., 2007). Most soil-
borne diseases, such as plant root rot, are caused by fungi or fungus-like organisms,
emphasizing the importance of studying soil fungal communities in relation to
improving soil health. Fungal soil-borne pathogens are deleterious and can survive in
soil for a long time. These pathogens often occur together, which can significantly
intensify the disease severity. Furthermore, the complexity of the soil environment
makes it challenging to comprehend all diseases dynamics.
Several technologies have been applied for the study of fungal communities.
Cultivation has several drawbacks as different fungi have different growth rates and
growth requirements, some fungi cannot easily be identified by their morphology, and
many fungi cannot be cultured in vitro in the first place (O'Brien et al., 2005). To
overcome these difficulties, molecular techniques have become widely used.
Approaches such as DGGE and Sanger sequencing of cloned PCR products have been
among the preferred methods. However, these methods lack resolution (DGGE) or are
very costly and time-consuming (Sanger sequencing). The development of next-
generation sequencing, particularly 454 deep amplicon sequencing (Margulies et al.,
2005), offers new opportunities for the study of soil fungal communities as high
numbers of individuals can be analyzed without the need for cloning. Moreover, the
use of tagged primers allows the pooling of several samples, thus reducing costs and
increasing sample throughput (Binladen et al., 2007).
In this project, the following hypotheses have been tested:
1. Fungal community profiling by pyrosequencing can be used to characterize
soil health, and soil-borne fungal pathogens can be detected in the bulk soil by
pyrosequencing.

38
2. The fungal communities differ among soils where plants show symptoms of
disease and soils where plants are healthy.
3. Fungal communities differ among plant roots, rhizosphere and bulk soil, and
differences in fungal communities can be found between diseased and healthy
plants in the three environments, respectively.
4. Certain soil fungi can be used as soil health indicators.
The overall objectives of the project were:
1. To test the feasibility of pyrosequencing for studying soil fungi in relation to
root health.
2. To characterize fungal communities along a soil health gradient in pea field
soils and to assess the possibility of certain soil fungi to be used as soil health
indicators.
3. To profile the fungal communities in plant roots, the rhizosphere, and the
surrounding bulk soil in relation to root health.

39
2 Paper I
Influence of DNA extraction and PCR amplification on studies of soil
fungal communities based on amplicon sequencing
Lihui Xu, Sabine Ravnskov, John Larsen, and Mogens Nicolaisen
L.H. Xu, S. Ravnskov and M. Nicolaisen. Department of Agroecology, Faculty of
Science and Technology, Aarhus University, Forsøgsvej 1, 4200 Slagelse, Denmark
E-mail: [email protected]; [email protected]
J. Larsen. Centro de Investigaciones en Ecosistemas, Universidad Nacional
Autónoma de México, Antigua Carretera a Pátzcuaro 8701 Col. Ex Hacienda de San
José de la Huerta, C.P. 58190 Morelia, Michoacán, México
E-mail: [email protected]
Corresponding author: Mogens Nicolaisen
Tel.: +45-8715 8137; Fax: +45-8715 6082
E-mail: [email protected]
(Accepted by Canadian Journal of Microbiology)
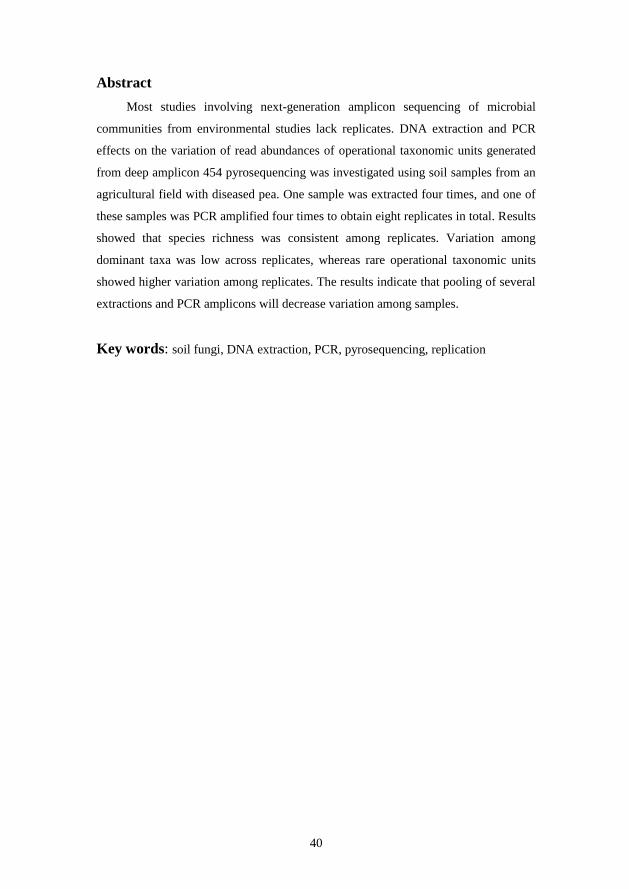
40
Abstract
Most studies involving next-generation amplicon sequencing of microbial
communities from environmental studies lack replicates. DNA extraction and PCR
effects on the variation of read abundances of operational taxonomic units generated
from deep amplicon 454 pyrosequencing was investigated using soil samples from an
agricultural field with diseased pea. One sample was extracted four times, and one of
these samples was PCR amplified four times to obtain eight replicates in total. Results
showed that species richness was consistent among replicates. Variation among
dominant taxa was low across replicates, whereas rare operational taxonomic units
showed higher variation among replicates. The results indicate that pooling of several
extractions and PCR amplicons will decrease variation among samples.
Key words: soil fungi, DNA extraction, PCR, pyrosequencing, replication
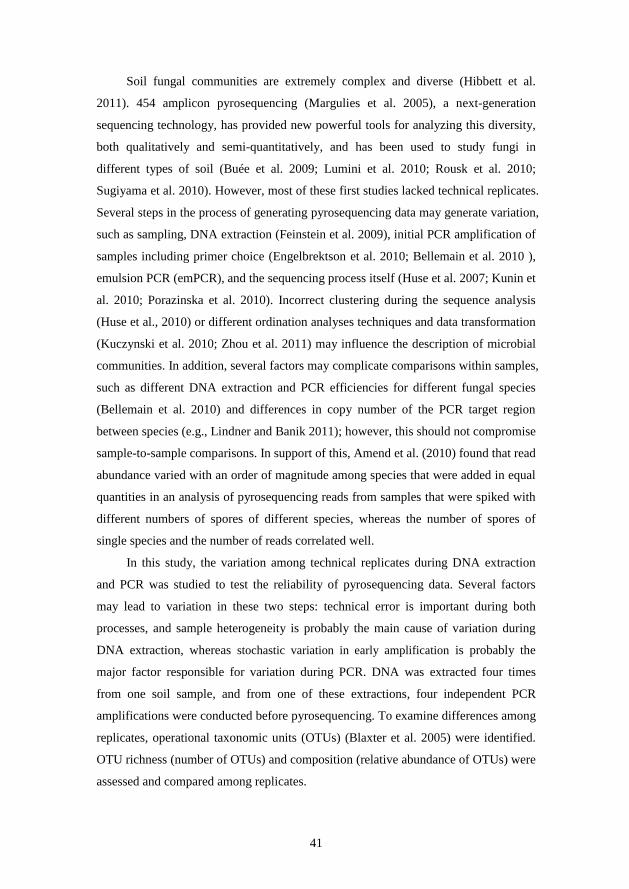
41
Soil fungal communities are extremely complex and diverse (Hibbett et al.
2011). 454 amplicon pyrosequencing (Margulies et al. 2005), a next-generation
sequencing technology, has provided new powerful tools for analyzing this diversity,
both qualitatively and semi-quantitatively, and has been used to study fungi in
different types of soil (Buée et al. 2009; Lumini et al. 2010; Rousk et al. 2010;
Sugiyama et al. 2010). However, most of these first studies lacked technical replicates.
Several steps in the process of generating pyrosequencing data may generate variation,
such as sampling, DNA extraction (Feinstein et al. 2009), initial PCR amplification of
samples including primer choice (Engelbrektson et al. 2010; Bellemain et al. 2010 ),
emulsion PCR (emPCR), and the sequencing process itself (Huse et al. 2007; Kunin et
al. 2010; Porazinska et al. 2010). Incorrect clustering during the sequence analysis
(Huse et al., 2010) or different ordination analyses techniques and data transformation
(Kuczynski et al. 2010; Zhou et al. 2011) may influence the description of microbial
communities. In addition, several factors may complicate comparisons within samples,
such as different DNA extraction and PCR efficiencies for different fungal species
(Bellemain et al. 2010) and differences in copy number of the PCR target region
between species (e.g., Lindner and Banik 2011); however, this should not compromise
sample-to-sample comparisons. In support of this, Amend et al. (2010) found that read
abundance varied with an order of magnitude among species that were added in equal
quantities in an analysis of pyrosequencing reads from samples that were spiked with
different numbers of spores of different species, whereas the number of spores of
single species and the number of reads correlated well.
In this study, the variation among technical replicates during DNA extraction
and PCR was studied to test the reliability of pyrosequencing data. Several factors
may lead to variation in these two steps: technical error is important during both
processes, and sample heterogeneity is probably the main cause of variation during
DNA extraction, whereas stochastic variation in early amplification is probably the
major factor responsible for variation during PCR. DNA was extracted four times
from one soil sample, and from one of these extractions, four independent PCR
amplifications were conducted before pyrosequencing. To examine differences among
replicates, operational taxonomic units (OTUs) (Blaxter et al. 2005) were identified.
OTU richness (number of OTUs) and composition (relative abundance of OTUs) were
assessed and compared among replicates.
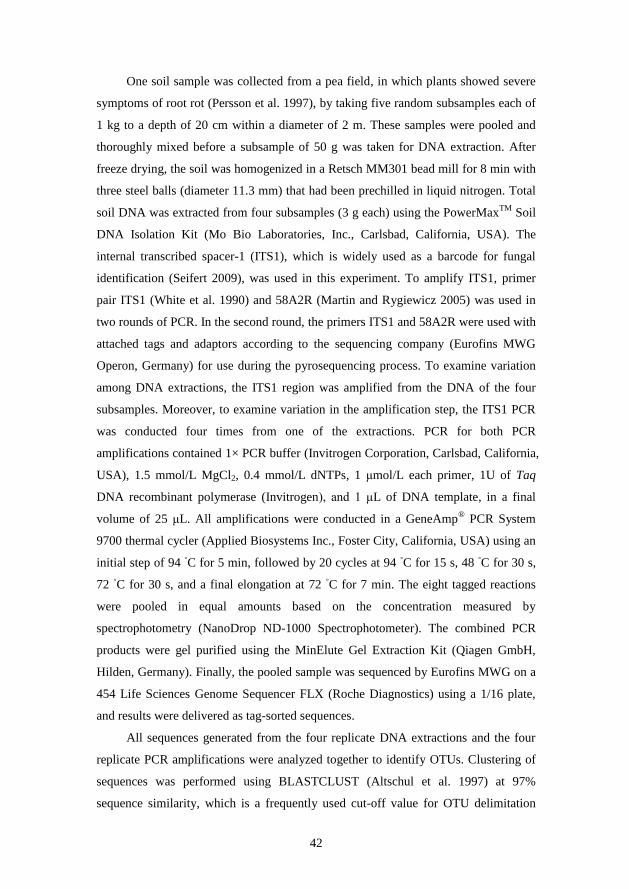
42
One soil sample was collected from a pea field, in which plants showed severe
symptoms of root rot (Persson et al. 1997), by taking five random subsamples each of
1 kg to a depth of 20 cm within a diameter of 2 m. These samples were pooled and
thoroughly mixed before a subsample of 50 g was taken for DNA extraction. After
freeze drying, the soil was homogenized in a Retsch MM301 bead mill for 8 min with
three steel balls (diameter 11.3 mm) that had been prechilled in liquid nitrogen. Total
soil DNA was extracted from four subsamples (3 g each) using the PowerMaxTM
Soil
DNA Isolation Kit (Mo Bio Laboratories, Inc., Carlsbad, California, USA). The
internal transcribed spacer-1 (ITS1), which is widely used as a barcode for fungal
identification (Seifert 2009), was used in this experiment. To amplify ITS1, primer
pair ITS1 (White et al. 1990) and 58A2R (Martin and Rygiewicz 2005) was used in
two rounds of PCR. In the second round, the primers ITS1 and 58A2R were used with
attached tags and adaptors according to the sequencing company (Eurofins MWG
Operon, Germany) for use during the pyrosequencing process. To examine variation
among DNA extractions, the ITS1 region was amplified from the DNA of the four
subsamples. Moreover, to examine variation in the amplification step, the ITS1 PCR
was conducted four times from one of the extractions. PCR for both PCR
amplifications contained 1× PCR buffer (Invitrogen Corporation, Carlsbad, California,
USA), 1.5 mmol/L MgCl2, 0.4 mmol/L dNTPs, 1 μmol/L each primer, 1U of Taq
DNA recombinant polymerase (Invitrogen), and 1 μL of DNA template, in a final
volume of 25 μL. All amplifications were conducted in a GeneAmp® PCR System
9700 thermal cycler (Applied Biosystems Inc., Foster City, California, USA) using an
initial step of 94 ◦C for 5 min, followed by 20 cycles at 94
◦C for 15 s, 48
◦C for 30 s,
72 ◦C for 30 s, and a final elongation at 72
◦C for 7 min. The eight tagged reactions
were pooled in equal amounts based on the concentration measured by
spectrophotometry (NanoDrop ND-1000 Spectrophotometer). The combined PCR
products were gel purified using the MinElute Gel Extraction Kit (Qiagen GmbH,
Hilden, Germany). Finally, the pooled sample was sequenced by Eurofins MWG on a
454 Life Sciences Genome Sequencer FLX (Roche Diagnostics) using a 1/16 plate,
and results were delivered as tag-sorted sequences.
All sequences generated from the four replicate DNA extractions and the four
replicate PCR amplifications were analyzed together to identify OTUs. Clustering of
sequences was performed using BLASTCLUST (Altschul et al. 1997) at 97%
sequence similarity, which is a frequently used cut-off value for OTU delimitation

43
(Tedersoo et al. 2010), on the freely available computational resource Bioportal at the
University of Oslo (http://www.bioportal.uio.no) using CLOTU software (Kumar et al.
2011). Analytic Rarefaction version 1.3 (Hunt Mountain Software, Department of
Geology, University of Georgia, Athens, Georgia, USA) was used for rarefaction
analysis. Calculation of the diversity (Chao1) index was performed using the
EstimateS version 8.2 software package (Colwell 2009).
After filtering, a total of 6490 sequences from the eight samples passed the
quality control (tags and primers found in reads; no sequence ambiguities; length >
200 nt). These sequences were clustered into 363 OTUs, including 183 singletons, at
97% sequence similarity. Excluding singletons, which may arise from sequencing
artefacts (Tedersoo et al. 2010), the remaining 180 nonsingletons were used in the
downstream analysis. The most abundant OTUs overall were Phoma medicaginis var.
pinodella (30.7%), which is known to be involved in pea foot rot (Bretag and Ramsey
2001), followed up by Verticillium dahliae (25.0%), Dokmaia sp. (14.4%),
Plectosphaerella cucumerina (2.3%), and Cryptococcus aerius (1.3%). The first five
most abundant OTUs accounted for 73.7% of all reads.
To estimate species richness, rarefaction curves were generated by randomly
sampling sequences and plotting the number of OTUs observed against the number of
sequences sampled (Fig. 1). The number of OTUs observed increased with the
number of sequences sampled, and none of the curves reached a plateau at 97%
similarity level. The amplicons of the four PCR replicates produced OTU richness
estimates of 83 (± 18) OTUs using the nonparametric Chao1 estimator (Chao et al.,
2005), whereas the amplicons of the four DNA extraction replicates produced
estimates of 69 (± 6) OTUs, indicating that not all OTUs were sampled and that there
was significant variation within individual samples. This also indicated that Chao1
estimates in individual replicates significantly underestimated OTU richness, as 180
nonsingletons were identified when analyzing pooled reads.

44
Fig. 1. Rarefaction curves depicting the effect of the total number of sequences sampled on
the number of operational taxonomic units (OTUs) identified from the four replicate DNA
extractions (E) and four replicate PCR amplifications (P).
The variance of the relative number of reads within each OTU from the four
DNA extractions and four PCR amplifications was plotted against the number of
sequences in each OTU (Fig. 2). Not surprisingly, the variance of the relative
abundance of reads in dominant OTUs was lower than the variance in rare OTUs,
indicating that only the most abundant OTUs are reliably quantified. A similar
observation was done by Unterseher et al. (2011), who also found different species
abundance distributions among rare (satellite) and abundant (core) OTUs. In this
study, only relatively few sequences were analyzed. To obtain more reliable
quantitative data on the rare OTUs, significantly more sequences have to be analyzed.
However, if only considering the dominant OTUs, these results show that the variance
is minor.

45
Fig. 2. Variance of the relative abundance of reads in each operational taxonomic unit (OTU)
from the four DNA extractions and four PCR amplifications. The y-axis shows variance
between replicates of the relative abundance of sequences within each OTU, while the x-axis
is the number of sequences in each OTU after log10 transformation.
Rank abundance curves of the dominant OTUs (relative abundance > 0.1%)
were plotted to compare read abundances in the two different experimental steps. First,
read abundances were plotted from individual samples (Fig. 3A), and read abundances
from the DNA extraction and the PCR steps were then averaged, respectively (Fig.
3B). When plotted individually, the abundance varied significantly across samples;
however, the samples produced very similar plots of read abundance for the dominant
OTUs, when averaged. This indicates that variation among replicates can be
decreased by performing multiple individual DNA extracts and PCR amplifications
and then pooling in the experimental stage or during data treatment, even for the more
rare OTUs.

46
Fig. 3. Individual abundance plot (A) or averaged rank abundance plot (B) of the most
abundant operational taxonomic units (OTUs) (representing 99% of the total number of
sequences) of DNA extraction replicates and PCR amplification replicates. The y-axis shows
the relative abundance of OTUs after log10 transformation, while the x-axis ranks each OTU
from most to least abundant.
To compare the diversity uncovered in the eight different samples at the phylum
level, all nonsingletons were classified using NCBI BLASTn (Altschul et al. 1997)
against the nonredundant GenBank database (Benson et al. 2011) and amalgamated at
the phylum level. Ascomycota constituted 89.9% (± 2.95%) of the reads in each
amplicon data set, followed by Basidiomycota (6.8% ± 2.1%), whereas other phyla,
including Chytridiomycota, Glomeromycota, Zygomycota, and the nonfungal
Oomycota, each represented ~1% of reads (data not shown). This showed that by
clustering at higher levels, variation between individual replicates was minor;
however, this will lead to a dramatic loss of detail.
In conclusion, the variation of technical replicates performed during DNA
extraction and PCR amplification for amplicon-based pyrosequencing of soil fungi
was high, especially for rare OTUs. This study only included relatively few sequences;
to obtain quantitative data for rare OTUs, many more sequence reads are needed. To
detect a larger part of the fungal diversity, technical replicates of DNA extraction and
replicates of PCR amplifications from each extraction should be included in fungal
community studies. To save resources, our results indicate that replicates may be
pooled before the pyrosequencing step. Furthermore, to improve statistical analyses,
these replicates could be tagged individually.
47
Acknowledgements
This study was financed by the Faculty of Science and Technology, Aarhus
University, Denmark. We thank Karsten Malmskov (Ardo A/S) for assistance and for
providing access to the study site. We are grateful to the editor and to two anonymous
reviewers for their critical comments and suggestions.
References
Altschul, S.F., Madden, T.L., Schaffer, A.A., Zhang, J.H., Zhang, Z., Miller, W., and
Lipman, D.J. 1997. Gapped BLAST and PSI-BLAST: a new generation of
protein database search programs. Nucleic Acids Res. 25(17): 3389-3402.
Amend, A.S., Seifert, K.A., and Bruns, T.D. 2010. Quantifying microbial
communities with 454 pyrosequencing: does read abundance count? Mol. Ecol.
19(24): 5555-5565.
Bellemain, E., Carlsen, T., Brochmann, C., Coissac, E., Taberlet, P., and Kauserud, H.
2010. ITS as an environmental DNA barcode for fungi: an in silico approach
reveals potential PCR biases. BMC Microbiol. 10: 189.
Benson, D.A., Karsch-Mizrachi, I., Lipman, D.J., Ostell, J., and Sayers, E.W. 2011.
GenBank. Nucleic Acids Res. 39(suppl 1): D32-D37.
Blaxter, M., Mann, J., Chapman, T., Thomas, F., Whitton, C., Floyd, R., and Abebe, E.
2005. Defining operational taxonomic units using DNA barcode data. Phil. Trans.
R. Soc. B, 360(1462): 1935-1943.
Bretag, T.W. and Ramsey, M. 2001. Foliar diseases caused by fungi: Ascochyta spp.
In Compendium of pea diseases and pests. 2nd ed. Edited by J.M. Kraft and F.L.
Pfleger. APS Press, St.Paul, MN, USA. pp. 24-28.
Buée, M., Reich, M., Murat, C., Morin, E., Nilsson, R.H., Uroz, S., and Martin, F.
2009. 454 Pyrosequencing analyses of forest soils reveal an unexpectedly high
fungal diversity. New Phytol. 184(2): 449-456.
Chao, A., Chazdon, R.L., Colwell, R.K., and Shen, T.J. 2005. A new statistical
approach for assessing similarity of species composition with incidence and
abundance data. Ecol. Lett. 8(2): 148-159.
48
Colwell, R.K. 2009. EstimateS: Statistical estimation of species richness and shared
species from samples. Version 8.2. User's guide and application published at:
http://viceroy.eeb.uconn.edu/estimates.
Engelbrektson, A., Kunin, V., Wrighton, K.C., Zvenigorodsky, N., Chen, F., Ochman,
H., and Hugenholtz, P. 2010. Experimental factors affecting PCR-based
estimates of microbial species richness and evenness. ISME J. 4(5): 642-647.
Feinstein, L.M., Sul, W.J., and Blackwood, C.B. 2009. Assessment of bias associated
with incomplete extraction of microbial DNA from soil. Appl. Environ.
Microbiol. 75(16): 5428-5433.
Hibbett, D.S., Ohman, A., Glotzer, D., Nuhn, M., Kirk, P., and Nilsson, R. 2011.
Progress in molecular and morphological taxon discovery in Fungi and options
for formal classification of environmental sequences. Fungal Biol. Rev. 25(1):
38-47.
Huse, S.M., Huber, J.A., Morrison, H.G., Sogin, M.L., and Mark Welch, D. 2007.
Accuracy and quality of massively parallel DNA pyrosequencing. Genome Biol.
8(7): R143.
Huse, S.M., Welch, D.M., Morrison, H.G., and Sogin, M.L. 2010. Ironing out the
wrinkles in the rare biosphere through improved OTU clustering. Environ.
Microbiol. 12(7): 1889-1898.
Kuczynski, J., Liu, Z.Z., Lozupone, C., McDonald, D., Fierer, N., and Knight, R.
2010. Microbial community resemblance methods differ in their ability to detect
biologically relevant patterns. Nat. Methods, 7(10): 813-819.
Kumar, S., Carlsen, T., Mevik, B.H., Enger, P., Blaalid, R., Shalchian-Tabrizi, K., and
Kauserud, H. 2011. CLOTU: an online pipeline for processing and clustering of
454 amplicon reads into OTUs followed by taxonomic annotation. BMC
Bioinformatics, 12: 182.
Kunin, V., Engelbrektson, A., Ochman, H., and Hugenholtz, P. 2010. Wrinkles in the
rare biosphere: pyrosequencing errors can lead to artificial inflation of diversity
estimates. Environ. Microbiol. 12(1): 118-123.
Lindner, D.L. and Banik, M.T. 2011. Intragenomic variation in the ITS rDNA region
obscures phylogenetic relationships and inflates estimates of operational
taxonomic units in genus Laetiporus. Mycologia, 103(4): 731-740.
49
Lumini, E., Orgiazzi, A., Borriello, R., Bonfante, P., and Bianciotto, V. 2010.
Disclosing arbuscular mycorrhizal fungal biodiversity in soil through a land-use
gradient using a pyrosequencing approach. Environ. Microbiol. 12(8): 2165-2179.
Margulies, M., Egholm, M., Altman, W.E., Attiya, S., Bader, J.S., Bemben, L.A., et al.
2005. Genome sequencing in microfabricated high-density picolitre reactors.
Nature, 437(7057): 376-380.
Martin, K.J. and Rygiewicz, P.T. 2005. Fungal-specific PCR primers developed for
analysis of the ITS region of environmental DNA extracts. BMC Microbiol. 5: 28.
Persson, L., Bødker, L., and LarssonWikström, M. 1997. Prevalence and
pathogenicity of foot and root rot pathogens of pea in southern Scandinavia. Plant
Disease, 81(2): 171-174.
Porazinska, D.L., Sung, W., Giblin-Davis, R.M., and Thomas, W.K. 2010.
Reproducibility of read numbers in high-throughput sequencing analysis of
nematode community composition and structure. Mol. Ecol. Resour. 10(4): 666-
676.
Rousk, J., Bååth, E., Brookes, P.C., Lauber, C.L., Lozupone, C., Caporaso, J.G., et al.
2010. Soil bacterial and fungal communities across a pH gradient in an arable
soil. ISME J. 4(10): 1340-1351.
Seifert, K.A. 2009. Progress towards DNA barcoding of fungi. Mol. Ecol. Resour.
9(Suppl. 1): 83-89.
Sugiyama, A., Vivanco, J.M., Jayanty, S.S., and Manter, D.K. 2010. Pyrosequencing
assessment of soil microbial communities in organic and conventional potato
farms. Plant Disease, 94(11): 1329-1335.
Tedersoo, L., Nilsson, R.H., Abarenkov, K., Jairus, T., Sadam, A., Saar, I., et al. 2010.
454 Pyrosequencing and Sanger sequencing of tropical mycorrhizal fungi provide
similar results but reveal substantial methodological biases. New Phytol. 188(1):
291-301.
Unterseher, M., Jumpponen, A., Öpik, M., Tedersoo, L., Moora, M., Dormann, C.F.,
et al. 2011. Species abundance distributions and richness estimations in fungal
metagenomics - lessons learned from community ecology. Mol. Ecol. 20(2): 275-
285.

50
White, T.J., Bruns, T.D., Lee, S.B., and Taylor, J.W. 1990. Amplification and direct
sequencing of fungal ribosomal RNA genes for phylogenetics. In PCR protocols:
a guide to methods and applications. Edited by M.A. Innis, D.H. Gelfand, J.J.
Sninsky, and T.J. White. Academic Press, New York, NY. pp. 315-322.
Zhou, J., Wu, L., Deng, Y., Zhi, X., Jiang, Y.H., Tu, Q., et al. 2011. Reproducibility
and quantitation of amplicon sequencing-based detection. ISME J. 5(8): 1303-
1313.

51
3 Paper II
Soil fungal community structure along a soil health gradient in pea
fields examined using deep amplicon sequencing
Lihui Xua, Sabine Ravnskov
a, John Larsen
b, R. Henrik Nilsson
c, Mogens
Nicolaisena,*
aDepartment of Agroecology, Faculty of Science and Technology, Aarhus University,
4200 Slagelse, Denmark
E-mail: [email protected]; [email protected]
bCentro de Investigaciones en Ecosistemas, Universidad Nacional Autónoma de
México, C.P. 58190 Morelia, Michoacán, México
E-mail: [email protected]
cDepartment of Plant and Environmental Sciences, University of Gothenburg, Box
461, 405 30 Gothenburg, Sweden
E-mail: [email protected]
*Corresponding author: Mogens Nicolaisen, Department of Agroecology, Faculty of
Science and Technology, Aarhus University, Forsøgsvej 1, 4200 Slagelse, Denmark.
Tel.: +45-8715 8137; Fax: +45-8715 6082
E-mail address: [email protected]
(Accepted by Soil Biology & Biochemistry)

52
Abstract
Soil fungi and oomycetes (syn. peronosporomycetes) are the most common
causes of pea diseases, and these pathogens often occur in complexes involving
several species. Information on the dynamics within this complex of pathogens, and
also between the complex of pathogens and other fungi in the development of root
disease is limited. In this study, next-generation sequencing of nuclear ribosomal
internal transcribed spacer-1 was used to characterize fungal communities in
agricultural soils from nine pea fields, in which pea roots showed different degrees of
disease. Fungal species richness, diversity, and community composition were
analyzed and compared among the different pea soils. After filtering for quality and
excluding non-fungal sequences, 55,460 sequences clustering into 434 operational
taxonomic units (OTUs), were obtained from the nine soil samples. These sequences
were found to correspond to 145-200 OTUs in each soil. The fungal communities in
the nine soils were strongly dominated by Ascomycota and Basidiomycota. Phoma,
Podospora, Pseudaleuria, and Veronaea, at genus level, correlated to the disease
severity index of pea roots; Phoma was most abundant in soils with diseased plants,
whereas Podospora, Pseudaleuria, and Veronaea were most abundant in healthy soils.
No correlation was found between the disease severity index and the abundance of
some of the other fungi and oomycetes normally considered as root pathogens in pea.
Key words: Soil fungal community; Fungal diversity; Pea diseases; Nuclear
ribosomal internal transcribed spacer-1 (ITS1); Pyrosequencing
53
1. Introduction
The health status of plant roots is a result of complex interactions between the
plant, the physical and chemical soil environment, and microorganisms in the soil,
both the pathogens themselves, but also other microorganisms. Microbial diversity in
soil is one of the main components determining soil health (Garbeva et al., 2004), and
is believed to be one of the main drivers in soil suppressiveness. Representatives of a
range of fungal groups such as non-pathogenic Fusarium spp., Penicillium,
Trichoderma, have been identified as antagonists of soil-borne plant pathogens
(Garbeva et al., 2004). Moreover, arbuscular mycorrhizal (AM) fungi have been
shown to reduce plant root diseases (Gianinazzi et al., 2010; Whipps, 2004). Under
unfavorable conditions, these interactions may lead to development of disease, and
under other conditions to soil suppressiveness. Suppressive soil has been defined as
soil in which the disease severity or incidence remains low in spite of the presence of
pathogens, susceptible host plants, and climatic conditions favorable for disease
development (Baker and Cook, 1974). Although soil health is one of the most
important requirements for plant production in agricultural systems, it is not easily
described. However, several indicators, both abiotic and biotic, have been proposed to
estimate soil health (Janvier et al., 2007).
Fungi and fungus-like organisms are an important and diverse group of
microorganisms in the soil ecosystem (Fierer et al., 2007), including multiple
functional groups such as decomposers, mycorrhizal fungi, and many plant pathogens
(Stajich et al., 2009). All major fungal phyla, viz. Ascomycota, Basidiomycota,
Chytridiomycota, Glomeromycota, and Zygomycota, are present in the soil ecosystem
together with the Oomycota. However, only a small fraction of this diversity has been
analyzed to date (Hibbett et al., 2011), emphasizing the importance of studying the
soil fungal communities in relation to improving soil health.
Field pea (Pisum sativum L.) grown for fodder and for human consumption is
subject to a number of soil-borne diseases that can increase in severity as pea
cropping intensifies (Bødker et al., 1993a). These diseases, commonly referred to as
the pea root rot complex, are caused by single or combinations of pathogens,
including Alternaria alternata, Aphanomyces euteiches, Fusarium oxysporum f. sp.
pisi, Fusarium solani f. sp. pisi, Mycosphaerella pinodes, Phoma medicaginis var.
pinodella (formerly Ascochyta pinodella), Pythium spp., Rhizoctonia solani,
54
Sclerotinia sclerotiorum, and Thielaviopsis basicola (Bretag et al., 2006; Bødker et al.,
1993b; Gaulin et al., 2007; Persson et al., 1997). The pathogens, individually or in
combination, cause symptoms such as seed decay, root rot, foot rot, seedling blight,
and wilt. The incidence of the pea root rot complex varies between years, depending
on climate, crop rotation (Bødker et al., 1993a), and agricultural practices (Davidson
and Ramsey, 2000). Although it is clear that pea root rot is caused by the above
mentioned pathogens, limited information is available on the fungal communities in
the soil and their influence on pea plant health. Moreover, the interaction between
these pathogens and other soil living fungi is not well investigated.
Next-generation sequencing (NGS) technologies, particularly 454 deep
amplicon sequencing (Margulies et al., 2005), offer new opportunities for studies of
such interactions by profiling fungal communities, as high numbers of individuals can
be analyzed without cloning. Furthermore, the use of tagged primers allows pooling
of several samples, thus reducing costs and increasing sample throughput (Binladen et
al., 2007). Only a few studies on fungi have been performed using NGS (e.g. Buée et
al., 2009; Jumpponen and Jones, 2009; Lumini et al., 2010; Rousk et al., 2010;
Sugiyama et al., 2010), and even fewer studies have focused on fungal communities
in soils from intensive cropping systems (Sugiyama et al., 2010).
The internal transcribed spacer (ITS) region is widely used for identification of
fungi due to the relatively high variability combined with the flanking conserved
regions (18S and 28S) for primer annealing (Begerow et al., 2010). Due to length
constraints of early 454 pyrosequencing technology, only parts of the ITS region
could be used in initial studies. Nilsson et al. (2009) tested the ITS region as a target
for characterization of fungal communities using pyrosequencing, and found that the
ITS1 region with an average length of approximately 250 bp was adequate to identify
fungi at genus or even at species level. Also Buée et al. (2009) and Jumpponen and
Jones (2009) used the ITS1 region as a genetic marker to amplify environmental
samples for pyrosequencing fungi.
The aim of this study was to characterize fungal communities along a soil
health gradient in pea field soils to answer the following questions: (i) Does the
overall soil fungal community differ between soils in which pea plants show
symptoms of disease and in soils with healthy plants? (ii) Can fungal soil-borne
pathogens be detected in the bulk soil? (iii) Can certain soil fungi be used as soil
health indicators?

55
2. Materials and Methods
2.1. Soil sampling
Soil samples were collected from nine pea fields in Denmark on September 1,
2008 just before harvest. Soil characteristics of these fields were shown in Table 1.
All fields had been sown with the same pea cultivar, Rainier. Based on visual
observation of pea root rot symptoms, six fields with apparently diseased plants and
three fields with apparently healthy plants were selected. Each soil sample of
approximately 5 kg was collected by taking five random sub-samples between plants
within a diameter of 2 m to a depth of 20 cm. These five samples from each field were
pooled and homogenized. One sub-sample of 50 g from this was taken and frozen at -
80 ◦C pending further processing.
Table 1 Soil characteristics of nine pea fields in Denmark.
Pea
field
Latitude,
longitude
Soil
type
Yield
(kg/ha) Pre-crop pH
Nutrient (mg/100g soil)
P K Mg
1 55°01'N,
12°17'E
Heavy
clay 2,461 Beet 6.5 2.5 13.5 10
2 55°01'N,
12°17'E
Heavy
clay 2,461 Beet 6.5 2.5 13.5 10
3 54°59'N,
12°18'E
Heavy
Clay 2,482
Spring
barley 6.4 3.1 10.5 7.0
4 54°58'N,
12°25'E Clay 976
Spring
barley 7.1 2.6 10.1 4.8
5 54°57'N,
12°30'E Clay 2,330
Spring
barley 7.4 5.4 11.2 4.6
6 54°56'N,
12°30'E
Heavy
clay
Not
harvested
Spring
barley 6.9 3.4 11.7 7.4
7 54°58'N,
12°24'E
Heavy
clay 3,558
Winter
wheat 7.3 4.2 12.5 6.1
8 54°58'N,
12°20'E
Heavy
clay
Not
harvested Pea 7.0 3.4 11.9 9.8
9 54°59'N,
11°59'E Clay 2,070
Spring
barley 6.6 4.2 9.9 5.1
2.2. Evaluation of field soils in a pot experiment
The nine soils were compared in a pot experiment to evaluate disease
development in pea plants grown in the respective soils and to confirm observations
from the fields. The pea cultivar Rainier was sown in pots with five replicates of each
soil. Pots with 1100 g soil and seven seeds were placed randomly in a greenhouse
with controlled growth conditions (16 h, 20 ◦C light; 8 h, 18
◦C dark). After six weeks,

56
pea plants were harvested, soil was removed from roots and lower stems by washing,
and the roots were scored for root and tap-root rotting on a 0-6 scale disease severity
index (DSI) as follows: 0 = healthy plant without any visible symptoms; 1 =
discoloration of less than 10% on a single root; 2 = discoloration of about 25% of the
root system; 3 = about 50% of the root system was dark and affected; 4 = about 75%
of the root system was dark and affected but no symptoms on epicotyl or leaves; 5 =
the whole root system, together with the epicotyl, was dark and affected and the
lowest leaves were wilted; and 6 = dead plant. Sub-samples of roots were stained with
0.05% trypan blue in lactophenol (Phillips and Hayman, 1970) for characterization of
the fungal composition by microscopy. The total root length was calculated by the
grid-line intersect method (Giovannetti and Mosse, 1980).
2.3. DNA extraction and PCR amplification
Freeze-dried soil samples were homogenized in a Retsch MM301 bead mill for
8 min in vibrating bowls with three steel balls (diameter = 1.13 cm) that had been pre-
chilled in liquid nitrogen. Total soil DNA was extracted from 3 g of milled soil using
the PowerMaxTM
Soil DNA Isolation Kit (Mo Bio Laboratories, Inc., Carlsbad, CA,
USA) according to the manufacturer‟s instructions.
To amplify ITS1, the primers ITS1 (TCC GTA GGT GAA CCT GCGG) (White
et al., 1990) and 58A2R (CTG CGT TCT TCA TCG AT) (Martin and Rygiewicz,
2005) were used. To generate amplicons for 454 pyrosequencing, two rounds of PCR
were performed. The first PCR step was performed with primer pair ITS1 and 58A2R
to amplify the region of interest from the soil DNA. Then 1 μl of the ITS1 PCR
product was used as template for a second amplification. This step was performed
with the primers A-key-MID tag-ITS1 and B-key-58A2R, of which the A adapter
(GCC TCC CTC GCG CCA TCAG) and the B adapter (GCC TTG CCA GCC CGC
TCAG) were pyrosequencing primers and the hexamer MID tags were required for
sample identification after pooling. The nine tags were selected from the list of
recommended tags from Eurofins MWG Operon (Ebersberg, Germany). Primers were
synthesized by Eurofins MWG Operon.
PCR reactions for both PCR amplifications contained 1× PCR reaction buffer,
1.5 mM MgCl2, 0.4 mM dNTPs, 1 μM each primer, 1U of Taq DNA recombinant
polymerase (Invitrogen Corporation, Carlsbad, CA, USA), and 1 μl of DNA template
with a final volume of 25 μl. All amplifications were conducted in a GeneAmp® PCR

57
System 9700 thermal cycler (Applied Biosystems Inc., Foster City, CA, USA) using
an initial DNA denaturation step of 94 ◦C for 5 min, followed by 20 cycles of
denaturation at 94 ◦C for 15 s, annealing at 48
◦C for 30 s, extension at 72
◦C for 30 s,
and a final elongation at 72 ◦C for 7 min. PCR products were analyzed by gel
electrophoresis in 2% agarose.
2.4. PCR purification and pyrosequencing
The concentration of the amplicons was estimated through both
spectrophotometry (NanoDrop ND-1000 Spectrophotometer) and by analyzing
agarose gel pictures using Kodak Molecular Imaging Software (Eastman Kodak
Company, Rochester, NY, USA). After pooling approximately equimolar of PCR
amplicons from each of the nine samples, the combined PCR products at 280-320 bp
were excised from an agarose gel and purified using the MinElute Gel Extraction Kit
(Qiagen GmbH, Hilden, Germany). After precipitating the DNA and resuspending in
10 µl TE buffer, the pooled sample was sequenced by Eurofins MWG on a 454 Life
Sciences Genome Sequencer FLX (Roche Diagnostics) using a ¼ plate, and the
results were delivered as tag-sorted sequences.
2.5. OTU (Operational Taxonomic Unit)-based sequence analysis
All sequences from the nine soils were analyzed together to identify OTUs. The
entire ITS1, excluding tag-, primer-, 18S-, and 5.8S-sequences, was extracted from all
sequences by the ITS extractor (Nilsson et al., 2010) and clustered to hypothetical
species using CAP3 (Huang and Madan, 1999) (97% similarity over ≥ 90% of the
alignment length) as implemented in the pyrosequencing pipeline of Tedersoo et al.
(2010). A majority-rule consensus sequence was computed for each cluster to
minimize the impact of poor reads (the lower limit for the length of ITS1 was 50 bp,
and sequences with more than one DNA ambiguity symbol were discarded). The
consensus sequence was then used as query for subsequent BLAST searches using
NCBI-BLASTn (Altschul et al., 1997) against the non-redundant GenBank database
(Benson et al., 2011) and a custom-curated database (C-DB), which contained all fully
identified fungal ITS sequences screened from the GenBank and UNITE databases
(Abarenkov et al., 2010). OTUs at 97% sequence similarity that could not be
identified using custom-curated databases were recovered by BLAST search against

58
GenBank to obtain information about their taxonomic distribution and their similarity
to the nearest relative in the NCBI database.
OTUs defined at 97% sequence similarity were used to generate rarefaction
curves and to estimate the richness by non-parametric indices ACE (abundance-based
coverage estimates) and Chao1 (Chao et al., 2005). Rarefaction analysis was
performed using Analytic Rarefaction v1.3 (Hunt Mountain software, Department of
Geology, University of Georgia, Athens, GA, USA). Calculation of richness indices
(ACE and Chao1) was performed using the EstimateS software package with default
settings (Colwell, 2009).
2.6. Statistical analyses
All variables employed to characterize the nine different pea field soils (Table 2)
were subjected to one-way ANOVA using STATGRAPHICS Plus, version 5.1
(Copyright Manugistics Inc.). Prior to ANOVA, the data were analyzed for normal
distribution and variance homogeneity by Bartlett‟s test. Post-ANOVA mean
comparisons were performed with least significant difference (LSD) values. To
compare the fungal communities in soils collected from fields with high (DSI > 1) and
low (DSI ≤ 1) DSI, respectively, linear discriminant analysis (LDA) was performed
by SAS
9.2 (SAS Institute Inc., Cary, NC, USA). A forward elimination method was
used to select the best variables from 178 identified genera for discrimination. Simple
linear regressions analyses were used to correlate DSI with different soil
characteristics listed in Table 1, with the fungi identified at the phylum level, and with
eight fungal genera that were responding significantly to health status according to the
LDA analysis.
The software package PRIMER-E v6 (Clarke and Warwick, 2001) was used for
testing whether there were differences in fungal community composition or variability
across treatments by analysis of similarity (ANOSIM) (Clarke, 1993). Rank-order
Bray-Curtis distance was used to determine distinction in either mean on variability
refers to differences in the variability around a centroid in ordination space. All tests
were permutated, assuming no underlying distribution of the community.

59
3. Results
In six soils, plants showed root rot symptoms in the field (field numbers 1, 2, 4,
6, 8, 9) and in three soils, plants did not show any significant disease symptoms (field
numbers 3, 5, 7). In field numbers 1, 2, 4, 6, 8, and 9, pea plants were severely stunted;
the leaves were yellow and the number of pods was reduced, each pod in addition
carrying a reduced number of seeds. The roots were small and had a yellow to dark
brown color; some plants had wilted. The DSI of roots in the pot experiment
confirmed observations in the field (Table 2). Disease symptoms were obvious on pea
plants, which were planted in soils from field numbers 1, 2, 4, 6, 8, and 9 (DSI > 1),
whereas fewer disease symptoms were visible on plants planted in soil from field
numbers 3, 5, and 7 (DSI ≤ 1) (Table 2). In general, all recorded plant growth
characteristics followed the same pattern as the DSI, so that plants grown in soils from
fields with diseased plants showed less vigorous growth than that of plants grown in
soil from fields without any apparently diseased plants (Table 2). Microscopy showed
that arbuscular mycorrhizal (AM) root colonization was in the range of 10-31% areal
root coverage between soils from the different fields (Table 2). Regression analysis
showed a significant negative correlation between AM root colonization and DSI (R2
= 0.25, P = 0.001).
After quality filtering, a total of 68,811 ITS1 sequences were obtained from all
soil samples. These were clustered into 1145 OTUs containing 748 non-singletons
and 397 singletons at 97% sequence similarity. Singletons constituted 0.58% of the
total number of reads and were excluded from further analysis. All the non-singletons
were used to BLAST against the non-redundant GenBank database and C-DB. In total,
434 OTUs, which contained 55,460 sequences were identified as fungi and oomycetes,
excluding 8440 sequences with BLAST hits to plant sequences, 1345 to animal
sequences, 49 to bacterial sequences, and 3120 sequences with no significant matches.
The number of sequences from each soil ranged from 3309 to 7757, which resulted in
the number of OTUs per soil sample ranging from 145 to 200.

60
Table 2 Plant growth performance, arbuscular mycorrhizal (AM) root colonization,
and disease severity index of pea plants grown in a greenhouse pot experiment with
soil collected from the different pea fields included in the present study. Different
letters indicate significant differences among soils for the individual variables (n = 5).
Pea
field
Shoot dry
weight
(g)
Root dry
weight
(g)
Root length
(m)
AM root
colonization
(%)
Disease
severity
index
1 2.05 b 0.61 a 5.49 a 20.1 cd 3.0 bc
2 2.58 d 0.62 a 8.52 bcd 15.9 bcd 2.4 b
3 2.46 cd 0.69 a 13.30 e 14.6 bc 0.6 a
4 1.53 a 0.53 a 9.29 cd 9.7 ab 5.0 d
5 2.32 bcd 0.71 a 10.02 d 30.4 e 1.0 a
6 2.31 bcd 0.75 a 7.52 abc 6.9 a 3.2 bc
7 2.39 cd 0.64 a 10.30 d 30.7 e 0.8 a
8 1.42 a 0.60 a 6.81 ab 22.9 d 4.0 cd
9 2.15 bc 0.68 a 8.54 bcd 18.3 cd 3.0 bc
P-value < 0.0000 0.4243 < 0.0000 < 0.0000 < 0.0000
LSD 0.34 NS 2.14 7.1 1.1
NS = Not significant
LSD = Least significant difference
Rarefaction curves showed that the number of OTUs observed increased with
the number of sequences sampled in each of the soils and that none of the curves
reached a plateau at 97% similarity level (Fig. 1), while a plateau was reached at
lower levels of similarity, 85% or 80% (data not shown). There was no clear trend
between the number of OTUs observed in the samples and the health status as
measured by DSI. In all soils, the number of OTUs observed was lower than the
number of OTUs estimated with the non-parametric ACE and Chao1 (both from 172
to 212) indices at 97% similarity. In addition, the estimated richness in the individual
soils did not correlate to health status (data not shown).

61
Fig. 1. Rarefaction curves of soil fungal communities at 97% sequence similarity level in the
nine soils from pea fields. Between 3309 and 7757 sequences were obtained from each soil,
corresponding to 145-200 OTUs. Number at the end of each curve indicates the pea field
number. Red color: six soils with disease severity index (DSI) > 1; green color: three soils
with DSI ≤ 1.
The 30 most abundant OTUs accounted for 68.6% of the total number of
sequences (Table 3) and the four most abundant and fully identified species were P.
medicaginis var. pinodella, Verticillium nigrescens, Guehomyces pullulans, and
Cryptococcus aerius, which represented 54.8% of all reads. After amalgamation of
OTUs at phylum level, the total abundance of each phylum in all soils was:
Ascomycota (62.5%), Basidiomycota (27.1%), Chytridiomycota (0.1%),
Glomeromycota (0.03%), Oomycota (1.3%), and Zygomycota (7.4%). No correlation
could be found for Ascomycota, Basidiomycota, Chytridiomycota, Glomeromycota,
Oomycota, and Zygomycota, between their relative abundance in the individual soils
and DSI of roots (data not shown).
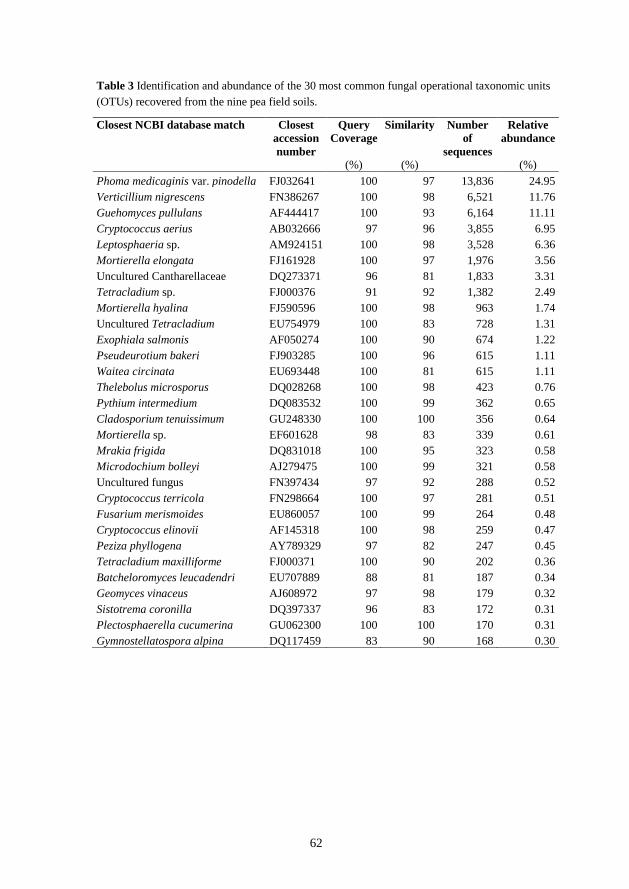
62
Table 3 Identification and abundance of the 30 most common fungal operational taxonomic units
(OTUs) recovered from the nine pea field soils.
Closest NCBI database match Closest
accession
number
Query
Coverage
Similarity Number
of
sequences
Relative
abundance
(%) (%) (%)
Phoma medicaginis var. pinodella FJ032641 100 97 13,836 24.95
Verticillium nigrescens FN386267 100 98 6,521 11.76
Guehomyces pullulans AF444417 100 93 6,164 11.11
Cryptococcus aerius AB032666 97 96 3,855 6.95
Leptosphaeria sp. AM924151 100 98 3,528 6.36
Mortierella elongata FJ161928 100 97 1,976 3.56
Uncultured Cantharellaceae DQ273371 96 81 1,833 3.31
Tetracladium sp. FJ000376 91 92 1,382 2.49
Mortierella hyalina FJ590596 100 98 963 1.74
Uncultured Tetracladium EU754979 100 83 728 1.31
Exophiala salmonis AF050274 100 90 674 1.22
Pseudeurotium bakeri FJ903285 100 96 615 1.11
Waitea circinata EU693448 100 81 615 1.11
Thelebolus microsporus DQ028268 100 98 423 0.76
Pythium intermedium DQ083532 100 99 362 0.65
Cladosporium tenuissimum GU248330 100 100 356 0.64
Mortierella sp. EF601628 98 83 339 0.61
Mrakia frigida DQ831018 100 95 323 0.58
Microdochium bolleyi AJ279475 100 99 321 0.58
Uncultured fungus FN397434 97 92 288 0.52
Cryptococcus terricola FN298664 100 97 281 0.51
Fusarium merismoides EU860057 100 99 264 0.48
Cryptococcus elinovii AF145318 100 98 259 0.47
Peziza phyllogena AY789329 97 82 247 0.45
Tetracladium maxilliforme FJ000371 100 90 202 0.36
Batcheloromyces leucadendri EU707889 88 81 187 0.34
Geomyces vinaceus AJ608972 97 98 179 0.32
Sistotrema coronilla DQ397337 96 83 172 0.31
Plectosphaerella cucumerina GU062300 100 100 170 0.31
Gymnostellatospora alpina DQ117459 83 90 168 0.30

63
The fungal community structures in all soils were compared to identify OTUs
overlapping among the nine soils. Forty OTUs, which represented 80.6% of the total
sequences, were shared by all soils, whereas between 4 and 21 OTUs were found in
only one soil. However, these OTUs only accounted for 0.01-0.27% of the total
number of sequences. There were 270 OTUs shared between 2 and 8 soils, accounting
for 16.8% of the sequences. The fungal communities in soils with diseased plants
(field numbers 1, 2, 4, 6, 8, and 9) and in soils with healthy plants (field numbers 3, 5,
and 7) were different from each other in composition (relative abundance of OTUs)
by ANOSIM (R = 0.451, P = 0.036).
LDA was used to test whether there were any significant differences in fungal
communities by individual taxonomic units along the soil health gradient as defined
by DSI. Eight genera (P < 0.05) could be used to separate soils along the soil health
gradient. They were Phoma, Podospora, Pseudaleuria, Gaeumannomyces,
Paraglomus, Phialocephala, Veronaea, and Trichocladium. Of these, Phoma was the
most abundant with 23.74% (± 10.6%) on average in nine soils, whereas Podospora
(0.13 ± 0.1%), Pseudaleuria (0.13 ± 0.1%), Veronaea (0.06 ± 0.1%),
Gaeumannomyces (0.01 ± 0.01%), Paraglomus (0.01 ± 0.01%), Phialocephala (0.01
± 0.01%), and Trichocladium (0.01 ± 0.01%) were present in much lower abundance.
Considering their extremely low abundance, Gaeumannomyces, Paraglomus,
Phialocephala, and Trichocladium were not considered further as their distribution
could have been random. When the relative abundance of P. medicaginis var.
pinodella was plotted against DSI, a strong positive correlation (R2
= 0.84, P = 0.001)
was observed (Fig. 2). Also the abundance of Podospora (R2
= 0.69, P = 0.006),
Pseudaleuria (R2
= 0.81, P = 0.001), and Veronaea (R2
= 0.44, P = 0.051) was plotted
against DSI (Fig. 2). To rule out any underlying correlation between these fungi and
other soil characteristics, a linear regression analysis was performed. No significant
correlations could be found, except that there was a weak correlation between
phosphorous content and Podospora (R2
= 0.50, P = 0.034). Other fungi generally
considered as major causal agents of pea root rot were only present in limited amounts,
and their presence was not correlated to DSI (data not shown). The relative abundance
of other pea root rot pathogens recovered from the nine field soils was generally low:
Alternaria sp. (0.14%), Aphanomyces sp. (0.02%), Fusarium sp. (1.16%), Pythium
spp. (1.26%), and Thielaviopsis sp. (0.01%).

64
Fig. 2. Linear regressions between relative abundance (%) of four fungal genera responding
to soil health status and disease severity index (DSI) of plants grown in the nine respective
soils. (a) Phoma sp., (b) Podospora sp., (c) Pseudaleuria sp., (d) Veronaea sp.
4. Discussion
Analyses of fungal community structure in nine pea field soils revealed
significant differences between fungal communities in soils with diseased plants as
compared to soils with healthy plants, showing a remarkable change in soil fungal
community structure along the soil health gradient. A number of OTUs which showed
significant differences in abundance between soils with high and low DSI were
identified. A clear positive correlation was observed between the abundance of
sequences from an OTU which was closely related to P. medicaginis var. pinodella,
and the DSI of pea plants grown in soils from the different fields. P. medicaginis var.
pinodella has previously been isolated from pea roots with rot symptoms and was the
most frequently isolated pathogen in Southern Scandinavia in a pea field survey
(Persson et al., 1997). P. medicaginis var. pinodella can survive in soil for several
years as chlamydospores (Wallen and Jeun, 1968), and it is highly influenced by crop
rotation practices (Davidson and Ramsey, 2000). A negative correlation was found

65
between Podospora, Pseudaleuria, and Veronaea, and the DSI. To the best of our
knowledge, none of these fungi have previously been reported to be involved in
interactions with plant roots, but results from this study may indicate a role of these
fungi in pea root health and in soil disease suppressiveness. Other major pea root
pathogens, such as A. alternata, A. euteiches, F. oxysporum f. sp. pisi, F. solani f. sp.
pisi, M. pinodes, Pythium spp., R. solani, S. sclerotiorum, and T. basicola, were low in
abundance and did not correlate with the DSI of plants grown in the different soils,
which could be caused by several factors. Firstly, P. medicaginis var. pinodella may
be the only causal agent of pea diseases in these fields. Secondly, it has been shown to
inhibit the growth of M. pinodes in a pea leaf assay (Le May et al., 2009). Thirdly,
some fungi, such as obligate parasites, are dominant in plant roots while others, such
as saprophytic fungi, are dominant in soil (Garrett, 1950). Finally, different fungi
infect pea at different growth stages. Pythium spp., for example, primarily infects
during or immediately after seed germination (Kraft and Pfleger, 2001).
AM fungi are known to play important roles in pea root health (Larsen and
Bødker, 2001; Thygesen et al., 2004). In this study, AM fungi were generally found in
extremely low amounts, and no correlation was found between the abundance of AM
fungi in the nine soils and the DSI. This finding is in contrast to the fact that DSI
correlated negatively with root colonization by AM fungi of the corresponding pea
plants as assessed by microscopy. However, the abundance of AM fungi in soil is not
always correlated to the colonization of roots (Wang et al., 2008). The negative
correlation between AM fungal colonization of roots and DSI confirms several studies
of the antagonistic potential of AM fungi against pathogens in plant roots as reviewed
by e.g. Whipps (2004).
After amalgamation of OTUs at phylum level, no correlations could be observed
between the health status of the soils and the relative abundance of each phylum. In
all soils, Ascomycota was dominant followed by Basidiomycota which is in
accordance with Klaubauf et al. (2010), who found 77.7-88.2% of the clones in the
respective libraries to be Ascomycota, and 7.5-21.3% of Basidiomycota in four arable
soils and one grassland. The low abundance of Oomycota and Glomeromycota is
supported by Sugiyama et al. (2010), who found 0.4% of Oomycota sequences and
0.1% of Glomeromycota sequences in soil from potato fields. Also Jumpponen et al.
(2010) found low levels of Glomeromycota (1%) in a tallgrass prairie soil. However,
66
different primer sets were used in these studies, making a direct comparison difficult
(Bellemain et al., 2010).
The richness of the nine soils was analyzed by constructing rarefaction curves
and by estimating richness using ACE and Chao1 indices. The full richness of the
soils was not recovered in the sampled sequences. The number of OTUs estimated in
the soil samples with Chao1 index at 97% similarity (1145 including singletons),
which was comparable to results from Sugyama et al. (2010), who found estimated
average Chao1 values of 1674 for fungi in potato soils. The numbers of observed and
estimated OTUs were similar in all soils and no correlation could be found to the DSI
of the soils, indicating that the overall fungal diversity of the soils was not affected by
health status. In contrast, Manici and Caputo (2009) found that soil fungal diversity
and the abundance of pathogens in potato roots were negatively correlated, however,
in this study, samples were from soils with different rotation practices, which may
have been the major cause of the lower diversity in soils with high potato cropping
intensity.
Strikingly, 40 OTUs representing 80.6% of the total number of sequences, were
shared by all nine soils, whereas 124 OTUs representing 2.6% of the total number of
sequences, were present in only one of the soils. Klaubauf et al. (2010) only identified
four out of 116 OTUs that were common in at least three soils when comparing five
agricultural soils. However, these soils were selected to “represent different bedrocks,
soil textures, pH values, water, and humus contents”, whereas the soils in the present
experiment were similar in soil characteristics, were sampled within a distance of
approximately 25 km, and were all sown with pea, which may explain the higher
proportion of shared OTUs. Furthermore, the four most abundant OTUs (for all nine
soils) constituted more than half of all reads. In a study of forest soils (Buée et al.,
2009), the four most abundant OTUs constituted 36% of the reads, indicating that, in
general, only a few species dominate fungal communities in soils. This shows that a
few OTUs constitute the majority of fungal biomass in the soils and that these are
shared by most of the analyzed soils. A highly diverse reservoir of less abundant
OTUs was present in the soils. These low abundance fungi may represent a microbial
reservoir that play important functions under environmental stress, when new carbon
sources become available or they may have functions in plant disease that were not
detected in this study.
67
In conclusion, the results obtained from the present NGS study on soils with
diseased and healthy plants, respectively, show that (i) the nine soils could be
discriminated on the basis of their fungal communities, (ii) fungal soil-borne
pathogens could be detected in the bulk soils, and (iii) some of the fungi that
responded to plant health may be used as soil health indicators. A positive correlation
was found between P. medicaginis var. pinodella and DSI, and negative correlations
were found between the DSI and Podospora, Pseudaleuria, and Veronaea, indicating
that these fungi interact with disease development in pea roots. Finally, it was
demonstrated that NGS provides a powerful tool to examine fungal communities
related to plant disease in agricultural soils.
Acknowledgements
This study was financed by the Faculty of Science and Technology, Aarhus
University, Denmark. We thank Karsten Malmskov (Ardo A/S) for assistance and
providing access to the study sites. We are grateful to the editor and to two
anonymous reviewers for their critical comments and suggestions.
References
Abarenkov, K., Nilsson, R.H., Larsson, K.H., Alexander, I.J., Eberhardt, U., Erland,
S., Høiland, K., Kjøller, R., Larsson, E., Pennanen, T., Sen, R., Taylor, A.F.S.,
Tedersoo, L., Ursing, B.M., Vralstad, T., Liimatainen, K., Peintner, U., Kõljalg,
U., 2010. The UNITE database for molecular identification of fungi-recent
updates and future perspectives. New Phytologist 186, 281-285.
Altschul, S.F., Madden, T.L., Schaffer, A.A., Zhang, J.H., Zhang, Z., Miller, W.,
Lipman, D.J., 1997. Gapped BLAST and PSI-BLAST: a new generation of
protein database search programs. Nucleic Acids Research 25, 3389-3402.
Baker, K.F., Cook, R.J., 1974. Biological Control of Plant Pathogens. W.H. Freeman
and Company., San Francisco.
Begerow, D., Nilsson, H., Unterseher, M., Maier, W., 2010. Current state and
perspectives of fungal DNA barcoding and rapid identification procedures.
Applied Microbiology and Biotechnology 87, 99-108.

68
Bellemain, E., Carlsen, T., Brochmann, C., Coissac, E., Taberlet, P., Kauserud, H.,
2010. ITS as an environmental DNA barcode for fungi: an in silico approach
reveals potential PCR biases. BMC Microbiology 10, 189.
Benson, D.A., Karsch-Mizrachi, I., Lipman, D.J., Ostell, J., Sayers, E.W., 2011.
GenBank. Nucleic Acids Research 39, D32-D37.
Binladen, J., Gilbert, M.T.P., Bollback, J.P., Panitz, F., Bendixen, C., Nielsen, R.,
Willerslev, E., 2007. The use of coded PCR primers enables high-throughput
sequencing of multiple homolog amplification products by 454 parallel
sequencing. PLoS ONE 2, e197.
Bretag, T.W., Keane, P.J., Price, T.V., 2006. The epidemiology and control of
ascochyta blight in field peas: a review. Australian Journal of Agricultural
Research 57, 883-902.
Buée, M., Reich, M., Murat, C., Morin, E., Nilsson, R.H., Uroz, S., Martin, F., 2009.
454 Pyrosequencing analyses of forest soils reveal an unexpectedly high fungal
diversity. New Phytologist 184, 449-456.
Bødker, L., Leroul, N., Smedegaardpetersen, V., 1993a. Influence of pea cropping
history on disease severity and yield depression. Plant Disease 77, 896-900.
Bødker, L., Leroul, N., Smedegaardpetersen, V., 1993b. The occurrence in Denmark
of black root-rot of pea caused by Thielaviopsis basicola. Plant Pathology 42,
820-823.
Chao, A., Chazdon, R.L., Colwell, R.K., Shen, T.J., 2005. A new statistical approach
for assessing similarity of species composition with incidence and abundance
data. Ecology Letters 8, 148-159.
Clarke, K.R., 1993. Nonparametric multivariate analyses of changes in community
structure. Australian Journal of Ecology 18, 117-143.
Clarke, K.R., Warwick, R.M., 2001. Change in Marine Communities: an Approach to
Statistical Analysis and Interpretation, 2nd edition. PRIMER-E, Plymouth.
Colwell, R.K., 2009. EstimateS: Statistical Estimation of Species Richness and Shared
Species from Samples. Version 8.2. User's guide and application published at:
http://viceroy.eeb.uconn.edu/estimates.
Davidson, J.A., Ramsey, M.D., 2000. Pea yield decline syndrome in South Australia:
the role of diseases and the impact of agronomic practices. Australian Journal of
Agricultural Research 51, 347-354.

69
Fierer, N., Breitbart, M., Nulton, J., Salamon, P., Lozupone, C., Jones, R., Robeson,
M., Edwards, R.A., Felts, B., Rayhawk, S., Knight, R., Rohwer, F., Jackson, R.B.,
2007. Metagenomic and small-subunit rRNA analyses reveal the genetic
diversity of bacteria, archaea, fungi, and viruses in soil. Applied and
Environmental Microbiology 73, 7059-7066.
Garbeva, P., van Veen, J.A., van Elsas, J.D., 2004. Microbial diversity in soil:
selection of microbial populations by plant and soil type and implications for
disease suppressiveness. Annual Review of Phytopathology 42, 243-270.
Garrett, S.D., 1950. Ecology of the root inhabiting fungi. Biological Reviews of the
Cambridge Philosophical Society 25, 220-254.
Gaulin, E., Jacquet, C., Bottin, A., Dumas, B., 2007. Root rot disease of legumes
caused by Aphanomyces euteiches. Molecular Plant Pathology 8, 539-548.
Gianinazzi, S., Gollotte, A., Binet, M.N., van Tuinen, D., Redecker, D., Wipf, D.,
2010. Agroecology: the key role of arbuscular mycorrhizas in ecosystem services.
Mycorrhiza 20, 519-530.
Giovannetti, M., Mosse, B., 1980. Evaluation of techniques for measuring vesicular
arbuscular mycorrhizal infection in roots. New Phytologist 84, 489-500.
Hibbett, D.S., Ohman, A., Glotzer, D., Nuhn, M., Kirk, P., Nilsson, R.H., 2011.
Progress in molecular and morphological taxon discovery in Fungi and options
for formal classification of environmental sequences. Fungal Biology Reviews 25,
38-47.
Huang, X.Q., Madan, A., 1999. CAP3: a DNA sequence assembly program. Genome
Research 9, 868-877.
Janvier, C., Villeneuve, F., Alabouvette, C., Edel-Hermann, V., Mateille, T.,
Steinberg, C., 2007. Soil health through soil disease suppression: which strategy
from descriptors to indicators? Soil Biology & Biochemistry 39, 1-23.
Jumpponen, A., Jones, K.L., 2009. Massively parallel 454 sequencing indicates
hyperdiverse fungal communities in temperate Quercus macrocarpa
phyllosphere. New Phytologist 184, 438-448.
Jumpponen, A., Jones, K.L., Blair, J., 2010. Vertical distribution of fungal
communities in tallgrass prairie soil. Mycologia 102, 1027-1041.
Klaubauf, S., Inselsbacher, E., Zechmeister-Boltenstern, S., Wanek, W., Gottsberger,
R., Strauss, J., Gorfer, M., 2010. Molecular diversity of fungal communities in
agricultural soils from Lower Austria. Fungal Diversity 44, 65-75.
70
Kraft, J.M., Pfleger, F.L., 2001. Compendium of Pea Diseases and Pests. American
Phytopathological Society (APS Press), St. Paul, MN.
Larsen, J., Bødker, L., 2001. Interactions between pea root-inhabiting fungi examined
using signature fatty acids. New Phytologist 149, 487-493.
Le May, C., Potage, G., Andrivon, D., Tivoli, B., Outreman, Y., 2009. Plant disease
complex: antagonism and synergism between pathogens of the Ascochyta blight
complex on pea. Journal of Phytopathology 157, 715-721.
Lumini, E., Orgiazzi, A., Borriello, R., Bonfante, P., Bianciotto, V., 2010. Disclosing
arbuscular mycorrhizal fungal biodiversity in soil through a land-use gradient
using a pyrosequencing approach. Environmental Microbiology 12, 2165-2179.
Manici, L.M., Caputo, F., 2009. Fungal community diversity and soil health in
intensive potato cropping systems of the east Po valley, northern Italy. Annals of
Applied Biology 155, 245-258.
Margulies, M., Egholm, M., Altman, W.E., Attiya, S., Bader, J.S., Bemben, L.A.,
Berka, J., Braverman, M.S., Chen, Y.J., Chen, Z.T., Dewell, S.B., Du, L., Fierro,
J.M., Gomes, X.V., Godwin, B.C., He, W., Helgesen, S., Ho, C.H., Irzyk, G.P.,
Jando, S.C., Alenquer, M.L.I., Jarvie, T.P., Jirage, K.B., Kim, J.B., Knight, J.R.,
Lanza, J.R., Leamon, J.H., Lefkowitz, S.M., Lei, M., Li, J., Lohman, K.L., Lu, H.,
Makhijani, V.B., Mcdade, K.E., McKenna, M.P., Myers, E.W., Nickerson, E.,
Nobile, J.R., Plant, R., Puc, B.P., Ronan, M.T., Roth, G.T., Sarkis, G.J., Simons,
J.F., Simpson, J.W., Srinivasan, M., Tartaro, K.R., Tomasz, A., Vogt, K.A.,
Volkmer, G.A., Wang, S.H., Wang, Y., Weiner, M.P., Yu, P.G., Begley, R.F.,
Rothberg, J.M., 2005. Genome sequencing in microfabricated high-density
picolitre reactors. Nature 437, 376-380.
Martin, K.J., Rygiewicz, P.T., 2005. Fungal-specific PCR primers developed for
analysis of the ITS region of environmental DNA extracts. BMC Microbiology 5,
28.
Nilsson, R.H., Ryberg, M., Abarenkov, K., Sjökvist, E., Kristiansson, E., 2009. The
ITS region as a target for characterization of fungal communities using emerging
sequencing technologies. FEMS Microbiology Letters 296, 97-101.
Nilsson, R.H., Veldre, V., Hartmann, M., Unterseher, M., Amend, A., Bergsten, J.,
Kristiansson, E., Ryberg, M., Jumpponen, A., Abarenkov, K., 2010. An open
source software package for automated extraction of ITS1 and ITS2 from fungal
71
ITS sequences for use in high-throughput community assays and molecular
ecology. Fungal Ecology 3, 284-287.
Persson, L., Bødker, L., Larsson-Wikström, M., 1997. Prevalence and pathogenicity
of foot and root rot pathogens of pea in southern Scandinavia. Plant Disease 81,
171-174.
Phillips, J.M., Hayman, D.S., 1970. Improved procedures for clearing roots and
staining parasitic and vesicular-arbuscular mycorrhizal fungi for rapid assessment
of infection. Transactions of the British Mycological Society 55, 158-161.
Rousk, J., Bååth, E., Brookes, P.C., Lauber, C.L., Lozupone, C., Caporaso, J.G.,
Knight, R., Fierer, N., 2010. Soil bacterial and fungal communities across a pH
gradient in an arable soil. The ISME Journal 4, 1340-1351.
Stajich, J.E., Berbee, M.L., Blackwell, M., Hibbett, D.S., James, T.Y., Spatafora, J.W.,
Taylor, J.W., 2009. The fungi. Current Biology 19, R840-R845.
Sugiyama, A., Vivanco, J.M., Jayanty, S.S., Manter, D.K., 2010. Pyrosequencing
assessment of soil microbial communities in organic and conventional potato
farms. Plant Disease 94, 1329-1335.
Tedersoo, L., Nilsson, R.H., Abarenkov, K., Jairus, T., Sadam, A., Saar, I., Bahram,
M., Bechem, E., Chuyong, G., Kõljalg, U., 2010. 454 Pyrosequencing and Sanger
sequencing of tropical mycorrhizal fungi provide similar results but reveal
substantial methodological biases. New Phytologist 188, 291-301.
Thygesen, K., Larsen, J., Bødker, L., 2004. Arbuscular mycorrhizal fungi reduce
development of pea root-rot caused by Aphanomyces euteiches using oospores as
pathogen inoculum. European Journal of Plant Pathology 110, 411-419.
Wallen, V.R., Jeun, J., 1968. Factors limiting survival of Ascochyta spp. of peas in
soil. Canadian Journal of Botany 46, 1279-1286.
Wang, Y.Y., Vestberg, M., Walker, C., Hurme, T., Zhang, X.P., Lindstrom, K., 2008.
Diversity and infectivity of arbuscular mycorrhizal fungi in agricultural soils of
the Sichuan Province of mainland China. Mycorrhiza 18, 59-68.
Whipps, J.M., 2004. Prospects and limitations for mycorrhizas in biocontrol of root
pathogens. Canadian Journal of Botany-Revue Canadienne de Botanique 82,
1198-1227.
White, T.J., Bruns, T.D., Lee, S.B., Taylor, J.W., 1990. Amplification and direct
sequencing of fungal ribosomal RNA genes for phylogenetics. In: Innis, M.A.,

72
Gelfand, D.H., Sninsky, J.J., White, T.J. (Eds), PCR Protocols: a Guide to
Methods and Applications. Academic Press, New York, NY, pp. 315-322.

73
4 Paper III
Fungal community structure in roots, rhizosphere, and bulk soil
associated with plant root health as examined by deep amplicon
sequencing
Lihui Xu1, Sabine Ravnskov
1, John Larsen
2, Mogens Nicolaisen
1
1Department of Agroecology, Faculty of Science and Technology, Aarhus University,
Slagelse, Denmark
2Centro de Investigaciones en Ecosistemas, Universidad Nacional Autónoma de
México, C.P. 58190 Morelia, Michoacán, México
Correspondence: Mogens Nicolaisen, Department of Agroecology, Faculty of Science
and Technology, Aarhus University, Forsøgsvej 1, 4200 Slagelse, Denmark.
E-mail: [email protected]
(Manuscript in preparation)

74
Abstract
Fungi play a pivotal role in the function of plant roots and their interaction with
the surrounding soil, having strong effects on plant health, both as pathogens but also
as suppressors of plant disease. In this study, next-generation amplicon sequencing
was explored in order to characterize fungal communities in diseased and healthy
plant roots, their surrounding rhizosphere and the adjacent bulk soil. Samples were
taken from three agricultural fields. Fungal species richness, diversity, and community
composition was analyzed and compared among the three environments among the
three fields and between diseased and healthy samples. Fungal species richness was
highest in bulk soil and lowest in roots. Fungal communities in all samples were
strongly dominated by Dikarya, and differed significantly among the three
environments. Fusarium oxysporum and Aphanomyces euteiches were the likely
causes of root rot in the respective fields as assessed by pyrosequencing data and
quantitative PCR. Glomus and Fusarium species were significantly more abundant in
roots, whereas Cryptococcus and Mortierella species were almost exclusively found
in the rhizosphere and bulk soil. A clear correlation was demonstrated between health
status of roots and their fungal communities. The results showed that fungal
community structures are highly variable in the three different ecological niches,
between healthy and diseased roots, and across different fields.
Key words: fungal community, root fungi, soil fungi, nuclear ribosomal internal
transcribed spacer-1 (ITS1), pea root rot, rhizosphere, bulk soil, pyrosequencing.

75
Introduction
Microorganisms in rhizosphere and bulk soil include fungi, bacteria, algae,
protozoa, and nematodes (Raaijmakers et al., 2009). Fungi are an immensely diverse
group of organisms that play crucial roles in agricultural soils as degraders of organic
material, as plant pathogens, or as beneficial organisms that suppress plant pathogens
or promote plant growth. The interaction between fungi and plant roots can, under
unfavorable conditions, lead to disease, which in many cases is caused by complexes
of different fungi. Pea roots, for instance, can be infected by a number of fungi or
fungus-like organisms that together, or alone, are able to cause disease (Kraft &
Pfleger, 2001). Arbuscular mycorrhizal (AM) fungi can improve the nutrient status of
their host plants (Smith & Read, 2008), but can also have a strong influence on plant
health by suppressing various pathogens (Gianinazzi et al., 2010; Larsen & Bødker,
2001; Whipps, 2004). The root, rhizosphere, and bulk soil are all important reservoirs
for fungi and other microorganisms that may cause disease. However, they represent
different habitats, which are reflected in the fungal communities that make up the
three environments. Roots can host an extensive fungal diversity (Vandenkoornhuyse
et al., 2002) including symbiotic and parasitic fungi that live on plant sugars whereas
soils, which are rich in organic matter, are abundant in saprophytic fungi. The bulk
soil is the main reservoir of fungi in the rhizosphere (Berg & Smalla, 2009), an
environment that is rich in both root exudates and soil organic matter, both of which
are driving forces in the population density and activities of the communities
(Raaijmakers et al., 2009).
The interaction between soil health and plant roots has mainly been investigated
by studying individual species or groups of microorganisms. Molecular methods have
dramatically advanced fungal discovery (Blackwell, 2011), and various biochemical-
based and molecular-based techniques have been developed to assess fungal
communities in soil. However, many of these technologies lack resolution. With the
recent development of next-generation sequencing (NGS), in particular 454 deep
amplicon sequencing (Margulies et al., 2005), studies of microbial communities from
different ecological niches have reached a hitherto unseen amount of data and
resolution (Buée et al., 2009; Jumpponen & Jones, 2009; Jumpponen et al., 2010;
Lumini et al., 2010; Rousk et al., 2010; Sugiyama et al., 2010).
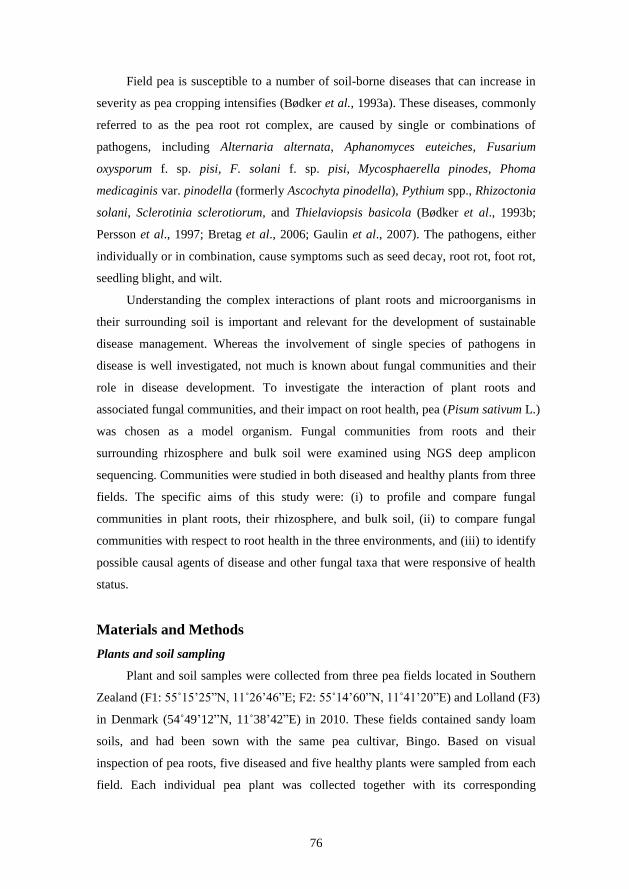
76
Field pea is susceptible to a number of soil-borne diseases that can increase in
severity as pea cropping intensifies (Bødker et al., 1993a). These diseases, commonly
referred to as the pea root rot complex, are caused by single or combinations of
pathogens, including Alternaria alternata, Aphanomyces euteiches, Fusarium
oxysporum f. sp. pisi, F. solani f. sp. pisi, Mycosphaerella pinodes, Phoma
medicaginis var. pinodella (formerly Ascochyta pinodella), Pythium spp., Rhizoctonia
solani, Sclerotinia sclerotiorum, and Thielaviopsis basicola (Bødker et al., 1993b;
Persson et al., 1997; Bretag et al., 2006; Gaulin et al., 2007). The pathogens, either
individually or in combination, cause symptoms such as seed decay, root rot, foot rot,
seedling blight, and wilt.
Understanding the complex interactions of plant roots and microorganisms in
their surrounding soil is important and relevant for the development of sustainable
disease management. Whereas the involvement of single species of pathogens in
disease is well investigated, not much is known about fungal communities and their
role in disease development. To investigate the interaction of plant roots and
associated fungal communities, and their impact on root health, pea (Pisum sativum L.)
was chosen as a model organism. Fungal communities from roots and their
surrounding rhizosphere and bulk soil were examined using NGS deep amplicon
sequencing. Communities were studied in both diseased and healthy plants from three
fields. The specific aims of this study were: (i) to profile and compare fungal
communities in plant roots, their rhizosphere, and bulk soil, (ii) to compare fungal
communities with respect to root health in the three environments, and (iii) to identify
possible causal agents of disease and other fungal taxa that were responsive of health
status.
Materials and Methods
Plants and soil sampling
Plant and soil samples were collected from three pea fields located in Southern
Zealand (F1: 55˚15‟25”N, 11˚26‟46”E; F2: 55˚14‟60”N, 11˚41‟20”E) and Lolland (F3)
in Denmark (54˚49‟12”N, 11˚38‟42”E) in 2010. These fields contained sandy loam
soils, and had been sown with the same pea cultivar, Bingo. Based on visual
inspection of pea roots, five diseased and five healthy plants were sampled from each
field. Each individual pea plant was collected together with its corresponding
77
rhizosphere soil and 50 g of adjacent bulk soil. Rhizosphere soil was collected by
carefully brushing roots, and root hairs were subsequently removed from the collected
soil. Soil was removed from roots by washing, and roots were then scored for root and
tap-root rotting on a 0-6 scale of disease severity index (DSI) as follows: 0 = healthy
plant without any visible symptoms; 1 = discoloration of less than 10% on a single
root; 2 = discoloration of approximately 25% of the root system; 3 = about 50% of the
root system was dark and affected; 4 = about 75% of the root system was dark and
affected but no symptoms on epicotyl or leaves; 5 = the whole root system, together
with the epicotyl, was dark and affected and the lowest leaves were wilted; and 6 =
dead plant. After scoring, roots were frozen at -80 ◦C.
DNA extraction
Freeze dried soil samples and pea plant roots were homogenized in a
Geno/Grinder 2000 (SPEX CertiPrep, Metuchen, NJ) 6 times for 40s in plastic tubes
with eight steel beads, which had been pre-chilled in liquid nitrogen. DNA was
extracted from rhizosphere soil and bulk soil using the PowerSoil DNA Isolation Kit
(Mo Bio Laboratories, Inc., Carlsbad, CA, USA), and from roots using the DNeasy
Plant Mini Kit (Qiagen GmbH, Hilden, Germany) according to the manufacturer‟s
instructions.
Quantitative PCR analysis
Due to primer choice, oomycetes could not be detected during pyrosequencing.
In order to test for the presence of A. euteiches in the 30 pea root samples, a Q-PCR
assay was performed in a 384-well optical reaction plate, using the primers
136F/211R and the probe 161T (Vandemark et al., 2002). In a final volume of 15 μl,
assays contained 2 μl of DNA template, 7.5 μl of TaqMan Universal PCR Mastermix
(Applied Biosystems Inc., Foster City, CA, USA), 900 nM of each primer (136F,
211R) and 500 nM of probe (161T). The thermal cycle protocol was used as described
in (Sauvage et al., 2007) in the ABI 7900HT Sequence Detection System (Applied
Biosystems Inc., Foster City, CA, USA). Samples were tested in triplicate.
PCR amplification, purification and pyrosequencing
To amplify the ITS1 region, primers ITS1-F (CTT GGT CAT TTA GAG GAA
GTAA) (Gardes & Bruns, 1993) and 58A2R (CTG CGT TCT TCA TCG AT) (Martin
78
& Rygiewicz, 2005) were used. To generate amplicons for 454 pyrosequencing, PCR
amplification was performed as a two-step program. The first PCR step was
performed with primer pair ITS1F and 58A2R, and then 1 μl of PCR product was
used as template for the next step. The second PCR step was performed with a tag
encoded primer set using the forward primer: (5‟-
CGTATCGCCTCCCTCGCGCCATCAG-MID-ITS1F-3‟) and reverse primer (5‟-
CTATGCGCCTTGCCAGCCCGCTCAG-MID-58A2R-3‟). Thirty 10-nucleotide
MID primer tags for sample identification after pooling were selected randomly from
the list of recommended MID primer tags from Eurofins MWG GmbH (Germany).
Primers were synthesized by Eurofins MWG GmbH (Germany). PCR reactions for
both PCR steps contained 1 × PCR reaction buffer, 1.5 mM MgC12, 0.4 mM dNTPs,
1 μM each primer, 1 U of Taq DNA recombinant polymerase (Invitrogen Corporation,
Carlsbad, USA) and 1 μl of DNA template in a final volume of 25 μl. All
amplifications were conducted in a GeneAmp PCR System 9700 thermal cycler (PE
Applied Biosystems) using an initial DNA denaturation step of 94 ◦C for 5 min,
followed by 20 cycles at 94 ◦C for 15 s, 50
◦C for 30 s, 72
◦C for 30 s, and a final
elongation at 72 ◦C for 7 min. PCR products were analyzed by electrophoresis in a
1.5% agarose gel.
The concentration of amplicons was measured by a 2100 Bioanalyzer (Agilent
Technologies, Inc., Santa Clara, CA, USA) according to the manufacturer‟s
instructions. PCR amplicons of roots, rhizosphere soil, and bulk soil were pooled in
equimolar amounts from the 30 samples (health status (2) × environment (3) ×
replicates (5)) of all three fields, precipitated, and then redissolved in 10 µl TE buffer.
The pooled amplicons were electrophoresed in 1.5% agarose gels, and a smear of
PCR products at 320-360 bp were cut from a gel and purified using QIAquick Gel
Extraction Kit (Qiagen GmbH, Hilden, Germany). The final three samples were
sequenced by Eurofins MWG on a 454 Life Sciences Genome Sequencer FLX
machine using Titanium series chemistry (Roche Diagnostics) on a 1/4 plate each and
sequence data were delivered as MID tag-sorted sequences.
OTU (Operational Taxonomic Unit)-based sequence analysis
Sequence filtering, clustering, and BLAST searches were performed on the
freely available computational resource Bioportal at the University of Oslo
(http://www.bioportal.uio.no) using the CLOTU application (Kumar et al., 2011). All

79
sequences generated from each of the three environments (30 samples) were analyzed
together to identify operational taxonomic units (OTUs). Initially, reads were filtered
by discarding sequences in which primers and tag could not be identified and which
were shorter than 150 bp. Remaining sequences were clustered using BLASTclust at
97% similarity and 90% coverage, and singletons were subsequently omitted from the
dataset. BLAST searches were performed using a combination of (i) the BLAST
feature in the CLOTU program, which selects one sequence from each cluster (the
longest) and uses NCBI-BLASTn against the non-redundant GenBank database, and
(ii) manual BLAST searches in GenBank using a set of randomly selected sequences.
In both approaches, uncultured fungi were filtered from the results. Rarefaction
analysis was performed using Analytic Rarefaction v.1.3 (Hunt Mountain Software,
Department of Geology, University of Georgia, Athens, GA, USA). The non-
parametric estimators Abundance Coverage Estimator (ACE) and Chao1 were
calculated using the EstimateS v.8.2 software package (Colwell, 2009) with default
settings.
Statistical analyses
Fungal diversity observed and estimated by ACE and Chao1, the abundance of
fungi at phylum level, and the 10 most abundant OTUs from roots, rhizosphere and
bulk soil were subjected to one- and two-way analysis of variance (ANOVA) to
examine levels of significance (P < 0.05) of main factors and their interactions. To
identify fungi among the rare OTUs that were significantly different between diseased
and healthy plants, one-way ANOVA for OTUs from the three environments were
performed with an abundance limit value of 0.1% of all reads. Prior to ANOVA, the
data were analyzed for normal distribution and variance homogeneity by Bartlett‟s
test (P > 0.05). Post-ANOVA mean comparisons were performed with least
significant difference (LSD) values. Data were log- or square root-transformed under
the statistical analysis, when required according to Bartlett‟s test.
Principal component analysis (PCA) was performed on the 10 most abundant
OTUs in roots, rhizosphere and bulk soil, respectively. The scores of the first two
components from the PCA were used to compare differences in fungal communities
between plants of differing health status and across the fields. PCA was performed at
phylum level to compare the fungal community in different environments. Standard
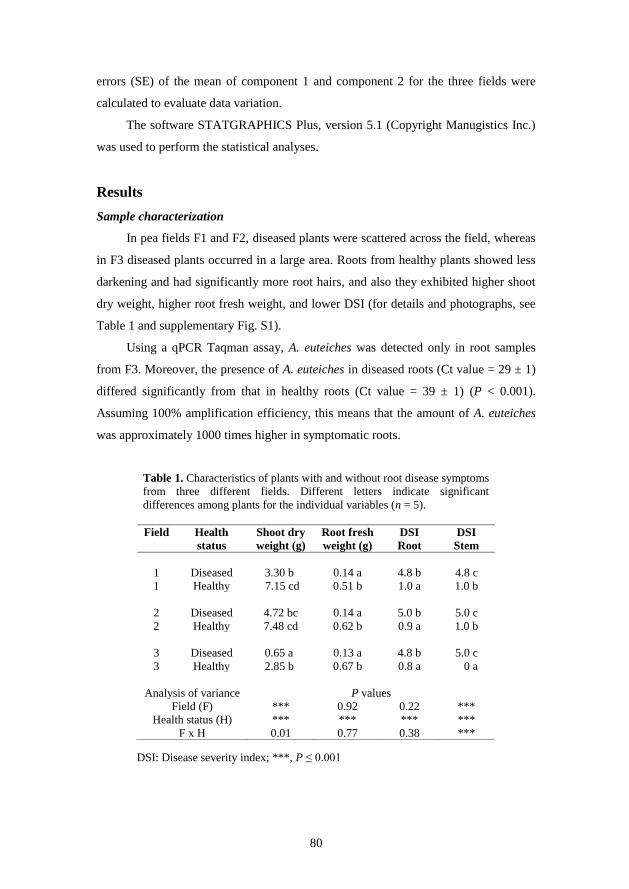
80
errors (SE) of the mean of component 1 and component 2 for the three fields were
calculated to evaluate data variation.
The software STATGRAPHICS Plus, version 5.1 (Copyright Manugistics Inc.)
was used to perform the statistical analyses.
Results
Sample characterization
In pea fields F1 and F2, diseased plants were scattered across the field, whereas
in F3 diseased plants occurred in a large area. Roots from healthy plants showed less
darkening and had significantly more root hairs, and also they exhibited higher shoot
dry weight, higher root fresh weight, and lower DSI (for details and photographs, see
Table 1 and supplementary Fig. S1).
Using a qPCR Taqman assay, A. euteiches was detected only in root samples
from F3. Moreover, the presence of A. euteiches in diseased roots (Ct value = 29 ± 1)
differed significantly from that in healthy roots (Ct value = 39 ± 1) (P < 0.001).
Assuming 100% amplification efficiency, this means that the amount of A. euteiches
was approximately 1000 times higher in symptomatic roots.
DSI: Disease severity index; ***, P ≤ 0.001
Table 1. Characteristics of plants with and without root disease symptoms
from three different fields. Different letters indicate significant
differences among plants for the individual variables (n = 5).
Field Health
status
Shoot dry
weight (g)
Root fresh
weight (g)
DSI
Root
DSI
Stem
1 Diseased 3.30 b 0.14 a 4.8 b 4.8 c
1 Healthy 7.15 cd 0.51 b 1.0 a 1.0 b
2 Diseased 4.72 bc 0.14 a 5.0 b 5.0 c
2 Healthy 7.48 cd 0.62 b 0.9 a 1.0 b
3 Diseased 0.65 a 0.13 a 4.8 b 5.0 c
3 Healthy 2.85 b 0.67 b 0.8 a 0 a
Analysis of variance P values
Field (F) *** 0.92 0.22 ***
Health status (H) *** *** *** ***
F x H 0.01 0.77 0.38 ***

81
OTUs abundance and richness
After quality filtering, the root dataset contained 151,563 sequences, which
were clustered into 123 non-singleton OTUs (139,309 reads), the rhizosphere soil
dataset contained 182,577 reads, which were clustered into 271 non-singleton OTUs
(165,364 reads), and the bulk soil data set contained 166,321 reads, which were
clustered into 440 non-singleton OTUs (155,043 reads). The average number of
filtered reads in the 90 samples was 5108 (± 1164).
BLAST searches in the GenBank database identified all non-singletons as fungi.
The average relative abundance of five biological replicates of each OTU is listed in
the supplementary material (Table S1) together with their best BLAST hits in
GenBank.
Plotting the number of OTUs observed versus the number of sequences sampled
resulted in rarefaction curves that did not reach a plateau in the bulk soil samples,
whereas the curves from root and rhizosphere samples were close to reaching a
plateau (data not shown). At 97% sequence similarity, ACE and Chao1 richness
estimators were calculated (Table 2). One-way ANOVA indicated that the estimated
fungal community richness was significantly different across the three environments,
with bulk soil showing the highest diversity, while roots showed the lowest diversity.
Two-way ANOVA indicated that the factor environment (E) had a statistically
significant effect on the OTUs observed at the 95% confidence level. However,
generally no clear trend was observed in health status and diversity.

82
ANOVA, Analysis of variance; E, Environment; H, Health status
*, P < 0.05; **, P < 0.01; ***, P < 0.001
Table 2. Fungal diversity observed, and estimated by ACE and Chao1 in roots,
rhizosphere and bulk soils from diseased and healthy areas of three different pea
fields. Different letters indicate significant difference between treatment means
as examined in terms of multiple range test (n = 5) (Variance homogeneity was
unavailable with Bartlett's test in Field 1).
Field Environment Health status Observed ACE Chao1
Field 1 Root Diseased 39 a 69 a 74 a
Root Healthy 55 a 70 a 73 a
Rhizosphere Diseased 151 b 203 bc 206 bc
Rhizosphere Healthy 134 b 172 b 175 b
Soil Diseased 217 d 348 d 355 d
Soil Healthy 183 c 241 c 244 c
P values
ANOVA Environment *** *** ***
Health status 0.16 * *
E × H 0.06 * 0.05
Field 2 Root Diseased 11 a 24 a 25 a
Root Healthy 32 b 41 a 44 a
Rhizosphere Diseased 105 c 134 b 138 b
Rhizosphere Healthy 98 c 119 b 122 b
Soil Diseased 147 d 187 c 190 c
Soil Healthy 146 d 191 c 194 c
P values
ANOVA Environment *** *** ***
Health status 0.16 0.81 0.77
E × H ** 0.27 0.24
Field 3 Root Diseased 25 a 35 a 43 a
Root Healthy 30 a 40 a 44 a
Rhizosphere Diseased 98 c 119 b 121 b
Rhizosphere Healthy 85 b 100 b 103 b
Soil Diseased 136 d 171 c 174 c
Soil Healthy 131 d 180 c 185 c
P values
ANOVA Environment *** *** ***
Health status 0.14 0.85 0.84
E × H * 0.31 0.37
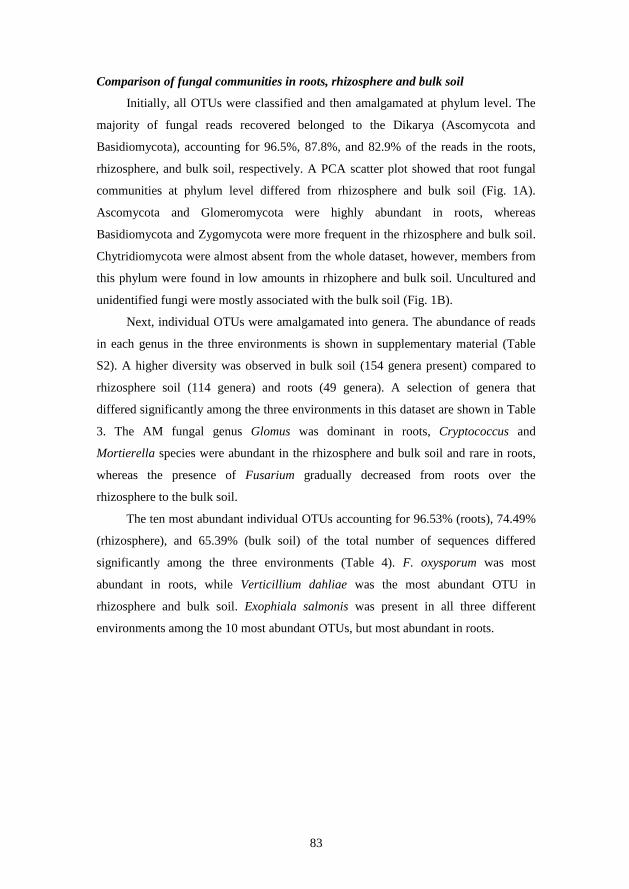
83
Comparison of fungal communities in roots, rhizosphere and bulk soil
Initially, all OTUs were classified and then amalgamated at phylum level. The
majority of fungal reads recovered belonged to the Dikarya (Ascomycota and
Basidiomycota), accounting for 96.5%, 87.8%, and 82.9% of the reads in the roots,
rhizosphere, and bulk soil, respectively. A PCA scatter plot showed that root fungal
communities at phylum level differed from rhizosphere and bulk soil (Fig. 1A).
Ascomycota and Glomeromycota were highly abundant in roots, whereas
Basidiomycota and Zygomycota were more frequent in the rhizosphere and bulk soil.
Chytridiomycota were almost absent from the whole dataset, however, members from
this phylum were found in low amounts in rhizophere and bulk soil. Uncultured and
unidentified fungi were mostly associated with the bulk soil (Fig. 1B).
Next, individual OTUs were amalgamated into genera. The abundance of reads
in each genus in the three environments is shown in supplementary material (Table
S2). A higher diversity was observed in bulk soil (154 genera present) compared to
rhizosphere soil (114 genera) and roots (49 genera). A selection of genera that
differed significantly among the three environments in this dataset are shown in Table
3. The AM fungal genus Glomus was dominant in roots, Cryptococcus and
Mortierella species were abundant in the rhizosphere and bulk soil and rare in roots,
whereas the presence of Fusarium gradually decreased from roots over the
rhizosphere to the bulk soil.
The ten most abundant individual OTUs accounting for 96.53% (roots), 74.49%
(rhizosphere), and 65.39% (bulk soil) of the total number of sequences differed
significantly among the three environments (Table 4). F. oxysporum was most
abundant in roots, while Verticillium dahliae was the most abundant OTU in
rhizosphere and bulk soil. Exophiala salmonis was present in all three different
environments among the 10 most abundant OTUs, but most abundant in roots.

84
Fig. 1. Two-dimensional principle component analysis (PCA) of fungal communities of fungi
recovered at the phylum level in roots (triangle), rhizosphere (square), and bulk soil (circle)
with different root health status from three fields. The different fields are indicated by color –
Field 1 (white), Field 2 (grey), and Field 3 (black). Root health status is indicated by D
(diseased) and H (Healthy). Scores and loadings from PCA of the fungal communities of
fungi are presented in (A) and (B), repectively. Error bars represent standard errors of the
mean (n = 5).
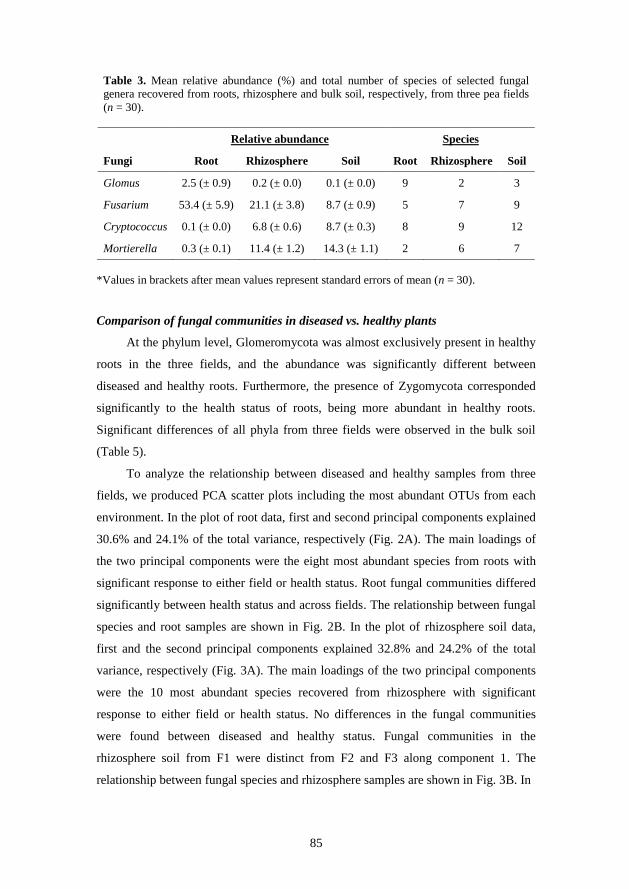
85
Table 3. Mean relative abundance (%) and total number of species of selected fungal
genera recovered from roots, rhizosphere and bulk soil, respectively, from three pea fields
(n = 30).
Relative abundance Species
Fungi Root Rhizosphere Soil Root Rhizosphere Soil
Glomus 2.5 (± 0.9) 0.2 (± 0.0) 0.1 (± 0.0) 9 2 3
Fusarium 53.4 (± 5.9) 21.1 (± 3.8) 8.7 (± 0.9) 5 7 9
Cryptococcus 0.1 (± 0.0) 6.8 (± 0.6) 8.7 (± 0.3) 8 9 12
Mortierella 0.3 (± 0.1) 11.4 (± 1.2) 14.3 (± 1.1) 2 6 7
*Values in brackets after mean values represent standard errors of mean (n = 30).
Comparison of fungal communities in diseased vs. healthy plants
At the phylum level, Glomeromycota was almost exclusively present in healthy
roots in the three fields, and the abundance was significantly different between
diseased and healthy roots. Furthermore, the presence of Zygomycota corresponded
significantly to the health status of roots, being more abundant in healthy roots.
Significant differences of all phyla from three fields were observed in the bulk soil
(Table 5).
To analyze the relationship between diseased and healthy samples from three
fields, we produced PCA scatter plots including the most abundant OTUs from each
environment. In the plot of root data, first and second principal components explained
30.6% and 24.1% of the total variance, respectively (Fig. 2A). The main loadings of
the two principal components were the eight most abundant species from roots with
significant response to either field or health status. Root fungal communities differed
significantly between health status and across fields. The relationship between fungal
species and root samples are shown in Fig. 2B. In the plot of rhizosphere soil data,
first and the second principal components explained 32.8% and 24.2% of the total
variance, respectively (Fig. 3A). The main loadings of the two principal components
were the 10 most abundant species recovered from rhizosphere with significant
response to either field or health status. No differences in the fungal communities
were found between diseased and healthy status. Fungal communities in the
rhizosphere soil from F1 were distinct from F2 and F3 along component 1. The
relationship between fungal species and rhizosphere samples are shown in Fig. 3B. In

86
Table 4. Relative abundance (%) of ten most dominant fungal OTUs recovered from pea roots,
rhizosphere soil, and bulk soil sampled from three different pea fields from diseased (D) and healthy (H)
areas of the respective fields. Different letters indicate significant differences between treatment means
according to multiple range test (n = 5).
Field 1 Field 2 Field 3 P values from
ANOVA
D H D H D H Field
(F)
Health
(H)
F x H
Roots
Fusarium oxysporum 73.9cd 19.0a 94.3e 42.4ab 21.8a 65.2bc * ** ***
Exophiala salmonis 19.4c 63.0d 0.6a 16.2bc 2.5ab 2.8ab *** *** ***
Leohumicola minima 0a 0a 0a 0a 55.4b 4.3a *** *** ***
Epicoccum nigrum 0.1a 4.7a 0a 30.5b 0a 0a * * *
Neonectria radicicola 0.7a 0.02a 0a 0.2a 14.9b 15.9b *** 0.91 0.96
Glomus mosseae 0.1a 1.8ab 0a 6.7b 0a 0.2ab 0.29 * 0.27
Bionectria ochroleuca 2.4ab 1.2ab 4.4b 0.1ab 0a 1.3ab 0.35 0.33 0.23
Dendryphion nanum 0a 0a 0a 0a 2.3b 0.1ab * 0.29 0.32
Uncultured fungus 0.2a 2.4b 0a 0.8a 0a 0a 0.06 * 0.11
Fusarium culmorum 0a 0a 0a 0a 0a 2.6a 0.37 0.32 0.37
Rhizosphere soil
Verticillium dahliae 5.9a 5.8a 30.1c 34.6c 14.7b 21.6b *** 0.11 0.45
Fusarium oxysporum 42.7b 33.2b 8.3a 7.7a 3.1a 5.3a *** 0.50 0.65
Trichocladium asperum 2.5bc 3.1bc 2.9ab 0.3a 24.6cd 26.3d *** 0.97 0.64
Bionectria ochroleuca 2.8b 3.1b 13.5c 12.3c 0.2a 0.4a *** 0.31 0.27
Cryptococcus aerius 3.1a 3.8ab 5.5ab 6.1b 5.8ab 5.8ab * 0.60 0.92
Mortierella sp. 1.7a 4.4ab 2.8ab 2.3ab 9.1c 6.1bc ** 0.82 0.18
Phoma eupyrena 2.6a 2.7a 4.1ab 5.2b 5.7b 4.2ab * 0.83 0.26
Mortierella elongata 4.3abc 6.2c 2.4a 2.1a 3.2ab 5.1bc ** 0.09 0.28
Fusarium merismoides 2.8ab 3.2ab 1.7a 1.6a 5.7b 4.5ab * 0.74 0.78
Exophiala salmonis 3.0bc 3.3c 2.0ab 1.9bc 1.2ab 0.4a *** 0.69 0.41
Bulk soil
Verticillium dahliae 11.7a 11.5a 38.0c 38.1c 20.7b 34.2c *** ** ***
Phoma eupyrena 3.9a 4.4ab 5.6bc 6.4c 10.1c 8.6c *** 0.87 0.12
Cryptococcus aerius 5.2a 5.6ab 6.1ab 6.5abc 7.8c 7.1bc ** 0.99 0.51
Mortierella sp. 3.7a 5.5ab 3.0a 3.2a 10.2b 7.2ab * 0.92 0.54
Mortierella elongata 7.3c 8.5c 2.7a 2.0a 2.6a 4.6b *** 0.07 0.06
Fusarium oxysporum 10.1c 5.5b 3.4ab 3.0ab 1.8a 2.1ab *** 0.12 0.11
Fusarium merismoides 4.9bc 6.0c 2.1a 2.0a 4.1b 4.8b *** 0.10 0.32
Exophiala salmonis 4.7d 6.0e 2.5c 2.4c 1.8b 0.9a *** 0.46 ***
Dokmaia monthadangii 2.0a 1.6a 3.6c 3.0bc 1.7a 2.3ab *** 0.62 0.17
Aleuria aurantia 3.6b 7.6c 0.1a 0.2a 2.5b 0.6a *** 0.08 ***
*, P < 0.05; **, P < 0.01; ***, P < 0.001
87
the plot of bulk soil data, the first and the second principal components explained
49.7% and 20.2% of the total variance, respectively (Fig. 4A). The main loadings of
the two principal components were the 10 most abundant species identified from soil
with significantly response to either field or health status. The difference between
fungal communities across fields was distinct, but differed only moderately between
plants of differing health status. The relationship between fungal species and bulk soil
samples are shown in Fig. 4B.
A number of individual OTUs differed significantly based on health status in
individual fields (Table 4, and Table S1). Ten OTUs in roots, 3 OTUs in the
rhizosphere soil, and 26 OTUs in the bulk soil responded significantly to health status
(Table S1). In Table 4, the 10 most abundant OTUs are listed. The four most abundant
species in roots, F. oxysporum, E. salmonis, Leohumicola minima, and Epicoccum
nigrum were all significantly different between diseased and healthy samples within
each field, and also across fields. The most dominant species in bulk soil, V. dahliae,
was significantly different between diseased and healthy plants in F3. None of the 10
most abundant OTUs from the rhizosphere soil were significantly different between
diseased and healthy samples. In all three environments in F1 and F2, F. oxysporum
was more abundant in diseased samples compared to healthy samples, while the
reverse was observed in F3. E. salmonis was more abundant in healthy roots
compared to diseased roots in F1 and F2, but with no significant difference in F3. In
the bulk soil of F3, V. dahlia was more dominant in healthy than in diseased samples,
but with a similar abundance in F1 and F2. The abundance of Glomus mosseae
correlated with the health status being less abundant or even absent in diseased roots.
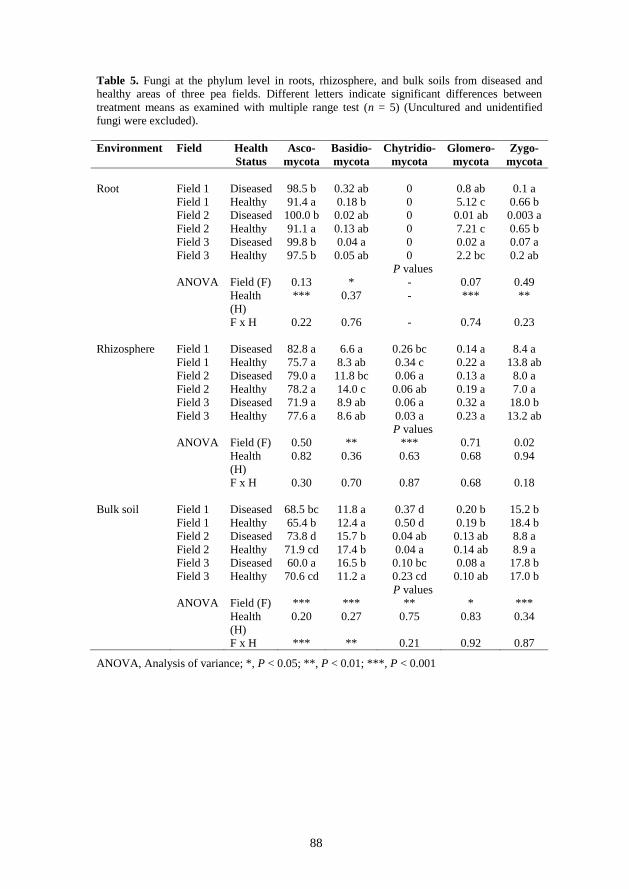
88
Table 5. Fungi at the phylum level in roots, rhizosphere, and bulk soils from diseased and
healthy areas of three pea fields. Different letters indicate significant differences between
treatment means as examined with multiple range test (n = 5) (Uncultured and unidentified
fungi were excluded).
Environment Field Health
Status
Asco-
mycota
Basidio-
mycota
Chytridio-
mycota
Glomero-
mycota
Zygo-
mycota
Root Field 1 Diseased 98.5 b 0.32 ab 0 0.8 ab 0.1 a
Field 1 Healthy 91.4 a 0.18 b 0 5.12 c 0.66 b
Field 2 Diseased 100.0 b 0.02 ab 0 0.01 ab 0.003 a
Field 2 Healthy 91.1 a 0.13 ab 0 7.21 c 0.65 b
Field 3 Diseased 99.8 b 0.04 a 0 0.02 a 0.07 a
Field 3 Healthy 97.5 b 0.05 ab 0 2.2 bc 0.2 ab
P values
ANOVA Field (F) 0.13 * - 0.07 0.49
Health
(H)
*** 0.37 - *** **
F x H 0.22 0.76 - 0.74 0.23
Rhizosphere Field 1 Diseased 82.8 a 6.6 a 0.26 bc 0.14 a 8.4 a
Field 1 Healthy 75.7 a 8.3 ab 0.34 c 0.22 a 13.8 ab
Field 2 Diseased 79.0 a 11.8 bc 0.06 a 0.13 a 8.0 a
Field 2 Healthy 78.2 a 14.0 c 0.06 ab 0.19 a 7.0 a
Field 3 Diseased 71.9 a 8.9 ab 0.06 a 0.32 a 18.0 b
Field 3 Healthy 77.6 a 8.6 ab 0.03 a 0.23 a 13.2 ab
P values
ANOVA Field (F) 0.50 ** *** 0.71 0.02
Health
(H)
0.82 0.36 0.63 0.68 0.94
F x H 0.30 0.70 0.87 0.68 0.18
Bulk soil Field 1 Diseased 68.5 bc 11.8 a 0.37 d 0.20 b 15.2 b
Field 1 Healthy 65.4 b 12.4 a 0.50 d 0.19 b 18.4 b
Field 2 Diseased 73.8 d 15.7 b 0.04 ab 0.13 ab 8.8 a
Field 2 Healthy 71.9 cd 17.4 b 0.04 a 0.14 ab 8.9 a
Field 3 Diseased 60.0 a 16.5 b 0.10 bc 0.08 a 17.8 b
Field 3 Healthy 70.6 cd 11.2 a 0.23 cd 0.10 ab 17.0 b
P values
ANOVA Field (F) *** *** ** * ***
Health
(H)
0.20 0.27 0.75 0.83 0.34
F x H *** ** 0.21 0.92 0.87
ANOVA, Analysis of variance; *, P < 0.05; **, P < 0.01; ***, P < 0.001

89
Fig. 2. Two-dimensional principle component analysis (PCA) of fungal communities of
selected fungi in roots with different health status from three fields. Scores and loadings from
PCA of the fungal communities of pea root-inhabiting fungi are presented in (A) and (B),
repectively. Eight fungi responding significantly to either factor F or H were included in the
PCA. Error bars represent standard errors of the mean (n = 5).

90
Fig. 3. Two-dimensional principle component analysis (PCA) of fungal communities of
selected fungi in rhizosphere soil with different root health status from three fields. Scores
and loadings from PCA of the fungal communities in rhizosphere soil are presented in (A)
and (B), repectively. Ten fungi responding significantly to either factor F or H were included
in the PCA. Error bars represent standard errors of the mean (n = 5).

91
Fig. 4. Two-dimensional principle component analysis (PCA) of fungal communities of
selected fungi in bulk soil with different root health status from three fields. Scores and
loadings from PCA of the fungal communities in bulk soil are presented in (A) and (B),
repectively. Ten fungi responding significantly to either factor F or H were included in the
PCA. Error bars represent standard errors of the mean (n = 5).

92
Discussion
This study employed NGS to characterize fungal communities from soil,
rhizosphere and root samples taken from pea plants with and without signs of root rot.
The method detected clear differences in fungal community structures depending on
the different factors investigated; environment, health status and field. Environment
had the strongest impact on fungal community structures, followed by field and
finally health, with the exception that in roots, fungal communities were strongly
affected by health status.
In this study, the two non-parametric ACE and Chao1 indices at 97% similarity
showed highly significant differences between the three fields, which might have been
caused by differences in factors such as edaphic conditions, content of nutrients and
microelements and/or microclimatic differences. However, this was not investigated
in the present study. Geographic distance is one of the major determinants of
microbial diversity as found for bacteria (Fierer & Jackson, 2006; Fulthorpe et al.,
2008). Significant differences were also observed between the three environments,
probably reflecting differences in the complexity of the three environments and the
role of root exudates in regulating soil fungal community composition and diversity
(Broeckling et al., 2008). Conversely, no clear trend in estimated richness was seen
between diseased and healthy samples. In another study, soil fungal diversity and
abundance of pathogens in potato roots were reported to be negatively correlated
(Manici & Caputo, 2009). Rarefaction curves at 97% sequence similarity level also
showed a decreasing diversity from bulk soil over the rhizosphere soil to the roots,
and they indicated that not all fungal diversity had been fully represented. Finally,
OTUs that only could be assigned to „uncultured‟ and „unidentified fungi‟ were
mostly associated with bulk soil, also indicating that diversity was highest in the soil
environment.
Fungal communities in roots, rhizosphere and bulk soil
The composition of fungal communities differed significantly among the three
different environments. The fungal communities in roots were highly dominated by
Ascomycota, as observed in culture-based analyses of endophytic fungi (Arnold et al.,
2000), whereas Basidiomycota, mainly consisting of saprotrophic yeasts, were highly
abundant in rhizosphere and bulk soil. Zygomycota (mainly Mortierella) was found in

93
high abundance in the rhizosphere and bulk soil. This group mainly consists of
saprophytes (e.g. Thormann et al., 2001). Mortierellaceae is commonly encountered
in soil (O'Donnell et al., 2001; Benny & Blackwell, 2004) and soil-borne organic
substrates (O'Donnell et al., 2001; Thormann et al., 2001). Chytridiomycota was
found in low amounts in the rhizophere and bulk soil, which is consistent with
previous studies (Letcher & Powell, 2001; Letcher et al., 2004).
At the genus level, Glomus was most frequently found in roots. However, as the
fungus takes up nutrients from the surrounding soil, the low abundance of AM fungal
sequences from rhizosphere and bulk soil was unexpected. This is in strong contrast to
the finding that biomass of the extraradical mycelium of AM fungi was aprroximately
10 times as high as the biomass of intraradical mycelium and that extraradical
mycelium constituted the largest fraction of soil microbial biomass as examined using
biomarker fatty acids (Olsson et al., 1999). Fusarium was significantly more abundant
in roots and gradually decreased over the rhizosphere soil to the bulk soil. Different
Fusarium species colonize different environments, e.g. F. oxysporum f. sp. pisi is an
efficient root colonizer and soil saprophyte (Kraft & Pfleger, 2001), whereas other
Fusarium species such as F. culmorum and F. vasinfectum are mainly soil-inhabiting
fungi (Garrett, 1950). Cryptococcus and Mortierella were almost exclusively found in
the rhizosphere and bulk soil, reflecting the fact that these yeasts and filamentous
fungi are saprophytes. Most soil yeasts, including Cryptococcus, are considered to be
saprotrophs associated with plants, and some can enhance plant growth, maintain soil
structure, and transform nutrients (Botha, 2011).
Different functional groups of fungi, such as AM fungi, pathogenic fungi and
saprotrophic fungi, occupy their own niche and utilize different resources. A highly
diverse population of different functional fungal groups is more resistant or resilient
to stress, and more capable of adapting with environmental changes (Allison &
Martiny, 2008).
Comparison of fungal communities in diseased vs. healthy plants
Different disease patterns observed in the three fields indicated different causal
pathogens and disease aetiology. This was confirmed by a specific qPCR showing the
presence of A. euteiches in diseased roots from F3 but absence in the other fields.
Assessment of DSI, and determination of shoot dry weight and root fresh weight
further confirmed visual disease assessments in the fields.
94
F. oxysporum was significantly more abundant in the roots of diseased plants
compared to healthy plants in F1 and F2, whereas the opposite was observed in F3. F.
oxysporum is a common pathogen of pea diseases (Kraft & Pfleger, 2001), thus the
high abundance in diseased roots is not surprising (Persson et al., 1997). The lower
abundance of F. oxysporum in diseased roots in F3 may be explained by the fact that
A. euteiches, another pea pathogen, was only found in F3. These results suggest a
possible competition between the two pathogens but this remains to be examined
under controlled experimental conditions. Co-occurring pathogens may interact with
each other, through antagonism and/or synergism (Le May et al., 2009). A. euteiches
is associated with reduced amounts of Phytophthora medicaginis in Alfalfa that is co-
inoculated with both pathogens as studied by Real-time PCR (Vandemark et al.,
2010). When Aphanomyces spp. are present at low or moderate inoculum levels,
infection of roots by fungi such as Fusarium or Pythium spp. can increase disease
severity (Pfender, 2001). This trend in the presence of F. oxysporum in the three fields
was also observed in the rhizosphere and bulk soil, although the differences were not
significant in between these two environments. Also in contrast, an OTU with 92%
similarity to Leohumicola sp. was highly abundant in diseased roots compared to
healthy roots in F3, but this OTU was not found in significant amounts in the
rhizosphere and bulk soil. These results may indicate an involvement of this fungus in
the pea root disease complex associated with A. euteiches. However, to the best of our
knowledge, this fungus has not previously been reported to be involved in plant root
diseases.
E. salmonis and E. nigrum were found in high abundance in roots of healthy
plants in F1 and F2. Exophiala belong to the group of dark-septate endophytes
(Jumpponen & Trappe, 1998), some of which have previously been shown to suppress
plant pathogens (Narisawa et al., 2004). Epicoccum is a well-known biocontrol agent
of plant pathogens (Madrigal et al., 1994; Reeleder, 2004). These two fungi may be
interacting with F. oxysporum in healthy roots. The dominance of the AM fungi
(phylum Glomeromycota, species Glomus mosseae) in healthy roots compared to
diseased roots in the three fields support previous findings that AM fungi suppress a
broad range of root pathogens (Whipps, 2004). Furthermore, in pea roots, AM fungi
have been shown to reduce development of root rot caused by A. euteiches (Thygesen
et al., 2004). Finally, some of the rare OTUs responded significantly to health status
in the three environments (Table S1). These findings should be further investigated.
95
The abundance of only a few OTUs was significantly different in individual
fields among the ten most abundant OTUs in each environment. For example, the soil-
borne fungal pathogen V. dahliae was found at high incidence in rhizosphere and bulk
soil. However a significant difference between diseased and healthy samples was
found only in the bulk soil in F3, F. oxysporum was more abundant in diseased roots,
and corresponding rhizosphere and bulk soils than healthy samples in F1. The
abundance of almost all other OTUs in the bulk soil was strikingly similar among
diseased and healthy samples indicating that abundance of individual species is not
the only determinant of disease. Although the main differences between diseased and
healthy samples were found in roots, it is surprising that these differences were not
found in the rhizosphere. This indicates that the disease and its effects are very
localized and that the rhizosphere may not be significantly affected by a higher
abundance of specific fungi.
Generally, sequences provided sufficient taxonomic information for reliable
identification. For most OTUs, a high degree of identity (97-100%) and coverage (>
90%) to sequences in GenBank was found, indicating a high accuracy of sequencing.
At phylum level, most sequences belonged to Dikarya, which was not surprising, as
the forward primer ITS1F is biased towards amplification of basidiomycetes
(Bellemain et al., 2010), and the reverse primer 58A2R is specific to Dikaryomycota
(Martin & Rygiewicz, 2005). This means that oomycetes, including pea pathogens
such as A. euteiches and Pythium spp., are not detected using these primers. This was
indeed confirmed by the fact that a qPCR analysis showed high abundance of A.
euteiches in roots, whereas the sequencing did not reveal any sequences from this
species. The Glomeromycota and Chytridiomycota were also probably underestimated
due to primer choice and taxonomic misidentification in GenBank (Vilgalys, 2003;
Nilsson et al., 2008). Furthermore, it has been reported that Glomus belonging to
Glomeromycota, is one of the genera represented by the highest number of
insufficiently identified ITS sequences in GenBank (Ryberg et al., 2009).
In conclusion, fungal communities in the three environments; root, rhizosphere,
and bulk soil were distinct and varied with respect to community composition and
diversity, probably as a cause of the widely different availability of nutrients in the
three environments. The study also demonstrated a clear relationship between health
status of roots and their fungal communities, and the results indicated that interactions
96
between different pathogens or interactions between pathogens and non-pathogens
may affect the development of pea disease together with the plant host.
Acknowledgements
This study was supported by the Faculty of Science and Technology, Aarhus
University, Denmark. Karsten Malmskov (Ardo A/S) is acknowledged for assisting in
collecting samples.
References
Allison SD, Martiny JBH. 2008. Resistance, resilience, and redundancy in microbial
communities. Proceedings of the National Academy of Sciences of the United
States of America 105: 11512-11519.
Arnold AE, Maynard Z, Gilbert GS, Coley PD, Kursar TA. 2000. Are tropical
fungal endophytes hyperdiverse? Ecology Letters 3: 267-274.
Bellemain E, Carlsen T, Brochmann C, Coissac E, Taberlet P, Kauserud H. 2010.
ITS as an environmental DNA barcode for fungi: an in silico approach reveals
potential PCR biases. BMC Microbiology 10: 189.
Benny GL, Blackwell M. 2004. Lobosporangium, a new name for
Echinosporangium Malloch, and Gamsiella, a new genus for Mortierella
multidivaricata. Mycologia 96: 143-149.
Berg G, Smalla K. 2009. Plant species and soil type cooperatively shape the structure
and function of microbial communities in the rhizosphere. FEMS Microbiology
Ecology 68: 1-13.
Blackwell M. 2011. The fungi: 1, 2, 3 ... 5.1 million species? American Journal of
Botany 98: 426-438.
Bødker L, Leroul N, Smedegaardpetersen V. 1993a. Influence of pea cropping
history on disease severity and yield depression. Plant Disease 77: 896-900.
Bødker L, Leroul N, Smedegaardpetersen V. 1993b. The occurrence in Denmark
of black root rot of pea caused by Thielaviopsis basicola. Plant Pathology 42:
820-823.
Botha A. 2011. The importance and ecology of yeasts in soil. Soil Biology &
Biochemistry 43: 1-8.

97
Bretag TW, Keane PJ, Price TV. 2006. The epidemiology and control of ascochyta
blight in field peas: a review. Australian Journal of Agricultural Research 57:
883-902.
Broeckling CD, Broz AK, Bergelson J, Manter DK, Vivanco JM. 2008. Root
exudates regulate soil fungal community composition and diversty. Applied and
Environmental Microbiology 74: 738-744.
Buée M, Reich M, Murat C, Morin E, Nilsson RH, Uroz S, Martin F. 2009. 454
Pyrosequencing analyses of forest soils reveal an unexpectedly high fungal
diversity. New Phytologist 184: 449-456.
Colwell RK. 2009. EstimateS: Statistical estimation of species richness and shared
species from samples. Version 8.2. User's guide and application published at:
http://viceroy.eeb.uconn.edu/estimates.
Fierer N, Jackson RB. 2006. The diversity and biogeography of soil bacterial
communities. Proceedings of the National Academy of Sciences of the United
States of America 103: 626-631.
Fulthorpe RR, Roesch LFW, Riva A, Triplett EW. 2008. Distantly sampled soils
carry few species in common. ISME Journal 2: 901-910.
Gardes M, Bruns TD. 1993. ITS primers with enhanced specificity for
basidiomycetes - application to the identification of mycorrhizae and rusts.
Molecular Ecology 2: 113-118.
Garrett SD. 1950. Ecology of the root inhabiting fungi. Biological Reviews of the
Cambridge Philosophical Society 25: 220-254.
Gaulin E, Jacquet C, Bottin A, Dumas B. 2007. Root rot disease of legumes caused
by Aphanomyces euteiches. Molecular Plant Pathology 8: 539-548.
Gianinazzi S, Gollotte A, Binet MN, van Tuinen D, Redecker D, Wipf D. 2010.
Agroecology: the key role of arbuscular mycorrhizas in ecosystem services.
Mycorrhiza 20: 519-530.
Jumpponen A, Jones KL. 2009. Massively parallel 454 sequencing indicates
hyperdiverse fungal communities in temperate Quercus macrocarpa
phyllosphere. New Phytologist 184: 438-448.
Jumpponen A, Jones KL, Blair J. 2010. Vertical distribution of fungal communities
in tallgrass prairie soil. Mycologia 102: 1027-1041.
Jumpponen A, Trappe JM. 1998. Dark septate endophytes: a review of facultative
biotrophic root-colonizing fungi. New Phytologist 140: 295-310.

98
Kraft JM, Pfleger FL. 2001. Compendium of pea diseases and pests. St. Paul, MN:
American Phytopathological Society (APS Press).
Kumar S, Carlsen T, Mevik BH, Enger P, Blaalid R, Shalchian-Tabrizi K,
Kauserud H. 2011. CLOTU: an online pipeline for processing and clustering of
454 amplicon reads into OTUs followed by taxonomic annotation. Bmc
Bioinformatics 12: 182.
Larsen J, Bødker L. 2001. Interactions between pea root-inhabiting fungi examined
using signature fatty acids. New Phytologist 149: 487-493.
Le May C, Potage G, Andrivon D, Tivoli B, Outreman Y. 2009. Plant disease
complex: antagonism and synergism between pathogens of the Ascochyta blight
complex on pea. Journal of Phytopathology 157: 715-721.
Letcher PM, Mcgee PA, Powell MJ. 2004. Distribution and diversity of zoosporic
fungi from soils of four vegetation types in New South Wales, Australia.
Canadian Journal of Botany-Revue Canadienne de Botanique 82: 1490-1500.
Letcher PM, Powell MJ. 2001. Distribution of zoosporic fungi in forest soils of the
Blue Ridge and Appalachian Mountains of Virginia. Mycologia 93: 1029-1041.
Lumini E, Orgiazzi A, Borriello R, Bonfante P, Bianciotto V. 2010. Disclosing
arbuscular mycorrhizal fungal biodiversity in soil through a land-use gradient
using a pyrosequencing approach. Environmental Microbiology 12: 2165-2179.
Madrigal C, Pascual S, Melgarejo P. 1994. Biological control of peach twig blight
(Monilinia laxa) with Epicoccum nigrum. Plant Pathology 43: 554-561.
Manici LM, Caputo F. 2009. Fungal community diversity and soil health in
intensive potato cropping systems of the east Po valley, northern Italy. Annals of
Applied Biology 155: 245-258.
Margulies M, Egholm M, Altman WE, Attiya S, Bader JS, Bemben LA, Berka J,
Braverman MS, Chen YJ, Chen ZT, Dewell SB, Du L, Fierro JM, Gomes
XV, Godwin BC, He W, Helgesen S, Ho CH, Irzyk GP, Jando SC, Alenquer
MLI, Jarvie TP, Jirage KB, Kim JB, Knight JR, Lanza JR, Leamon JH,
Lefkowitz SM, Lei M, Li J, Lohman KL, Lu H, Makhijani VB, Mcdade KE,
McKenna MP, Myers EW, Nickerson E, Nobile JR, Plant R, Puc BP, Ronan
MT, Roth GT, Sarkis GJ, Simons JF, Simpson JW, Srinivasan M, Tartaro
KR, Tomasz A, Vogt KA, Volkmer GA, Wang SH, Wang Y, Weiner MP, Yu
PG, Begley RF, Rothberg JM. 2005. Genome sequencing in microfabricated
high-density picolitre reactors. Nature 437: 376-380.

99
Martin KJ, Rygiewicz PT. 2005. Fungal-specific PCR primers developed for
analysis of the ITS region of environmental DNA extracts. BMC Microbiology 5:
28.
Narisawa K, Usuki F, Hashiba T. 2004. Control of verticillium yellows in chinese
cabbage by the dark septate endophytic fungus LtVB3. Phytopathology 94: 412-
418.
Nilsson RH, Kristiansson E, Ryberg M, Hallenberg N, Larsson KH. 2008.
Intraspecific ITS variability in the kingdom Fungi as expressed in the
international sequence databases and its implications for molecular species
identification. Evolutionary Bioinformatics 4: 193-201.
O'Donnell K, Lutzoni FM, Ward TJ, Benny GL. 2001. Evolutionary relationships
among mucoralean fungi (Zygomycota): evidence for family polyphyly on a
large scale. Mycologia 93: 286-297.
Olsson PA, Thingstrup I, Jakobsen I, Bååth E. 1999. Estimation of the biomass of
arbuscular mycorrhizal fungi in a linseed field. Soil Biology & Biochemistry 31:
1879-1887.
Persson L, Bødker L, LarssonWikstrom M. 1997. Prevalence and pathogenicity of
foot and root rot pathogens of pea in southern Scandinavia. Plant Disease 81:
171-174.
Pfender WF. 2001. Aphanomyces root rot. In: Kraft JM, Pfleger FL, eds.
Compendium of pea diseases and pests. St.Paul, MN, USA: APS Press, 9-13.
Raaijmakers JM, Paulitz TC, Steinberg C, Alabouvette C, Moenne-Loccoz Y.
2009. The rhizosphere: a playground and battlefield for soilborne pathogens and
beneficial microorganisms. Plant and Soil 321: 341-361.
Reeleder RD. 2004. The use of yeasts for biological control of the plant pathogen
Sclerotinia sclerotiorum. Biocontrol 49: 583-594.
Rousk J, Bååth E, Brookes PC, Lauber CL, Lozupone C, Caporaso JG, Knight
R, Fierer N. 2010. Soil bacterial and fungal communities across a pH gradient in
an arable soil. ISME Journal 4: 1340-1351.
Ryberg M, Kristiansson E, Sjökvist E, Nilsson RH. 2009. An outlook on the fungal
internal transcribed spacer sequences in GenBank and the introduction of a web-
based tool for the exploration of fungal diversity. New Phytologist 181: 471-477.
100
Sauvage H, Moussart A, Bois F, Tivoli B, Barray S, Laval K. 2007. Development
of a molecular method to detect and quantify Aphanomyces euteiches in soil.
FEMS Microbiology Letters 273: 64-69.
Smith SE, Read DJ. 2008. Mycorrhizal symbiosis. San Diego, USA: Academic Press.
Sugiyama A, Vivanco JM, Jayanty SS, Manter DK. 2010. Pyrosequencing
assessment of soil microbial communities in organic and conventional potato
farms. Plant Disease 94: 1329-1335.
Thormann MN, Currah RS, Bayley SE. 2001. Microfungi isolated from Sphagnum
fuscum from a Southern Boreal Bog in Alberta, Canada. Bryologist 104: 548-559.
Thygesen K, Larsen J, Bødker L. 2004. Arbuscular mycorrhizal fungi reduce
development of pea root-rot caused by Aphanomyces euteiches using oospores as
pathogen inoculum. European Journal of Plant Pathology 110: 411-419.
Vandemark GEJ, Ariss JJ, Hughes TJ. 2010. Real-time PCR suggests that
Aphanomyces euteiches is associated with reduced amounts of Phytophthora
medicaginis in Alfalfa that is co-inoculated with both pathogens. Journal of
Phytopathology 158: 117-124.
Vandemark GJ, Barker BM, Gritsenko MA. 2002. Quantifying Aphanomyces
euteiches in alfalfa with a fluorescent polymerase chain reaction assay.
Phytopathology 92: 265-272.
Vandenkoornhuyse P, Baldauf SL, Leyval C, Straczek J, Young JPW. 2002.
Extensive fungal diversity in plant roots. Science 295: 2051.
Vilgalys R. 2003. Taxonomic misidentification in public DNA databases. New
Phytologist 160: 4-5.
Whipps JM. 2004. Prospects and limitations for mycorrhizas in biocontrol of root
pathogens. Canadian Journal of Botany-Revue Canadienne de Botanique 82:
1198-1227.
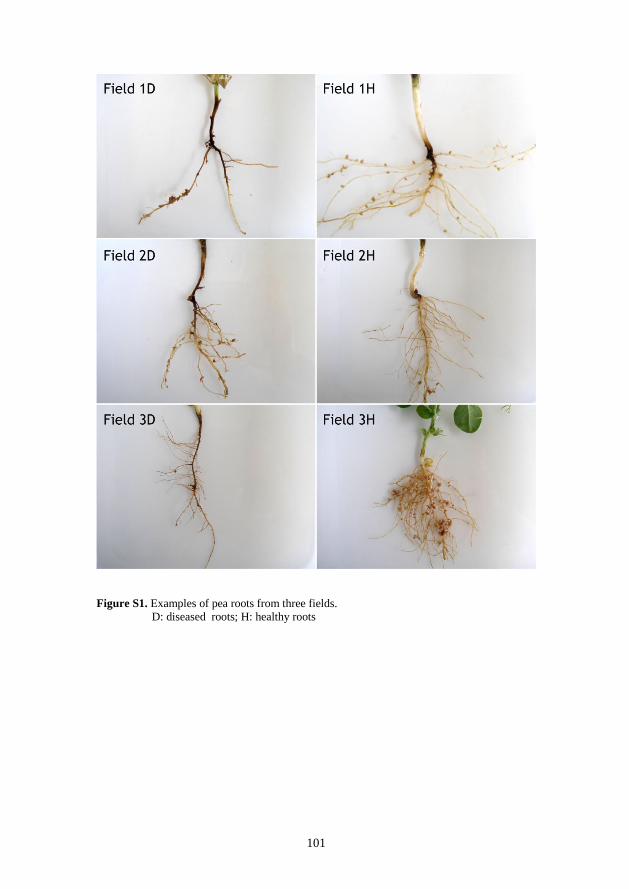
101
Figure S1. Examples of pea roots from three fields.
D: diseased roots; H: healthy roots

102
Table S1. Relative abundance (%) of fungal operational taxonomic units (OTUs) recovered
from three different environments in three pea fields. Gray highlighted OTUs responded
significantly to root health status. Red and green colors respectively indicate an increase and
decrease in relative abundance in each environment from diseased plants as compared to that
of healthy plants. Roots (a), rhizosphere soil (b), and bulk soil (c).
Root (a)
OTU Closest hit F1D F1H F2D F2H F3D F3H
1 Fusarium oxysporum 73.90 18.98 94.31 42.37 21.84 65.24
2 Exophiala salmonis 19.44 62.97 0.55 16.16 2.46 2.83
3 Leohumicola minima 0 0.01 0.01 0.05 55.50 4.27
4 Epicoccum nigrum 0.54 4.72 0.13 30.44 0.35 0.17
5 Neonectria radicicola 0.71 0.21 0.04 0.22 14.89 15.94
6 Glomus mosseae 0.12 1.79 0.01 6.76 0 1.79
7 Bionectria ochroleuca 2.38 1.25 4.39 0.92 0.01 1.32
8 Dendryphion nanum 0.01 0.02 0 0.01 2.35 0.72
9 Uncultured fungus 0.17 2.42 0 0.82 0.01 0.02
10 Fusarium culmorum 0.01 0.02 0.02 0.01 0.01 2.55
11 Monacrosporium elegan 0.35 0.31 0.14 0.41 0.57 0.02
12 Trichocladium asperum 0.04 0.02 0.01 0.01 0.46 1.41
13 Uncultured Pyronemataceae 0 0 0 0 0 1.48
14 Mortierella elongata 0.05 0.57 0 0.25 0.06 0.09
15 Glomus caledonium 0.08 0.73 0 0.07 0 0.13
16 Fusarium avenaceum 0 0.06 0.01 0.02 0.20 0.52
17 Eucasphaeria capensis 0.11 0.58 0.01 0 0 0.13
18 Fusidium griseum 0 0.06 0.11 0.03 0.54 0.01
19 Glomus intraradices 0.01 0.75 0 0 0 0
20 Cudoniella clavus 0.22 0.56 0.01 0 0.03 0
21 Glomus mosseae 0.02 0.28 0 0.24 0 0.02
22 Verticillium dahliae 0.06 0.13 0.09 0.11 0.09 0.09
23 Glomus intraradices 0.07 0.46 0 0 0 0
24 Cladosporium cucumerinum 0.17 0.26 0.01 0.06 0 0.03
25 Mortierella sp. 0.03 0.01 0 0.22 0.01 0.11
26 Glomus sp. 0.16 0.24 0 0 0 0
27 No 0.03 0.17 0 0.07 0 0.03
28 Microdochium bolleyi 0 0.03 0.03 0.03 0.20 0.02
29 Uncultured Davidiella 0.02 0.28 0 0 0 0
30 Glomus mosseae 0.02 0.11 0 0.01 0 0.12
31 Periconia macrospinos 0.02 0.12 0.01 0.01 0.02 0.08
32 Pyrenochaeta sp. 0 0 0 0 0.17 0.01
33 Glomus versiforme 0.06 0.16 0.01 0.02 0 0.03
34 Coprinellus mitrinodulisporum 0.21 0 0 0.05 0 0
35 Leohumicola minima 0.02 0 0 0 0 0.20
36 Lewia infectori 0.05 0.12 0 0.04 0 0.01
37 Leohumicola minima 0.01 0.15 0 0.03 0.01 0
38 Leptodontidium orchidicola 0.02 0.07 0 0.01 0.02 0.05

103
39 Neonectria veuillotiana 0 0 0 0 0.02 0.15
40 Glomus eburneum 0.04 0.12 0 0.01 0 0
41 Mortierella elongata 0.01 0.04 0 0.09 0 0
42 Didymella exitialis 0.02 0.10 0.01 0.03 0 0
43 Glomus mosseae 0.02 0.09 0 0.01 0.01 0.01
44 Mortierella alpina 0.01 0.04 0 0.09 0 0
45 Fusarium merismoides 0.01 0.02 0 0.03 0.03 0.04
46 Cryptococcus aerius 0.01 0.03 0.02 0 0 0.05
47 Paraglomus laccatum 0.02 0.09 0 0.01 0 0
48 Glomus claroideum 0.01 0.03 0 0 0 0.06
49 Uncultured fungus 0.01 0 0 0 0.06 0
50 Fusarium solani 0 0 0.01 0 0.01 0.06
51 Alternaria alternata 0.04 0.04 0 0.02 0 0
52 Cryptococcus victoriae 0.02 0.06 0 0.01 0 0
53 Leptodontidium elatius 0.01 0.01 0 0 0 0.08
54 Cladosporium tenuissimum 0.02 0.05 0 0.01 0 0
55 Glomus geosporum 0 0.05 0 0.02 0 0.01
56 Cryptococcus tephrensis 0.01 0.02 0 0.05 0 0
57 Aquaticola hongkongensis 0.02 0.07 0 0 0 0
58 Acaulospora trappei 0.02 0.05 0 0 0 0
59 Dokmaia monthadangii 0.03 0.02 0.01 0.01 0 0
60 Parapleurotheciopsis inaequiseptata 0.01 0 0.01 0.04 0 0
61 Acaulospora trappei 0.02 0.03 0 0.01 0 0
62 Ambispora leptoticha 0.02 0.01 0 0.03 0 0
63 Cryptococcus chernovii 0 0.03 0 0.01 0 0
64 Eucasphaeria capensis 0 0.04 0 0 0 0
65 Exophiala salmonis 0.02 0.02 0 0 0 0
66 Cryptococcus laurentii 0.02 0 0 0 0.01 0
67 Dokmaia monthadangii 0 0.02 0 0.01 0 0
68 Glomus intraradices 0.01 0.03 0 0 0 0
69 Glomus caledonium 0 0.02 0 0 0.01 0
70 Glomus eburneum 0 0 0 0.02 0 0.01
71 Cryptococcus aerius 0 0 0 0.01 0.01 0
72 Hypocrea pachybasioides 0.02 0.01 0 0 0 0
73 Arthrobotrys oligospora 0.01 0.02 0 0 0 0
74 Uncultured fungus 0.01 0 0.01 0 0 0
75 Pochonia chlamydosporia 0.02 0 0 0 0 0.01
76 Fusarium solani 0 0 0.01 0 0.01 0
77 Trichocladium asperum 0 0 0 0 0 0.01
78 Uncultured fungus 0.01 0.01 0 0 0 0
79 Leptosphaerulina chartarum 0 0.02 0 0 0 0
80 Cryptococcus aureus 0.01 0.01 0 0 0 0
81 Dioszegia crocea 0 0.01 0 0.01 0 0
82 Glomus claroideum 0 0 0 0 0 0.02
83 Scutellospora reticulata 0.01 0.02 0 0 0 0

104
84 Fusarium oxysporum 0.01 0 0 0 0 0
85 Pleospora herbarum 0 0.01 0 0 0 0
86 Ijuhya paraparilis 0.01 0.01 0 0 0 0
87 Exophiala salmonis 0 0.01 0 0 0 0
88 Uncultured Glomus 0 0.01 0 0 0 0
89 Paecilomyces carneus 0.01 0 0 0 0 0
90 Cryptococcus rajasthanensis 0.01 0 0 0 0.01 0
91 Cudoniella clavus 0.01 0 0 0 0 0
92 Didymella exitialis 0.02 0 0 0 0 0
93 Dwayaangam colodena 0 0.01 0 0 0 0
94 Glomus rubiforme 0.01 0.01 0 0 0 0
95 Acremonium rutilum 0.01 0 0 0 0 0
96 Cosmospora vilior 0 0.01 0 0 0 0
97 Glomus intraradices 0.01 0 0 0 0 0
98 Neonectria radicicola 0.01 0 0 0 0 0.01
99 Ambispora fennica 0.01 0.01 0 0 0 0
100 Ambispora leptoticha 0.01 0 0 0 0 0
101 Glomus mosseae 0.02 0 0 0 0 0
102 Neonectria radicicola 0 0 0 0 0 0.01
103 No 0 0 0 0 0 0
104 Uncultured Glomus 0.01 0 0 0 0 0
105 Trichocladium opacum 0 0 0 0 0 0
106 Fusarium oxysporum 0.01 0 0 0 0 0
107 Rhodotorula cresolica 0.01 0 0 0 0 0
108 Glomus walkeri 0 0 0 0 0 0
109 Cryptococcus dimennae 0.01 0 0 0 0 0
110 Bionectria ochroleuca 0.01 0 0.01 0 0 0
111 Fusarium solani 0.01 0 0 0 0 0
112 Trichoderma koningiopsis 0.01 0 0 0 0 0
113 Exophiala salmonis 0.01 0 0 0 0 0
114 Uncultured fungus 0.01 0 0 0 0 0
115 Monacrosporium psychrophilum 0 0 0 0 0 0
116 Fusarium oxysporum 0.01 0 0 0 0 0.01
117 Fusarium oxysporum 0 0 0 0 0.01 0
118 No 0.01 0 0 0 0 0
119 Exophiala salmonis 0 0 0 0 0 0
120 Fusarium solani 0 0 0 0 0 0
121 Fusarium solani 0 0 0.01 0 0 0
122 Fusarium solani 0 0 0.01 0 0 0
123 Pochonia suchlasporia 0 0 0 0 0 0

105
Rhizosphere soil (b)
OTU Closest hit F1D F1H F2D F2H F3D F3H
1 Verticillium dahliae 5.94 5.84 30.06 34.62 14.70 21.59
2 Fusarium oxysporum 42.74 33.23 8.28 7.70 3.09 5.28
3 Trichocladium asperum 2.50 3.15 2.94 0.33 24.61 26.29
4 Bionectria ochroleuca 2.78 3.13 13.48 12.32 0.21 0.43
5 Cryptococcus aerius 3.07 3.84 5.53 6.09 5.81 5.80
6 Mortierella sp. 1.71 4.42 2.77 2.27 9.13 6.09
7 Phoma eupyrena 2.61 2.66 4.11 5.16 5.71 4.21
8 Mortierella elongata 4.29 6.19 2.41 2.08 3.25 5.09
9 Fusarium merismoides 2.85 3.22 1.70 1.59 5.73 4.55
10 Exophiala salmonis 2.95 3.34 1.96 1.95 1.24 0.41
11 Leptodontidium elatius 0.49 0.52 2.27 2.57 2.49 2.89
12 Dokmaia monthadangii 1.08 0.79 2.06 2.32 1.29 1.34
13 Cryptococcus terricola 0.49 0.89 2.91 3.79 0.21 0.01
14 Uncultured fungus 3.35 4.43 0.05 0.15 1.04 0.08
15 Eucasphaeria capensis 2.89 1.40 2.13 0.08 0.10 0.14
16 Cercophora sparsa 2.83 3.39 0.44 0.60 0.15 0.02
17 Trichosporon pullulans 0.04 0.03 1.36 1.73 1.83 1.39
18 Fusarium solani 0.98 0.40 1.99 1.46 0.60 0.48
19 Tetracladium maxilliforme 0.20 0.22 0.56 0.65 2.03 2.42
20 Mortierella horticola 0.26 0.18 0.03 0.04 4.76 0.78
21 Mortierella alpina 0.74 1.25 1.58 1.23 0.11 0.25
22 Monacrosporium psychrophilum 1.21 1.29 0.72 0.61 0.39 0.01
23 Apodus deciduus 0.74 1.26 0.54 0.31 0.22 0.13
24 Mortierella elongata 0.79 0.85 0.42 0.59 0.19 0.12
25 Neonectria radicicola 0.14 0.22 0.18 0.20 1.08 0.86
26 Candida sake 0.07 0.02 0.66 0.77 0.62 0.45
27 Microdochium bolleyi 0.36 0.60 0.57 0.46 0.22 0.27
28 Mortierella elongata 0.51 0.73 0.48 0.59 0.03 0.01
29 Cryptotrichosporon anacardii 0.23 0.57 0.62 0.81 0.09 0.03
30 Trichosporon vadense 0.23 0.28 0.24 0.33 0.33 0.75
31 Pseudeurotium bakeri 0.03 0.03 0.33 0.28 0.83 0.82
32 Acremonium rutilum 0.15 0.21 0.49 0.61 0.34 0.29
33 Leohumicola minima 0.06 0.03 0.10 0.18 1.11 0.03
34 Cryptococcus laurentii 0.50 0.82 0.02 0.02 0.11 0.33
35 Trichocladium opacum 0.16 0.13 0.25 0.33 0.33 0.23
36 Uncultured Minimedusa 0.77 0.40 0.04 0.03 0.07 0.05
37 Cryptococcus podzolicus 0.05 0.25 0.31 0.64 0.01 0
38 Pseudallescheria fimeti 0.59 0.45 0.01 0 0.06 0.19
39 Leptodontidium orchidicola 0.44 0.26 0.06 0.08 0.24 0.01
40 Uncultured fungus 0.33 0.37 0.14 0.15 0.08 0.04
41 Cylindrocarpon didymum 0.09 0.16 0.15 0.12 0.15 0.33
42 Lachnella alboviolascen 0.33 0.35 0.09 0.01 0.15 0.02
43 Cladosporium cucumerinum 0.25 0.10 0.36 0.07 0.01 0.02
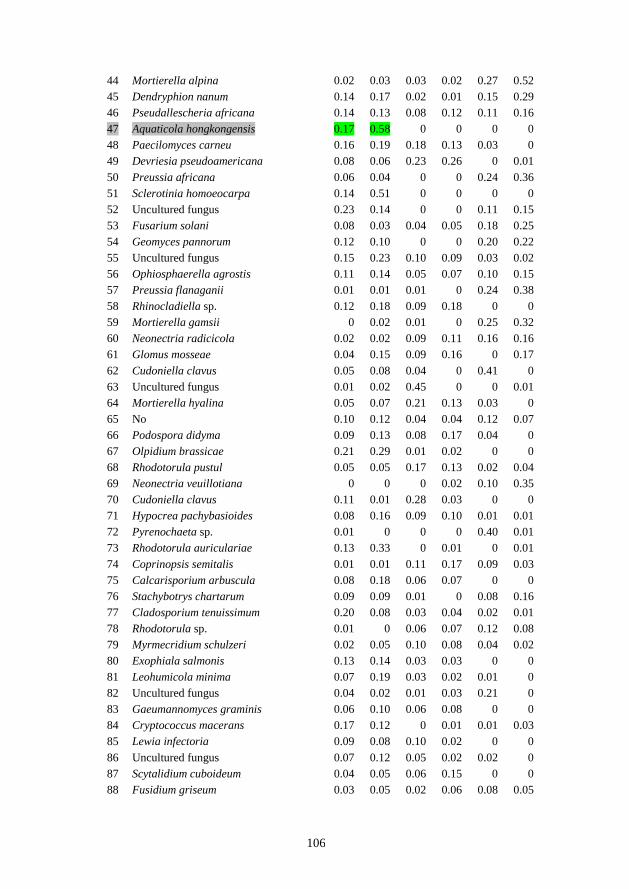
106
44 Mortierella alpina 0.02 0.03 0.03 0.02 0.27 0.52
45 Dendryphion nanum 0.14 0.17 0.02 0.01 0.15 0.29
46 Pseudallescheria africana 0.14 0.13 0.08 0.12 0.11 0.16
47 Aquaticola hongkongensis 0.17 0.58 0 0 0 0
48 Paecilomyces carneu 0.16 0.19 0.18 0.13 0.03 0
49 Devriesia pseudoamericana 0.08 0.06 0.23 0.26 0 0.01
50 Preussia africana 0.06 0.04 0 0 0.24 0.36
51 Sclerotinia homoeocarpa 0.14 0.51 0 0 0 0
52 Uncultured fungus 0.23 0.14 0 0 0.11 0.15
53 Fusarium solani 0.08 0.03 0.04 0.05 0.18 0.25
54 Geomyces pannorum 0.12 0.10 0 0 0.20 0.22
55 Uncultured fungus 0.15 0.23 0.10 0.09 0.03 0.02
56 Ophiosphaerella agrostis 0.11 0.14 0.05 0.07 0.10 0.15
57 Preussia flanaganii 0.01 0.01 0.01 0 0.24 0.38
58 Rhinocladiella sp. 0.12 0.18 0.09 0.18 0 0
59 Mortierella gamsii 0 0.02 0.01 0 0.25 0.32
60 Neonectria radicicola 0.02 0.02 0.09 0.11 0.16 0.16
61 Glomus mosseae 0.04 0.15 0.09 0.16 0 0.17
62 Cudoniella clavus 0.05 0.08 0.04 0 0.41 0
63 Uncultured fungus 0.01 0.02 0.45 0 0 0.01
64 Mortierella hyalina 0.05 0.07 0.21 0.13 0.03 0
65 No 0.10 0.12 0.04 0.04 0.12 0.07
66 Podospora didyma 0.09 0.13 0.08 0.17 0.04 0
67 Olpidium brassicae 0.21 0.29 0.01 0.02 0 0
68 Rhodotorula pustul 0.05 0.05 0.17 0.13 0.02 0.04
69 Neonectria veuillotiana 0 0 0 0.02 0.10 0.35
70 Cudoniella clavus 0.11 0.01 0.28 0.03 0 0
71 Hypocrea pachybasioides 0.08 0.16 0.09 0.10 0.01 0.01
72 Pyrenochaeta sp. 0.01 0 0 0 0.40 0.01
73 Rhodotorula auriculariae 0.13 0.33 0 0.01 0 0.01
74 Coprinopsis semitalis 0.01 0.01 0.11 0.17 0.09 0.03
75 Calcarisporium arbuscula 0.08 0.18 0.06 0.07 0 0
76 Stachybotrys chartarum 0.09 0.09 0.01 0 0.08 0.16
77 Cladosporium tenuissimum 0.20 0.08 0.03 0.04 0.02 0.01
78 Rhodotorula sp. 0.01 0 0.06 0.07 0.12 0.08
79 Myrmecridium schulzeri 0.02 0.05 0.10 0.08 0.04 0.02
80 Exophiala salmonis 0.13 0.14 0.03 0.03 0 0
81 Leohumicola minima 0.07 0.19 0.03 0.02 0.01 0
82 Uncultured fungus 0.04 0.02 0.01 0.03 0.21 0
83 Gaeumannomyces graminis 0.06 0.10 0.06 0.08 0 0
84 Cryptococcus macerans 0.17 0.12 0 0.01 0.01 0.03
85 Lewia infectoria 0.09 0.08 0.10 0.02 0 0
86 Uncultured fungus 0.07 0.12 0.05 0.02 0.02 0
87 Scytalidium cuboideum 0.04 0.05 0.06 0.15 0 0
88 Fusidium griseum 0.03 0.05 0.02 0.06 0.08 0.05

107
89 Uncultured fungus 0.04 0.10 0.04 0.07 0.01 0
90 Uncultured fungus 0.06 0.07 0.06 0.06 0 0
91 Bionectria ochroleuca 0.09 0.06 0.01 0.01 0.02 0.10
92 Phialophora sp. 0.04 0.21 0 0 0 0
93 Neonectria radicicola 0.01 0 0 0 0.13 0.10
94 Trichoderma koningiopsis 0.09 0.03 0.01 0.07 0.03 0.01
95 Olpidium brassicae 0.04 0.03 0.04 0.03 0.05 0.03
96 Acremonium murorum 0.01 0.01 0.06 0.06 0.03 0.06
97 Neofabraea eucalypti 0.05 0.05 0.05 0.01 0 0.06
98 Petrakia sp. 0 0 0.03 0.11 0.01 0.05
99 No 0.08 0.12 0 0.01 0 0
100 Uncultured fungus 0.07 0.06 0 0 0.07 0
101 Chaetosphaeria sp. 0 0.05 0.03 0.10 0 0
102 Paecilomyces marquandii 0.03 0.08 0.01 0 0.02 0.06
103 Cercophora areolata 0.02 0.04 0.03 0.01 0.08 0.01
104 Glomus caledonium 0.01 0 0.01 0 0.17 0
105 Arthrobotrys oligospora 0.11 0.02 0 0.04 0 0
106 Geomyces pannorum 0.06 0.09 0.02 0.01 0.01 0
107 Galactomyces geotrichum 0 0 0 0 0 0.18
108 Uncultured fungus 0.01 0.02 0.05 0.05 0.01 0.01
109 Cryptococcus victoriae 0.10 0.04 0.01 0 0 0
110 Degelia plumbea 0.02 0.05 0.04 0.04 0.01 0
111 Arthrographis alba 0.03 0.03 0.03 0.03 0.02 0.01
112 Cosmospora vilior 0.05 0.08 0.01 0 0 0.01
113 Cryptococcus festucosus 0.07 0.05 0.01 0.01 0 0
114 Trichoderma rossicum 0.03 0.02 0.03 0.01 0.01 0.04
115 Polytolypa hystricis 0.03 0.06 0 0.01 0.02 0.01
116 Heydenia alpina 0.07 0.03 0 0 0.03 0.01
117 Cudoniella clavus 0.02 0.03 0.03 0.01 0.03 0.01
118 Sporobolomyces roseus 0.01 0.01 0.05 0.04 0 0
119 No 0.04 0.05 0.02 0.01 0 0
120 Paraglomus laccatum 0 0 0 0 0.11 0
121 Amaurodon viridis 0.12 0 0 0 0 0
122 Periconia macrospinosa 0.01 0.04 0.01 0.02 0.02 0.01
123 Rhodotorula minuta 0.01 0.01 0.06 0.02 0 0
124 Entrophospora sp. 0.03 0.02 0.01 0.03 0.02 0
125 Podospora didyma 0.02 0.05 0.01 0.02 0 0.02
126 Nectria inventa 0.05 0.04 0 0.01 0.01 0.01
127 Fusarium domesticum 0.04 0.05 0.01 0 0 0.01
128 Uncultured fungus 0.05 0.03 0.01 0 0.01 0.01
129 Hydropisphaera erubescens 0.09 0 0 0 0 0
130 Phaeophleospora stonei 0.02 0.02 0.03 0.02 0.02 0
131 Leohumicola minima 0 0 0.01 0 0.02 0.04
132 Cercophora coprophila 0 0 0 0 0.05 0.05
133 Coprinellus flocculosus 0 0 0.09 0.01 0 0
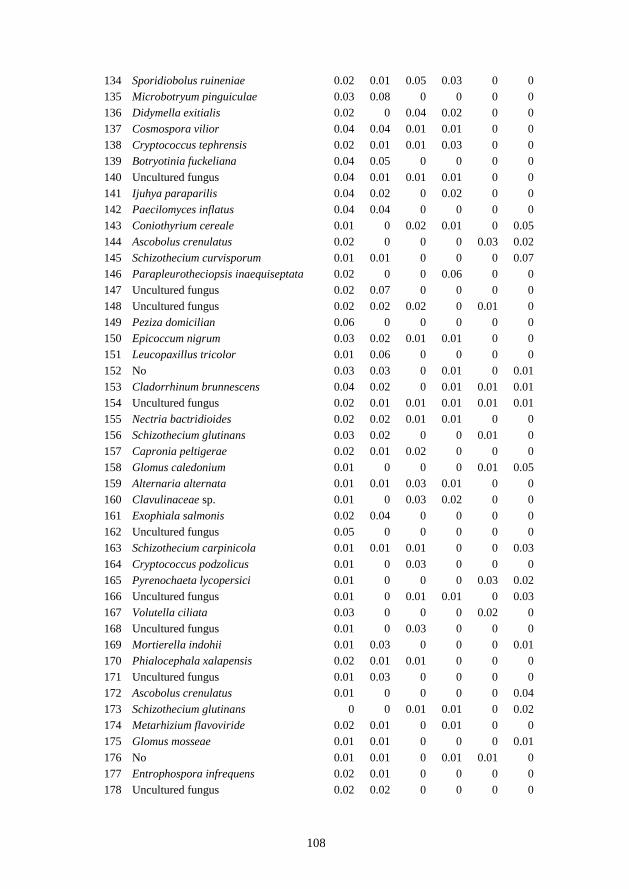
108
134 Sporidiobolus ruineniae 0.02 0.01 0.05 0.03 0 0
135 Microbotryum pinguiculae 0.03 0.08 0 0 0 0
136 Didymella exitialis 0.02 0 0.04 0.02 0 0
137 Cosmospora vilior 0.04 0.04 0.01 0.01 0 0
138 Cryptococcus tephrensis 0.02 0.01 0.01 0.03 0 0
139 Botryotinia fuckeliana 0.04 0.05 0 0 0 0
140 Uncultured fungus 0.04 0.01 0.01 0.01 0 0
141 Ijuhya paraparilis 0.04 0.02 0 0.02 0 0
142 Paecilomyces inflatus 0.04 0.04 0 0 0 0
143 Coniothyrium cereale 0.01 0 0.02 0.01 0 0.05
144 Ascobolus crenulatus 0.02 0 0 0 0.03 0.02
145 Schizothecium curvisporum 0.01 0.01 0 0 0 0.07
146 Parapleurotheciopsis inaequiseptata 0.02 0 0 0.06 0 0
147 Uncultured fungus 0.02 0.07 0 0 0 0
148 Uncultured fungus 0.02 0.02 0.02 0 0.01 0
149 Peziza domicilian 0.06 0 0 0 0 0
150 Epicoccum nigrum 0.03 0.02 0.01 0.01 0 0
151 Leucopaxillus tricolor 0.01 0.06 0 0 0 0
152 No 0.03 0.03 0 0.01 0 0.01
153 Cladorrhinum brunnescens 0.04 0.02 0 0.01 0.01 0.01
154 Uncultured fungus 0.02 0.01 0.01 0.01 0.01 0.01
155 Nectria bactridioides 0.02 0.02 0.01 0.01 0 0
156 Schizothecium glutinans 0.03 0.02 0 0 0.01 0
157 Capronia peltigerae 0.02 0.01 0.02 0 0 0
158 Glomus caledonium 0.01 0 0 0 0.01 0.05
159 Alternaria alternata 0.01 0.01 0.03 0.01 0 0
160 Clavulinaceae sp. 0.01 0 0.03 0.02 0 0
161 Exophiala salmonis 0.02 0.04 0 0 0 0
162 Uncultured fungus 0.05 0 0 0 0 0
163 Schizothecium carpinicola 0.01 0.01 0.01 0 0 0.03
164 Cryptococcus podzolicus 0.01 0 0.03 0 0 0
165 Pyrenochaeta lycopersici 0.01 0 0 0 0.03 0.02
166 Uncultured fungus 0.01 0 0.01 0.01 0 0.03
167 Volutella ciliata 0.03 0 0 0 0.02 0
168 Uncultured fungus 0.01 0 0.03 0 0 0
169 Mortierella indohii 0.01 0.03 0 0 0 0.01
170 Phialocephala xalapensis 0.02 0.01 0.01 0 0 0
171 Uncultured fungus 0.01 0.03 0 0 0 0
172 Ascobolus crenulatus 0.01 0 0 0 0 0.04
173 Schizothecium glutinans 0 0 0.01 0.01 0 0.02
174 Metarhizium flavoviride 0.02 0.01 0 0.01 0 0
175 Glomus mosseae 0.01 0.01 0 0 0 0.01
176 No 0.01 0.01 0 0.01 0.01 0
177 Entrophospora infrequens 0.02 0.01 0 0 0 0
178 Uncultured fungus 0.02 0.02 0 0 0 0

109
179 Uncultured fungus 0.03 0 0 0 0 0
180 Alternaria brassicae 0.01 0.02 0 0 0 0
181 Schizothecium glutinans 0 0.01 0.01 0 0.01 0
182 Uncultured fungus 0.02 0 0.01 0 0 0.01
183 Clitopilus passeckerianus 0.01 0 0 0 0.02 0
184 Gymnostellatospora subnuda 0 0.01 0.01 0 0.01 0
185 Cryptococcus chernovii 0 0.02 0.01 0 0 0
186 Rhizophlyctis rosea 0.01 0.01 0 0 0 0
187 Pseudofavolus cucullatus 0.01 0.02 0 0 0 0.01
188 Glomus mosseae 0.01 0.01 0.01 0 0 0
189 Uncultured fungus 0.01 0.01 0 0 0 0
190 Crocicreas coronatum 0 0.03 0 0 0 0
191 Uncultured fungus 0.02 0 0 0 0 0
192 Uncultured fungus 0.02 0 0 0 0 0
193 Stromatonectria caraganae 0.03 0 0 0 0 0
194 Uncultured fungus 0 0 0 0 0.02 0
195 Eremomyces langeronii 0.01 0 0 0 0.01 0
196 Cochliobolus sativus 0 0 0 0.02 0 0
197 Acremonium persicinum 0 0 0.01 0.01 0 0
198 Glomus sp. 0.01 0.01 0 0 0 0
199 Myrothecium roridum 0.01 0.01 0 0 0 0
200 Rhodotorula cresolica 0.01 0.01 0 0 0 0
201 No 0.01 0.01 0 0 0 0
202 Podospora curvicolla 0 0 0 0 0 0.01
203 Uncultured fungus 0.02 0 0 0 0 0.01
204 Verticillium tricorpus 0.01 0 0 0 0 0.01
205 Uncultured fungus 0.01 0 0 0.01 0 0
206 Mortierella elongata 0.01 0 0 0 0 0
207 No 0.01 0 0 0 0 0
208 Fusarium larvarum 0.01 0 0 0 0 0
209 Trichocladium asperum 0.01 0 0 0 0 0
210 Trichocladium asperum 0.01 0 0 0 0 0
211 No 0.01 0.01 0 0 0 0
212 Bionectria ochroleuca 0.01 0 0 0 0 0
213 Pyrenochaeta inflorescentiae 0.01 0 0 0 0 0
214 Penicillium brevicompactum 0 0 0.01 0 0 0.01
215 Leohumicola minima 0.02 0 0 0 0 0
216 Tilletiopsis pallescens 0.01 0.01 0 0 0 0
217 Psilocybe crobula 0.01 0 0 0 0 0
218 Uncultured fungus 0.01 0 0 0 0 0
219 Fusarium acuminatum 0.01 0.01 0 0 0 0
220 Beauveria brongniartii 0 0 0 0 0 0.01
221 Leohumicola minima 0 0 0 0 0 0
222 Cephalosporium maydis 0.01 0 0 0 0 0
223 Acremonium cyanophagus 0 0 0 0 0 0

110
224 Pseudaleuria quinaultiana 0.01 0 0 0 0 0
225 Coprinopsis latispora 0.01 0 0 0 0 0
226 No 0.01 0 0 0 0 0
227 Fusarium oxysporum 0.01 0 0 0 0 0
228 Fusarium oxysporum 0 0.01 0 0 0 0
229 No 0 0 0 0 0 0
230 Uncultured fungus 0.01 0 0 0 0 0
231 Conidiobolus coronatus 0.01 0 0 0 0 0
232 Fusarium larvarum 0.01 0 0 0 0 0
233 Peziza echinispora 0.01 0 0 0 0 0
234 Uncultured fungus 0.01 0 0 0 0 0
235 Fusarium oxysporum 0 0 0 0 0 0
236 No 0 0 0 0 0.01 0
237 Sphaerodes sp. 0.01 0 0 0 0 0
238 Uncultured fungus 0 0.01 0 0 0 0
239 Mortierella elongata 0.01 0 0 0 0 0
240 Uncultured fungus 0.01 0 0 0 0 0
241 Uncultured fungus 0 0 0 0 0 0
242 Fusarium oxysporum 0 0 0 0 0 0
243 Monacrosporium elegans 0 0 0 0 0 0
244 Fusarium oxysporum 0 0 0 0 0 0
245 Gaeumannomyces graminis 0 0 0 0 0 0
246 Cosmospora vilior 0 0 0 0 0 0
247 No 0.01 0 0 0 0 0
248 Pseudeurotium bakeri 0.01 0 0 0 0 0
249 Fusarium oxysporum 0 0 0 0 0 0
250 Fusarium oxysporum 0 0 0 0 0 0
251 Mortierella elongata 0 0 0 0 0 0
252 Mortierella sp. 0 0 0 0 0 0
253 Psathyrella pyrotricha 0 0 0 0 0 0
254 Fusarium oxysporum 0.01 0 0 0 0 0
255 Myrothecium verrucaria 0.01 0 0 0 0 0
256 Fusarium oxysporum 0 0 0 0 0 0
257 Fusarium oxysporum 0 0 0 0 0 0
258 Uncultured fungus 0 0 0 0 0 0
259 Tetracladium furcatum 0 0 0 0 0 0
260 Coprinopsis cinerea 0 0 0 0 0 0
261 Apodus deciduus 0 0 0 0 0 0
262 Mortierella sp. 0 0 0 0 0 0
263 Uncultured Fusarium 0 0 0 0 0 0
264 Verticillium dahliae 0 0 0 0 0 0
265 Hyphodiscus hymeniophilus 0 0 0 0 0 0
266 Mortierella elongata 0.01 0 0 0 0 0
267 Uncultured fungus 0 0 0 0 0 0
268 Fusarium culmorum 0 0 0 0 0 0
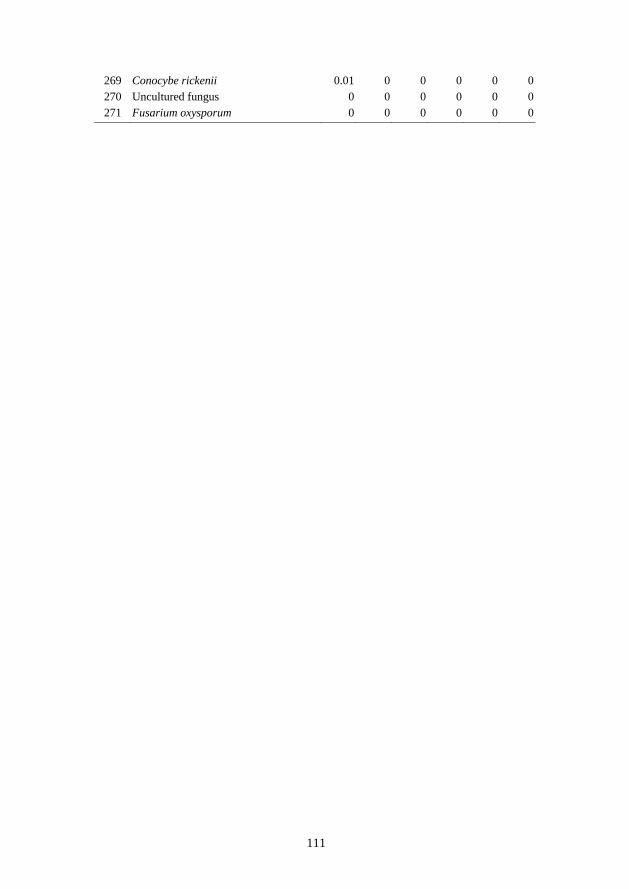
111
269 Conocybe rickenii 0.01 0 0 0 0 0
270 Uncultured fungus 0 0 0 0 0 0
271 Fusarium oxysporum 0 0 0 0 0 0

112
Bulk soil (c)
OTU Closest hit F1D F1H F2D F2H F3D F3H
1 Verticillium dahliae 11.68 11.45 38.05 38.12 20.67 34.21
2 Phoma eupyrena 3.93 4.36 5.62 6.44 10.11 8.62
3 Cryptococcus aerius 5.22 5.57 6.08 6.47 7.80 7.08
4 Mortierella sp. 3.73 5.48 2.97 3.22 10.17 7.72
5 Mortierella elongata 7.28 8.48 2.66 2.00 2.56 4.60
6 Fusarium oxysporum 10.09 5.45 3.43 2.98 1.76 2.07
7 Fusarium merismoides 4.95 5.97 2.09 1.97 4.14 4.83
8 Exophiala salmonis 4.66 5.97 2.52 2.39 1.79 0.95
9 Dokmaia monthadangii 2.00 1.57 3.59 3.00 1.69 2.31
10 Aleuria aurantia 3.62 7.64 0.05 0.20 2.54 0.55
11 Leptodontidium elatius 0.79 0.70 2.46 2.65 3.02 2.71
12 Bionectria ochroleuca 2.41 1.56 3.29 3.70 0.26 0.59
13 Cercophora sparsa 4.13 5.10 0.92 0.72 0.16 0.01
14 Cryptococcus terricola 0.77 1.39 2.95 3.78 0.20 0.05
15 Trichosporon pullulans 0.08 0.07 2.01 1.59 3.38 2.03
16 Sistotrema sernanderi 0.01 0 1.31 3.32 3.31 0.19
17 Trichocladium asperum 2.62 1.35 0.22 0.26 2.48 1.89
18 Mortierella alpina 1.17 1.54 1.49 1.42 0.25 0.68
19 Tetracladium furcatum 0.43 0.32 0.80 0.90 1.67 1.98
20 Mortierella horticola 0.31 0.19 0.03 0.01 3.44 1.12
21 Tetracladium maxilliforme 0.01 0 1.51 0.98 0.89 1.18
22 Mortierella elongata 1.18 1.21 0.45 0.94 0.16 0.07
23 Mortierella elongata 0.93 0.99 0.66 0.77 0.06 0.04
24 Apodus deciduus 1.09 1.41 0.38 0.23 0.27 0.09
25 Microdochium bolleyi 0.80 0.85 0.48 0.45 0.28 0.49
26 Eucasphaeria capensis 1.75 1.22 0.19 0.10 0.06 0.18
27 Trichosporon vadense 0.95 0.59 0.46 0.32 0.61 0.30
28 Acremonium rutilum 0.33 0.38 0.62 0.57 0.35 0.60
29 Uncultured fungus 0.04 0.06 0.05 0.06 2.38 0.04
30 Candida sake 0.17 0.07 0.66 0.71 0.62 0.34
31 Neonectria radicicol 0.41 0.35 0.17 0.13 0.75 0.84
32 Mortierella gamsii 0.29 0.34 0.19 0.18 0.60 0.93
33 Cryptotrichosporon anacardii 0.57 0.69 0.51 0.40 0.20 0.04
34 Cryptococcus laurentii 0.87 0.93 0.01 0.03 0.08 0.48
35 Mortierella alpina 0.09 0.02 0.04 0.03 0.31 1.48
36 Trichocladium opacum 0.32 0.27 0.29 0.23 0.48 0.26
37 Lachnella alboviolascens 0.49 0.79 0.04 0.08 0.09 0.25
38 Cladosporium cucumerinum 0.47 0.41 0.39 0.27 0.05 0.06
39 Pseudallescheria fimeti 0.91 0.50 0 0 0.12 0.23
40 Uncultured fungus 0.66 0.64 0.12 0.06 0.05 0.14
41 Pseudeurotium bakeri 0.04 0.02 0.24 0.23 0.64 0.28
42 Aquaticola hongkongensis 0.58 0.99 0 0 0 0
43 Uncultured fungus 0.45 0.37 0.19 0.13 0.15 0.08

113
44 Peziza domiciliana 0.57 0 1.04 0.05 0 0
45 Cryptococcus podzolicus 0.20 0.31 0.28 0.50 0 0.01
46 Leptodontidium orchidicola 0.62 0.37 0.08 0.04 0.33 0.01
47 Fusarium solani 0.41 0.01 0.11 0.25 0.17 0.19
48 Uncultured fungus 0 0.02 0.01 0.01 0.96 0
49 Ophiosphaerella herpotricha 0.19 0.13 0.11 0.11 0.18 0.32
50 Uncultured fungus 0.01 0.01 0.33 0.49 0 0.01
51 Neonectria ramulariae 0.10 0.17 0.08 0.14 0.18 0.26
52 Dendryphion nanum 0.16 0.21 0.02 0.01 0.26 0.29
53 Paecilomyces carneus 0.24 0.33 0.19 0.16 0.03 0
54 Acremonium persicinum 0.03 0.05 0.13 0.08 0.07 0.50
55 No 0.22 0.23 0.07 0.06 0.15 0.17
56 Uncultured fungus 0.04 0.06 0.01 0 0.69 0
57 Preussia funiculata 0.03 0.03 0.06 0 0.26 0.43
58 Cyphellophora laciniata 0.24 0.28 0.14 0.17 0 0
59 Geomyces pannorum 0.16 0.12 0.01 0 0.17 0.33
60 Uncultured fungus 0.46 0.19 0 0 0.07 0.16
61 Preussia africana 0.06 0.03 0.01 0.01 0.28 0.39
62 Pseudallescheria africana 0.24 0.21 0.12 0.08 0.08 0.08
63 Cudoniella clavus 0.30 0.11 0.40 0.07 0 0
64 Leohumicola minima 0.06 0.06 0.22 0.11 0.23 0.05
65 Mrakia nivalis 0.03 0 0.18 0.17 0.18 0.11
66 Sistotrema brinkmannii 0.29 0.11 0.31 0 0 0.06
67 Pyrenochaeta sp. 0.03 0 0.01 0 0.60 0.04
68 Plectosphaerella cucumerina 0.02 0.02 0.15 0.24 0.06 0.14
69 Mortierella hyalina 0.07 0.11 0.21 0.24 0.02 0.01
70 Uncultured fungus 0.20 0.16 0.12 0.06 0.10 0.05
71 Exophiala salmonis 0.32 0.29 0.09 0.02 0 0.01
72 Olpidium brassicae 0.30 0.42 0 0.01 0 0
73 Monacrosporium elegans 0.22 0.15 0.06 0.10 0.15 0
74 Sclerotinia homoeocarpa 0.44 0.21 0.01 0.03 0.01 0.01
75 Devriesia sp. 0.08 0.10 0.16 0.24 0 0
76 Lewia infectoria 0.11 0.07 0.20 0.16 0 0.02
77 Rhodotorula pustula 0.06 0.05 0.20 0.09 0.05 0.11
78 Neonectria radicicola 0.04 0.07 0.07 0.15 0.16 0.04
79 Athelia bombacina 0.29 0.23 0.06 0 0 0
80 Didymella exitialis 0.02 0.08 0.17 0.19 0.01 0.02
81 Fusarium solani 0.21 0.03 0.01 0.03 0.08 0.17
82 Hypocrea pachybasioides 0.20 0.19 0.05 0.08 0.02 0.01
83 No 0.02 0.02 0.15 0.21 0.06 0
84 No 0.01 0.04 0.01 0.05 0.38 0
85 Leohumicola minima 0.14 0.29 0.04 0.04 0.01 0
86 Mortierella gamsii 0.01 0 0 0.01 0.17 0.27
87 Stachybotrys chartarum 0.08 0.17 0.03 0.01 0.08 0.13
88 Scedosporium apiospermum 0.03 0.21 0.08 0.10 0.02 0.02
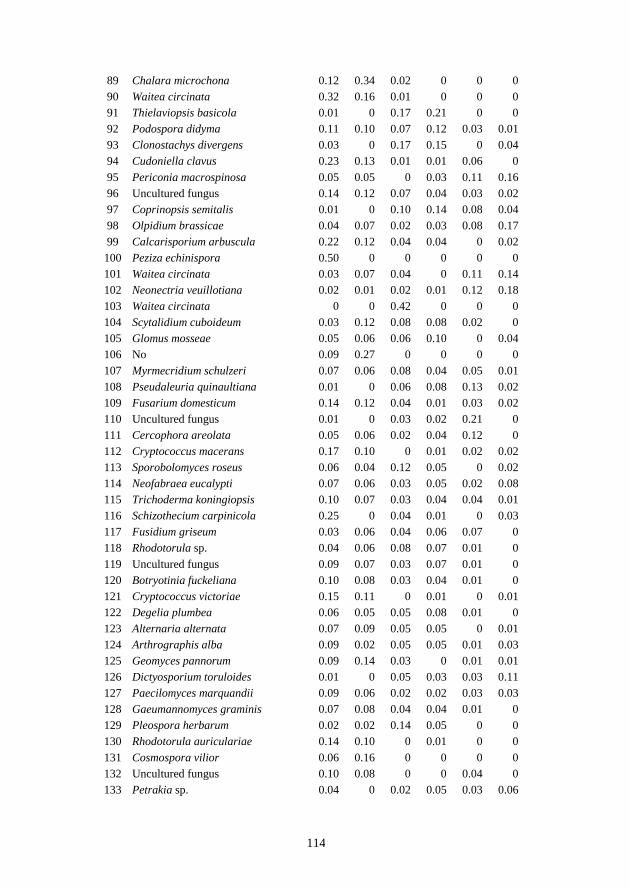
114
89 Chalara microchona 0.12 0.34 0.02 0 0 0
90 Waitea circinata 0.32 0.16 0.01 0 0 0
91 Thielaviopsis basicola 0.01 0 0.17 0.21 0 0
92 Podospora didyma 0.11 0.10 0.07 0.12 0.03 0.01
93 Clonostachys divergens 0.03 0 0.17 0.15 0 0.04
94 Cudoniella clavus 0.23 0.13 0.01 0.01 0.06 0
95 Periconia macrospinosa 0.05 0.05 0 0.03 0.11 0.16
96 Uncultured fungus 0.14 0.12 0.07 0.04 0.03 0.02
97 Coprinopsis semitalis 0.01 0 0.10 0.14 0.08 0.04
98 Olpidium brassicae 0.04 0.07 0.02 0.03 0.08 0.17
99 Calcarisporium arbuscula 0.22 0.12 0.04 0.04 0 0.02
100 Peziza echinispora 0.50 0 0 0 0 0
101 Waitea circinata 0.03 0.07 0.04 0 0.11 0.14
102 Neonectria veuillotiana 0.02 0.01 0.02 0.01 0.12 0.18
103 Waitea circinata 0 0 0.42 0 0 0
104 Scytalidium cuboideum 0.03 0.12 0.08 0.08 0.02 0
105 Glomus mosseae 0.05 0.06 0.06 0.10 0 0.04
106 No 0.09 0.27 0 0 0 0
107 Myrmecridium schulzeri 0.07 0.06 0.08 0.04 0.05 0.01
108 Pseudaleuria quinaultiana 0.01 0 0.06 0.08 0.13 0.02
109 Fusarium domesticum 0.14 0.12 0.04 0.01 0.03 0.02
110 Uncultured fungus 0.01 0 0.03 0.02 0.21 0
111 Cercophora areolata 0.05 0.06 0.02 0.04 0.12 0
112 Cryptococcus macerans 0.17 0.10 0 0.01 0.02 0.02
113 Sporobolomyces roseus 0.06 0.04 0.12 0.05 0 0.02
114 Neofabraea eucalypti 0.07 0.06 0.03 0.05 0.02 0.08
115 Trichoderma koningiopsis 0.10 0.07 0.03 0.04 0.04 0.01
116 Schizothecium carpinicola 0.25 0 0.04 0.01 0 0.03
117 Fusidium griseum 0.03 0.06 0.04 0.06 0.07 0
118 Rhodotorula sp. 0.04 0.06 0.08 0.07 0.01 0
119 Uncultured fungus 0.09 0.07 0.03 0.07 0.01 0
120 Botryotinia fuckeliana 0.10 0.08 0.03 0.04 0.01 0
121 Cryptococcus victoriae 0.15 0.11 0 0.01 0 0.01
122 Degelia plumbea 0.06 0.05 0.05 0.08 0.01 0
123 Alternaria alternata 0.07 0.09 0.05 0.05 0 0.01
124 Arthrographis alba 0.09 0.02 0.05 0.05 0.01 0.03
125 Geomyces pannorum 0.09 0.14 0.03 0 0.01 0.01
126 Dictyosporium toruloides 0.01 0 0.05 0.03 0.03 0.11
127 Paecilomyces marquandii 0.09 0.06 0.02 0.02 0.03 0.03
128 Gaeumannomyces graminis 0.07 0.08 0.04 0.04 0.01 0
129 Pleospora herbarum 0.02 0.02 0.14 0.05 0 0
130 Rhodotorula auriculariae 0.14 0.10 0 0.01 0 0
131 Cosmospora vilior 0.06 0.16 0 0 0 0
132 Uncultured fungus 0.10 0.08 0 0 0.04 0
133 Petrakia sp. 0.04 0 0.02 0.05 0.03 0.06

115
134 Leucopaxillus tricolor 0.05 0.18 0 0 0 0
135 Occultifur externus 0.01 0 0.13 0.03 0 0.02
136 Nectria inventa 0.13 0.04 0.01 0.02 0 0.02
137 Gymnostellatospora subnuda 0.08 0.07 0.02 0 0.03 0.02
138 Acremonium cereale 0.01 0 0.03 0.01 0.03 0.09
139 Rhodotorula minuta 0.13 0.01 0.05 0.01 0 0.01
140 Rhizoctonia sp. 0 0.01 0 0 0.15 0
141 Pyrenochaeta lycopersici 0.04 0.03 0 0 0.06 0.04
142 Sistotrema coronilla 0 0.13 0 0.04 0 0
143 Gelasinospora cratophora 0.02 0.01 0 0.01 0.04 0.09
144 Schizothecium glutinans 0.05 0.07 0.02 0.01 0.02 0
145 Microbotryum pinguiculae 0.11 0.06 0 0 0 0
146 Phaeophleospora stonei 0.06 0.04 0.02 0.01 0.02 0
147 Peziza arvernensis 0.17 0.01 0 0 0 0
148 Uncultured fungus 0.01 0.01 0.06 0.04 0 0.01
149 Ijuhya paraparilis 0.09 0.04 0 0.03 0 0
150 Heydenia alpina 0.05 0.04 0 0 0.06 0.01
151 Rhodotorula cresolica 0.02 0.09 0 0 0.03 0
152 Acremonium rutilum 0.04 0 0.01 0.02 0.02 0.04
153 Polytolypa hystricis 0.05 0.06 0.01 0 0.01 0.01
154 Uncultured fungus 0 0.01 0.03 0.06 0 0.01
155 Rhodotorula ferulica 0.01 0.01 0 0.01 0.08 0.01
156 No 0.01 0.04 0.05 0.02 0 0
157 Cercophora coprophila 0.02 0 0 0 0.06 0.04
158 Amaurodon viridis 0.03 0.06 0.02 0.02 0 0
159 Acremonium murorum 0 0 0.04 0.03 0.01 0.04
160 Uncultured fungus 0.02 0.03 0.03 0.01 0.01 0.02
161 Cryptococcus festucosus 0.02 0.06 0.01 0.02 0 0
162 Entrophospora sp. 0.02 0.04 0.04 0.02 0 0
163 Coniothyrium cereale 0.01 0.01 0.02 0.01 0.01 0.05
164 Neonectria lucida 0.01 0.09 0 0 0 0
165 Uncultured fungus 0.02 0.01 0.01 0.01 0.02 0.04
166 Cudoniella clavus 0.04 0.02 0.01 0.02 0 0.01
167 Olpidium brassicae 0.01 0.01 0.01 0.01 0.01 0.06
168 Uncultured fungus 0.02 0 0.01 0.02 0.06 0
169 No 0.04 0.08 0 0 0 0
170 Ascobolus crenulatus 0.05 0.01 0.01 0 0.01 0.03
171 Podospora pyriformis 0.02 0.02 0.03 0 0.01 0.02
172 No 0.01 0 0 0.02 0.01 0.06
173 Tubeufia helicomyces 0.02 0 0.01 0.06 0 0
174 Acremonium rutilum 0.01 0.01 0 0.01 0.03 0.04
175 Uncultured fungus 0 0 0.03 0.05 0 0
176 Nectria bactridioides 0.02 0.05 0.01 0.02 0 0
177 Rhodotorula lamellibrachiae 0.01 0.03 0 0.01 0 0.04
178 Trichoderma rossicum 0.01 0 0.01 0.01 0.02 0.05

116
179 Coprinellus bisporus 0.08 0.03 0 0 0.01 0
180 Rhodotorula glutinis 0.01 0 0.05 0.02 0 0
181 Leohumicola minima 0.01 0.02 0.02 0.02 0.03 0
182 Basidiobolus haptosporus 0.06 0.01 0.01 0 0 0.02
183 Uncultured fungus 0.10 0 0 0 0 0
184 Chaetosphaeria myriocarpa 0.03 0.05 0.01 0.01 0 0
185 Cryptococcus tephrensis 0.03 0.01 0.03 0.01 0 0
186 Mortierella sp. 0 0.03 0.04 0.01 0 0
187 Glomus caledonium 0.02 0.03 0 0 0 0.03
188 Udeniomyces pannonicus 0.03 0.01 0.01 0.03 0 0.01
189 Preussia africana 0.04 0.02 0 0.01 0.01 0.02
190 Pyrenochaeta inflorescentiae 0.01 0.03 0 0.02 0.01 0.01
191 Cryptococcus taibaiensis 0.07 0.02 0 0 0 0.01
192 Mortierella macrocystis 0.01 0 0 0.01 0 0.05
193 Glomus caledonium 0.02 0.01 0.01 0.01 0.03 0
194 Uncultured fungus 0.01 0 0.03 0.03 0 0
195 Paecilomyces inflatus 0.02 0.06 0 0 0 0
196 Uncultured fungus 0.01 0.07 0 0 0 0
197 Uncultured fungus 0.02 0.03 0.01 0.01 0 0
198 Crocicreas coronatum 0.01 0.04 0 0 0.02 0.01
199 No 0.09 0 0 0 0 0
200 Schizothecium glutinans 0.01 0.02 0.01 0.01 0.01 0.01
201 Cladorrhinum brunnescens 0.03 0.04 0 0 0 0
202 Leptosphaeria biglobosa 0.02 0.05 0 0 0 0
203 Uncultured fungus 0.02 0 0.01 0.01 0.03 0
204 No 0.09 0 0 0 0 0
205 Cryptococcus podzolicus 0.02 0.01 0 0.03 0 0
206 Podospora didyma 0 0 0 0.03 0 0.02
207 No 0.01 0.06 0 0 0 0
208 Capronia peltigerae 0.01 0.05 0.01 0 0 0
209 Glomus mosseae 0.02 0.01 0.01 0.01 0.01 0.01
210 Volutella ciliata 0.02 0 0 0 0.01 0.03
211 Tilletiopsis pallescens 0.02 0.02 0.01 0.01 0 0
212 Cladorrhinum samala 0.02 0.02 0 0.01 0.01 0.02
213 Cercophora coprophila 0.01 0.01 0 0 0.03 0.01
214 Pseudallescheria fimeti 0.01 0.02 0 0.01 0.01 0.01
215 Mycoarthris corallinus 0.02 0 0.03 0.01 0 0
216 Laetisaria arvalis 0.01 0.06 0 0 0 0
217 Hyphodontia alutaria 0.02 0.02 0.01 0.01 0 0
218 Rhodotorula lamellibrachiae 0.01 0 0 0.01 0.02 0.01
219 Pseudaleuria quinaultiana 0.02 0.04 0 0 0 0
220 Podospora curvicolla 0.02 0 0.01 0 0.01 0.02
221 Peziza domiciliana 0.01 0 0 0 0.05 0
222 Dioszegia fristingensis 0.02 0 0.03 0.01 0 0
223 Rhodotorula ferulica 0.01 0.01 0.01 0.01 0 0.01

117
224 Mortierella polycephala 0.01 0 0 0.01 0.02 0.01
225 Stilbum vulgare 0 0.01 0.04 0 0 0.01
226 No 0.02 0.01 0.01 0.02 0 0
227 Verticillium dahliae 0.02 0.03 0 0 0 0
228 Uncultured fungus 0.03 0.01 0 0 0.02 0
229 Uncultured fungus 0.04 0.01 0 0 0 0.01
230 Uncultured fungus 0.02 0.02 0.01 0 0 0
231 Entyloma majewskii 0.02 0.03 0 0 0 0.01
232 Mortierella alpina 0.01 0 0 0.01 0.01 0.01
233 Metarhizium flavoviride 0.04 0 0 0 0 0.01
234 Leptodontidium elatius 0.01 0 0.01 0 0.01 0.02
235 Uncultured fungus 0.02 0 0.02 0.01 0.01 0
236 Uncultured fungus 0.02 0.01 0.02 0 0 0
237 Sarea resinae 0.01 0.01 0.01 0.01 0 0
238 Cosmospora vilior 0.01 0.04 0 0 0 0
239 Rhodotorula lignophila 0 0.03 0 0 0 0.01
240 Uncultured fungus 0.03 0.02 0 0 0 0
241 Clitopilus passeckerianus 0.02 0 0.02 0 0 0.01
242 Schizothecium glutinans 0.01 0.01 0.01 0.01 0 0
243 Phialocephala xalapensis 0.01 0.03 0 0.01 0 0
244 Hydropisphaera erubescens 0.01 0 0 0 0 0.03
245 No 0.01 0 0 0 0 0.02
246 Lepista sordida 0.05 0 0 0 0 0
247 Cochliobolus sativus 0.01 0 0.01 0.02 0 0
248 Galerina arctica 0.01 0.02 0.01 0 0 0
249 Pseudofavolus cucullatus 0.02 0 0 0 0 0.02
250 Myrothecium roridum 0.01 0.02 0 0 0 0
251 Omphalina rustica 0.02 0.02 0 0.01 0 0
252 Leptosphaeria biglobosa 0.05 0 0 0 0 0
253 Uncultured fungus 0.01 0.02 0 0.01 0 0.01
254 Pyrenochaeta sp. 0.02 0 0 0 0.02 0
255 Colletotrichum trichellum 0.01 0 0 0 0.02 0
256 Uncultured fungus 0.04 0 0 0 0 0
257 Cryptococcus chernovii 0.01 0.01 0 0.01 0 0
258 Uncultured fungus 0.01 0.01 0.01 0.01 0 0
259 Schizothecium glutinans 0.01 0 0.01 0 0.01 0
260 Uncultured fungus 0.02 0.01 0 0 0 0
261 Fusarium merismoides 0.01 0 0 0 0 0.03
262 Pseudeurotium bakeri 0.02 0.01 0 0 0 0.01
263 Archaeospora sp. 0.01 0 0 0 0.03 0
264 Acremonium psammosporum 0.01 0.02 0 0 0 0
265 Preussia africana 0.01 0 0 0 0.01 0.01
266 Chaetomium aureum 0.01 0.01 0 0 0 0.01
267 Schizothecium glutinans 0.03 0.01 0 0 0 0
268 Cephaliophora tropica 0.01 0.01 0 0 0 0.01
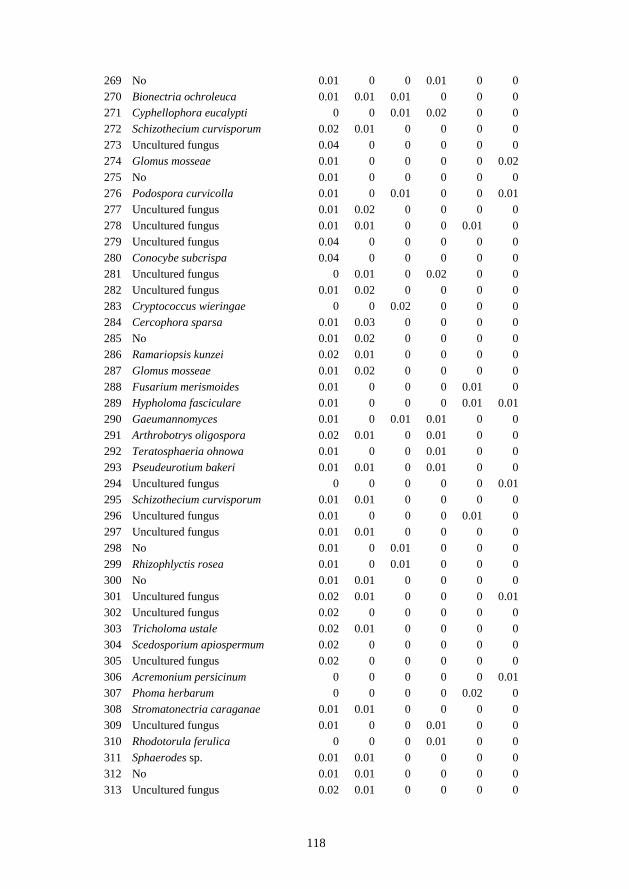
118
269 No 0.01 0 0 0.01 0 0
270 Bionectria ochroleuca 0.01 0.01 0.01 0 0 0
271 Cyphellophora eucalypti 0 0 0.01 0.02 0 0
272 Schizothecium curvisporum 0.02 0.01 0 0 0 0
273 Uncultured fungus 0.04 0 0 0 0 0
274 Glomus mosseae 0.01 0 0 0 0 0.02
275 No 0.01 0 0 0 0 0
276 Podospora curvicolla 0.01 0 0.01 0 0 0.01
277 Uncultured fungus 0.01 0.02 0 0 0 0
278 Uncultured fungus 0.01 0.01 0 0 0.01 0
279 Uncultured fungus 0.04 0 0 0 0 0
280 Conocybe subcrispa 0.04 0 0 0 0 0
281 Uncultured fungus 0 0.01 0 0.02 0 0
282 Uncultured fungus 0.01 0.02 0 0 0 0
283 Cryptococcus wieringae 0 0 0.02 0 0 0
284 Cercophora sparsa 0.01 0.03 0 0 0 0
285 No 0.01 0.02 0 0 0 0
286 Ramariopsis kunzei 0.02 0.01 0 0 0 0
287 Glomus mosseae 0.01 0.02 0 0 0 0
288 Fusarium merismoides 0.01 0 0 0 0.01 0
289 Hypholoma fasciculare 0.01 0 0 0 0.01 0.01
290 Gaeumannomyces 0.01 0 0.01 0.01 0 0
291 Arthrobotrys oligospora 0.02 0.01 0 0.01 0 0
292 Teratosphaeria ohnowa 0.01 0 0 0.01 0 0
293 Pseudeurotium bakeri 0.01 0.01 0 0.01 0 0
294 Uncultured fungus 0 0 0 0 0 0.01
295 Schizothecium curvisporum 0.01 0.01 0 0 0 0
296 Uncultured fungus 0.01 0 0 0 0.01 0
297 Uncultured fungus 0.01 0.01 0 0 0 0
298 No 0.01 0 0.01 0 0 0
299 Rhizophlyctis rosea 0.01 0 0.01 0 0 0
300 No 0.01 0.01 0 0 0 0
301 Uncultured fungus 0.02 0.01 0 0 0 0.01
302 Uncultured fungus 0.02 0 0 0 0 0
303 Tricholoma ustale 0.02 0.01 0 0 0 0
304 Scedosporium apiospermum 0.02 0 0 0 0 0
305 Uncultured fungus 0.02 0 0 0 0 0
306 Acremonium persicinum 0 0 0 0 0 0.01
307 Phoma herbarum 0 0 0 0 0.02 0
308 Stromatonectria caraganae 0.01 0.01 0 0 0 0
309 Uncultured fungus 0.01 0 0 0.01 0 0
310 Rhodotorula ferulica 0 0 0 0.01 0 0
311 Sphaerodes sp. 0.01 0.01 0 0 0 0
312 No 0.01 0.01 0 0 0 0
313 Uncultured fungus 0.02 0.01 0 0 0 0

119
314 Trichocladium opacum 0.01 0 0 0 0 0
315 Acremonium strictum 0.02 0 0 0 0 0
316 Uncultured fungus 0 0.01 0 0 0 0
317 Uncultured fungus 0.01 0 0 0 0 0
318 Uncultured fungus 0 0 0 0 0 0.01
319 Uncultured fungus 0 0 0 0 0 0.01
320 No 0.02 0 0 0 0 0
321 Kurtzmanomyces tardus 0 0 0 0 0 0.01
322 Fusarium culmorum 0.01 0 0.01 0 0 0
323 Paraphoma chrysanthemicola 0.01 0 0 0 0 0.02
324 Stachybotrys chartarum 0.01 0 0 0 0 0
325 Panaeolus uliginosus 0.01 0.01 0 0 0 0
326 Rickenella pseudogrisella 0.01 0 0 0 0 0.01
327 Trichocladium asperum 0.01 0 0 0 0 0
328 No 0.01 0 0 0 0.02 0
329 Uncultured fungus 0.01 0 0 0.01 0 0
330 Uncultured fungus 0.01 0 0 0.01 0 0
331 Pseudaleuria quinaultiana 0.01 0 0.01 0 0 0
332 Pachnocybe ferruginea 0.01 0 0 0 0 0
333 Uncultured fungus 0.01 0.01 0 0 0 0
334 Entrophospora infrequens 0.01 0 0 0 0 0
335 Ceratobasidium sp. 0.01 0.01 0 0 0 0
336 Uncultured fungus 0.02 0 0 0 0 0
337 Mortierella sp. 0.01 0 0 0 0 0
338 Uncultured fungus 0.01 0 0 0 0 0
339 Uncultured fungus 0.02 0 0 0 0 0
340 Uncultured fungus 0.01 0 0 0 0 0
341 Uncultured fungus 0 0.01 0 0 0 0
342 Leohumicola minima 0.01 0 0.01 0 0 0
343 Mortierella elongata 0.01 0 0 0 0 0
344 No 0.01 0 0.01 0 0 0
345 Kernia pachypleura 0.01 0 0 0 0 0.01
346 Ajellomyces dermatitidis 0.01 0 0 0 0 0
347 Fusarium avenaceum 0.01 0 0 0 0 0
348 Cylindrocarpon didymum 0.01 0 0 0 0 0.01
349 Pyrenochaeta sp. 0.01 0 0 0 0.01 0
350 Uncultured fungus 0.02 0 0 0 0 0
351 Dictyosporium strelitziae 0.01 0 0 0.01 0 0
352 Hypocrea aeruginea 0.01 0 0.01 0 0 0
353 Sarea difformis 0 0.01 0 0 0 0
354 Cephalotheca sulfurea 0.01 0 0.01 0 0 0
355 Uncultured fungus 0.01 0 0 0 0 0
356 Hypocrea pachybasioides 0.01 0 0 0 0 0
357 Fusarium solani 0.01 0 0 0 0 0
358 Uncultured fungus 0.01 0 0 0 0 0
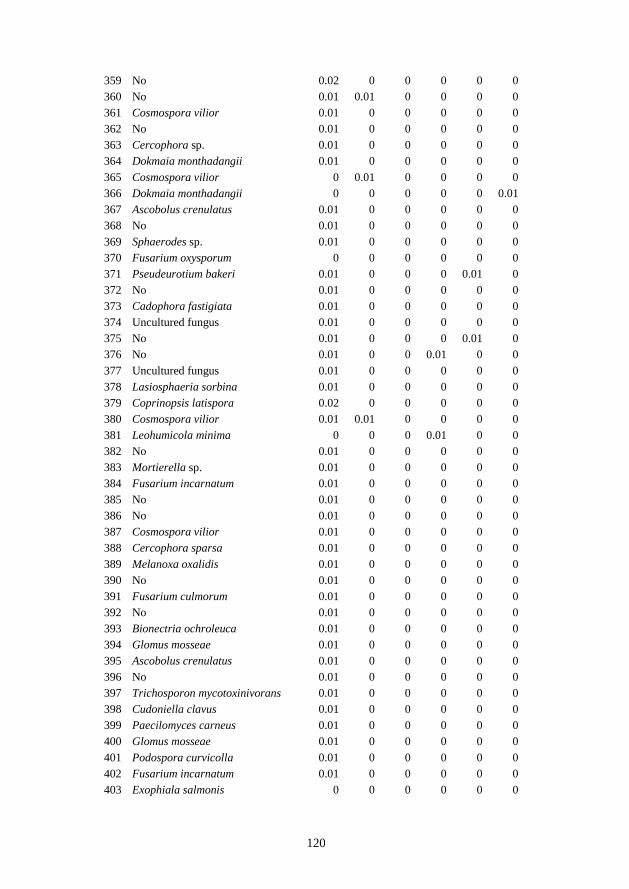
120
359 No 0.02 0 0 0 0 0
360 No 0.01 0.01 0 0 0 0
361 Cosmospora vilior 0.01 0 0 0 0 0
362 No 0.01 0 0 0 0 0
363 Cercophora sp. 0.01 0 0 0 0 0
364 Dokmaia monthadangii 0.01 0 0 0 0 0
365 Cosmospora vilior 0 0.01 0 0 0 0
366 Dokmaia monthadangii 0 0 0 0 0 0.01
367 Ascobolus crenulatus 0.01 0 0 0 0 0
368 No 0.01 0 0 0 0 0
369 Sphaerodes sp. 0.01 0 0 0 0 0
370 Fusarium oxysporum 0 0 0 0 0 0
371 Pseudeurotium bakeri 0.01 0 0 0 0.01 0
372 No 0.01 0 0 0 0 0
373 Cadophora fastigiata 0.01 0 0 0 0 0
374 Uncultured fungus 0.01 0 0 0 0 0
375 No 0.01 0 0 0 0.01 0
376 No 0.01 0 0 0.01 0 0
377 Uncultured fungus 0.01 0 0 0 0 0
378 Lasiosphaeria sorbina 0.01 0 0 0 0 0
379 Coprinopsis latispora 0.02 0 0 0 0 0
380 Cosmospora vilior 0.01 0.01 0 0 0 0
381 Leohumicola minima 0 0 0 0.01 0 0
382 No 0.01 0 0 0 0 0
383 Mortierella sp. 0.01 0 0 0 0 0
384 Fusarium incarnatum 0.01 0 0 0 0 0
385 No 0.01 0 0 0 0 0
386 No 0.01 0 0 0 0 0
387 Cosmospora vilior 0.01 0 0 0 0 0
388 Cercophora sparsa 0.01 0 0 0 0 0
389 Melanoxa oxalidis 0.01 0 0 0 0 0
390 No 0.01 0 0 0 0 0
391 Fusarium culmorum 0.01 0 0 0 0 0
392 No 0.01 0 0 0 0 0
393 Bionectria ochroleuca 0.01 0 0 0 0 0
394 Glomus mosseae 0.01 0 0 0 0 0
395 Ascobolus crenulatus 0.01 0 0 0 0 0
396 No 0.01 0 0 0 0 0
397 Trichosporon mycotoxinivorans 0.01 0 0 0 0 0
398 Cudoniella clavus 0.01 0 0 0 0 0
399 Paecilomyces carneus 0.01 0 0 0 0 0
400 Glomus mosseae 0.01 0 0 0 0 0
401 Podospora curvicolla 0.01 0 0 0 0 0
402 Fusarium incarnatum 0.01 0 0 0 0 0
403 Exophiala salmonis 0 0 0 0 0 0

121
404 Chaetomium sp. 0 0 0 0 0 0
405 Fusarium lactis 0 0 0 0 0 0
406 Helicoma vaccinii 0.01 0 0 0 0 0
407 Phialemonium dimorphosporum 0 0 0 0 0 0
408 Fusarium larvarum 0 0 0 0 0 0
409 Fusarium merismoides 0 0 0 0 0 0
410 No 0.01 0 0 0 0 0
411 Eucasphaeria capensis 0 0 0 0 0 0
412 Fusarium solani 0 0 0 0 0 0
413 Fusarium merismoides 0.01 0 0 0 0 0
414 Glomus sp. 0.01 0 0 0 0 0
415 Scutellospora reticulata 0.01 0 0 0 0 0
416 Olpidium brassicae 0.01 0 0 0 0 0
417 Pseudaleuria quinaultiana 0.01 0 0 0 0 0
418 Eucasphaeria capensis 0 0 0 0 0 0
419 Fusarium avenaceum 0.01 0 0 0 0 0
420 Apodus deciduus 0.01 0 0 0 0 0
421 Fusarium larvarum 0.01 0 0 0 0 0
422 No 0 0 0 0 0 0
423 Mortierella elongata 0.01 0 0 0 0 0
424 Glomus mosseae 0.01 0 0 0 0 0
425 Fusarium oxysporum 0.01 0 0 0 0 0
426 Uncultured fungus 0.01 0 0 0 0 0
427 Glomus claroideum 0.01 0 0 0 0 0
428 Acremonium cyanophagus 0.01 0 0 0 0 0
429 Pulvinula constellatio 0.01 0 0 0 0 0
430 Leohumicola minima 0.01 0 0 0 0 0
431 Apinisia racovitzae 0.01 0 0 0 0 0
432 Cryptococcus gastricus 0.01 0 0 0 0 0
433 Uncultured fungus 0 0 0 0 0 0
434 Uncultured fungus 0.01 0 0 0 0 0
435 Acremonium persicinum 0.01 0 0 0 0 0
436 Acaulospora trappei 0 0 0 0 0 0
437 No 0 0 0 0 0 0
438 Mastigobasidium intermedium 0.01 0 0 0 0 0
439 Oculimacula yallundae 0.01 0 0 0 0 0
440 No 0 0 0 0 0 0

122
Table S2. The standardized number of total sequences from root, rhizosphere, and bulk soil,
respectively, which were identified at the genus level (n = 30).
Genera Root Rhizosphere soil Bulk soil
Acaulospora 30 0 2
Acremonium 3 631 1136
Ajellomyces 0 0 4
Aleuria 0 0 3510
Alternaria 22 27 66
Amaurodon 0 32 32
Ambispora 18 0 0
Apinisia 0 0 2
Apodus 0 812 831
Aquaticola 18 184 346
Archaeospora 0 0 9
Arthrobotrys 6 48 7
Arthrographis 0 40 65
Ascobolus 0 34 31
Athelia 0 0 136
Basidiobolus 0 0 22
Beauveria 0 4 0
Bionectria 2034 9270 3146
Botryotinia 0 23 68
Cadophora 0 0 3
Calcarisporium 0 106 101
Candida 0 703 695
Capronia 0 17 17
Cephaliophora 0 0 8
Cephalosporium 0 4 0
Cephalotheca 0 0 4
Ceratobasidium 0 0 4
Cercophora 0 1964 2697
Chaetomium 0 0 10
Chaetosphaeria 0 51 22
Chalara 0 0 111
Cladorrhinum 0 18 34
Cladosporium 131 319 419
Clavulinaceae 0 17 0
Clitopilus 0 9 12
Clonostachys 0 0 109
Cochliobolus 0 7 11
Colletotrichum 0 0 10
Conidiobolus 0 3 0
Coniothyrium 0 22 29
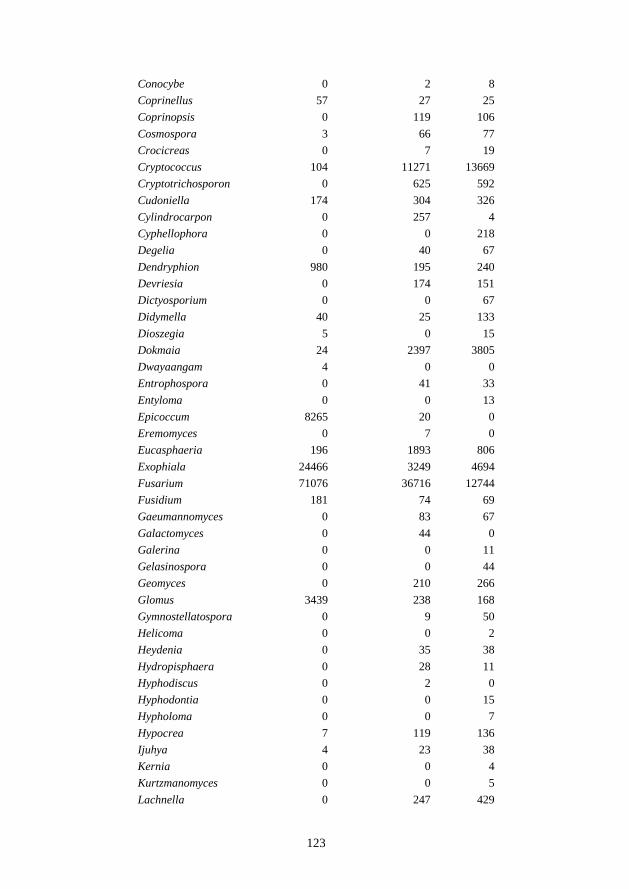
123
Conocybe 0 2 8
Coprinellus 57 27 25
Coprinopsis 0 119 106
Cosmospora 3 66 77
Crocicreas 0 7 19
Cryptococcus 104 11271 13669
Cryptotrichosporon 0 625 592
Cudoniella 174 304 326
Cylindrocarpon 0 257 4
Cyphellophora 0 0 218
Degelia 0 40 67
Dendryphion 980 195 240
Devriesia 0 174 151
Dictyosporium 0 0 67
Didymella 40 25 133
Dioszegia 5 0 15
Dokmaia 24 2397 3805
Dwayaangam 4 0 0
Entrophospora 0 41 33
Entyloma 0 0 13
Epicoccum 8265 20 0
Eremomyces 0 7 0
Eucasphaeria 196 1893 806
Exophiala 24466 3249 4694
Fusarium 71076 36716 12744
Fusidium 181 74 69
Gaeumannomyces 0 83 67
Galactomyces 0 44 0
Galerina 0 0 11
Gelasinospora 0 0 44
Geomyces 0 210 266
Glomus 3439 238 168
Gymnostellatospora 0 9 50
Helicoma 0 0 2
Heydenia 0 35 38
Hydropisphaera 0 28 11
Hyphodiscus 0 2 0
Hyphodontia 0 0 15
Hypholoma 0 0 7
Hypocrea 7 119 136
Ijuhya 4 23 38
Kernia 0 0 4
Kurtzmanomyces 0 0 5
Lachnella 0 247 429

124
Laetisaria 0 0 15
Lasiosphaeria 0 0 3
Leohumicola 17106 585 352
Lepista 0 0 11
Leptodontidium 62 3331 3703
Leptosphaeria 0 0 28
Leptosphaerulina 5 0 0
Leucopaxillus 0 19 51
Lewia 48 78 147
Mastigobasidium 0 0 2
Melanoxa 0 0 2
Metarhizium 0 12 13
Microbotryum 0 26 40
Microdochium 70 653 821
Monacrosporium 472 1193 169
Mortierella 401 17974 21728
Mrakia 0 0 188
Mycoarthris 0 0 16
Myrmecridium 0 85 81
Myrothecium 0 8 10
Nectria 0 47 76
Neofabraea 0 57 72
Neonectria 7699 1041 1167
Occultifur 0 0 51
Oculimacula 0 0 2
Olpidium 0 191 301
Omphalina 0 0 10
Ophiosphaerella 0 160 269
Pachnocybe 0 0 5
Paecilomyces 4 256 323
Panaeolus 0 0 5
Paraglomus 27 32 5
Parapleurotheciopsis 15 22 0
Penicillium 0 5 0
Periconia 61 31 104
Petrakia 0 56 53
Peziza 0 23 492
Phaeophleospora 0 0 40
Phaeophleospora 0 28 0
Phialemonium 0 0 2
Phialocephala 0 13 11
Phialophora 0 65 0
Phoma 0 6526 10296
Plectosphaerella 0 0 173
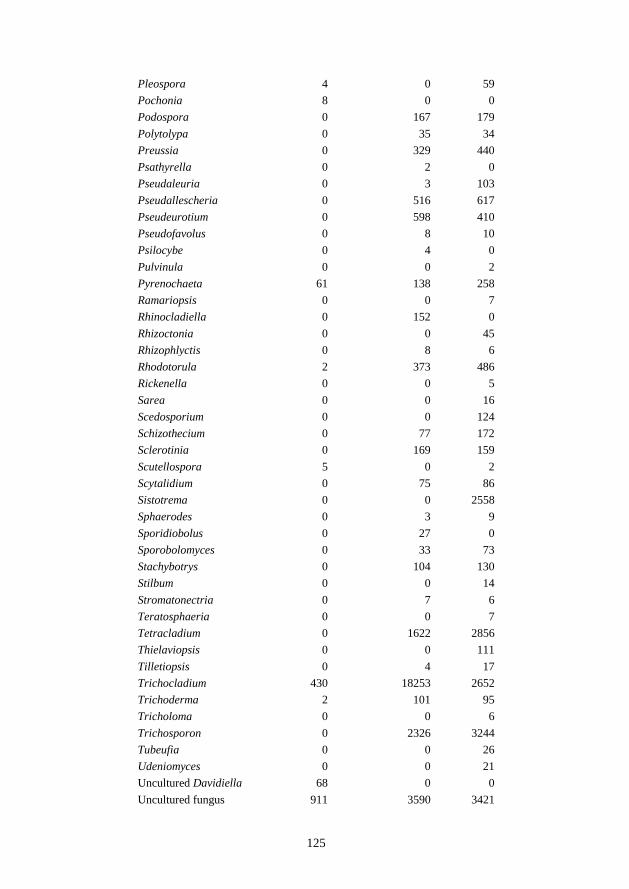
125
Pleospora 4 0 59
Pochonia 8 0 0
Podospora 0 167 179
Polytolypa 0 35 34
Preussia 0 329 440
Psathyrella 0 2 0
Pseudaleuria 0 3 103
Pseudallescheria 0 516 617
Pseudeurotium 0 598 410
Pseudofavolus 0 8 10
Psilocybe 0 4 0
Pulvinula 0 0 2
Pyrenochaeta 61 138 258
Ramariopsis 0 0 7
Rhinocladiella 0 152 0
Rhizoctonia 0 0 45
Rhizophlyctis 0 8 6
Rhodotorula 2 373 486
Rickenella 0 0 5
Sarea 0 0 16
Scedosporium 0 0 124
Schizothecium 0 77 172
Sclerotinia 0 169 159
Scutellospora 5 0 2
Scytalidium 0 75 86
Sistotrema 0 0 2558
Sphaerodes 0 3 9
Sporidiobolus 0 27 0
Sporobolomyces 0 33 73
Stachybotrys 0 104 130
Stilbum 0 0 14
Stromatonectria 0 7 6
Teratosphaeria 0 0 7
Tetracladium 0 1622 2856
Thielaviopsis 0 0 111
Tilletiopsis 0 4 17
Trichocladium 430 18253 2652
Trichoderma 2 101 95
Tricholoma 0 0 6
Trichosporon 0 2326 3244
Tubeufia 0 0 26
Udeniomyces 0 0 21
Uncultured Davidiella 68 0 0
Uncultured fungus 911 3590 3421
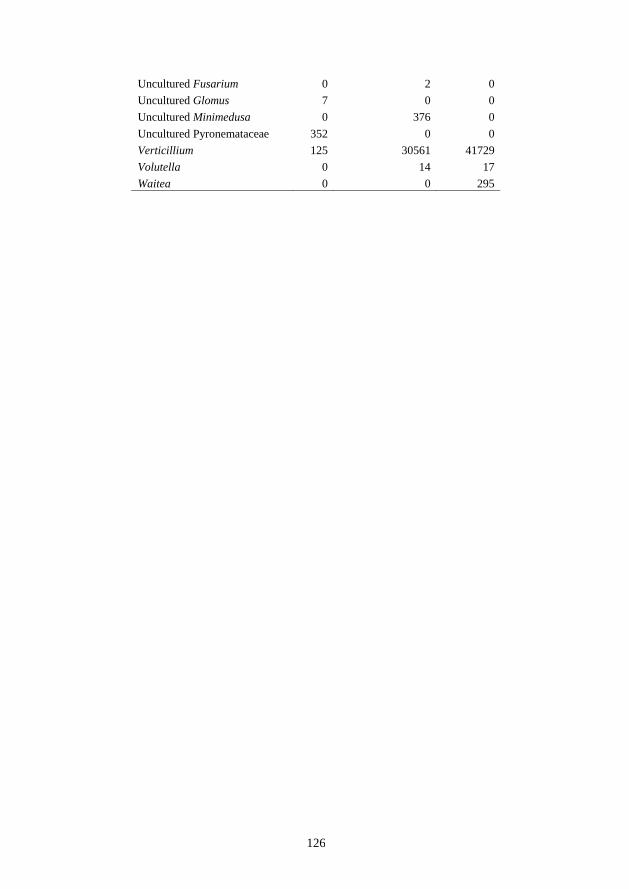
126
Uncultured Fusarium 0 2 0
Uncultured Glomus 7 0 0
Uncultured Minimedusa 0 376 0
Uncultured Pyronemataceae 352 0 0
Verticillium 125 30561 41729
Volutella 0 14 17
Waitea 0 0 295

127
5 General discussion
This work presents a comprehensive view of fungal communities in pea fields,
provides new information on the pea root rot complex, and improves the
understanding of the role of fungi in soil and root health by means of high throughput
next-generation pyrosequencing.
Pyrosequencing disclosed fungal communities in three different ecological
niches - roots, rhizosphere, and bulk soil. The high diversity of fungi in the examined
agricultural soils was comparable to results obtained by Sugiyama et al. (2010), who
studied soil fungal communities in organic and conventional potato farms. However,
many studies suggest that the diversity of soil fungi is higher in natural ecosystems
than in agroecosystems (Buée et al., 2009; Jumpponen et al., 2010).
Pea diseases are the result of the interaction among pathogen, host, and
environmental conditions conducive to disease development. In the examined pea
fields, different pathogens were found to be the possible causal agents of pea diseases.
Interestingly, the abundance of Phoma medicaginis var. pinodella strongly correlated
to the disease severity index of pea roots in 2008, while Fusarium oxysporum and
Aphanomyces euteiches were the possible pathogens of pea root rot in the fields in
2010. In general, previous studies of pea diseases usually focused on one or two
pathogens (Bødker et al., 1993; Gaulin et al., 2007), whereas in this project, the total
fungal communities, including a complex of fungi associated with root health were
revealed. Furthermore, some fungi were mainly associated with healthy roots, but
whether these non-pathogenic fungi play a role in root health as biocontrol agents,
remains to be investigated.
The study of fungal communities in roots, rhizosphere, and bulk soil revealed
that the fungal communities that could be identified in diseased roots as the probable
causes of diseases, could not be found in the rhizosphere and bulk soil. This indicates
that causal agents of pea diseases in the bulk soil may exist as resting structures
mainly. Generally, the distinct fungal communities in three different environments
might be due to the different complexity of nutrients from these ecological niches and
due to the role of root exudates in regulating fungal community composition and
diversity in the surrounding soil (Broeckling et al., 2008). The higher abundance of
AM fungi in healthy roots compared to diseased roots confirms the important roles of

128
AM fungi in relation to pea root health (Larsen & Bødker, 2001; Thygesen et al.,
2004) and the biocontrol potential of AM fungi against root pathogens (Whipps,
2004). In addition, a large number of AM fungi are shown to be suitable as bio-
indicators in agricultural soils (Oehl et al., 2011). Nevertheless, the low rate of AM
fungi in rhizosphere and bulk soil is in strong contrast to the findings that these fungi
often constitute a dominant portion of soil microbial biomass (Olsson et al., 1999;
Hogberg & Hogberg, 2002).
Fungal cultivation methods have often shown a high abundance of e.g.
Penicillium, Aspergillus, and Trichoderma in agricultural soils (Elmholt & Labouriau,
2005; Harman, 2006), but interestingly, these genera were very rare in the examined
soils. The reason for this is unknown, but these genera may be overestimated in
culturing methods, as they grow well on most substrata. Elmholt & Labouriau (2005)
reported that the Zygomycota genus Mortierella was dominant in Danish agricultural
soils, which is consistent with results obtained in the present study. As decomposers,
Mortierella are commonly encountered in soil or soil-borne organic substrates
(O'Donnell et al., 2001). Yeasts such as Cryptococcus aerius and Guehomyces
pollulans, were highly abundant in the soils. Yeasts are considered to be mainly
saprotrophs able to utilize plant debris or plant exudates, and some are known to be
plant growth promoters due to their phosphorus solubilizing abilities (Botha, 2011).
Considering the high abundance of yeasts in these soils, their functional traits should
be further explored in relation to plant nutrition and health.
The key factors determining soil microbial diversity are linked to the
complexity of the microbial interactions in soil (Garbeva et al., 2004). The potential
determinants of fungal community structure in the studied soils could be health status,
environment, location, and edaphic differences. Many factors including soil type,
plant type, and soil management regime (such as crop rotation, tillage, fertilizer,
compost, manure, or pesticide applications and irrigation) strongly affect the
microbial diversity of soil (reviewed by Garbeva et al., 2004). Among the factors
examined in the present study, location (fields) and environment (root, rhizosphere, or
bulk soil) were stronger determinants of fungal community structure than health status.
454 amplicon sequencing has been widely used for investigation of microbial
communities in different environmental samples, such as agricultural soil (Sugiyama
et al., 2010), forest soil (Buée et al., 2009b), Quercus phyllosphere (Jumpponen &
Jones, 2009), and indoor dust (Amend et al., 2010). Nevertheless, the accuracy and

129
quality of massively parallel DNA pyrosequencing can be compromised due to factors
such as DNA extraction and PCR bias, pyrosequencing errors (Huse et al., 2007) or
incorrect data analysis, which are challenging for the assessment of microbial
community. Pyrosequencing can be subject to errors during several steps. In the
present study, pyrosequencing errors were minimized by quality control and a series
of other subsequent analyzing procedures, such as generating sequence clusters at
97% sequence similarity (Tedersoo et al., 2010), excluding singletons due to the
possibility of sequencing artifacts (Tedersoo et al., 2010), and BLAST searches
against both GenBank database (Benson et al., 2011) and a custom-curated database
derived from the GenBank and UNITE (Kõljalg et al., 2005) databases. Different
studies have employed different approaches for sequence filtering and analysis.
Hibbett et al. (2011) surveyed 10 recent pyrosequencing studies of fungal
communities in various environments.
The fungal communities that were recovered from the examined fields were
dominated by Ascomycota and Basidiomycota, which was probably also influenced
by the choice of primers. This is in line with Buée et al. (2009b), who studied the
fungal communities using similar primers in forest soils. The ITS region has been
commonly used as a target for characterization of fungal communities due to the
variability even within species (Nilsson et al., 2008). Notwithstanding, Nilsson et al.
(2009a) suggested that the OTUs assignments using the two different sub-regions
(ITS1 or ITS2) may not always be consistent. Furthermore, some of the ITS primers
have been suggested to have amplification biases (Bellemain et al., 2010), thus
different primer combinations or different parts of the ITS region could be analyzed in
parallel.

130

131
6 Conclusions and further perspectives
In the present project, the repeatability of pyrosequencing was tested using
parallel DNA extractions and PCR experiments, and by studying the variation of read
abundances of the generated clusters. It was concluded that pooling of several
extractions and PCR amplicons will decrease variation across replicates, and thus
result in more reliable estimates of fungal abundances.
Soil fungal communities along a soil health gradient in nine pea field soils were
examined. The soil fungal community composition and diversity varied, and
particularly four fungal genera correlated with the disease severity index (DSI) of pea
roots. The study of fungal communities in root, rhizosphere, and bulk soils in relation
to diseased and healthy pea roots, revealed clear differences of fungal diversity and
community structures, and a strong correlation between the fungal communities in
roots and root health status. In general, pyrosequencing of fungal communities in pea
soils provided comprehensive knowledge of the dynamics of fungal communities and
their interaction with plant roots in relation to plant disease.
The present work focused on the dominant fungal species, but it would be
interesting also to further explore the less abundant fungi of the “rare biosphere”,
because the number of rare species of microorganisms is potentially enormous
(Pedros-Alio, 2007), however, this would require even deeper sequencing efforts. In
this study, several fungal species were identified that correlated negatively with the
DSI. Their potential role in biocontrol of plant pathogens could be further investigated
in bio-assays.
Although fungi and oomycetes are the most common causes, pea diseases can
also be caused by other microorganisms, such as bacteria, and nematodes (Kraft &
Pfleger, 2001). Thus, a parallel analysis of bacterial and nematode communities will
give important complementary information, since among other interactions, fungal
biocontrol processes in the soil by bacteria are well known (Pliego et al., 2011).
Furthermore, it will also be very informative to compare the diversity of the major
microbial taxa, i.e., fungi, bacteria, archaea, protozoa, and nematodes from soil
samples with different plant health status using a metagenomic approach. A
comprehensive survey will reveal different microbial groups resulting in a better
understanding of the soil microbial communities.

132
Combining measures of microbial structural diversity with functional traits
should be explored in relation to soil and root health in agricultural systems.
Pyrosequencing not only reveals “who‟s there” (richness), but also answers questions
such as “how many are there” (abundance) as well as “what are they doing there”
(function). Investigating functional diversity in agricultural soils will give a much
more detailed picture of the interactions among microorganisms, soil, and plants.
Functional metagenomics has the capability to probe genetic and biochemical
diversity in microbial communities. Moreover, gene-targeted metagenomics (Iwai et
al., 2011) would be employed to investigate specific ecological functional diversity,
such as biodegradation, production of bioactive secondary metabolites, and
pathogenesis. For instance, nitrogen fixing bacteria in soil could be examined,
because nitrogen is an important soil component, and nitrogen fixation is mediated by
diverse phylogenetic groups of prokaryotes.
Soil from pea fields was selected as an example of agricultural soils to examine
fungal communities in this project. Plant type is one of the main drivers of soil
microbial community structure, making it interesting to investigate the soil microbial
communities from soils grown with other plants, in particular the previously rotated
crops. Further, plants also have strong impacts on soil microbial communities in a
functional way, thus the effects of plants on microbial communities in soil,
particularly beneficial effects, are necessary to explore in the future.
Plants and microorganisms are interdependent for nutrient supply. Plants
provide rhizosphere microorganisms with a carbon source, while microorganisms
provide nitrogen and phosphorus, and also protect plants from pathogens (Singh et al.,
2004). The development of stable isotope probing (SIP) advances the studies of
linking community structure to functional activity (Radajewski et al., 2000; Dumont
& Murrell, 2005). The combinations of SIP-microarray and SIP-metagenomics offer
more insights into the plant-microbe interactions. The SIP-microarray would be
applied to identify microbes utilizing plant carbon exudates and to estimate the
microbial gene expression in the rhizosphere. The SIP-metagenomics approach
involves pyrosequencing 13
C-labelled DNA from microorganisms in the soil,
therefore, the structure-functional relationship of rhizosphere microbes will be
determined.
In conclusion, most previous studies on plant diseases have focused on single or
few pathogens, however, the advent of high throughput pyrosequencing is very

133
promising for microbial community analysis and has enabled detailed studies of
overall fungal communities, which will lead to a new understanding of plant
pathology and give a much more detailed picture of the interactions between
microorganisms and plants.

134

135
References
Alabouvette C, Lemanceau P, Steinberg C. 1993. Recent advances in the biological control
of Fusarium wilts. Pesticide Science 37: 365-373.
Alabouvette C, Olivain C, Migheli Q, Steinberg C. 2009. Microbiological control of soil-
borne phytopathogenic fungi with special emphasis on wilt-inducing Fusarium
oxysporum. New Phytologist 184: 529-544.
Allard C, Bill L, Touraud G. 1993. L'anthracnose du pois: revue bibliographique et synthèse.
Agronomie 13: 5-24.
Allmaras RR, Fritz VA, Pfleger FL, Copeland SM. 2003. Impaired internal drainage and
Aphanomyces euteiches root rot of pea caused by soil compaction in a fine-textured soil.
Soil & Tillage Research 70: 41-52.
Altschul SF, Madden TL, Schaffer AA, Zhang JH, Zhang Z, Miller W, Lipman DJ. 1997. Gapped BLAST and PSI-BLAST: a new generation of protein database search programs.
Nucleic Acids Research 25: 3389-3402.
Amend AS, Seifert KA, Bruns TD. 2010a. Quantifying microbial communities with 454
pyrosequencing: does read abundance count? Molecular Ecology 19: 5555-5565.
Amend AS, Seifert KA, Samson R, Bruns TD. 2010b. Indoor fungal composition is
geographically patterned and more diverse in temperate zones than in the tropics.
Proceedings of the National Academy of Sciences of the United States of America 107:
13748-13753.
Anderson IC, Campbell CD, Prosser JI. 2003. Potential bias of fungal 18S rDNA and
internal transcribed spacer polymerase chain reaction primers for estimating fungal
biodiversity in soil. Environmental Microbiology 5: 36-47.
Andries K, Verhasselt P, Guillemont J, Gohlmann HWH, Neefs JM, Winkler H, Van
Gestel J, Timmerman P, Zhu M, Lee E, Williams P, de Chaffoy D, Huitric E,
Hoffner S, Cambau E, Truffot-Pernot C, Lounis N, Jarlier V. 2005. A
diarylquinoline drug active on the ATP synthase of Mycobacterium tuberculosis. Science
307: 223-227.
Andrivon D. 1994. Dynamics of the survival and infectivity to potato-tubers of sporangia of
Phytophthora infestans in three different soils. Soil Biology & Biochemistry 26: 945-952.
Arias ME, Gonzalez-Perez JA, Gonzalez-Vila FJ, Ball AS. 2005. Soil health - a new
challenge for microbiologists and chemists. International Microbiology 8: 13-21.
Ashelford KE, Chuzhanova NA, Fry JC, Jones AJ, Weightman AJ. 2006. New screening
software shows that most recent large 16S rRNA gene clone libraries contain chimeras.
Applied and Environmental Microbiology 72: 5734-5741.
Atlas RM, Bartha R. 1998. Microbial ecology: fundamentals and applications, 4th edn.(pp.
694). In: Benjamin Cummings, Menlo Park, California.
Avis PG, Branco S, Tang Y, Mueller GM. 2010. Pooled samples bias fungal community
descriptions. Molecular Ecology Resources 10: 135-141.
Bailey KL, Gossen BD, Lafond GR, Watson PR, Derksen DA. 2001. Effect of tillage and
crop rotation on root and foliar diseases of wheat and pea in Saskatchewan from 1991 to
1998: univariate and multivariate analyses. Canadian Journal of Plant Science 81: 789-
803.
Baker KF. 1987. Evolving concepts of biological control of plant pathogens. Annual Review
of Phytopathology 25: 67-85.
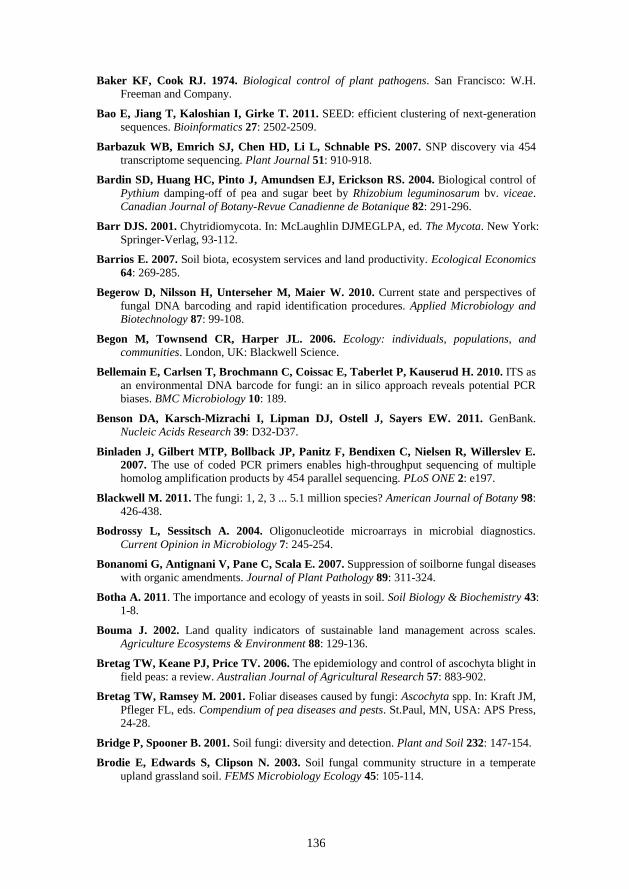
136
Baker KF, Cook RJ. 1974. Biological control of plant pathogens. San Francisco: W.H.
Freeman and Company.
Bao E, Jiang T, Kaloshian I, Girke T. 2011. SEED: efficient clustering of next-generation
sequences. Bioinformatics 27: 2502-2509.
Barbazuk WB, Emrich SJ, Chen HD, Li L, Schnable PS. 2007. SNP discovery via 454
transcriptome sequencing. Plant Journal 51: 910-918.
Bardin SD, Huang HC, Pinto J, Amundsen EJ, Erickson RS. 2004. Biological control of
Pythium damping-off of pea and sugar beet by Rhizobium leguminosarum bv. viceae.
Canadian Journal of Botany-Revue Canadienne de Botanique 82: 291-296.
Barr DJS. 2001. Chytridiomycota. In: McLaughlin DJMEGLPA, ed. The Mycota. New York:
Springer-Verlag, 93-112.
Barrios E. 2007. Soil biota, ecosystem services and land productivity. Ecological Economics
64: 269-285.
Begerow D, Nilsson H, Unterseher M, Maier W. 2010. Current state and perspectives of
fungal DNA barcoding and rapid identification procedures. Applied Microbiology and
Biotechnology 87: 99-108.
Begon M, Townsend CR, Harper JL. 2006. Ecology: individuals, populations, and
communities. London, UK: Blackwell Science.
Bellemain E, Carlsen T, Brochmann C, Coissac E, Taberlet P, Kauserud H. 2010. ITS as
an environmental DNA barcode for fungi: an in silico approach reveals potential PCR
biases. BMC Microbiology 10: 189.
Benson DA, Karsch-Mizrachi I, Lipman DJ, Ostell J, Sayers EW. 2011. GenBank.
Nucleic Acids Research 39: D32-D37.
Binladen J, Gilbert MTP, Bollback JP, Panitz F, Bendixen C, Nielsen R, Willerslev E. 2007. The use of coded PCR primers enables high-throughput sequencing of multiple
homolog amplification products by 454 parallel sequencing. PLoS ONE 2: e197.
Blackwell M. 2011. The fungi: 1, 2, 3 ... 5.1 million species? American Journal of Botany 98:
426-438.
Bodrossy L, Sessitsch A. 2004. Oligonucleotide microarrays in microbial diagnostics.
Current Opinion in Microbiology 7: 245-254.
Bonanomi G, Antignani V, Pane C, Scala E. 2007. Suppression of soilborne fungal diseases
with organic amendments. Journal of Plant Pathology 89: 311-324.
Botha A. 2011. The importance and ecology of yeasts in soil. Soil Biology & Biochemistry 43:
1-8.
Bouma J. 2002. Land quality indicators of sustainable land management across scales.
Agriculture Ecosystems & Environment 88: 129-136.
Bretag TW, Keane PJ, Price TV. 2006. The epidemiology and control of ascochyta blight in
field peas: a review. Australian Journal of Agricultural Research 57: 883-902.
Bretag TW, Ramsey M. 2001. Foliar diseases caused by fungi: Ascochyta spp. In: Kraft JM,
Pfleger FL, eds. Compendium of pea diseases and pests. St.Paul, MN, USA: APS Press,
24-28.
Bridge P, Spooner B. 2001. Soil fungi: diversity and detection. Plant and Soil 232: 147-154.
Brodie E, Edwards S, Clipson N. 2003. Soil fungal community structure in a temperate
upland grassland soil. FEMS Microbiology Ecology 45: 105-114.

137
Broeckling CD, Broz AK, Bergelson J, Manter DK, Vivanco JM. 2008. Root exudates
regulate soil fungal community composition and diversty. Applied and Environmental
Microbiology 74: 738-744.
Bruns TD. 2001. ITS reality. Inoculum 52: 2-3.
Buchan A, Newell SY, Butler M, Biers EJ, Hollibaugh JT, Moran MA. 2003. Dynamics
of bacterial and fungal communities on decaying salt marsh grass. Applied and
Environmental Microbiology 69: 6676-6687.
Butler JL, Williams MA, Bottomley PJ, Myrold DD. 2003. Microbial community
dynamics associated with rhizosphere carbon flow. Applied and Environmental
Microbiology 69: 6793-6800.
Buyer JS, Roberts DP, Millner P, Russek-Cohen E. 2001. Analysis of fungal communities
by sole carbon source utilization profiles. Journal of Microbiological Methods 45: 53-60.
Buée M, De Boer W, Martin F, van Overbeek L, Jurkevitch E. 2009a. The rhizosphere
zoo: an overview of plant-associated communities of microorganisms, including phages,
bacteria, archaea, and fungi, and of some of their structuring factors. Plant and Soil 321:
189-212.
Buée M, Reich M, Murat C, Morin E, Nilsson RH, Uroz S, Martin F. 2009b. 454
Pyrosequencing analyses of forest soils reveal an unexpectedly high fungal diversity.
New Phytologist 184: 449-456.
Bødker L, Kjøller R, Kristensen K, Rosendahl S. 2002. Interactions between indigenous
arbuscular mycorrhizal fungi and Aphanomyces euteiches in field-grown pea.
Mycorrhiza 12: 7-12.
Bødker L, Leroul N, Smedegaardpetersen V. 1993a. Influence of pea cropping history on
disease severity and yield depression. Plant Disease 77: 896-900.
Bødker L, Leroul N, Smedegaardpetersen V. 1993b. The occurrence in Denmark of black
root rot of pea caused by Thielaviopsis basicola. Plant Pathology 42: 820-823.
Bååth E. 2003. The use of neutral lipid fatty acids to indicate the physiological conditions of
soil fungi. Microbial Ecology 45: 373-383.
Caporaso JG, Bittinger K, Bushman FD, DeSantis TZ, Andersen GL, Knight R. 2010a. PyNAST: a flexible tool for aligning sequences to a template alignment. Bioinformatics
26: 266-267.
Caporaso JG, Kuczynski J, Stombaugh J, Bittinger K, Bushman FD, Costello EK,
Fierer N, Pena AG, Goodrich JK, Gordon JI, Huttley GA, Kelley ST, Knights D,
Koenig JE, Ley RE, Lozupone CA, McDonald D, Muegge BD, Pirrung M, Reeder J,
Sevinsky JR, Tumbaugh PJ, Walters WA, Widmann J, Yatsunenko T, Zaneveld J,
Knight R. 2010b. QIIME allows analysis of high-throughput community sequencing
data. Nature Methods 7: 335-336.
Carruthers FL, Conner AJ, Mahanty HK. 1994. Identification of a genetic-locus in
Pseudomonas aureofaciens involved in fungal inhibition. Applied and Environmental
Microbiology 60: 71-77.
Chao A, Chazdon RL, Colwell RK, Shen TJ. 2005. A new statistical approach for assessing
similarity of species composition with incidence and abundance data. Ecology Letters 8:
148-159.
Chou HH, Holmes MH. 2001. DNA sequence quality trimming and vector removal.
Bioinformatics 17: 1093-1104.
Clarke KR, Warwick RM. 2001. Changes in marine communities: an approach to statistical
analysis and interpretation. 2nd
edition. PRIMER-E, Plymouth.

138
Classen AT, Boyle SI, Haskins KE, Overby ST, Hart SC. 2003. Community-level
physiological profiles of bacteria and fungi: plate type and incubation temperature
influences on contrasting soils. FEMS Microbiology Ecology 44: 319-328.
Colwell RK, Coddington JA. 1994. Estimating terrestrial biodiversity through extrapolation.
Philosophical Transactions of the Royal Society of London Series B-Biological Sciences
345: 101-118.
Cunniffe NJ, Gilligan CA. 2011. A theoretical framework for biological control of soil-
borne plant pathogens: identifying effective strategies. Journal of Theoretical Biology
278: 32-43.
Curl EA, Truelove B. 1986. The rhizosphere. New York: Springer.
De Boer W, Folman LB, Summerbell RC, Boddy L. 2005. Living in a fungal world: impact
of fungi on soil bacterial niche development. FEMS Microbiology Reviews 29: 795-811.
DeSantis TZ, Hugenholtz P, Keller K, Brodie EL, Larsen N, Piceno YM, Phan R,
Andersen GL. 2006a. NAST: a multiple sequence alignment server for comparative
analysis of 16S rRNA genes. Nucleic Acids Research 34: W394-W399.
DeSantis TZ, Hugenholtz P, Larsen N, Rojas M, Brodie EL, Keller K, Huber T, Dalevi
D, Hu P, Andersen GL. 2006b. Greengenes, a chimera-checked 16S rRNA gene
database and workbench compatible with ARB. Applied and Environmental
Microbiology 72: 5069-5072.
Dick MW, Vick MC, Gibbings JG, Hedderson TA, Lastra CCL. 1999. 18S rDNA for
species of Leptolegnia and other Peronosporomycetes: justification for the subclass taxa
Saprolegniomycetidae and Peronosporomycetidae and division of the Saprolegniaceae
sensu lato into the Leptolegniaceae and Saprolegniaceae. Mycological Research 103:
1119-1125.
Dobranic JK, Zak JC. 1999. A microtiter plate procedure for evaluating fungal functional
diversity. Mycologia 91: 756-765.
Dondoshansky I. 2002. BLASTclust (NCBI Software Development Toolkit). NCBI,
Bethesda, Md.
Doran JW, Sarrantonio M, Liebig MA. 1996. Soil health and sustainability. Advances in
Agronomy 56: 1-54.
Doran JW, Zeiss MR. 2000. Soil health and sustainability: managing the biotic component
of soil quality. Applied Soil Ecology 15: 3-11.
Dumont MG, Murrell JC. 2005. Stable isotope probing - linking microbial identity to
function. Nature Reviews Microbiology 3: 499-504.
Edgar RC. 2004. MUSCLE: multiple sequence alignment with high accuracy and high
throughput. Nucleic Acids Research 32: 1792-1797.
Edgar RC. 2010. Search and clustering orders of magnitude faster than BLAST.
Bioinformatics 26: 2460-2461.
Edwards RA, Rodriguez-Brito B, Wegley L, Haynes M, Breitbart M, Peterson DM, Saar
MO, Alexander S, Alexander EC, Rohwer F. 2006. Using pyrosequencing to shed
light on deep mine microbial ecology. BMC Genomics 7: 57.
Elmholt S, Labouriau R. 2005. Fungi in Danish soils under organic and conventional
farming. Agriculture Ecosystems & Environment 107: 65-73.

139
Falgueras J, Lara AJ, Fernandez-Pozo N, Canton FR, Perez-Trabado G, Claros MG. 2010. SeqTrim: a high-throughput pipeline for pre-processing any type of sequence read.
BMC Bioinformatics 11: 38.
Feinstein LM, Sul WJ, Blackwood CB. 2009. Assessment of bias associated with
incomplete extraction of microbial DNA from soil. Applied and Environmental
Microbiology 75: 5428-5433.
Fitt BDL, Huang YJ, van den Bosch F, West JS. 2006. Coexistence of related pathogen
species on arable crops in space and time. Annual Review of Phytopathology 44:
163-182.
Franssen SU, Shrestha RP, Brautigam A, Bornberg-Bauer E, Weber APM. 2011. Comprehensive transcriptome analysis of the highly complex Pisum sativum genome
using next generation sequencing. BMC Genomics 12: 227.
Fritz VA, Allmaras RR, Pfleger FL, Davis DW. 1995. Oat residue and soil compaction
influences on common root-rot (Aphanomyces euteiches) of peas in a fine-textured soil.
Plant and Soil 171: 235-244.
Frostegård, Tunlid A, Bååth E. 2011. Use and misuse of PLFA measurements in soils. Soil
Biology & Biochemistry 43: 1621-1625.
Garbeva P, van Veen JA, van Elsas JD. 2004. Microbial diversity in soil: selection of
microbial populations by plant and soil type and implications for disease suppressiveness.
Annual Review of Phytopathology 42: 243-270.
Gardes M, Bruns TD. 1993. ITS primers with enhanced specificity for Basidiomycetes -
application to the identification of mycorrhizae and rusts. Molecular Ecology 2: 113-118.
Gardes M, White TJ, Fortin JA, Bruns TD, Taylor JW. 1991. Identification of indigenous
and introduced symbiotic fungi in ectomycorrhizae by amplification of nuclear and
mitochondrial ribosomal DNA. Canadian Journal of Botany-Revue Canadienne de
Botanique 69: 180-190.
Garland JL, Mills AL. 1991. Classification and characterization of heterotrophic microbial
communities on the basis of patterns of community-level sole-carbon-source utilization.
Applied and Environmental Microbiology 57: 2351-2359.
Garrett SD. 1950. Ecology of the root inhabiting fungi. Biological Reviews of the Cambridge
Philosophical Society 25: 220-254.
Gaulin E, Jacquet C, Bottin A, Dumas B. 2007. Root rot disease of legumes caused by
Aphanomyces euteiches. Molecular Plant Pathology 8: 539-548.
Gelsomino A, Keijzer-Wolters AC, Cacco G, van Elsas JD. 1999. Assessment of bacterial
community structure in soil by polymerase chain reaction and denaturing gradient gel
electrophoresis. Journal of Microbiological Methods 38: 1-15.
Gianinazzi S, Gollotte A, Binet MN, van Tuinen D, Redecker D, Wipf D. 2010. Agroecology: the key role of arbuscular mycorrhizas in ecosystem services. Mycorrhiza
20: 519-530.
Gillevet PM, Sikaroodi M, Torzilli AP. 2009. Analyzing salt-marsh fungal diversity:
comparing ARISA fingerprinting with clone sequencing and pyrosequencing. Fungal
Ecology 2: 160-167.
Girvan MS, Bullimore J, Pretty JN, Osborn AM, Ball AS. 2003. Soil type is the primary
determinant of the composition of the total and active bacterial communities in arable
soils. Applied and Environmental Microbiology 69: 1800-1809.
Godfray HCJ, Lawton JH. 2001. Scale and species numbers. Trends in Ecology &
Evolution 16: 400-404.
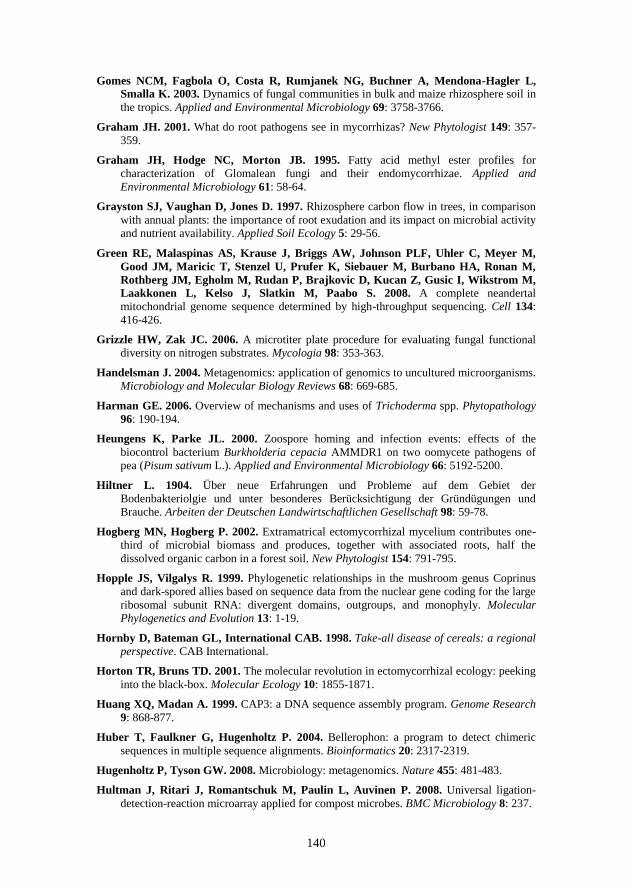
140
Gomes NCM, Fagbola O, Costa R, Rumjanek NG, Buchner A, Mendona-Hagler L,
Smalla K. 2003. Dynamics of fungal communities in bulk and maize rhizosphere soil in
the tropics. Applied and Environmental Microbiology 69: 3758-3766.
Graham JH. 2001. What do root pathogens see in mycorrhizas? New Phytologist 149: 357-
359.
Graham JH, Hodge NC, Morton JB. 1995. Fatty acid methyl ester profiles for
characterization of Glomalean fungi and their endomycorrhizae. Applied and
Environmental Microbiology 61: 58-64.
Grayston SJ, Vaughan D, Jones D. 1997. Rhizosphere carbon flow in trees, in comparison
with annual plants: the importance of root exudation and its impact on microbial activity
and nutrient availability. Applied Soil Ecology 5: 29-56.
Green RE, Malaspinas AS, Krause J, Briggs AW, Johnson PLF, Uhler C, Meyer M,
Good JM, Maricic T, Stenzel U, Prufer K, Siebauer M, Burbano HA, Ronan M,
Rothberg JM, Egholm M, Rudan P, Brajkovic D, Kucan Z, Gusic I, Wikstrom M,
Laakkonen L, Kelso J, Slatkin M, Paabo S. 2008. A complete neandertal
mitochondrial genome sequence determined by high-throughput sequencing. Cell 134:
416-426.
Grizzle HW, Zak JC. 2006. A microtiter plate procedure for evaluating fungal functional
diversity on nitrogen substrates. Mycologia 98: 353-363.
Handelsman J. 2004. Metagenomics: application of genomics to uncultured microorganisms.
Microbiology and Molecular Biology Reviews 68: 669-685.
Harman GE. 2006. Overview of mechanisms and uses of Trichoderma spp. Phytopathology
96: 190-194.
Heungens K, Parke JL. 2000. Zoospore homing and infection events: effects of the
biocontrol bacterium Burkholderia cepacia AMMDR1 on two oomycete pathogens of
pea (Pisum sativum L.). Applied and Environmental Microbiology 66: 5192-5200.
Hiltner L. 1904. Über neue Erfahrungen und Probleme auf dem Gebiet der
Bodenbakteriolgie und unter besonderes Berücksichtigung der Gründügungen und
Brauche. Arbeiten der Deutschen Landwirtschaftlichen Gesellschaft 98: 59-78.
Hogberg MN, Hogberg P. 2002. Extramatrical ectomycorrhizal mycelium contributes one-
third of microbial biomass and produces, together with associated roots, half the
dissolved organic carbon in a forest soil. New Phytologist 154: 791-795.
Hopple JS, Vilgalys R. 1999. Phylogenetic relationships in the mushroom genus Coprinus
and dark-spored allies based on sequence data from the nuclear gene coding for the large
ribosomal subunit RNA: divergent domains, outgroups, and monophyly. Molecular
Phylogenetics and Evolution 13: 1-19.
Hornby D, Bateman GL, International CAB. 1998. Take-all disease of cereals: a regional
perspective. CAB International.
Horton TR, Bruns TD. 2001. The molecular revolution in ectomycorrhizal ecology: peeking
into the black-box. Molecular Ecology 10: 1855-1871.
Huang XQ, Madan A. 1999. CAP3: a DNA sequence assembly program. Genome Research
9: 868-877.
Huber T, Faulkner G, Hugenholtz P. 2004. Bellerophon: a program to detect chimeric
sequences in multiple sequence alignments. Bioinformatics 20: 2317-2319.
Hugenholtz P, Tyson GW. 2008. Microbiology: metagenomics. Nature 455: 481-483.
Hultman J, Ritari J, Romantschuk M, Paulin L, Auvinen P. 2008. Universal ligation-
detection-reaction microarray applied for compost microbes. BMC Microbiology 8: 237.

141
Huse SM, Huber JA, Morrison HG, Sogin ML, Mark Welch D. 2007. Accuracy and
quality of massively parallel DNA pyrosequencing. Genome Biology 8: R143.
Huse SM, Welch DM, Morrison HG, Sogin ML. 2010. Ironing out the wrinkles in the rare
biosphere through improved OTU clustering. Environmental Microbiology 12: 1889-
1898.
Ibekwe AM, Kennedy AC. 1998. Phospholipid fatty acid profiles and carbon utilization
patterns for analysis of microbial community structure under field and greenhouse
conditions. FEMS Microbiology Ecology 26: 151-163.
Iwai S, Chai B, Jesus EC, Penton CR, Lee TK, Cole JR, Tiedje JM. 2011. Gene-targeted
metagenomics (GT Metagenomics) to explore the extensive diversity of genes of interest
in microbial communities. In: de Bruijn FJ, ed. Handbook of molecular microbial
ecology I: metagenomics and complementary approaches. Hoboken, New Jersey, USA:
John Wiley & Sons. Inc., 235-243.
James TY, Letcher PM, Longcore JE, Mozley-Standridge SE, Porter D, Powell MJ,
Griffith GW, Vilgalys R. 2006. A molecular phylogeny of the flagellated fungi
(Chytridiomycota) and description of a new phylum (Blastocladiomycota). Mycologia 98:
860-871.
Janvier C, Villeneuve F, Alabouvette C, Edel-Hermann V, Mateille T, Steinberg C. 2007. Soil health through soil disease suppression: which strategy from descriptors to
indicators? Soil Biology & Biochemistry 39: 1-23.
Jeffries P, Gianinazzi S, Perotto S, Turnau K, Barea JM. 2003. The contribution of
arbuscular mycorrhizal fungi in sustainable maintenance of plant health and soil fertility.
Biology and Fertility of Soils 37: 1-16.
Johnson NC, Gehring CA. 2007. Mycorrhizas: symbiotic mediators of rhizosphere and
ecosystem processes. In: Cardon Z, Whitbeck J, eds. The rhizosphere: an ecological
perspective. London, UK: Academic Press.
Jumpponen A, Jones KL. 2009. Massively parallel 454 sequencing indicates hyperdiverse
fungal communities in temperate Quercus macrocarpa phyllosphere. New Phytologist
184: 438-448.
Jumpponen A, Jones KL, Blair J. 2010. Vertical distribution of fungal communities in
tallgrass prairie soil. Mycologia 102: 1027-1041.
Karlen DL, Mausbach MJ, Doran JW, Cline RG, Harris RF, Schuman GE. 1997. Soil
quality: a concept, definition, and framework for evaluation. Soil Science Society of
America Journal 61: 4-10.
Katoh K, Misawa K, Kuma K, Miyata T. 2002. MAFFT: a novel method for rapid multiple
sequence alignment based on fast Fourier transform. Nucleic Acids Research 30: 3059-
3066.
Kircher M, Kelso J. 2010. High-throughput DNA sequencing - concepts and limitations.
Bioessays 32: 524-536.
Kirk JL, Beaudette LA, Hart M, Moutoglis P, Khironomos JN, Lee H, Trevors JT. 2004. Methods of studying soil microbial diversity. Journal of Microbiological Methods 58:
169-188.
Kjøller A, Struwe S. 1992. Functional groups of microfungi in decomposition. In: Carroll
GC, Wicklow DT, eds. The fungal community: its organisation and role in the ecosystem.
New York: Marcel Dekker, 619-630.
Kjøller R, Rosendahl S. 2000. Detection of arbuscular mycorrhizal fungi (Glomales) in roots
by nested PCR and SSCP (Single Stranded Conformation Polymorphism). Plant and Soil
226: 189-196.

142
Kock JLF, Botha A. 1998. Fatty acids in fungal taxonomy. Chemical fungal taxonomy 219.
Korbel JO, Urban AE, Affourtit JP, Godwin B, Grubert F, Simons JF, Kim PM, Palejev
D, Carriero NJ, Du L, Taillon BE, Chen ZT, Tanzer A, Saunders ACE, Chi JX,
Yang FT, Carter NP, Hurles ME, Weissman SM, Harkins TT, Gerstein MB,
Egholm M, Snyder M. 2007. Paired-end mapping reveals extensive structural variation
in the human genome. Science 318: 420-426.
Kraft JM. 1994. Fusarium wilt of peas (a review). Agronomie 14: 561-567.
Kraft JM, Papavizas GC. 1983. Use of host resistance, Trichoderma, and fungicides to
control soilborne diseases and increase seed yields of peas. Plant Disease 67: 1234-1237.
Kraft JM, Pfleger FL. 2001. Compendium of pea diseases and pests. St. Paul, MN:
American Phytopathological Society (APS Press).
Kumar S, Carlsen T, Mevik BH, Enger P, Blaalid R, Shalchian-Tabrizi K, Kauserud H. 2011. CLOTU: an online pipeline for processing and clustering of 454 amplicon reads
into OTUs followed by taxonomic annotation. BMC Bioinformatics 12: 182.
Kunin V, Engelbrektson A, Ochman H, Hugenholtz P. 2010. Wrinkles in the rare
biosphere: pyrosequencing errors can lead to artificial inflation of diversity estimates.
Environmental Microbiology 12: 118-123.
Kõljalg U, Larsson KH, Abarenkov K, Nilsson RH, Alexander IJ, Eberhardt U, Erland
S, Høiland K, Kjøller R, Larsson E, Pennanen T, Sen R, Taylor AFS, Tedersoo L,
Vrålstad T, Ursing BM. 2005. UNITE: a database providing web-based methods for
the molecular identification of ectomycorrhizal fungi. New Phytologist 166: 1063-1068.
Lambers H, Mougel C, Jaillard B, Hinsinger P. 2009. Plant-microbe-soil interactions in the
rhizosphere: an evolutionary perspective. Plant and Soil 321: 83-115.
Lande R. 1996. Statistics and partitioning of species diversity, and similarity among multiple
communities. Oikos 76: 5-13.
Larena I, Salazar O, Gonzalez V, Julian MC, Rubio V. 1999. Design of a primer for
ribosomal DNA internal transcribed spacer with enhanced specificity for ascomycetes.
Journal of Biotechnology 75: 187-194.
Larkin MA, Blackshields G, Brown NP, Chenna R, McGettigan PA, McWilliam H,
Valentin F, Wallace IM, Wilm A, Lopez R. 2007. Clustal W and Clustal X version 2.0.
Bioinformatics 23: 2947.
Larsen J, Bødker L. 2001. Interactions between pea root-inhabiting fungi examined using
signature fatty acids. New Phytologist 149: 487-493.
Larsen J, Olsson PA, Jakobsen I. 1998. The use of fatty acid signatures to study mycelial
interactions between the arbuscular mycorrhizal fungus Glomus intraradices and the
saprotrophic fungus Fusarium culmorum in root-free soil. Mycological Research 102:
1491-1496.
Lauber CL, Hamady M, Knight R, Fierer N. 2009. Pyrosequencing-based assessment of
soil pH as a predictor of soil bacterial community structure at the continental scale.
Applied and Environmental Microbiology 75: 5111-5120.
Le May C, Potage G, Andrivon D, Tivoli B, Outreman Y. 2009. Plant disease complex:
antagonism and synergism between pathogens of the Ascochyta blight complex on pea.
Journal of Phytopathology 157: 715-721.
Lee DH, Zo YG, Kim SJ. 1996. Nonradioactive method to study genetic profiles of natural
bacterial communities by PCR-single-strand-conformation polymorphism. Applied and
Environmental Microbiology 62: 3112-3120.

143
Levenfors JP, Wikstrom M, Persson L, Gerhardson B. 2003. Pathogenicity of
Aphanomyces spp. from different leguminous crops in Sweden. European Journal of
Plant Pathology 109: 535-543.
Lichtenzveig J, Anderson JP, Thomas G, Oliver R, Singh K. 2006. Inoculation and growth
with soil borne pathogenic fungi. In: Mathesius U, Journet EP, Summer LW, eds. The
Medicago truncatula handbook. The Samuel Roberts Noble Foundation, Ardmore, OK,
http://www.noble.org/MedicagoHandbook/pdf/InoculationGrowthSoilPathogenic.pdf.
Lievens B, Brouwer M, Vanachter ACRC, Levesque CA, Cammue BPA, Thomma
BPHJ. 2003. Design and development of a DNA array for rapid detection and
identification of multiple tomato vascular wilt pathogens. FEMS Microbiology Letters
223: 113-122.
Lim YW, Kim BK, Kim C, Jung HS, Kim BS, Lee JH, Chun J. 2010. Assessment of soil
fungal communities using pyrosequencing. Journal of Microbiology 48: 284-289.
Lin Q, Brookes PC. 1999. An evaluation of the substrate-induced respiration method. Soil
Biology & Biochemistry 31: 1969-1983.
Linderman RG. 1988. Mycorrhizal interactions with the rhizosphere microflora - the
mycorrhizosphere effect. Phytopathology 78: 366-371.
Liu WT, Marsh TL, Cheng H, Forney LJ. 1997. Characterization of microbial diversity by
determining terminal restriction fragment length polymorphisms of genes encoding 16S
rRNA. Applied and Environmental Microbiology 63: 4516-4522.
Loreau M. 2000. Are communities saturated? On the relationship between alpha, beta and
gamma diversity. Ecology Letters 3: 73-76.
Lozupone C, Knight R. 2005. UniFrac: a new phylogenetic method for comparing microbial
communities. Applied and Environmental Microbiology 71: 8228-8235.
Lucas GB. 1958. Diseases of Tobacco. Raleigh, NC, USA: Biological Consulting Associates.
Lumini E, Orgiazzi A, Borriello R, Bonfante P, Bianciotto V. 2010. Disclosing arbuscular
mycorrhizal fungal biodiversity in soil through a land-use gradient using a
pyrosequencing approach. Environmental Microbiology 12: 2165-2179.
Lumsden RD, Lewis JA, Millner PD. 1983. Effect of composted sewage-sludge on several
soilborne pathogens and diseases. Phytopathology 73: 1543-1548.
Lupwayi NZ, Kennedy AC. 2007. Grain legumes in northern Great Plains: impacts on
selected biological soil processes. Agronomy Journal 99: 1700-1709.
Magurran AE. 1988. Ecological diversity and its measurement. London: Croom Helm
Limited.
Maidak BL, Cole JR, Lilburn TG, Parker CT, Saxman PR, Farris RJ, Garrity GM,
Olsen GJ, Schmidt TM, Tiedje JM. 2001. The RDP-II (Ribosomal Database Project).
Nucleic Acids Research 29: 173-174.
Manici LM, Caputo F. 2009. Fungal community diversity and soil health in intensive potato
cropping systems of the east Po valley, northern Italy. Annals of Applied Biology 155:
245-258.
Margulies M, Egholm M, Altman WE, Attiya S, Bader JS, Bemben LA, Berka J,
Braverman MS, Chen YJ, Chen ZT, Dewell SB, Du L, Fierro JM, Gomes XV,
Godwin BC, He W, Helgesen S, Ho CH, Irzyk GP, Jando SC, Alenquer MLI, Jarvie
TP, Jirage KB, Kim JB, Knight JR, Lanza JR, Leamon JH, Lefkowitz SM, Lei M,
Li J, Lohman KL, Lu H, Makhijani VB, Mcdade KE, McKenna MP, Myers EW,
Nickerson E, Nobile JR, Plant R, Puc BP, Ronan MT, Roth GT, Sarkis GJ, Simons
JF, Simpson JW, Srinivasan M, Tartaro KR, Tomasz A, Vogt KA, Volkmer GA,

144
Wang SH, Wang Y, Weiner MP, Yu PG, Begley RF, Rothberg JM. 2005. Genome
sequencing in microfabricated high-density picolitre reactors. Nature 437: 376-380.
Martin FN, Hancock JG. 1986. Association of chemical and biological factors in soils
suppressive to Pythium ultimum. Phytopathology 76: 1221-1231.
Martin FN, Loper JE. 1999. Soilborne plant diseases caused by Pythium spp: ecology,
epidemiology, and prospects for biological control. Critical Reviews in Plant Sciences
18: 111-181.
Martin KJ, Rygiewicz PT. 2005. Fungal-specific PCR primers developed for analysis of the
ITS region of environmental DNA extracts. BMC Microbiology 5: 28.
McCune B, Mefford MJ. 1999. PC-ORD: multivariate analysis of ecological data; Version
4 for Windows; [User's Guide]. MjM Software Design.
McDonald GK, Peck D. 2009. Effects of crop rotation, residue retention and sowing time on
the incidence and survival of ascochyta blight and its effect on grain yield of field peas
(Pisum sativum L.). Field Crops Research 111: 11-21.
Metzker ML. 2010. Applications of next-generation sequencing - sequencing technologies -
the next generation. Nature Reviews Genetics 11: 31-46.
Meyerhans A, Vartanian JP, Wainhobson S. 1990. DNA recombination during PCR.
Nucleic Acids Research 18: 1687-1691.
Mitchell JI, Zuccaro A. 2006. Sequences, the environment and fungi. Mycologist 20: 62-74.
Muller MM, Kantola R, Kitunen V. 1994. Combining sterol and fatty acid profiles for the
characterization of fungi. Mycological Research 98: 593-603.
Muyzer G. 1999. DGGE/TGGE a method for identifying genes from natural ecosystems.
Current Opinion in Microbiology 2: 317-322.
Muyzer G, Dewaal EC, Uitterlinden AG. 1993. Profiling of complex microbial populations
by denaturing gradient gel electrophoresis analysis of polymerase chain reaction-
amplified genes coding for 16S ribosomal RNA. Applied and Environmental
Microbiology 59: 695-700.
Niemi RM, Heiskanen I, Wallenius K, Lindstrom K. 2001. Extraction and purification of
DNA in rhizosphere soil samples for PCR-DGGE analysis of bacterial consortia. Journal
of Microbiological Methods 45: 155-165.
Nilsson RH, Kristiansson E, Ryberg M, Hallenberg N, Larsson KH. 2008. Intraspecific
ITS variability in the kingdom Fungi as expressed in the international sequence
databases and its implications for molecular species identification. Evolutionary
Bioinformatics 4: 193-201.
Nilsson RH, Ryberg M, Abarenkov K, Sjökvist E, Kristiansson E. 2009a. The ITS region
as a target for characterization of fungal communities using emerging sequencing
technologies. FEMS Microbiology Letters 296: 97-101.
Nilsson RH, Ryberg M, Kristiansson E, Abarenkov K, Larsson KH, Kõljalg U. 2006. Taxonomic reliability of DNA sequences in public sequence databases: a fungal
perspective. PLoS ONE 1: e59.
Nilsson RH, Tedersoo L, Lindahl BD, Kjøller R, Carlsen T, Quince C, Abarenkov K,
Pennanen T, Stenlid J, Bruns T, Larsson KH, Kõljalg U, Kauserud H. 2011. Towards standardization of the description and publication of next-generation
sequencing datasets of fungal communities. New Phytologist 191: 314-318.
Nilsson RH, Bok G, Ryberg M, Kristiansson E, Hallenberg N. 2009b. A software pipeline
for processing and identification of fungal ITS sequences. Source code for biology and
medicine 4: 1.

145
Nortcliff S. 2002. Standardisation of soil quality attributes. Agriculture Ecosystems &
Environment 88: 161-168.
Notredame C, Higgins DG, Heringa J. 2000. T-Coffee: a novel method for fast and accurate
multiple sequence alignment. Journal of Molecular Biology 302: 205-217.
Nusslein K, Tiedje JM. 1999. Soil bacterial community shift correlated with change from
forest to pasture vegetation in a tropical soil. Applied and Environmental Microbiology
65: 3622-3626.
O'Brien HE, Parrent JL, Jackson JA, Moncalvo JM, Vilgalys R. 2005. Fungal community
analysis by large-scale sequencing of environmental samples. Applied and
Environmental Microbiology 71: 5544-5550.
O'Donnell K, Lutzoni FM, Ward TJ, Benny GL. 2001. Evolutionary relationships among
mucoralean fungi (Zygomycota): evidence for family polyphyly on a large scale.
Mycologia 93: 286-297.
Oehl F, Jansa J, Ineichen K, Mader P, van der Heijden M. 2011. Arbuscular mycorrhizal
fungi as bio-indicators in Swiss agricultural soils. Agrarforschung Schweiz 2: 304-311.
Oksanen J, Kindt R, Legendre P, O’Hara B, Stevens MHH. 2007. Vegan: community
ecology package. R package version 1.8-8.
Olsson PA, Thingstrup I, Jakobsen I, Bååth E. 1999. Estimation of the biomass of
arbuscular mycorrhizal fungi in a linseed field. Soil Biology & Biochemistry 31: 1879-
1887.
Osborn AM, Moore ERB, Timmis KN. 2000. An evaluation of terminal-restriction
fragment length polymorphism (T-RFLP) analysis for the study of microbial community
structure and dynamics. Environmental Microbiology 2: 39-50.
Pedros-Alio C. 2007. Dipping into the rare biosphere. Science 315: 192-193.
Persson L, Bødker L, LarssonWikstrom M. 1997. Prevalence and pathogenicity of foot and
root rot pathogens of pea in southern Scandinavia. Plant Disease 81: 171-174.
Pertea G, Huang XQ, Liang F, Antonescu V, Sultana R, Karamycheva S, Lee Y, White J,
Cheung F, Parvizi B, Tsai J, Quackenbush J. 2003. TIGR Gene Indices clustering
tools (TGICL): a software system for fast clustering of large EST datasets.
Bioinformatics 19: 651-652.
Peters RD, Grau CR. 2002. Inoculation with nonpathogenic Fusarium solani increases
severity of pea root rot caused by Aphanomyces euteiches. Plant Disease 86: 411-414.
Pfender WF. 2001. Aphanomyces root rot. In: Kraft JM, Pfleger FL, eds. Compendium of
pea diseases and pests. St.Paul, MN, USA: APS Press, 9-13.
Pliego C, Ramos C, de Vicente A, Cazorla FM. 2011. Screening for candidate bacterial
biocontrol agents against soilborne fungal plant pathogens. Plant and Soil 340: 505-520.
Preston-Mafham J, Boddy L, Randerson PF. 2002. Analysis of microbial community
functional diversity using sole-carbon-source utilisation profiles - a critique. FEMS
Microbiology Ecology 42: 1-14.
Quince C, Lanzen A, Curtis TP, Davenport RJ, Hall N, Head IM, Read LF, Sloan WT. 2009. Accurate determination of microbial diversity from 454 pyrosequencing data.
Nature Methods 6: 639-644.
Quince C, Lanzen A, Davenport RJ, Turnbaugh PJ. 2011. Removing noise from
pyrosequenced amplicons. BMC Bioinformatics 12: 38.
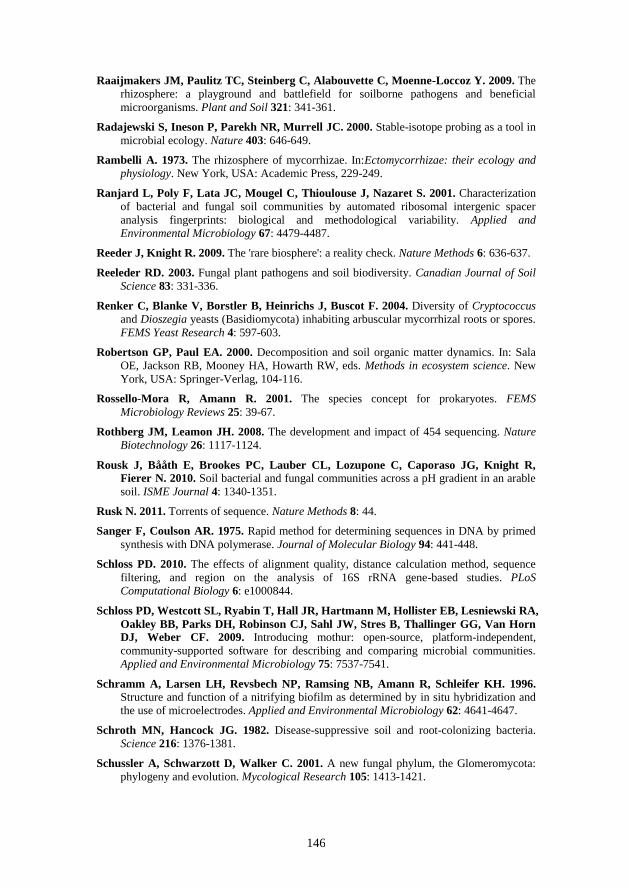
146
Raaijmakers JM, Paulitz TC, Steinberg C, Alabouvette C, Moenne-Loccoz Y. 2009. The
rhizosphere: a playground and battlefield for soilborne pathogens and beneficial
microorganisms. Plant and Soil 321: 341-361.
Radajewski S, Ineson P, Parekh NR, Murrell JC. 2000. Stable-isotope probing as a tool in
microbial ecology. Nature 403: 646-649.
Rambelli A. 1973. The rhizosphere of mycorrhizae. In:Ectomycorrhizae: their ecology and
physiology. New York, USA: Academic Press, 229-249.
Ranjard L, Poly F, Lata JC, Mougel C, Thioulouse J, Nazaret S. 2001. Characterization
of bacterial and fungal soil communities by automated ribosomal intergenic spacer
analysis fingerprints: biological and methodological variability. Applied and
Environmental Microbiology 67: 4479-4487.
Reeder J, Knight R. 2009. The 'rare biosphere': a reality check. Nature Methods 6: 636-637.
Reeleder RD. 2003. Fungal plant pathogens and soil biodiversity. Canadian Journal of Soil
Science 83: 331-336.
Renker C, Blanke V, Borstler B, Heinrichs J, Buscot F. 2004. Diversity of Cryptococcus
and Dioszegia yeasts (Basidiomycota) inhabiting arbuscular mycorrhizal roots or spores.
FEMS Yeast Research 4: 597-603.
Robertson GP, Paul EA. 2000. Decomposition and soil organic matter dynamics. In: Sala
OE, Jackson RB, Mooney HA, Howarth RW, eds. Methods in ecosystem science. New
York, USA: Springer-Verlag, 104-116.
Rossello-Mora R, Amann R. 2001. The species concept for prokaryotes. FEMS
Microbiology Reviews 25: 39-67.
Rothberg JM, Leamon JH. 2008. The development and impact of 454 sequencing. Nature
Biotechnology 26: 1117-1124.
Rousk J, Bååth E, Brookes PC, Lauber CL, Lozupone C, Caporaso JG, Knight R,
Fierer N. 2010. Soil bacterial and fungal communities across a pH gradient in an arable
soil. ISME Journal 4: 1340-1351.
Rusk N. 2011. Torrents of sequence. Nature Methods 8: 44.
Sanger F, Coulson AR. 1975. Rapid method for determining sequences in DNA by primed
synthesis with DNA polymerase. Journal of Molecular Biology 94: 441-448.
Schloss PD. 2010. The effects of alignment quality, distance calculation method, sequence
filtering, and region on the analysis of 16S rRNA gene-based studies. PLoS
Computational Biology 6: e1000844.
Schloss PD, Westcott SL, Ryabin T, Hall JR, Hartmann M, Hollister EB, Lesniewski RA,
Oakley BB, Parks DH, Robinson CJ, Sahl JW, Stres B, Thallinger GG, Van Horn
DJ, Weber CF. 2009. Introducing mothur: open-source, platform-independent,
community-supported software for describing and comparing microbial communities.
Applied and Environmental Microbiology 75: 7537-7541.
Schramm A, Larsen LH, Revsbech NP, Ramsing NB, Amann R, Schleifer KH. 1996. Structure and function of a nitrifying biofilm as determined by in situ hybridization and
the use of microelectrodes. Applied and Environmental Microbiology 62: 4641-4647.
Schroth MN, Hancock JG. 1982. Disease-suppressive soil and root-colonizing bacteria.
Science 216: 1376-1381.
Schussler A, Schwarzott D, Walker C. 2001. A new fungal phylum, the Glomeromycota:
phylogeny and evolution. Mycological Research 105: 1413-1421.
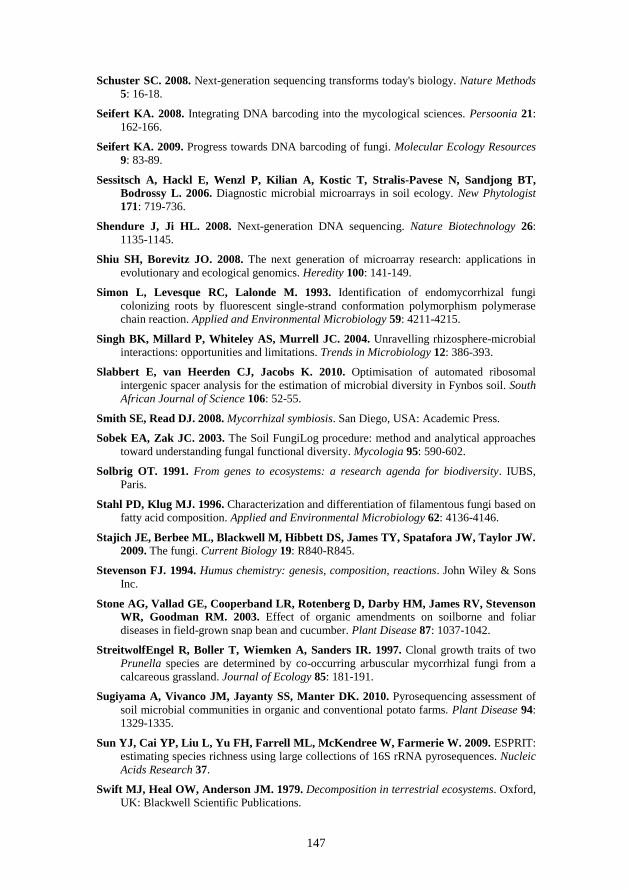
147
Schuster SC. 2008. Next-generation sequencing transforms today's biology. Nature Methods
5: 16-18.
Seifert KA. 2008. Integrating DNA barcoding into the mycological sciences. Persoonia 21:
162-166.
Seifert KA. 2009. Progress towards DNA barcoding of fungi. Molecular Ecology Resources
9: 83-89.
Sessitsch A, Hackl E, Wenzl P, Kilian A, Kostic T, Stralis-Pavese N, Sandjong BT,
Bodrossy L. 2006. Diagnostic microbial microarrays in soil ecology. New Phytologist
171: 719-736.
Shendure J, Ji HL. 2008. Next-generation DNA sequencing. Nature Biotechnology 26:
1135-1145.
Shiu SH, Borevitz JO. 2008. The next generation of microarray research: applications in
evolutionary and ecological genomics. Heredity 100: 141-149.
Simon L, Levesque RC, Lalonde M. 1993. Identification of endomycorrhizal fungi
colonizing roots by fluorescent single-strand conformation polymorphism polymerase
chain reaction. Applied and Environmental Microbiology 59: 4211-4215.
Singh BK, Millard P, Whiteley AS, Murrell JC. 2004. Unravelling rhizosphere-microbial
interactions: opportunities and limitations. Trends in Microbiology 12: 386-393.
Slabbert E, van Heerden CJ, Jacobs K. 2010. Optimisation of automated ribosomal
intergenic spacer analysis for the estimation of microbial diversity in Fynbos soil. South
African Journal of Science 106: 52-55.
Smith SE, Read DJ. 2008. Mycorrhizal symbiosis. San Diego, USA: Academic Press.
Sobek EA, Zak JC. 2003. The Soil FungiLog procedure: method and analytical approaches
toward understanding fungal functional diversity. Mycologia 95: 590-602.
Solbrig OT. 1991. From genes to ecosystems: a research agenda for biodiversity. IUBS,
Paris.
Stahl PD, Klug MJ. 1996. Characterization and differentiation of filamentous fungi based on
fatty acid composition. Applied and Environmental Microbiology 62: 4136-4146.
Stajich JE, Berbee ML, Blackwell M, Hibbett DS, James TY, Spatafora JW, Taylor JW.
2009. The fungi. Current Biology 19: R840-R845.
Stevenson FJ. 1994. Humus chemistry: genesis, composition, reactions. John Wiley & Sons
Inc.
Stone AG, Vallad GE, Cooperband LR, Rotenberg D, Darby HM, James RV, Stevenson
WR, Goodman RM. 2003. Effect of organic amendments on soilborne and foliar
diseases in field-grown snap bean and cucumber. Plant Disease 87: 1037-1042.
StreitwolfEngel R, Boller T, Wiemken A, Sanders IR. 1997. Clonal growth traits of two
Prunella species are determined by co-occurring arbuscular mycorrhizal fungi from a
calcareous grassland. Journal of Ecology 85: 181-191.
Sugiyama A, Vivanco JM, Jayanty SS, Manter DK. 2010. Pyrosequencing assessment of
soil microbial communities in organic and conventional potato farms. Plant Disease 94:
1329-1335.
Sun YJ, Cai YP, Liu L, Yu FH, Farrell ML, McKendree W, Farmerie W. 2009. ESPRIT:
estimating species richness using large collections of 16S rRNA pyrosequences. Nucleic
Acids Research 37.
Swift MJ, Heal OW, Anderson JM. 1979. Decomposition in terrestrial ecosystems. Oxford,
UK: Blackwell Scientific Publications.

148
Tabacchioni S, Chiarini L, Bevivino A, Cantale C, Dalmastri C. 2000. Bias caused by
using different isolation media for assessing the genetic diversity of a natural microbial
population. Microbial Ecology 40: 169-176.
Tambong JT, De Cock AWAM, Tinker NA, Levesque CA. 2006. Oligonucleotide array
for identification and detection of Pythium species. Applied and Environmental
Microbiology 72: 7429.
Tarkka M, Schrey S, Hampp R. 2008. Plant associated soil micro-organisms. In: Nautiyal
CS, Dion P, eds. Molecular mechanisms of plant and microbe coexistence. Springer-
Verlag Berlin Heidelberg, 3-51.
Tate RL. 2000. Soil microbiology. New York: John Wiley & Sons, Inc.
Taylor DL, Houston S. 2011. A bioinformatics pipeline for sequence-based analyses of
fungal biodiversity. Methods in molecular biology (Clifton, N.J.) 722: 141-155.
Tedersoo L, Nilsson RH, Abarenkov K, Jairus T, Sadam A, Saar I, Bahram M, Bechem
E, Chuyong G, Kõljalg U. 2010. 454 Pyrosequencing and Sanger sequencing of tropical
mycorrhizal fungi provide similar results but reveal substantial methodological biases.
New Phytologist 188: 291-301.
Termorshuizen AJ, Jeger MJ. 2008. Strategies of soilborne plant pathogenic fungi in
relation to disease suppression. Fungal Ecology 1: 108-114.
Theron J, Cloete TE. 2000. Molecular techniques for determining microbial diversity and
community structure in natural environments. Critical Reviews in Microbiology 26: 37-
57.
Thygesen K, Larsen J, Bødker L. 2004. Arbuscular mycorrhizal fungi reduce development
of pea root-rot caused by Aphanomyces euteiches using oospores as pathogen inoculum.
European Journal of Plant Pathology 110: 411-419.
Tiedje JM, Asuming-Brempong S, Nusslein K, Marsh TL, Flynn SJ. 1999. Opening the
black box of soil microbial diversity. Applied Soil Ecology 13: 109-122.
Torsvik V, Sorheim R, Goksoyr J. 1996. Total bacterial diversity in soil and sediment
communities - a review. Journal of Industrial Microbiology 17: 170-178.
Torzilli AP, Sikaroodi M, Chalkley D, Gillevet PM. 2006. A comparison of fungal
communities from four salt marsh plants using automated ribosomal intergenic spacer
analysis (ARISA). Mycologia 98: 690-698.
Trevors JT. 1998. Bacterial biodiversity in soil with an emphasis on chemically-
contaminated soils. Water Air and Soil Pollution 101: 45-67.
Tunlid A, White DC. 1990. Use of lipid biomarkers in environmental samples. Analytical
Microbiology Methods (eds A.Fox et al.), Plenum Press, New York 259-274.
Tunlid A, White DC. 1992. Biochemical analysis of biomass, community structure,
nutritional status, and metabolic activity of microbial communities in soil. Soil
biochemistry 7: 229-262.
Valaskova V, Baldrian P. 2009. Denaturing gradient gel electrophoresis as a fingerprinting
method for the analysis of soil microbial communities. Plant Soil and Environment 55:
413-423.
van der Heijden MGA, Klironomos JN, Ursic M, Moutoglis P, Streitwolf-Engel R,
Boller T, Wiemken A, Sanders IR. 1998. Mycorrhizal fungal diversity determines
plant biodiversity, ecosystem variability and productivity. Nature 396: 69-72.
Vandemark GJ, Kraft JM, Larsen RC, Gritsenko MA, Boge WL. 2000. A PCR-based
assay by sequence-characterized DNA markers for the identification and detection of
Aphanomyces euteiches. Phytopathology 90: 1137-1144.

149
Vandenkoornhuyse P, Baldauf SL, Leyval C, Straczek J, Young JPW. 2002. Extensive
fungal diversity in plant roots. Science 295: 2051.
von Wintzingerode F, Gobel UB, Stackebrandt E. 1997. Determination of microbial
diversity in environmental samples: pitfalls of PCR-based rRNA analysis. FEMS
Microbiology Reviews 21: 213-229.
Vujanovic V, Hamelin RC, Bernier L, Vujanovic G, St-Arnaud M. 2007. Fungal diversity,
dominance, and community structure in the rhizosphere of clonal Picea mariana plants
throughout nursery production chronosequences. Microbial Ecology 54: 672-684.
Wallwork JA. 1970. Ecology of soil animals. London, UK: McGraw-Hill.
Warcup JH. 1951. The ecology of soil fungi. Transactions of the British Mycological Society
34: 376-399.
Webb CO, Ackerly DD, Kembel SW. 2008. Phylocom: software for the analysis of
phylogenetic community structure and trait evolution. Bioinformatics 24: 2098-2100.
Weber APM, Weber KL, Carr K, Wilkerson C, Ohlrogge JB. 2007. Sampling the
arabidopsis transcriptome with massively parallel pyrosequencing. Plant Physiology 144:
32-42.
Webster J. 1980. Introduction to fungi. London, UK: Cambridge University Press.
Weller DM, Raaijmakers JM, Gardener BBM, Thomashow LS. 2002. Microbial
populations responsible for specific soil suppressiveness to plant pathogens. Annual
Review of Phytopathology 40: 309-348.
Wheeler DA, Srinivasan M, Egholm M, Shen Y, Chen L, McGuire A, He W, Chen YJ,
Makhijani V, Roth GT, Gomes X, Tartaro K, Niazi F, Turcotte CL, Irzyk GP,
Lupski JR, Chinault C, Song XZ, Liu Y, Yuan Y, Nazareth L, Qin X, Muzny DM,
Margulies M, Weinstock GM, Gibbs RA, Rothberg JM. 2008. The complete genome
of an individual by massively parallel DNA sequencing. Nature 452: 872-876.
Whipps JM. 2004. Prospects and limitations for mycorrhizas in biocontrol of root pathogens.
Canadian Journal of Botany-Revue Canadienne de Botanique 82: 1198-1227.
White TJ, Bruns TD, Lee SB, Taylor JW. 1990. Amplification and direct sequencing of
fungal ribosomal RNA genes for phylogenetics. In: Innis MA, Gelfand DH, Sninsky JJ,
White TJ, eds. PCR protocols: a guide to methods and applications. New York, NY,
USA: Academic Press, 315-322.
Whitehead DC. 2000. Nutrient elements in grassland: soil-plant-animal relationships.
Wallingford, UK: CABI Publishing.
Whittaker RH. 1960. Vegetation of the Siskiyou Mountains, Oregon and California.
Ecological Monographs 30: 280-338.
Whittaker RH. 1972. Evolution and measurement of species diversity. Taxon 213-251.
Wilberforce EM, Boddy L, Griffiths R, Griffith GW. 2003. Agricultural management
affects communities of culturable root-endophytic fungi in temperate grasslands. Soil
Biology & Biochemistry 35: 1143-1154.
Xue AG. 2003. Biological control of pathogens causing root rot complex in field pea using
Clonostachys rosea strain ACM941. Phytopathology 93: 329-335.
Yao H, He Z, Wilson MJ, Campbell CD. 2000. Microbial biomass and community structure
in a sequence of soils with increasing fertility and changing land use. Microbial Ecology
40: 223-237.
Zak JC, Willig MR, Moorhead DL, Wildman HG. 1994. Functional diversity of microbial
communities: a quantitative approach. Soil Biology & Biochemistry 26: 1101-1108.
150
Zelles L. 1997. Phospholipid fatty acid profiles in selected members of soil microbial
communities. Chemosphere 35: 275-294.
Zhou JH. 2003. Microarrays for bacterial detection and microbial community analysis.
Current Opinion in Microbiology 6: 288-294.
Øvreås L. 2000. Population and community level approaches for analysing microbial
diversity in natural environments. Ecology Letters 3: 236-251.

Soil fungi play extremely important roles in plant root health. Soil fungal communities associ-ated with plant root health were investigated using amplicon pyrosequencing. Initially, it was found that DNA extraction and PCR amplification affect the variation of read abundances of pyrosequencing generated operational taxonomic units, and that pooling of several DNA extractions and PCR amplicons will decrease variation among technical replicates. Soil fungal communities differed along a soil health gradient in nine pea fields. Phoma, Podospora, Pseu-daleuria, and Veronaea, at the genus level, correlated to the disease severity index of plant roots. Fungal communities also clearly varied in diseased and healthy pea roots, rhizosphere, and bulk soil from three pea fields in terms of community composition and diversity. Fusarium oxysporum and Aphanomyces euteiches were the likely causes of pea root rot in the respective fields. Glomus and Fusarium were significantly more abundant in roots, whereas Cryptococ-cus and Mortierella were almost exclusively found in rhizosphere and bulk soil. Generally, this project demonstrated clear relationships between fungal communities and plant root health.