Soil Erosion Processes in European Vineyards: A ...
19
hydrology Article Soil Erosion Processes in European Vineyards: A Qualitative Comparison of Rainfall Simulation Measurements in Germany, Spain and France Jesús Rodrigo Comino 1,2, *, Thomas Iserloh 1 , Xavier Morvan 3 , Oumarou Malam Issa 4,5 , Christophe Naisse 6 , Saskia D. Keesstra 7 , Artemio Cerdà 7,8 , Massimo Prosdocimi 9 , José Arnáez 10 , Teodoro Lasanta 11 , María Concepción Ramos 12 , María José Marqués 13 , Marta Ruiz Colmenero 14,15 , Ramón Bienes 14 , José Damián Ruiz Sinoga 2 , Manuel Seeger 1 and Johannes B. Ries 1 1 Department of Physical Geography, Trier University, Behringstraße, D-54286 Trier, Germany; [email protected] (T.I.); [email protected] (M.S.); [email protected] (J.B.R.) 2 Department of Geography, Málaga University, Campus of Teatinos s/n, 29071 Málaga, Spain; [email protected] 3 University of Reims Champagne-Ardenne, GEGENAA- EA 3795, Reims, France; [email protected] 4 URCA, GEGENAA EA 3795, 51100 Reims, France; [email protected] 5 Bioemco, IRD, BP11416 Niamey, Niger 6 Laboratoire Réactions et Génie des Procédés, CNRS, Lorraine University, ENSIC, 1 rue Grandville, B.P. 20451, 54000 Nancy Cedex, France; [email protected] 7 Soil Physics and Land Management Group, Wageningen University, Droevendaalsesteeg 4, 6708PB, Wageningen, The Netherlands; [email protected] 8 Department of Geography, Valencia University, BlascoIbàñez, 28, 46010 Valencia, Spain; [email protected] 9 Department of Land, Environment, Agriculture and Forestry, University of Padova, Agripolis, Vialedell’Università 16, 35020 Legnaro (PD), Italy; [email protected] 10 Physical Geography, DCHS, Edificio Luis Vives, University of La Rioja, 26004 Logroño, Spain; [email protected] 11 Instituto Pirenaico de Ecología, CSIC; Campus Aula Dei, 50080 Zaragoza, Spain; [email protected] 12 Department of Environment and Soil Science, University of Lleida, RoviraRoure 191, 25198 Lleida, Spain; [email protected] 13 Geology and Geochemistry Department, Universidad Autónoma de Madrid, C/ Francisco Tomás y Valiente, 7, 28049 Madrid, Spain; [email protected] 14 Applied Research Department, Agri-Environmental Research Centre IMIDRA, Alcalá de Henares (Madrid), Spain; [email protected] (M.R.C.); [email protected] (R.B.) 15 Greencollar Group, Level 1, 37 George Street, The Rocks, Sydney NSW 2000, Australia * Correspondence: [email protected]; Tel.: +34-637937558 Academic Editor: Vijay P. Singh Received: 30 November 2015; Accepted: 6 February 2016; Published: 18 February 2016 Abstract: Small portable rainfall simulators are considered a useful tool to analyze soil erosion processes in cultivated lands. European research groups in Spain (Valencia, Málaga, Lleida, Madrid and La Rioja), France (Reims) and Germany (Trier) have used different rainfall simulators (varying in drop size distribution and fall velocities, kinetic energy, plot forms and sizes, and field of application) to study soil loss, surface flow, runoff and infiltration coefficients in different experimental plots (Valencia, Montes de Málaga, Penedès, Campo Real and La Rioja in Spain, Champagne in France and Mosel-Ruwer valley in Germany). The measurements and experiments developed by these research teams give an overview of the variety of methodologies used in rainfall simulations to study the problem of soil erosion and describe the erosion features in different climatic environments, management practices and soil types. The aims of this study are: (i) to investigate where, how and why researchers from different wine-growing regions applied rainfall simulations with successful results as a tool to measure soil erosion processes; (ii) to make a qualitative comparison about Hydrology 2016, 3, 6; doi:10.3390/hydrology3010006 www.mdpi.com/journal/hydrology
Transcript of Soil Erosion Processes in European Vineyards: A ...

hydrology
Article
Soil Erosion Processes in European Vineyards: AQualitative Comparison of Rainfall SimulationMeasurements in Germany, Spain and France
Jesús Rodrigo Comino 1,2,*, Thomas Iserloh 1, Xavier Morvan 3, Oumarou Malam Issa 4,5,Christophe Naisse 6, Saskia D. Keesstra 7, Artemio Cerdà 7,8, Massimo Prosdocimi 9,José Arnáez 10, Teodoro Lasanta 11, María Concepción Ramos 12, María José Marqués 13,Marta Ruiz Colmenero 14,15, Ramón Bienes 14, José Damián Ruiz Sinoga 2, Manuel Seeger 1
and Johannes B. Ries 1
1 Department of Physical Geography, Trier University, Behringstraße, D-54286 Trier, Germany;[email protected] (T.I.); [email protected] (M.S.); [email protected] (J.B.R.)
2 Department of Geography, Málaga University, Campus of Teatinos s/n, 29071 Málaga, Spain;[email protected]
3 University of Reims Champagne-Ardenne, GEGENAA- EA 3795, Reims, France;[email protected]
4 URCA, GEGENAA EA 3795, 51100 Reims, France; [email protected] Bioemco, IRD, BP11416 Niamey, Niger6 Laboratoire Réactions et Génie des Procédés, CNRS, Lorraine University, ENSIC, 1 rue Grandville,
B.P. 20451, 54000 Nancy Cedex, France; [email protected] Soil Physics and Land Management Group, Wageningen University, Droevendaalsesteeg 4, 6708PB,
Wageningen, The Netherlands; [email protected] Department of Geography, Valencia University, BlascoIbàñez, 28, 46010 Valencia, Spain; [email protected] Department of Land, Environment, Agriculture and Forestry, University of Padova, Agripolis,
Vialedell’Università 16, 35020 Legnaro (PD), Italy; [email protected] Physical Geography, DCHS, Edificio Luis Vives, University of La Rioja, 26004 Logroño, Spain;
[email protected] Instituto Pirenaico de Ecología, CSIC; Campus Aula Dei, 50080 Zaragoza, Spain; [email protected] Department of Environment and Soil Science, University of Lleida, RoviraRoure 191, 25198 Lleida, Spain;
[email protected] Geology and Geochemistry Department, Universidad Autónoma de Madrid, C/ Francisco Tomás y Valiente,
7, 28049 Madrid, Spain; [email protected] Applied Research Department, Agri-Environmental Research Centre IMIDRA, Alcalá de Henares (Madrid),
Spain; [email protected] (M.R.C.); [email protected] (R.B.)15 Greencollar Group, Level 1, 37 George Street, The Rocks, Sydney NSW 2000, Australia* Correspondence: [email protected]; Tel.: +34-637937558
Academic Editor: Vijay P. SinghReceived: 30 November 2015; Accepted: 6 February 2016; Published: 18 February 2016
Abstract: Small portable rainfall simulators are considered a useful tool to analyze soil erosionprocesses in cultivated lands. European research groups in Spain (Valencia, Málaga, Lleida, Madridand La Rioja), France (Reims) and Germany (Trier) have used different rainfall simulators (varying indrop size distribution and fall velocities, kinetic energy, plot forms and sizes, and field of application)to study soil loss, surface flow, runoff and infiltration coefficients in different experimental plots(Valencia, Montes de Málaga, Penedès, Campo Real and La Rioja in Spain, Champagne in Franceand Mosel-Ruwer valley in Germany). The measurements and experiments developed by theseresearch teams give an overview of the variety of methodologies used in rainfall simulations tostudy the problem of soil erosion and describe the erosion features in different climatic environments,management practices and soil types. The aims of this study are: (i) to investigate where, how andwhy researchers from different wine-growing regions applied rainfall simulations with successfulresults as a tool to measure soil erosion processes; (ii) to make a qualitative comparison about
Hydrology 2016, 3, 6; doi:10.3390/hydrology3010006 www.mdpi.com/journal/hydrology

Hydrology 2016, 3, 6 2 of 19
the general soil erosion processes in European terroirs; (iii) to demonstrate the importance of thedevelopment of standard method for measurement of soil erosion processes in vineyards, usingrainfall simulators; and (iv) and to analyze the key factors that should be taken into account tocarry out rainfall simulations. The rainfall simulations in all cases allowed infiltration capacity,susceptibility of the soil to detachment and generation of sediment loads to runoff to be determined.Despite using small plots, the experiments were useful to analyze the influence of soil cover toreduce soil erosion, to make comparisons between different locations, and to evaluate the influenceof different soil characteristics. The comparative analysis of the studies performed in different studyareas points out the need to define an operational methodology to carry out rainfall simulations, whichallows us to obtain representative and comparable results and to avoid errors in the interpretation inorder to achieve comparable information about runoff and soil loss.
Keywords: rainfall simulation; soil erosion; soil hydrology; qualitative comparison; vineyards
1. Introduction
The concept of terroir defines a vineyard with particular regional vitivinicultural practices(land management, soil tillage, crop management, etc.) and identifiable bio-physical environmentalconditions (soil, climate, landscape and topography) with direct influences on grape composition [1–4].
Several authors evidenced the importance of vineyard degradation during the last few decades,induced by applying chemical weeding, seasonal intensive tillage, green pruning and the use of heavymachinery [5–9]. All these activities notably affect one of the most important components of the terroir:the soil. Pedological process research in terroirs has become one of the most relevant topics nowadaysin geosciences [10]. Vineyards are notably one of the land uses, in particular in Mediterraneanenvironments, in which high erosion rates are being recorded [11]. There is a growing awareness ofthe need to avoid high soil erosion rates and to reduce the transfer of pollutants downstream [12,13].To meet this goal, new agricultural measures are being applied through the development of newagri-environments with conceptual models of public spending efficiency [14] in the recovery of soilfunctions and services [15–18]. The occurrence of extreme rainfall events, soil characteristics and insome cases steep slopes contribute to soil degradation. Several studies note that these factors causesoil degradation in vineyards and show how they affect soil surface characteristics [19,20] and can berelevant indicators to classify and analyze actual soil degradation processes in vineyards [13,21–26].According to this, the most important question to investigate has become the spatial and temporalvariability of soil patterns caused by geomorphological dynamics over only a few hectares [27–30].
To enable quantification of these spatially variable parameters, small portable rainfall simulatorsare useful tools, because they provide information about the detachment, transport and depositionof soil particles. They are the key to understanding soil erosion and hydrological process, and todesign strategies to control the non-sustainable soil losses found in vineyards. Several authors haveapplied these experiments to measure rainfall–runoff processes, splash effect, soil erosion, infiltration,permeability, irrigation or nutrient movement [22,31–48]. However, despite the effort and time investedby researchers in the understanding of soil degradation using rainfall simulations, one of the mostimportant problems is the lack of a standard rainfall simulator for an effective transfer of knowledgeand generation of comparable data.
The characteristics of the different rainfall simulators, such as the spatial rainfall distribution,drop sizes and velocities, drop kinetic energy and plot forms and sizes are different among therainfall simulators applied in the compared studies. In addition, different land covers and differentexperimental simulations characteristics (rainfall intensities, experimental time or plot sizes) makea successful comparison difficult [49,50]. Moreover, climate is different at the different locations,

Hydrology 2016, 3, 6 3 of 19
which means that the rainfall simulators should produce rain of different characteristics. Therefore,it is important to have a fleet of rainfall simulators with diverse rainfall properties as they can allprovide required types of experiments that are needed to match the environmental conditions ofdifferent regions.
However, a number of publications on rainfall simulations in vineyards asks for one standardmethodology to be able to compare the results in different climatic settings and under differentmanagement. The data obtained from all the studies of rainfall simulations in vineyards could beof great significance to compare the simulated processes, and could also serve as a source of input-and validation-data for soil erosion modeling and extrapolations to larger scales [51,52]. This couldbe an important and useful step for a reliable assessment of vulnerability, risk levels and control ofsoil degradation in European terroirs. These insights can in turn serve as a basis to develop moresustainable management of vineyards around Europe.
Therefore, the aims of this research are: (i) to investigate where, how and why researchers fromdifferent wine-growing regions applied rainfall simulations with successful results as a tool to measuresoil erosion processes; (ii) to make a qualitative comparison about the general soil erosion processes inEuropean terroirs; (iii) to demonstrate the importance of the development of a standard method forstudying soil erosion processes in vineyards, using rainfall simulators and; and (iv) to analyze the keyfactors that should be taken into account to carry out rainfall simulations.
2. Materials and Methods
2.1. Study Area
The selected study areas are located in traditional and conventional European wine-growingregions (Figure 1 and Table 1).
Figure 1. Localization of the study areas.

Hydrology 2016, 3, 6 4 of 19
Table 1. Study areas with their characteristics.
Place Ruwer-MoselValley (Trier)
Montagne deReims
(Champagne)
Montes deMálaga (Málaga)*
ElsHostalest dePierola (Penedès)
Moixent(Valencia)
VillamedianadeIregua
(La Rioja)
Campo Real(Madrid)
Clay (%) 9.4 6–12 - 10.6 8 19.9 24Silt (%) 64.7 45–55 - 25.8 32 40.4 18
Sand (%) 26 33–45 - 63.6 60 39.9 58SOM7 6.1 3.9–8.3 2 1.2 1.01 0.9 1.7
pH 7.2 8 - 8.6 7.8 8.4 8.5Coordinates(WGS 1984)
49.74N;6.75E
49.16N;4.12E
36.76N;´4.39E
41.59N,1.77E 38.78N; 0.87E 42.26N;
2.23 E40.35N;´3.37E
Altitude (m.a.s.l.) 220-250 170 500 330-360 550 425–450 820
Grape variety RieslingPinot noir, Pinot
meunier andChardonnay
Muscat ofAlexandria
Parellada, Macabeo,Xarello andChardonnay
Monastrell Tempranillo Tempranillo
SoiltillageMachinery,
grass/pruningcover
Machinery,grass/pruning
cover (ecologicaland conventional)
Conventional withanimals andploughing
Machiniery andherbicids. Ploughing
Terrace(1–2 m height),machiniery, soil
tillage andherbicids
Machinery
T˝ pxq1 9.3 - 15.6 15 14.2 14.6 14.4T˝ (max_x)2 17.6 - - 31.4 25 21.1 21,1T˝ (min_x)3 1.5 - - 1.5 9.2 1.2 7.9Pp (xtotal)4 765 757 586.1 520 420 419 371Pp (max_x)5 71.2 72.9 - 76.6 42 75 51Pp (min_x)6 50.6 33.2 - 22.6 5 42.3 9
1 = Annual average temperatures; 2 = Maximal monthly average temperatures; 3 = Minimal monthly average temperatures; 4 = Average of annual rainfall depth; 5 = Maximal monthlyaverage rainfall depth; 6 = Minimal monthly average rainfall depth; 7 = Soil organic matter; * = Stoniness (52.8%) and porosity (33.3%) were measured for this study.

Hydrology 2016, 3, 6 5 of 19
The area of study in Germany is located close to the village of Waldrach (49.7418N; 6.7524E), whichis in the Ruwer-Mosel valley (Rhineland-Palatinate, Germany), a tributary of the Mosel River. Thesevineyards (with the Riesling grape variety) are characterized by conventional management, includingsoil tillage with machinery and grass/pruning cover. The site is located on steep slopes (25–50%)and the soil is characterized by a high rock fragments percentage on the surface, a silt proportionof 64.7% and a soil organic matter content of 6.1%. Total average annual rainfall is about 780 mmand the annual average temperature is 9.3˝C. For this area, Trier and Málaga universities studied theimpacts of rainfall and human influences on soil erosion and determined with botanic marks of thegraft unions soil loss rates of 3.4 Mg¨ha´1¨yr´1, high geometrical variations of the rills and elevatedinfiltration [53,54].
In France, the study site is located close to Paris, in the Montagne de Reims (49.16N; 4.12E). Totalannual rainfall is similar to the German study area with 757 mm and maximum monthly events ofabout 72.9 mm. The most used grape varieties are Pinot noir, Pinot meunier and Chardonnay. In this case,several different soil treatments for the vineyards were applied: grass/pruning cover, plowing, anduse of herbicides or without herbicide. Soils are characterized by similar percentage of silts and sandsand relativity high soil organic matter (3.9–8.3%). Morvan et al. [20] analyzed the impact of differentland management on soil in this area using rainfall simulations. They noted that ecological treatmentsare more effective against soil erosion than conventional management.
For Spain, five study sites were selected. The first one is the Montes de Málaga in Málaga (36.76N;´4.39E). Martínez-Murillo and Ruiz Sinoga [55] analyzed the influence of the soil surface componentson these hillslope vineyards with Muscat of Alexandria grape variety. This conventional plantation(with handmade and animal works) registers an annual average rainfall of 586.1 mm on soils with ahigh stoniness (about 52.8%) and low porosity (33.3%).
The second selected study area in Spain is Celler del Roure (38.7833N; 0.87E), in the Les Alcussesvalley (Moixent municipality), which is located in Valencia region at 550 m.a.s.l. with a production ofMonastrell grape variety. Sandy soils (>60% sand) with low soil organic matter content (1.01%) inducedsoil erosion dynamics in the form of rills and sheet wash. Annual average rainfall is about 420 mmwith minimal monthly averages of 5 mm in summer. The rainfall simulations data were produced bythe Valencia and Wageningen Universities, following their published methods [26,31–35,56].
Els Hostalest de Pierola (41.59N, 1.77E) in Barcelona province, whose vineyards belong to thePenedès wine-growing region, is the third selected study area. This area (with mainly white varietiessuch as Parellada, Macabeo, Xarello and Chardonnay grape variety production) is characterized by soilswith high contents of silt (25.8%) and sands (63.6%) and low soil organic matter (1.2%). Total averageannual rainfall is 520 mm and the annual average temperature is 15 ˝C. Lleida University carriedout several studies in that wine region with different topics, mostly related with soil, climatic andphenologic dynamics [57–63].
The fourth selected study area is Villamediana de Iregua (La Rioja) (42.26N; 2.23E). Soils havehigh clay (19.9%) and sand (39.9%) contents on terraces about 1–2 m height. This traditionalvitivicultural area, with Tempranillo grape variety production is managed with tillage and herbicidesusing machinery. Annual average rainfall is 419 mm and annual average temperature is 14.6 ˝C, withminimum temperatures of 1.2 ˝C in winter. The Instituto Pirenaico de Ecología (CSIC) and La RiojaUniversity performed several studies on soil erosion, land degradation and wheel tracks signals onthese soils [39,64].
Finally, Campo Real in Madrid (40.35N; ´3.37E) with organic vineyards of Tempranillo grapevariety production is the last experimental area. This is a semi-arid area having less than 400 mm ofannual rainfall [65–68]. As with the previous study area, soils have high sand content (58%), high claycontent (24%) and low soil organic matter (1.2%). These soil characteristics, together with soil tillagewith machinery, favor soil degradation processes. The regional extension services (IMIDRA) andresearchers from the Autonomous Madrid University studied the effects of different vegetation cover

Hydrology 2016, 3, 6 6 of 19
(Brachypodium distachyon and annual barley) between the vine rows as protection measures against theland degradation processes in these vineyards.
2.2. Qualitative Comparison with Different Data of Rainfall Simulations in Vineyards
All the vineyard data from the different research groups were organized in a database in order tohomogenize the information. An analysis was done to assess the differences among the experimentsdue to rainfall simulator design and characteristics, plot size and time intervals for recording runoffduring the experiments (Table 2). The results were interpreted taking all parameters into account,which can play an important role in the final observed soil dynamics processes.
The first technical characteristic is the dropper system. In Moixent (Valencia, Spain), Ruwer-Moselvalley (Trier, Germany) and Villamediana de Iregua (La Rioja, Spain), the same nozzle (Lechler 460.608)was used. In the other locations, spraying systems (Campo Real, Madrid), Hardy nozzle (Montes deMálaga, Spain), a dropping system controlled by a water column (Els Hostalest de Pierola, Spain) anda Teejet nozzle (Montagne de Reims, France) were the principal applied brand.
The second characteristic was the size and form of the plot. In four rainfall simulations, ring plotswith sizes between 0.25 and 0.45 m2 were used (Moixent, Ruwer-Mosel valley, Montes de Málaga andVillamediana de Iregua). In the other locations, the plots were rectangular with different dimensions:2 m2 in Campo Real, 0.6 m2 in Els Hostalest de Pierola, 0.25 m2 in Montagne de Reims. With respect tothe third characteristic, the droppers or nozzle height, there was more uniformity, as they ranged from2 and 2.5 m above the soil surface.
The last characteristic was the operational method, where several differences were observed. Forexample, the total duration of the experiments ranged between 15 minutes in the vineyards of CampoReal and 90 minutes in Montagne de Reims, and the time intervals for collecting runoff samples rangedbetween 1 and 10 minutes.
For more concrete information about the different methods (rainfall intensities, study areas,duration of the experiments, etc.), the articles for each research group were also added to Table 2.
In order to homogenize the information, all data of the rainfall simulations experiments (datasheets) were organized into five-minute time steps. However, because some authors used differentintervals in different experiments (between 5 and 15 minutes), results must be homogenized, calculatingthe suspended sediment load (SSL) per hour (g¨m2¨h´1), surface flow (L¨m2¨h´1) and suspendedsediment load concentration (SSC in g¨L¨m2¨h´1), using:
(1) Suspended sediment load (SSL) =
g.5 min´1
Ax60
RFt
(2) Surface flow =
L.5 min´1
Ax60
RFt
(3) Suspended sediment load concentration (SSC) “SSL
Surface flow
where A is the area of the rainfall simulator plot and RFt is the duration of the rainfall experiment.After transforming the data, the obtained results were not exactly equals to the values of the publishedpapers, but these calculations were necessary to make the graphics and commentaries similar.
For each site, soil erosion results are presented separately (Figures 2–8). First, bar and point graphsshow the averages per intervals of 5 minutes of the suspended sediment load (SSL in g¨m´2¨h´1)and the suspended sediment load concentration (SSC in g¨L¨m´2¨h´1). The second graphic presentsthe surface flow (L¨m´2¨h´1), runoff (%) and infiltration (%) coefficients. Furthermore, tables foreach study site were added to show: (i) the previous environmental plot characteristics during theexperiments; and (ii) the averages pxq, totals, maximum (max) and minimum (min) values of the SSL,surface flow, SSC, runoff coefficient (%) and infiltration coefficient (%).

Hydrology 2016, 3, 6 7 of 19
Table 2. Rainfall simulators and methods.
Flow Control Nozzle Electricbilge Pump Plot Current Method
Manometer Pressure(bar or kg¨ cm2) Type Head of the
Pump (m) Voltage (V) Area (m2) Form Height(m)
Total Time(min)
Interval(min) Investigation
Ruwer-Moselvalley
Moixent0.2 bars Lechler 460.608 4.5 12 0.28 Ring 2 30–60 5
Ruwer-Moselvalley: [53,54].
Alforins:[26,56]
Campo Real 1.5 ˘ 0.2kg¨ cm´2
Spraying systems 1/3 HH35 W. Two nozzles
separated 1.5 m apart7 6.5 2 Rectangle 2 15 1 [65–68]
Montes de Málaga - Hardi 1553-20 - - 0.28 Ring 2 60 5 [55]
Villamedianade Iregua 20 bars
Lechler 460.728(<50 mm¨ h´1)Lechler 460.608
(50–70 mm¨ h´1)Lechler 460.880(70 mm¨ h´1)
- - 0.45 Ring 2.5 30–45 3–5 [39,64]
ElsHostalest dePierola
2.5 mm diameterdrops of deionised
water freely
Rainfall intensity wascontrolled by modifyingthe water column abovethe droppers, using an
inverted Mariotte’s bottle
- - 0.6 Rectangle 2.5 60 10 [57–63]
Montagne deReims 2-3 bars Teejet 6501-
Teejet 6508 Max. 2.5 m 220 0.25 Square 2.5 90 Mostly 10min [20]

Hydrology 2016, 3, 6 8 of 19
Figure 2. Rainfall simulations in Ruwer-Mosel valley (Trier, Germany).
To qualitatively compare the initial soil erosion processes with the different rainfall simulatorscharacteristics and plot sizes, a final table with the results of the first 15 minutes of each rainfallsimulations was presented. This time was chosen, because it represents the minimum duration of allthe experiments.
Finally, a Spearman correlation test was performed to detect which factor shows the best trend(with the increasing or decreasing) with the SSL, surface flow and SSC (averages and maximum).
3. Results
3.1. Ruwer-Mosel Valley (Trier, Germany)
Rainfall simulations at the Ruwer-Mosel valley were applied to study soil erosion processesbefore, during and after the vintage in conventional vineyards. Four rainfall simulations in August(2008) and five between September and December (2013) were performed. The experiments were donebetween August and September and coincided with tillage practices before the harvest. The rest of thesimulations were done after the harvest, coinciding with the period of decreasing rainfall amounts andtemperatures. Results of these rainfall simulation experiments were obtained with a rainfall intensityof 40 mm¨h´1.
The plots were characterized by steep slopes (27.5 ˘ 5.6˝), with high vegetation cover(44.7 ˘ 33.8%) and high stone cover (57.8 ˘ 33.5%). The aim to this study was to measure theimpact of rainfall and tillage practices on the soil before, during and after the harvest.
The average SSL was 1.25 ˘ 0.05 g¨m´2¨h´1 with a maximum value of 2.09 g¨m´2¨h´1 duringthe interval of 15–20 minutes. Surface flow was 0.21 ˘ 0.1 L¨m´2¨h´1 with a maximum value of0.32 L¨m´2¨h´1. SSC showed higher values at the beginning of the experiment than at the end of thesimulation, with an average of 6.8 ˘ 3.1 g¨L¨m´2¨h´1 and maximum of 11.7 g¨L¨m´2¨h´1.
Finally, high infiltration (96.7 ˘ 1.3%) and low runoff coefficients (3.2 ˘ 1.3%) were observed inall experiments.

Hydrology 2016, 3, 6 9 of 19
3.2. Montagne de Reims (Champagne, France)
Rainfall simulations in Montage de Reims were applied in vineyards with three commonly usedcultivation practices in Champagne: bare soil (1), bark and vine pruning (3), and grass cover (8). Thegoal was to quantify the influence of cultivation practices in the inter-row of vines and to determinethe influence of the density of grass cover on soil loss and surface runoff. Twelve rainfall simulationswere carried out during about 90 minutes with different rainfall intensities ranging between 20 and76 mm¨h´1 (Figure 3).
Environmental characteristics included a slope of 5.2 ˘ 0.8˝, a vegetation cover of 44.9 ˘ 43.2%and soil moisture of 19.4 ˘ 0.6%. Results were highly heterogeneous depending on the cultivationpractice. Average SSL was 0.13 ˘ 0.1 g¨m´2¨h´1 with maximal values of 0.15 g¨m´2¨h´1. Averagesurface flow showed values of 0.15 L¨m´2¨h´1. 0.94 ˘ 0.003 g¨L¨m´2¨h´1 was the average of thesuspended sediment load concentration. Finally, in this case, we also observed high average infiltration(92.5 ˘ 2%) and low average runoff coefficient (7.5 ˘ 2%).
Figure 3. Rainfall simulations in Montagne de Reims (Champagne, France).
3.3. Spain
3.3.1. Montes de Málaga
The aim of this study was to compare rainfall impact on soil without vegetation cover and highstoniness. The rainfall simulations in Montes de Málaga were carried out in June (2003) in threedifferent locations along a hillslope of 23˝ in a conventional vineyard (Figure 4): at the top (2), middle(2) and foot (2) slope. Two replications were done at each location. All experiments were carried outwith 63–66 mm¨h´1 rainfall intensity with a duration of 60 minutes.
No vegetation cover and high stoniness (52.8%) characterized the plot. The average SSL was3.13˘ 2.69 g¨m´2¨h´1 with maximum values of 6.85 g¨m´2¨h´1. Surface flow was 0.35 ˘ 0.15 L¨m´2¨h´1
(with maximum values of 0.62 L¨m´2¨h´1). The results gave rise to high SSC, (8.71 ˘ 0.56 g¨L¨m´2¨h´1),which reached 21.88 g¨L¨m´2¨h´1. Finally, runoff coefficients of 5.4 ˘ 2.5% and 94.6 ˘ 2.5% ofinfiltration were measured.

Hydrology 2016, 3, 6 10 of 19
Figure 4. Rainfall simulations in Montes de Málaga (Andalucía, Spain).
3.3.2. Els Hostalest de Pierola (Penedès)
The aim of the simulations was to evaluate the variability of infiltration along the slope due todisturbances created by land leveling operations. The simulation carried out in this experiment wasquite similar to that performed in Málaga: six rainfall simulations (Figure 5) on three different pointsalong the slope (top, middle and foot), with two replications in each of them. The simulations weredone in June (2010) with a rainfall intensity ranging between 48 and 70 mm¨h´1, with a duration of60 minutes, although after 40 minutes a constant runoff volume was reached.
Figure 5. Rainfall simulations in Els Hostalest de Pierola (Penedès, Spain).

Hydrology 2016, 3, 6 11 of 19
The slope of the study area was 9.8 ˘ 4˝ with scarce soil cover (vegetation cover of 8.7 ˘ 21.2%and stone cover of 11 ˘ 1.6%). Soil moisture was 23.1 ˘ 11.2% and roughness was 1.7 ˘ 0.8%.
The average soil loss was 2.73 ˘ 0.86 g¨m´2¨h´1 with maximum values of 3.54 g¨m´2¨h´1.Surface flow was 0.21˘ 0.06 L¨m´2¨h´1. These results meant suspended sediment load concentrationsof 13.27˘0.6 g¨L¨m´2¨h´1, with the highest values being14.77 g¨L¨m´2¨h´1.
Finally, runoff coefficient showed an average value of 43.8 ˘ 16% with a maximum value of 62.7%and infiltration averaged 56.3 ˘ 16% with values of up to 80%.
3.3.3. Moixent (Valencia, Spain)
The aim of this study was to measure the immediate effect of barley straw mulch on soil erosionand to detect the runoff processes. Sixteen rainfall experiments during the first days of July 2015were conducted (Figure 6). Similar to the vineyard in Ruwer-Mosel valley, the experiment appliedin this Mediterranean vineyard consisted of thirty minutes duration and intervals of five minutes tocollect samples. This period corresponded with the driest period of the summer and before the vintage.Rainfall intensity was 40 mm¨h´1.
Figure 6. Rainfall simulations in Moixent (Valencia, Spain).
All experiments were carried out on lands with low slopes (2.5 ˘ 1.03˝), low vegetation cover(1.5 ˘ 2%) and low stone cover (21.1 ˘ 3.8%).
At the beginning, during the first 10 minutes, any runoff was noted. After that time, the averageSSL was 6.86 ˘ 7.5 g¨m´2¨h´1 with a maximum of 16.36 g¨m´2¨h´1. The average surface flow was1.17 ˘ 1.4 L¨m´2¨h´1 with a maximum value of 3.35 L¨m´2¨h´1. This resulted in an average SSC of6.2 ˘ 0.9 g¨L¨m´2¨h´1 with a maximum of 6.91 g¨L¨m´2¨h´1.
In this study, in most cases, high infiltration rates (81.7 ˘ 21.3%) were observed. However, on afew occasions, runoff coefficients higher than 50% were also registered.

Hydrology 2016, 3, 6 12 of 19
3.3.4. Villamediana de Iregua (La Rioja)
The goal of the rainfall simulations carried out in La Rioja was to measure the response of thesoil to the effects of wheel tracks. Twenty-nine rainfall simulations were carried out in September,coinciding with the lowest soil moisture values (5–6%). The simulations had a rainfall intensitybetween <50 and >70 mm¨h´1.
There was no vegetation cover, while a stone cover of 12.7 ˘ 16.2% was noted. The slope of theplots was 4.6 ˘ 3˝ and with a SSW aspect.
Results did not show any surface flow and soil loss during the first five minutes of the experiment(Figure 7). However, after that time period, the average soil loss was 10.4 ˘ 8.3 g¨m´2¨h´1 with amaximum of 25.4 g¨m´2¨h´1. With respect to surface flow, 1.9˘ 1 L¨m´2¨h´1 (max. of 2.4 L¨m´2¨h´1)was observed. As a result, a suspended sediment load concentration of 4.1 ˘ 2.1 g¨L¨m´2¨h´1
was obtained.The experiments showed high variation in the average runoff coefficient (66.7 ˘ 32.8%) and
infiltration (33.3 ˘ 32.8%).
Figure 7. Rainfall simulations in Villamediana de Iregua (La Rioja, Spain).
3.3.5. Campo Real (Madrid)
Nine rainfall simulations were run on test plots with different land managements: (i) three withconventional tillage with tractors; (ii) three with secondary vegetation cover of Brachypodium distachyon;and (iii) three with annual barley (Hordeum vulgare L.). The experiments were conducted in summerafter the spring soil tillage and in autumn before the fall soil tillage.The rainfall simulation durationswere 15 minutes with intervals of one minute. Furthermore, measurements were also performedbetween 15 and 20 minutes to record the possible remaining runoff and soil loss after rainfall ended(inertia). Rainfall intensity was 130 mm¨h´1.
Other envirommental plot characteristics during the experiments were 14˝ slope, 40.5 ˘ 33.4%average vegetation cover and 17% stone cover.
Results (Figure 8) showed an average SSL of 2.13 ˘ 1.18 g¨m´2¨h´1 with a maximum of3.15 g¨m´2¨h´1. Surface flow average was 2.54˘ 1 g¨L¨m´2¨h´1 with high values of 3.76 L¨m´2¨h´1.An average sediment concentration of 0.93 ˘ 0.6 g¨L¨m´2¨h´1 was noted. High infiltration(86.4 ˘ 7.6%) and a low runoff coefficient (13.6 ˘ 7.6%) were also observed.

Hydrology 2016, 3, 6 13 of 19
Figure 8. Rainfall simulations in Campo Real (Madrid, Spain).
3.4. Final Comparison
Different results were observed during the first 15 minutes of each rainfall simulation experiment(Table 3). High soil losses were observed in Montes de Málaga and Villamediana de Iregua (2.44 and2.58 g¨m´2¨h´1, respectively). However, Waldrach, Moixent and Montagne de Reims obtained lowrates due to the high infiltration coefficients (near 100%). Finally, high values of runoff were observedfor Villamediana de Iregua and Els Hostalest de Pierola (between 22 and 54%).
Finally, a Spearman’s rank correlation coefficient was calculated for these data to analyze thepossible relationship between independent (plot, rainfall intensity and environmental conditions) anddependent (SSL, SF, SSC, RC, and IC) variables (Table 4).
First, it can observe that the plot size obtained a correlation between 0.519 and 0.593 with thesurface flow (SF) and the runoff coefficient. Furthermore, correlation between an increase of the SSLand an increase in runoff and a decrease in infiltration were noted (0.607 and ´0.607, respectively). SFand SSC showed relationships with a decrease of the soil moisture inside the plot, ´0.522 and ´0.725,respectively. Finally, with a decrease in the percentage of slope and vegetation cover (´0.613 and´0.667), an increase of SSC was noted.
Table 3. Rainfall simulation results during the first 15 minutes.
Waldrach(Mosel-Ruwer,
Trier)
Montagnede Reims
(Champagne)
Montes deMálaga
(Málaga)
Els Hostalestde Pierola(Penedés)
Moixent(Valencia)
Villamedianade Iregua(La Rioja)
Campo Real(Madrid)
RI1 0.9 ˘ 1.4 0.77 ˘ 0.1 1.83 ˘ 0 0.29 ˘ 0 0.9 ˘ 1.4 0.65 ˘ 0 10.29 ˘ 0.9Plot2 0.28 0.25 0.28 0.6 0.28 0.45 2SSL3 0.17 ˘ 0 0.12 ˘ 0.01 2.44 ˘ 3.8 1.4 ˘ 0.5 0.11 ˘ 0.2 2.58 ˘ 2.9 1.33 ˘ 0.3SF4 0.15 ˘ 0.1 0.08 ˘ 0.1 0.15 ˘ 1 0.1 ˘ 0 0.12 ˘ 0.2 1.56 ˘ 1.6 1.37 ˘ 0.7SSC5 8.97 ˘ 2.6 1.65 ˘ 0.2 8.44 ˘ 11.8 13.48 ˘ 0.4 2.15 ˘ 3.8 1.35 ˘ 2.3 1.15 ˘ 0.5RC6 2.3 ˘ 1.1 3.7 ˘ 0.9 2.3 ˘ 2.4 22 ˘ 8.8 2 ˘ 3.3 53.9 ˘ 46.8 13.6 ˘ 7.6IC7 97.7 ˘ 1.1 96.3 ˘ 0.9 97.7 ˘ 2.4 78 ˘ 8.8 98.1 ˘ 3.3 46.2 ˘ 46.8 86.4 ˘ 7.6
1 = Rainfall intensity L¨ 5¨ min´1; 2 = Plot size (m2); 3 = Suspended sediment load (g¨ m´2¨ h´1); 4 = Surfaceflow (L¨ m´2¨ h´1); 5 = Suspended sediment load concentration (g¨ L¨ m´2¨ h´1); 6 = Runoff coefficient (%);7 = Infiltration coefficient (%).

Hydrology 2016, 3, 6 14 of 19
Table 4. Spearman correlation coefficient of the whole dataset.
SSL3 SF4 SSC5 RC6 IC7 Slope Vegetationcover (%)
Stonecover (%)
Roughness(%)
Soilmoisture (%)
RI1 ´0.18 0.324 ´0.36 ´0.541 0.541 0.227 0.338 0.391 ´0.026 ´0.426Plot2 0.482 0.519 ´0.185 0.593 ´0.593 ´0.449 ´0.368 ´0.823 0.395 0.044SSL3 - 0.536 ´0.036 0.607 ´0.607 ´0.126 ´0.406 ´0.523 ´0.051 0.232SF4 0.536 - ´0.464 0.321 ´0.321 ´0.216 ´0.464 ´0.252 0.051 ´0.522SSC5 ´0.036 ´0.464 - 0.179 ´0.179 ´0.613 ´0.667 ´0.432 0.41 ´0.725RC6 0.607 0.321 0.179 - 0.321 0.018 ´0.116 ´0.018 0.205 0.406IC7 0.541 ´0.593 ´0.607 -0.321 - ´0.018 0.116 0.018 ´0.205 ´0.406
1 = Rainfall intensity L¨ 5 min´1; 2 = Plot size (m2); 3 = Suspended sediment load (g¨ m´2¨ h´1); 4 = Surfaceflow (L¨ m´2¨ h´1); 5 = Suspended sediment load concentration (g¨ L¨ m´2¨ h´1); 6 = Runoff coefficient (%);7 = Infiltration coefficient (%); Grey colors show the highest correlations of the whole dataset.
4. Discussions
Different questions arose referring to the representativeness of rainfall intensity used in theexperiments, the influence of the plot size on soil losses and runoff, or the duration of the experiments.It was also observed that there is a high variability in soil detached in each experiment, whichranged from an average value of 0.13 g¨m´2¨h´1 in Montagne de Reims (Champagne, France) to10.4 g¨m´2¨h´1 in Villamediana de Iregua (La Rioja, Spain), but with maximum soil loss up to25 g¨m´2¨h´1 (Villamediana de Iregua, La Rioja). The average surface flow was between0.21 L¨m´2¨h´1 at Ruwer-Mosel valley (Trier, Germany) and 1.93 L¨m´2¨h´1 at Villamediana deIregua (La Rioja, Spain). Differences were observed for the values of SSC. Els Hostalest de Pierola(Penedès, Spain) showed high values (13.3 g¨L¨m´2¨h´1). The lowest results were found in CampoReal (Madrid, Spain) and in Montagne de Reims with (Champagne, France) with 0.9 g¨L¨m´2¨h´1,although they applied high rainfall intensities.
The average runoff coefficient ranged between 3.24% (Ruwer-Mosel valley, Trier) and 66.7%(Villamediana de Iregua, La Rioja), with a maximum value of 84.6% (Villamediana de Iregua, La Rioja).This is especially important in areas of water scarcity.
After understanding the context of the rainfall simulation experiments of each investigationgroup (rainfall simulators, methods and study areas), homogenizing their data sheets in intervals offive minutes, and transforming all values into m2¨h´1, the problematic of soil erosion processes inEuropean vineyards has been observed.
The experiments carried out under different soil tillage conditions and those carried out withdifferent soil covers allowed us to confirm not only the effect of cover to reduce soil erosion [20], butalso the utility of using rainfall simulations to evaluate these effects [39,57,60,61,64,66]. Apart fromthese findings, one important question for the general discussion has not yet been clearly answered:how representative are the data for a general diagnostic about the most sustainable practices inEuropean vineyards? Three causes for this problem could be proposed.
First, how many replicates must be done and where should the experiments be performed in anexperimental area? High standard deviations in all experiments and an elevated variability of thetrends have been shown. In many cases, runoff coefficients did not show a clear trend to delimit thisparameter. Therefore, it may be important to carry out different repetitions or to increase the durationuntil a constant steady rate of runoff and suspended sediment load is achieved.
Second, the variability of soil surface components and soil tillage practices were determinanttoo. When and where should we conduct rainfall simulations: (i) before, during or after the vintage?(ii) On the top, middle or foot slope? (iii) In the rows or in the inter-rows? (iv) Which environmentalcharacteristics must be considered on the plots? These responses would be possible: (i) to characterizeat least all the different surface components (and their spatial and temporal variability during theyear); (ii) to study with soil analysis if there are differences between the different parts of the slope andin the rows or inter-rows; and (iii) to control exactly for the work schedule of the vine-growers.

Hydrology 2016, 3, 6 15 of 19
Third, we have observed that after applying different rainfall simulators (drop sizes and velocities,drop kinetic energy, plot forms and sizes, field of application, methodologies, etc.), homogenizing theintervals of the rainfall and understanding the concrete specifications from each study area, it wouldbe difficult directly to conduct any quantitative diagnostics and comparisons. With the Spearmancoefficient, for example, correlations between rainfall intensity and plot size were noted. Therefore, asIserloh et al. observed [49,50], there is influence between the results and the technical characteristics ofthe rainfall simulators. It is clear that the most important reason for this study is to demonstrate thenecessity of a standard rainfall simulator and methodology.
In the future, following this investigation, it is necessary to: (i) make quantitative analysesand comparisons between different study areas; (ii) calculate how many simulations and underwhich environmental and human conditions must be appropriated to develop rainfall simulationcampaigns; (iii) spend time recollecting information, sampling methods and data treatments; and(iv) avoid interpretation errors and information losses after calculating averages and grouping thedifferent intervals.
5. Conclusions
This collection of rainfall simulations in different contexts offers a wide range of aspects thatcan be analyzed concerning the magnitude of soil erosion processes in European wine-growing areas.The results shown in these rainfall simulation experiments allowed us to confirm that due to soilcharacteristics in which the experiments were done: (i) high infiltration and low runoff coefficients maybe recorded, as well as the dynamic within the rainfall; and (ii) surface and sub-surface flow dynamicscontrolled the time at which runoff started and total runoff recorded; however, (iii) higher runoffrates have been indicated in other studies in the same vitivinicultural areas, when soil have highersilt contents. In addition to soil characteristics, the rainfall intensity and duration were additionalcontrol factors.
Acknowledgments: We acknowledge all the co-authors for the fast and friendly response to take part in thispaper and their useful suggestions and corrections. Furthermore, we also thank the Caixa-Bank and DAAD(Deutscher Akademischer Austauschdienst) for the Scholarship grant awarded to J. Rodrigo-Comino.
Author Contributions: Jesus Rodrigo Comino wrote the paper, performed the experiments, analyzed thedata and coordinated the data collection. Thomas Iserloh performed and designed the experiments andsupported Jesus Rodrigo Comino in analyzing the data, writing and proofreading the paper. Johannes Ries andJosé Damian Ruiz Sinoga designed the experiments and did the final proofreading. All others co-authorscontributed by the same extend in performing the experiments, providing and analyzing the data as wellas proofreading.
Conflicts of Interest: The authors declare no conflict of interest.
References
1. Fischer, U.; Roth, D.; Christmann, M. The impact of geographic origin, vintage and wine estate on sensoryproperties of Vitis vinifera cv. Riesling wines. Food Qual. Prefer. 1999, 10, 281–288. [CrossRef]
2. Resolution OIV/VITI 333/2010 Definition of vitivinicultural “Terroir”. The General Director of the OIV. In;Tbilisi (Georgia). 2010.
3. Van Leeuwen, C.; Bois, B.; de Resseguier, L.; Roby, J.P. New Methods and Technologies to Describe theEnvironment in Terroir Studies. Available online: http://terroir2010.entecra.it/atti/pdf/session2.pdf(accessed on 6 February 2016).
4. Cadot, Y.; Caillé, S.; Thiollet-Scholtus, M.; Samson, A.; Barbeau, G.; Cheynier, V. Characterisation of typicalityfor wines related to terroir by conceptual and by perceptual representations: An application to red winesfrom the Loire Valley. Food Qual. Prefer. 2012, 24, 48–58. [CrossRef]
5. Martínez-Casasnovas, J.A.; Ramos, M.C.; García-Hernández, D. Effects of land-use changes in vegetationcover and sidewall erosion in a gully head of the Penedès region (northeast Spain). Earth Surf. Process. Landf.2009, 34, 1927–1937. [CrossRef]
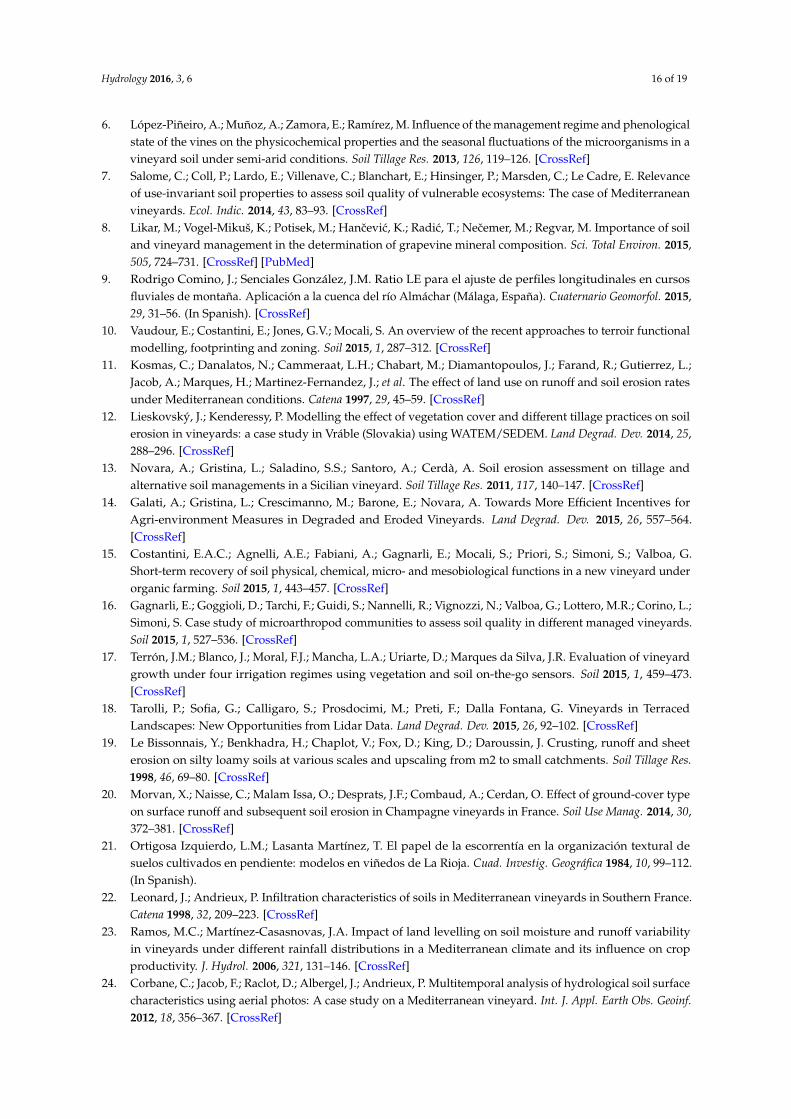
Hydrology 2016, 3, 6 16 of 19
6. López-Piñeiro, A.; Muñoz, A.; Zamora, E.; Ramírez, M. Influence of the management regime and phenologicalstate of the vines on the physicochemical properties and the seasonal fluctuations of the microorganisms in avineyard soil under semi-arid conditions. Soil Tillage Res. 2013, 126, 119–126. [CrossRef]
7. Salome, C.; Coll, P.; Lardo, E.; Villenave, C.; Blanchart, E.; Hinsinger, P.; Marsden, C.; Le Cadre, E. Relevanceof use-invariant soil properties to assess soil quality of vulnerable ecosystems: The case of Mediterraneanvineyards. Ecol. Indic. 2014, 43, 83–93. [CrossRef]
8. Likar, M.; Vogel-Mikuš, K.; Potisek, M.; Hancevic, K.; Radic, T.; Necemer, M.; Regvar, M. Importance of soiland vineyard management in the determination of grapevine mineral composition. Sci. Total Environ. 2015,505, 724–731. [CrossRef] [PubMed]
9. Rodrigo Comino, J.; Senciales González, J.M. Ratio LE para el ajuste de perfiles longitudinales en cursosfluviales de montaña. Aplicación a la cuenca del río Almáchar (Málaga, España). Cuaternario Geomorfol. 2015,29, 31–56. (In Spanish). [CrossRef]
10. Vaudour, E.; Costantini, E.; Jones, G.V.; Mocali, S. An overview of the recent approaches to terroir functionalmodelling, footprinting and zoning. Soil 2015, 1, 287–312. [CrossRef]
11. Kosmas, C.; Danalatos, N.; Cammeraat, L.H.; Chabart, M.; Diamantopoulos, J.; Farand, R.; Gutierrez, L.;Jacob, A.; Marques, H.; Martinez-Fernandez, J.; et al. The effect of land use on runoff and soil erosion ratesunder Mediterranean conditions. Catena 1997, 29, 45–59. [CrossRef]
12. Lieskovský, J.; Kenderessy, P. Modelling the effect of vegetation cover and different tillage practices on soilerosion in vineyards: a case study in Vráble (Slovakia) using WATEM/SEDEM. Land Degrad. Dev. 2014, 25,288–296. [CrossRef]
13. Novara, A.; Gristina, L.; Saladino, S.S.; Santoro, A.; Cerdà, A. Soil erosion assessment on tillage andalternative soil managements in a Sicilian vineyard. Soil Tillage Res. 2011, 117, 140–147. [CrossRef]
14. Galati, A.; Gristina, L.; Crescimanno, M.; Barone, E.; Novara, A. Towards More Efficient Incentives forAgri-environment Measures in Degraded and Eroded Vineyards. Land Degrad. Dev. 2015, 26, 557–564.[CrossRef]
15. Costantini, E.A.C.; Agnelli, A.E.; Fabiani, A.; Gagnarli, E.; Mocali, S.; Priori, S.; Simoni, S.; Valboa, G.Short-term recovery of soil physical, chemical, micro- and mesobiological functions in a new vineyard underorganic farming. Soil 2015, 1, 443–457. [CrossRef]
16. Gagnarli, E.; Goggioli, D.; Tarchi, F.; Guidi, S.; Nannelli, R.; Vignozzi, N.; Valboa, G.; Lottero, M.R.; Corino, L.;Simoni, S. Case study of microarthropod communities to assess soil quality in different managed vineyards.Soil 2015, 1, 527–536. [CrossRef]
17. Terrón, J.M.; Blanco, J.; Moral, F.J.; Mancha, L.A.; Uriarte, D.; Marques da Silva, J.R. Evaluation of vineyardgrowth under four irrigation regimes using vegetation and soil on-the-go sensors. Soil 2015, 1, 459–473.[CrossRef]
18. Tarolli, P.; Sofia, G.; Calligaro, S.; Prosdocimi, M.; Preti, F.; Dalla Fontana, G. Vineyards in TerracedLandscapes: New Opportunities from Lidar Data. Land Degrad. Dev. 2015, 26, 92–102. [CrossRef]
19. Le Bissonnais, Y.; Benkhadra, H.; Chaplot, V.; Fox, D.; King, D.; Daroussin, J. Crusting, runoff and sheeterosion on silty loamy soils at various scales and upscaling from m2 to small catchments. Soil Tillage Res.1998, 46, 69–80. [CrossRef]
20. Morvan, X.; Naisse, C.; Malam Issa, O.; Desprats, J.F.; Combaud, A.; Cerdan, O. Effect of ground-cover typeon surface runoff and subsequent soil erosion in Champagne vineyards in France. Soil Use Manag. 2014, 30,372–381. [CrossRef]
21. Ortigosa Izquierdo, L.M.; Lasanta Martínez, T. El papel de la escorrentía en la organización textural desuelos cultivados en pendiente: modelos en viñedos de La Rioja. Cuad. Investig. Geográfica 1984, 10, 99–112.(In Spanish).
22. Leonard, J.; Andrieux, P. Infiltration characteristics of soils in Mediterranean vineyards in Southern France.Catena 1998, 32, 209–223. [CrossRef]
23. Ramos, M.C.; Martínez-Casasnovas, J.A. Impact of land levelling on soil moisture and runoff variabilityin vineyards under different rainfall distributions in a Mediterranean climate and its influence on cropproductivity. J. Hydrol. 2006, 321, 131–146. [CrossRef]
24. Corbane, C.; Jacob, F.; Raclot, D.; Albergel, J.; Andrieux, P. Multitemporal analysis of hydrological soil surfacecharacteristics using aerial photos: A case study on a Mediterranean vineyard. Int. J. Appl. Earth Obs. Geoinf.2012, 18, 356–367. [CrossRef]

Hydrology 2016, 3, 6 17 of 19
25. Biddoccu, M.; Ferraris, S.; Cavallo, E.; Opsi, F.; Previati, M.; Canone, D. Hillslope Vineyard Rainfall-RunoffMeasurements in Relation to Soil Infiltration and Water Content. Procedia Environ. Sci. 2013, 19, 351–360.[CrossRef]
26. Cerdà, A.; González-Pelayo, A.; Giménez Morera, A.; Jordán, A.; Pereira, P.; Novara, A.; Brevik, E.C.;Prosdocimi, M.; Mahmoodabadi, M.; Keesstra, S.; et al. The use of barley straw residues to avoid higherosion and runoff rates on persimmon plantations in Eastern Spain under low frequency – high magnitudesimulated rainfall events. Soil Res. 2015. in press.
27. Casalí, J.; Giménez, R.; De Santisteban, L.; Álvarez-Mozos, J.; Mena, J.; Del Valle de Lersundi, J. Determinationof long-term erosion rates in vineyards of Navarre (Spain) using botanical benchmarks. Catena 2009, 78,12–19. [CrossRef]
28. Bruggisser, O.T.; Schmidt-Entling, M.H.; Bacher, S. Effects of vineyard management on biodiversity at threetrophic levels. Biol. Conserv. 2010, 143, 1521–1528. [CrossRef]
29. Navel, A.; Martins, J.M.F. Effect of long term organic amendments and vegetation of vineyard soils on themicroscale distribution and biogeochemistry of copper. Sci. Total Environ. 2014, 466–467, 681–689. [CrossRef][PubMed]
30. Quiquerez, A.; Chevigny, E.; Allemand, P.; Curmi, P.; Petit, C.; Grandjean, P. Assessing the impact of soilsurface characteristics on vineyard erosion from very high spatial resolution aerial images (Côte de Beaune,Burgundy, France). Catena 2014, 116, 163–172. [CrossRef]
31. Cerdà, A. Soil erosion after land abandonment in a semiarid environment of southeastern Spain. Arid SoilRes. Rehabil. 1997, 11, 163–176. [CrossRef]
32. Cerdà, A. The effect of patchy distribution of Stipa tenacissim aL. on runoff and erosion. J. Arid Environ.1997, 36, 37–51. [CrossRef]
33. Cerdà, A. Effect of climate on surface flow along a climatological gradient in Israel: a field rainfall simulationapproach. J. Arid Environ. 1998, 38, 145–159. [CrossRef]
34. Cerdà, A. Relationships between climate and soil hydrological and erosional characteristics along climaticgradients in Mediterranean limestone areas. Geomorphology 1998, 25, 123–134. [CrossRef]
35. Cerdà, A.; Giménez Morera, A.; Bodí, M.B.; Burguet, M.; García López, J.; Jovani, C.; Segura, M. Pérdida desuelo y agua bajo cubierta de Quercus Coccifera en la Sierra de Enguera. Valencia. Cuaternario Geomorfol.Rev. Soc. Esp. Geomorfol. Asoc. Esp. Para El Estud. Cuaternario 2010, 24, 11–21. (In Spanish).
36. De Lima, J.L.M.P.; Singh, V.P. The influence of the pattern of moving rainstorms on overland flow. Adv. WaterResour. 2002, 25, 817–828. [CrossRef]
37. De Lima, J.L.M.P.; Singh, V.P.; de Lima, M.I.P. The influence of storm movement on water erosion: stormdirection and velocity effects. Catena 2003, 52, 39–56. [CrossRef]
38. Montenegro, A.A.A.; Abrantes, J.R.C.B.; de Lima, J.L.M.P.; Singh, V.P.; Santos, T.E.M. Impact of mulching onsoil and water dynamics under intermittent simulated rainfall. Catena 2013, 109, 139–149. [CrossRef]
39. Arnaez, J.; Lasanta, T.; Ruiz-Flaño, P.; Ortigosa, L. Factors affecting runoff and erosion under simulatedrainfall in Mediterranean vineyards. Soil Tillage Res. 2007, 93, 324–334. [CrossRef]
40. Seeger, M. Uncertainty of factors determining runoff and erosion processes as quantified by rainfallsimulations. Catena 2007, 71, 56–67. [CrossRef]
41. Jordán, A.; Martínez-Zavala, L. Soil loss and runoff rates on unpaved forest roads in southern Spain aftersimulated rainfall. For. Ecol. Manag. 2008, 255, 913–919. [CrossRef]
42. León, J.; Echeverría, M.T.; Badía, D.; Martí, C.; Álvarez, C.J. Effectiveness of wood chips cover at reducingerosion in two contrasted burnt soils. Z. Für Geomorphol. Suppl. 2013, 57, 27–37. [CrossRef]
43. Wirtz, S.; Iserloh, T.; Rock, G.; Hansen, R.; Marzen, M.; Seeger, M.; Betz, S.; Remke, A.; Wengel, R.;Butzen, V.; et al. Soil Erosion on Abandoned Land in Andalusia: A Comparison of Interrill- and Rill ErosionRates. ISRN Soil Sci. 2012, 2012, 1–16. [CrossRef]
44. Juras, R.; Pavlásek, J.; Ded, P.; Tomásek, V.; Máca, P. A portable simulator for investigating rain-on-snowevents. Z. Geomorphol. Suppl. 2013, 57, 73–89. [CrossRef]
45. Lassu, T.; Seeger, M.; Peters, P.; Keesstra, S.D. The Wageningen Rainfall Simulator: Set-up and Calibrationof an Indoor Nozzle-Type Rainfall Simulator for Soil Erosion Studies. Land Degrad. Dev. 2015, 26, 604–612.[CrossRef]
46. Xiao, L.; Hu, Y.; Greenwood, P.; Kuhn, N.J. A Combined Raindrop Aggregate Destruction Test-Settling Tube(RADT-ST) Approach to Identify the Settling Velocity of Sediment. Hydrology 2015, 2, 176. [CrossRef]

Hydrology 2016, 3, 6 18 of 19
47. Zhang, X.; Li, Z.; Tang, Z.; Zeng, G.; Huang, J.; Guo, W.; Chen, X.; Hirsh, A. Effects of water erosion on theredistribution of soil organic carbon in the hilly red soil region of southern China. Geomorphology 2013, 197,137–144. [CrossRef]
48. Jin, K.; Cornelis, W.M.; Gabriels, D.; Baert, M.; Wu, H.J.; Schiettecatte, W.; Cai, D.X.; de Neve, S.; Jin, J.Y.;Hartmann, R.; et al. Residue cover and rainfall intensity effects on runoff soil organic carbon losses. Catena2009, 78, 81–86. [CrossRef]
49. Iserloh, T.; Ries, J.B.; Arnáez, J.; Boix-Fayos, C.; Butzen, V.; Cerdà, A.; Echeverría, M.T.; Fernández-Gálvez, J.;Fister, W.; Geißler, C.; et al. European small portable rainfall simulators: A comparison of rainfallcharacteristics. Catena 2013, 110, 100–112. [CrossRef]
50. Iserloh, T.; Ries, J.B.; Cerdà, A.; Echeverría, M.T.; Fister, W.; Geis sler, C.; Kuhn, N.J.; León, F.J.; Peters, P.;Schindewolf, M.; et al. Comparative measurements with seven rainfall simulators on uniform bare fallowland. Z. Für Geomorphol. Suppl. 2013, 57, 11–26. [CrossRef]
51. Ries, J.B.; Iserloh, T.; Seeger, M.; Gabriels, D. Rainfall simulations - constraints, needs and challenges for afuture use in soil erosion research. Z. Für Geomorphol. Suppl. 2013, 57, 1–10. [CrossRef]
52. Ries, J.B.; Seeger, M.; Iserloh, T.; Wistorf, S.; Fister, W. Calibration of simulated rainfall characteristics for thestudy of soil erosion on agricultural land. Soil Tillage Res. 2009, 106, 109–116. [CrossRef]
53. Rodrigo Comino, J.; Lassu, T.; González, J.M.S.; Sinoga, J.D.R.; Seeger, K.M.; Ries, J.B. Estudio de procesosgeomorfodinámicos en campos cultivados de viñedos sobre laderas en pendientes en el valle del Ruwer(Alemania). Cuad. Geográficos 2015, 54, 6–26. (In Spanish).
54. Rodrigo Comino, J.; Brings, C.; Lassu, T.; Iserloh, T.; Senciales, J.; Martínez Murillo, J.; Ruiz Sinoga, J.;Seeger, M.; Ries, J. Rainfall and human activity impacts on soil losses and rill erosion in vineyards (RuwerValley, Germany). Solid Earth 2015, 6, 823–837. [CrossRef]
55. Martínez Murillo, J.F.; Ruiz Sinoga, J.D. Incidencia de algunas propiedades físicas de suelos en su respuestahidrológica ante diferentes usos bajo condiciones mediterráneas (Montes de Málaga). Edafología 2003, 10,57–62. (In Spanish).
56. Prosdocimi, M.; Jordán, A.; Tarolli, P.; Keesstra, S.; Novara, A.; Cerdà, A. The immediate effectiveness ofbarley straw mulch in reducing soil erodibility and surface runoff generation in Mediterranean vineyards.Sci. Total Environ. 2016, 547, 323–330. [CrossRef] [PubMed]
57. Ramos, M.C.; Mulligan, M. Spatial modelling of the impact of climate variability on the annual soil moistureregime in a mechanized Mediterranean vineyard. J. Hydrol. 2005, 306, 287–301. [CrossRef]
58. Ramos, M.C. Soil water content and yield variability in vineyards of Mediterranean northeastern Spainaffected by mechanization and climate variability. Hydrol. Process. 2006, 20, 2271–2283. [CrossRef]
59. Ramos, M.C.; Martínez-Casasnovas, J.A. Soil loss and soil water content affected by land levelling in Penedèsvineyards, NE Spain. Catena 2007, 71, 210–217. [CrossRef]
60. Ramos, M.C.; Martínez-Casasnovas, J.A. Impacts of annual precipitation extremes on soil and nutrient lossesin vineyards of NE Spain. Hydrol. Process. 2009, 23, 224–235. [CrossRef]
61. Ramos, M.C.; Martínez-Casasnovas, J.A. Effects of field reorganisation on the spatial variability of runoffand erosion rates in vineyards of Northeastern Spain. Land Degrad. Dev. 2010, 21, 1–12. [CrossRef]
62. Camps, J.O.; Ramos, M.C. Grape harvest and yield responses to inter-annual changes in temperature andprecipitation in an area of north-east Spain with a Mediterranean climate. Int. J. Biometeorol. 2012, 56, 853–864.[CrossRef] [PubMed]
63. Ramos, M.C.; Benito, C.; Martínez-Casasnovas, J.A. Simulating soil conservation measures to control soil andnutrient losses in a small, vineyard dominated, basin. Agric. Ecosyst. Environ. 2015, 213, 194–208. [CrossRef]
64. Arnáez Vadillo, J.; Ruiz Flaño, P.; Lasanta Martínez, T.; Ortigosa Izquierdo, L.M.; Llorente Adán, J.A.; PascualBellido, N.E.; Lana-Renault Monreal, N. Efectos de las rodadas de tractores en la escorrentía y erosión desuelos en laderas cultivadas con viñedos. Cuad. Investig. Geográfica 2012, 38, 115–130. (In Spanish). [CrossRef]
65. Ruiz Colmenero, M. Influencia del empleo de cubiertas vegetales en viñedos en pendiente sobre elcontrol de la erosión. Available online: http://dspace.uah.es/dspace/handle/10017/17161 (accessedon 6 February 2016).
66. Ruiz-Colmenero, M.; Bienes, R.; Marques, M.J. Soil and water conservation dilemmas associated with theuse of green cover in steep vineyards. Soil Tillage Res. 2011, 117, 211–223. [CrossRef]

Hydrology 2016, 3, 6 19 of 19
67. Bienes, R.; Pérez, M.J.M.; Colmenero, M.R. Cultivos herbáceos, viñedos y olivares: el manejo tradicionaldel suelo y sus consecuencias en la erosión hídrica. Cuad. Investig. Geográfica 2012, 38, 49–74. (In Spanish).[CrossRef]
68. Marques, M.J.; Bienes, R.; Cuadrado, J.; Ruiz-Colmenero, M.; Barbero-Sierra, C.; Velasco, A. Analysingperceptions attitudes and responses of winegrowers about sustainable land management in Central Spain.Land Degrad. Dev. 2015, 26, 458–467. [CrossRef]
© 2016 by the authors; licensee MDPI, Basel, Switzerland. This article is an open accessarticle distributed under the terms and conditions of the Creative Commons by Attribution(CC-BY) license (http://creativecommons.org/licenses/by/4.0/).