Software review
7
Software Review Editor: Essam Mahmoud University of North Texas Microcomputers have grown dramatically in power and capacity, and this growth is expected to continue. With the rapid increase in the number of programs avail- able and with the continuous development of software, re- searchers, marketers, educators and managers face the problem of selecting the proper software. The choice of a marketing computer package is becoming more and more difficult as the market expands. Establishing databases about marketing software helps people to select the most ap- propriate package for a specific application by allowing them to reduce the number of packages to be considered according to certain criteria. In recognition of this situation the Journal of the Academy of Marketing Science is launching a new section concerned specifically with the evaluation of marketing and marketing related software for personal computers. This has resulted from a suggestion by the editor, Dr. William Darden, follow- ing the publication of the special section on "Sales Fore- casting and Decision Support Systems." In this first software review section a review of the software @RISK is presented. In later issues, it is planned to provide the reader with information about existing software and new developments as well. Given the dynamic nature of the soft- ware market the section editor invites readers to participate promptly so we all can benefit. Please write to the section editor at the address below concerning your expertise and knowledge of particular software indicating if you would like to be a software reviewer. In this respect, readers' help would be appreciated. Reviews are to be practically based rather than an abstract assessment of the manual as a descriptive document. Criteria for software evaluation can include, but need not be limited to, those detailed in Malhotra et al (1987): compatibility vendor maintenance and support materials functional capabilities documentation and ease of use multiple modes and networking multi-purpose functions data handling interpretation of output testing opportunities cost other special considerations that may be unique to marketing education applications. Publication of the reviews should not in any way be seen as an endorsement of a package. Further, prior to publication it is intended to send all reviews to the appropriate software vendors to allow their responses to be published following the reviewer's report. Readers may find the review by Mahmoud (1988) as well as Thompson's review of@RISK as examples of approaches that may be used. JAMS manuscript guidelines apply to the submission of software reviews. If you would like to contribute please contact: Essam Mahmoud, Editor College of Business Administration University of North Texas P. O. Box 13677 Denton, TX 76203-3677 (817) 565-3108 REFERENCES Malhotra, Naresh K., Armen Tashchian and Essam Mahmoud. 1987. "The Integration of Microcomputers in Marketing Research and Decision Making." Journal of the Academy of Marketing Science 15 (Summer): 69-82. Mahmoud, Essam, 1988. "Review of Selected Software for Sales Fore- casting and Decision Support Systems." Journal of the Academy of Marketing Science 16 (Fall): 104-109. @RISK Version 1.02--An Add-in Program for Modeling Uncertainty in Lotus 1-2-3 Reviewed by Kenneth N. Thompson University of North Texas What are our projected sales by quarter for the next fiscal year? What price will yield the highest overall profit contri- bution for our product? What level of sales do we need to JAMS 87 WINTER, 1990
-
Upload
essam-mahmoud -
Category
Documents
-
view
213 -
download
0
Transcript of Software review
Software Review
Editor: Essam Mahmoud University of North Texas
Microcomputers have grown dramatically in power and capacity, and this growth is expected to continue.
With the rapid increase in the number of programs avail- able and with the continuous development of software, re- searchers, marketers, educators and managers face the problem of selecting the proper software. The choice of a marketing computer package is becoming more and more difficult as the market expands. Establishing databases about marketing software helps people to select the most ap- propriate package for a specific application by allowing them to reduce the number of packages to be considered according to certain criteria.
In recognition of this situation the Journal of the Academy of Marketing Science is launching a new section concerned specifically with the evaluation of marketing and marketing related software for personal computers. This has resulted from a suggestion by the editor, Dr. William Darden, follow- ing the publication of the special section on "Sales Fore- casting and Decision Support Systems."
In this first software review section a review of the software @RISK is presented. In later issues, it is planned to provide the reader with information about existing software and new developments as well. Given the dynamic nature of the soft- ware market the section editor invites readers to participate promptly so we all can benefit. Please write to the section editor at the address below concerning your expertise and knowledge of particular software indicating if you would like to be a software reviewer. In this respect, readers' help would be appreciated.
Reviews are to be practically based rather than an abstract assessment of the manual as a descriptive document. Criteria for software evaluation can include, but need not be limited to, those detailed in Malhotra et al (1987):
�9 compatibility �9 vendor maintenance and support materials �9 functional capabilities �9 documentation and ease of use �9 multiple modes and networking �9 multi-purpose functions �9 data handling �9 interpretation of output �9 testing opportunities
cost other special considerations that may be unique to marketing education applications.
Publication of the reviews should not in any way be seen as an endorsement of a package. Further, prior to publication it is intended to send all reviews to the appropriate software vendors to allow their responses to be published following the reviewer's report.
Readers may find the review by Mahmoud (1988) as well as Thompson's review of@RISK as examples of approaches that may be used.
JAMS manuscript guidelines apply to the submission of software reviews. If you would like to contribute please contact:
Essam Mahmoud, Editor College of Business Administration
University of North Texas P. O. Box 13677
Denton, TX 76203-3677 (817) 565-3108
REFERENCES
Malhotra, Naresh K., Armen Tashchian and Essam Mahmoud. 1987. "The Integration of Microcomputers in Marketing Research and Decision Making." Journal of the Academy of Marketing Science 15 (Summer): 69-82.
Mahmoud, Essam, 1988. "Review of Selected Software for Sales Fore- casting and Decision Support Systems." Journal of the Academy of Marketing Science 16 (Fall): 104-109.
@RISK Version 1.02--An Add-in Program for Modeling Uncertainty in Lotus 1-2-3 Reviewed by Kenneth N. Thompson University of North Texas
What are our projected sales by quarter for the next fiscal year? What price will yield the highest overall profit contri- bution for our product? What level of sales do we need to
JAMS 87 WINTER, 1990

SOFTWARE REVIEW MAHMOUD
achieve break-even? How will customer demand change with our proposed price increase? These questions are typical of those posed daily by marketing managers. Moreover, virtual- ly every decision made in a marketing management context is characterized by some degree of uncertainty. Decision makers commonly ignore its existence, however. Instead, they employ simple point estimates for variables when build- ing decision models and, in turn, rely on point estimates of results emerging from these models for making decisions. These point estimates are only best guesses, or expected values. Actual results certainly will deviate from these es- timates, meaning that blind reliance on point estimates is dangerous, at best.
Previously available techniques for managing uncertainty in decision models have been computationally difficult, or have required the assistance of expensive main-frame or mini-computer hardware and software (e.g Monte Carlo simulation using programs such as Integrated Financial Plan- ning System (IFPS)). ~ There now exist inexpensive risk man- agerlaent software packages for micro computers that substantially alleviate these problems. One such program is @RISK Version 1.02 (pronounced "at risk"), a Monte Carlo simulation package designed as an add-in to Lotus 1-2-3. 2 @RISK is based on Monte Carlo simulation techniques popularized by Hertz (1979) and promises to be a breakthrough in modeling uncertainty.
How @RISK Works
@RISK is designed for use on IBM, IBM compatible, and
PS/2 computers. When installed on the user's hard drive, the program resides in the same directory as Lotus' systems files. @RISK provides the user with a series of additional menus and "@" functions for modeling uncertainty in any cell on the work sheet. These @ functions replace point estimates of variables in work sheet cells with probability distributions. @RISK enables users to select from 28 probability distri- butions. Example distributions include triangular, normal, uniform, discrete, exponential, logistic, and chi-square. Users can also define their own distributions with @RISK's @GENERAL and @ HISTOGM functions.
With @RISK, users operate in the Lotus environment. Accordingly, the basic decision model is built within Lotus as normal. However, probability distributions (specified by appropriate @functions) are substituted for point estimates in those cells where uncertainty is to be modeled. A simple pricing decision model illustrates the mechanics and power of@RISK. Assume the decision maker is interested in iden- tifying the better of two alternative prices for maximizing profits on a new product. Prices considered are $10.50 and $12.50 per unit. Assume also there is uncertainty about fixed and variable cost structures for the product. Anticipated var- iable costs are $3.50 per unit, but may go as high as $4.00 or as low as $3.00. Total fixed costs are expected to be $25,000, with a standard deviation of $1,000. Demand is expected to be 4,000 units at the $10.50 price (+/- 500 units). Finally, at the $12.50 price, expected demand is 3,250 units, with a possible range between 2,000 and 3,800 units.
Before viewing how the uncertainty implied in this scenario is analyzed using @RISK, it is instructive to ex- amine the results of a traditional analysis using only point
FIGURE 1 Traditional Point Estimate Decision Model
as Modeled in Lotus 1-2-3
A37: A
18 19 20 21 22 23 24 25 26 27 28 29 30 31 32 33 34 35 36 37 01-Mar-89 10:00 am
B
Price Demand in Units
Total Revenue
Total Fixed Costs Average Variable Costs Total Variable Costs
Total Costs
Profits
C D E F
Traditional Model Using Point Estimates
Pricel
$10.50 4,000
$42,000
$25,000 $3.50
$14,000
$39,000
$3,OOO
Price2
$12.50 3,250
$40,625
$25,000 $3.50
$11,375
$36,375
$4,250
READY
NUM
JAMS 88 WINTER, 1990
SOFTWARE REVIEW MAHMOUD
estimates. Figure 1 summarizes the model as it would appear in Lotus. Note that anticipated profits at the $10.50 price ($3,000) are substantially lower than those projected for the $12.50 price ($4,250).
When probability distributions are substituted for point estimates of costs and demand, a different result emerges. Referring to Figure 1, total fixed costs in cells D29 and F29 were modeled with a normal distribution possessing an ex- pected value of $25,000 and a standard deviation of $1,000. The appropriate @function for each cell is @NOR- MAL(25000,1000). Average variable costs for cells D30 and F30 were represented with the triangular distribution @TRI- ANG(3,3.5,4), where $3.50 is the expected average variable cost, the upper boundary is $4.00, and the lower boundary is $3.00 per unit. Demand levels at alternative prices were also represented with triangular distributions as follows:
Price = $10.50: @TRIANG(3500,4000,4500) (Cell D25) Price = $12.50: @TRIANG(2000,3250,3800) (Cell F25).
Once the model is specified with appropriate @functions in Lotus, users access @RISK's simulation functions by pressing a "hot" key (e.g. AIt-F7) to bring up @RISK's main menu. From this menu is selected, among others, the type of simulation desired (Monte Carlo or Latin Hypercube), the number of iterations to be completed (up to 32,767 are pos- sible), and the output cells containing the results of interest to the user. The output cells for this example are projected profits at each price (i.e. cells D35 and F35). For each output cell specified, @RISK automatically accumulates, and tem- porarily stores to disk, simulation results in the form of probability distributions.
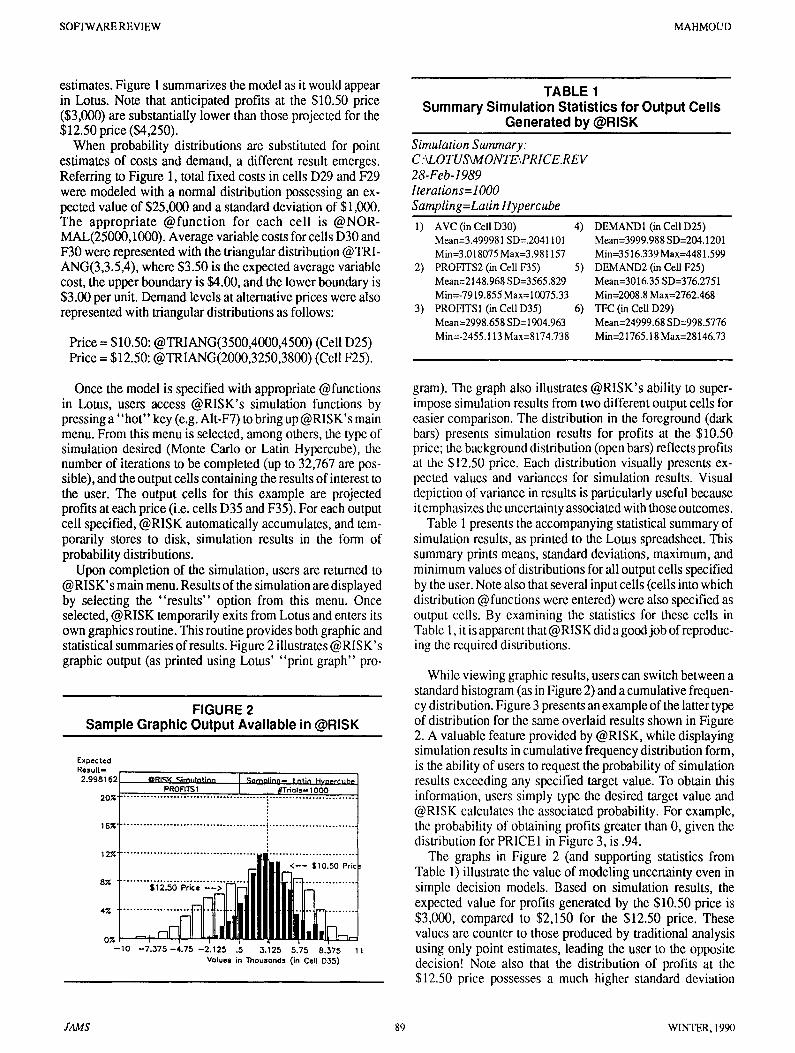
Upon completion of the simulation, users are returned to @RISK's main menu. Results of the simulation are displayed by selecting the "results" option from this menu. Once selected, @RISK temporarily exits from Lotus and enters its own graphics routine. This routine provides both graphic and statistical summaries of results. Figure 2 illustrates @RISK's graphic output (as printed using Lotus' "print graph" pro-
FIGURE 2 Sample Graphic Output Available in @RISK
Expected Result- 2.998162
20~'
16R'
8 ~
0% - 1 0
ORIr .~irntJlni'inn ~amnllnn~ I t~tln Hv~erc'ub~ PROFITS 1 , ~Trlols- 1000
J l l I I ILJr::~.
Ullillllllhn.,hlcl - 7 . 3 7 5 - 4 . 7 5 -2.125 .5 3.125 5.75 8.375
Values in Thousand= (in Cell D35)
TABLE 1 Summary Simulation Statistics for Output Cells
Generated by @RISK Simulation Summary: C ALOTUSkMONTE~PRICE.REV 28-Feb-1989 lterations= l O00 Sampling=Latin llypercube
l) AVC (in Cell D30) Mean=3.499981 SD=.2041101 Min=3.018075 Max=3.981157
2) PROFITS2 (in Cell t:35) Mean=2148.968 SD=3565.829 Min=-7919.855 Max= 10075.33
3) PROFITS1 (in CeI1D35) Mean=2998.658 SD= 1904.963 Min=-2455.113 Max=8174.738
4) DEMAND1 (in Cell D25) Mean=3999.988 SD=204.1201 Min=3516.339 Max=4481.599
5) DEMAND2 (in Cell F25) Mean=3016.35 SD=376.2751 Min=2008.8 Max=2762.468
6) TFC (in Cell D29) Mean=24999.68 SD=998.5776 Min=21765.18 Max=28146.73
gram). The graph also illustrates @RISK's ability to super- impose simulation results from two different output cells for easier comparison. The distribution in the foreground (dark bars) presents simulation results for profits at the $10.50 price; the background distribution (open bars) reflects profits at the $12.50 price. Each distribution visually presents ex- pected values and variances for simulation results. Visual depiction of variance in results is particularly useful because it emphasizes the uncertainty associated with those outcomes.
Table 1 presents the accompanying statistical summary of simulation results, as printed to the Lotus spreadsheet. This summary prints means, standard deviations, maximum, and minimum values of distributions for all output cells specified by the user. Note also that several input cells (cells into which distribution @ functions were entered) were also specified as output cells. By examining the statistics for these cells in Table 1, it is apparent that@RISK did a good job of reproduc- ing the required distributions.
While viewing graphic results, users can switch between a standard histogram (as in Figure 2) and a cumulative frequen- cy distribution. Figure 3 presents an example of the latter type of distribution for the same overlaid results shown in Figure 2. A valuable feature provided by @RISK, while displaying simulation results in cumulative frequency distribution form, is the ability of users to request the probability of simulation results exceeding any specified target value. To obtain this information, users simply type the desired target value and @RISK calculates the associated probability. For example, the probability of obtaining profits greater than 0, given the distribution for PRICE1 in Figure 3, is .94.
The graphs in Figure 2 (and supporting statistics from Table 1) illustrate the value of modeling uncertainty even in simple decision models. Based on simulation results, the expected value for profits generated by the $10.50 price is $3,000, compared to $2,150 for the $12.50 price. These values are counter to those produced by traditional analysis using only point estimates, leading the user to the opposite decision! Note also that the distribution of profits at the $12.50 price possesses a much higher standard deviation
rAMS 89 WINTER, 1990

SOFTWARE REVIEW MAHMOUD
FIGURE 3 Cumulative Frequency Distribution Produced by
@RISK
Expected R e s u l t -
2 . 9 9 8 1 6 2 [ (}RISK ~ |mu lo t lon J ~amn l i na - - Lat in Hvoercubr / PROnrSl I er,~,,,- looo
1 0 0 ' " ' ~ . . . . . . . . . . . . . . . . . . . . . . . . . . . . . . . 'l . . . . . . . . . . . . . . . . . . . . . . . . . . .
. i R s o x . . . . . . . . . . . . . . . . . . . . . . . . . . . . . . . . . . . . . . . . . J, . . . . . . . . . . . . . . . . . . . . . . . . . .
o ! R
A 6 0 ~ . . . . . . . . . . . . . . . . . . . . . . . . . . . . . . . . . . . . . . . . . J . . . . . . . . . . . . . . . . . . . . . . . . . .
i I
L 4 0 ~ " I
Y 2 0 ~ "
0 : ~ / I , , , . , ,
-- 10 - 4 . 7 5 .5 5 . 7 5 1 I Volues in Thousonds ( in Cell 0 3 5 )
($3,566), compared to profits based on the $10.50 price ($1,905). Risk averse decision makers may find the greater degree of certainty in profit projections for the $10.50 price to be quite attractive.
Program Evaluation
Several models were built in Lotus to test @RISK's per- formance using criteria outlined by Malhotra, Tashchian, and Mahmoud (1987). In addition to the simple pricing model above, a sales forecasting model and a new product business analysis model were simulated. Aspects of these simulations are discussed below.
Functional Capabilities of @RISK
@Functions. RISK can be employed to model uncertain- ty in virtually any application amenable to spread sheet modeling. @RISK possesses 28 @functions, each repre- senting a different probability distribution. Two additional @functions (@DEP and @INDEP) are provided to identify variable pairs that are correlated with one another for pur- poses of the simulation. @DEP specifies the dependent vari- able in the pair; @INDEP specifies the independent variable.
The arguments in all @functions are specified in the same manner as any standard @function in Lotus. Thus, actual numbers, cell references, or more complicated formulae are used to identify individual arguments in @functions. For example, a triangular distribution could be specified in any number of ways: @TRIANG(10,80,100); @TRI- ANG(B6,C6,D6); @TRIANG(B6+10), C6+A1, @SQRT(C9)); etc. This affords users tremendous flexibility when designing simulation models with numerous recurring values, values whose magnitudes depend on other cells in the spread sheet, or values users want to quickly change for multiple simulations.
Simulation Options. For simulations, users can select Monte Carlo or Latin Hypercube sampling options. Latin
Hypercube, the default setting, recreates probability distri- butions specified by @functions with fewer iterations than required with Monte Carlo sampling. Moreover, because of Latin Hypercube's stratified sampling approach, "low prob- ability outcomes" associated with the tails of many prob- ability distributions are more likely to be adequately sampled (McKay, Conover, and Beckman 1979).
Users can "seed" the random number generator in order to repeat the same random number sequence between simula- tions. This is valuable when users wish to test the impact of changing a single @function on simulation results. Seeding ensures that the sampling sequence for all distributions, ex- cept for the @ function that has been changed, is held constant. When the seed is set at "0" (default), @RISK chooses a random seed value between 0 and 1 to provide a close approximation to true random sampling.
Speed. The pricing simulation presented above possessed six input and eight output distributions. Using Latin Hyper- cube sampling and 1000 iterations, the simulation ran in one minute and 26 seconds. The new product business analysis model was much more complex, possessing 78 input and 12 output distributions. This model required 14 minutes and 51 seconds to simulate, using the same number of iterations and the same sampling technique.
All simulations were run on an IBM compatible computer possessing a 286 micro-processor running at 12mHz. The system also possessed a hard drive rated at a 22mSec access speed. A hard drive speeds the simulation and increases the size of simulation models that can be run, in that results are temporarily written to disk as the simulation progresses. Simulation speed can be further improved ifa math coproces- sor is present.
Sampling and Simulation Accuracy. Although all of its 28 probability functions could not be evaluated, several of those more likely to be used for modeling uncertainty in marketing decisions were examined. In every case, @RISK was able to generate sampling distributions conforming to those specified by the @function. Verifying that@RISK has effectively sampled from the desired distribution is ac- complished by requesting that the cell containing the input distribution also be an output cell. Graphical and statistical results for this cell then can be inspected to assess @RISK's ability to reproduce the specified distribution. Formulae for all @RISK's probability distributions are documented in Appendix A of @RISK's user's manual.
Hardware and Software Compatibility
@RISK is designed to run on any IBM, IBM compatible, or PS/2 computer. A hard drive is recommended, although @RISK will run on a two floppy drive system. To use @RISK's graphics capabilities, CGA, EGA, VGA, or Her- cules graphics capabilities are required.
As a Lotus add-in, @RISK appears to be compatible with that program. No problems were encountered during any test simulations. @RISK is currently upgrading to its next release (not available for evaluation at the time of this writing). In addition, a version compatible with Symphony is forthcom- ing.
Graphs produced by @RISK are advertised as exportable
JAMS 90 WINTER, 1990

SOFTWARE REVIEW MAHMOUD
to Lotus Freelance and other packages, such as WordPerfect, that support the .PIC format2 No problems were encountered by the reviewer when several graphs were exported to both Lotus Freelance and WordPerfect 5.0 for viewing and print- ing. All simulation results can be written to ASCII files for use with other programs. Test simulation output was written to an ASCII file and later used in both Lotus and Harvard Graphics?
Ease of Output Interpretation
A major strength of@RISK is the ease with which simula- tion results can be interpreted. Upon completion of a simula- tion, results are transferred to @RISK's graphics package. In @RISKGraph, users view results associated with single out- put cells as either standard histograms or cumulative prob- ability distributions. Users, however, are limited to overlaying only two distributions (either histograms or cumulative probability) in order to compare results for differ- ent output cells. It would be helpful to have the ability to compare three or four output distributions within the context of a single graph. Moreover, graphs cannot be customized for printing unless exported to another graphics package. Exam- ples of histograms, cumulative probability distributions, and graphic overlays as produced in @RISKGraph are contained in Figures 2 and 3.
Results for multiple output cells (specified as part of a range of cells) are presented in @RISKGraph as a series of superimposed line graphs that show expected values, one standard deviation, and 5 percent and 95 percent confidence limits. Figure 4 illustrates this graphic output for five years of the sales forecast simulation. Single cells within a specified output range (e.g. forecasted sales for a single year) can be highlighted and individually viewed as standard histogram or cumulative probability distributions.
@RISK produces a variety of statistics associated with output distributions. All statistics are available to users while viewing results in @RISKGraph. Statistics provided include expected value, standard deviation, variance, skewness, kur-
FIGURE 4 Graphic Results for a Range of Cells
' 0
?8
' ' i
!i'
4 % f, ( e II tli in k a r , : . f r e p 4 in Mr ! I t , ' ,hl ' tJ~!h ~ , t l Dev &r, uqd !,~ecrl, 5/g'~ F~erLent i les
tosis, maximum, minimum, range of possible results, prob- ability of a positive result, and probability of a negative result. In addition, users can request display of numeric frequency distributions associated with any graph. All statistics can be printed in hard copy form. Finally, an interactive feature is provided which allows users to determine probabilities as- sociated with target values on cumulative probability distri- butions.
All graphs produced by @RISK can be saved in .PIC format and printed directly in Lotus while @RISK is still attached. @RISK temporarily exits to Lotus Print Graph and returns to @RISK after hard copy has been generated.
Vendor Support
Palisade Corporation provides free telephone support for @RISK purchasers for the first three months of ownership. If a service agreement has been purchased (recommended for business and educational buyers), continuing telephone sup- port and free program upgrades are provided.
Documentation and Help Facilities
@RISK has clearly written documentation. Installation instructions walk the user easily and quickly through hard drive installation. Dual floppy installation procedures, how- ever, are somewhat confusing. A major strength of the manual is its overview of the concept of risk analysis. This clearly written chapter is geared to the practitioner who will use @RISK to enhance decision making. It reviews the essentials of risk analysis and provides the reader with a four-step procedure for incorporating risk analysis into spread sheet decision making.
As with most user's manuals, @RISK contains a tutorial that helps the novice user through all basic and advanced features of the program. The tutorial is interactive, requiring users to actually manipulate the program following directions provided in the manual.
The manual includes a chapter with applications of@RISK to actual business and professional decisions. Several exam- ples are relevant to marketing. The chapter discusses model- ing uncertainty around fixed trends, such as may be encountered in sales forecasting; handling increasing degrees of uncertainty in projecting future values of variables; and, modeling chance events during planning, such as the likelihood that competitors will enter the market.
The manual contains an excellent set of appendices that document Monte Carlo and Latin Hypercube techniques, and the formulae used for all sampling distributions sup- ported by the program. A glossary of terms, a bibliography on risk analysis, and an index round out the manual's con- tents.
The program has a very good on-line help system. While in @RISK, users can press " F I " to retrieve a help index from which topics can be selected. While in @RISKGraph, the help system is also keyed to specific menu items. Information on all @functions, menu items, and the general operation of the program is available on-line. The help facility is well constructed, reducing considerably the requirement to refer back to the user's manual when questions arise.
JAMS 91 WINTER, 1990

SOFI'WARE REVIEW MAHMOUD
Cost Considerations
The retail cost of the program is $395. However, Palisade offers an educational discount that brings the cost down to $200 for academicians. Site licenses and quantity discounts are also available for large scale users. Palisade also offers a plan allowing students to purchase @RISK for $50 per copy, if ordered in quantities of 20 or more. For volume purchases significantly greater than 20, the price will be even lower. Student versions are not abridged or restricted, and come with full documentation.
Recommended Program Modifications
Several modifications would improve the performance and value of@RISK. These include:
1. The option to simultaneously overlay multiple graphs for easy comparison. This would include automatic rescaling of all graphs to a common metric.
2. The option to customize graphs with data labels, titles, and axis labels.
3. A set of utilities that translate @RISK .PIC files to formats accepted by additional graphics programs, such as Harvard Graphics.
4. The incorporation of macros to allow users to automate @RISK functions.
5. Ability to generate custom hard-copy reports that include both @RISK graphs and selected statistics.
CONCLUSION
Marketing managers have long recognized the importance of managing risk in business decisions. However, modeling this uncertainty has been impractical, if not impossible, for many marketing situations. @RISK promises to be an excel- lent and practical tool, providing managers with a pragmatic means of risk assessment and management when making marketing decisions. Virtually all marketing decisions in- volve elements of risk. If decision makers can translate the decision into a simple spreadsheet oriented model, uncertain- ty can be assessed using @functions and simulation options available in @RISK.
APPENDIX
Information concerning @RISK can be obtained from: Palisade Corporation
2189 Elmira Rd. Newfield, NY 14867
(607) 564-9993
NOTES
1. Integrated Financial Planning System (IFPS) is a trademark of Execucom Corporation.
2. Lotus 1-2-3 is a trademark of Lotus Development Corporation. 3. Symphony and Lotus Freelance are trademarks of the Lotus
Development Corporation. WordPerfect is a trademark of the WordPerfect Corporation.
4. Harvard Graphics is a trademark of Software Publishing Corpo- ration.
REFERENCES
Hertz, David B. (1979), "Risk Analysis in Capital Investment," ttarvard Business Review, Vol. 57 (September-October), 169-181.
Malhotra, Naresh K., Annen Tashchian, and Essam Mahmoud (1987), "The Integration of Microcomputers in Marketing Research and Decision Making," Journal of the Academy of Marketing Science, Vol. 15, No. 2, 69-82.
McKay, M.D., W.J. Conover, and R.J. Beckman (1979), "A Comparison of Three Methods for Selecting Values for Input Variables in the Analysis of Output from a Computer Code," Technometrics, Vol. 21 I, 239-245.
Response to K. Thompson Review William T. Barton Vice President, Palisade Corporation
Dr. Thompson's review of@RISK Version 1.02 was well received by Palisade Corporation. We felt that he focused on the important aspects of the software and gave an accurate description of its capabilities. Most importantly, his decision to explain the product with an understandable modeling situa- tion deserves attention from the majority of reviewers that overlook this powerful review technique.
Palisade Corporation felt that it would be useful to the readers of the Journal of the Academy of Marketing Science to have some update information on the most current version of @RISK available. @RISK Version 1.5 was released in April 1989. Most of the modifications recommended by Dr. Thompson have been incorporated in this upgrade, as well as several important features not on his wish list.
As in earlier versions, @RISK Version 1.5 is a 1-2-3 add-in that lets users easily do powerful risk analysis and simulation modeling on new or existing 1-2-3 worksheets. The upgrade features to @RISK include the following: A powerful new analysis capability called "Sensitivity Simulation" lets a user easily see how sensitive risk analysis results are to changes in the input variables. For example, suppose you were using 1-2-3 and @RISK to look at the financial implications of introducing a new product. You might want to see how risk analysis results depend on different selling prices that you could choose for the new product. The Sensitivity Simulation feature lets you enter up to 25 different values fora variable-- using a new @function called @SIMTABLE--and then automatically runs a simulation for each value. @RISK's output routines then process the data from all simulations and present results to facilitate easy comparison of the risks associated with each value of the variable.
@RISK Version 1.5 also includes a number of new features that enhance the presentation and manipulation of output results. The user can configure the default presentation meth- od for all graphics and can customize graphics with labels prior to saving in .PIC format. The method of moving be-
JAMS 92 WINTER, 1990
SOFTWARE REVIEW MAHMOUD
tween output results has been enhanced to allow result selec- tion from a menu list. The new version eliminates the need to save result reports individually, giving the user the option to save all reports with a single save. Enhanced zoom and overlay capabilities as well as a new dam filtering option allow users to tailor the graphic appearance of results for both better presentation and data interpretation. @RISK's output module, @RISKGraph, now has a macro capability to make result manipulation and analysis more efficient through auto-
mation. Finally, @RISK Version 1.5 helps you catch worksheet modeling mistakes by recognizing errors and al- lowing you to trace your mistakes in 1-2-3.
Palisade is responsive to comments and criticisms for- warded to us by users. We would encourage all readers of the Journal of the Academy of Marketing Science who become @RISK users to keep us informed about their experiences with @RISK and to make suggestions for upgrade features.
JAMS 93 WINTER, 1990