Software Quality Metrics Aggregation - 41...
12
Software Quality Metrics Aggregation Aristides Dasso, Ana Funes Software Engineering Group Universidad Nacional de San Luis Ejército de los Andes 950 San Luis, Argentina {arisdas, afunes}@unsl.edu.ar Abstract. Evaluating Software Quality is a critical and very important aspect of software development. There are several metrics developed to assess different characteristics of a software system so as to evaluate its overall quality. One international standard for Software Quality is the ISO/IEC 9126 International Standard; this standard is “proposed to make sure the ‘quality of all software-intensive products’ including safety-critical systems where lives will be at jeopardy if software components fail to succeed.” However, there is no provision to integrate/aggregate different metrics into one value allowing the developer to comprehend rapidly the quality of a software product without having to refer to several different metrics. We propose in this work a way to aggregate different metrics into a single value using a Continuous Logic –the one proposed in Logic Score of Preference (LSP) method. Keywords: Software Engineering. Continuous Logic. Logic Score of Preferences. LSP Method. Software Quality Metrics. ISO/IEC 9126 Standard. 1 Introduction In every science and in every engineering branch, quantitative assessment is recognized to be an essential task. Software Engineering is no exception. Software metrics exist practically since the dawn of the area. They are measures of different aspects of software systems, namely size, complexity, quality, etc. The objectives of these metrics are multifold –they are used to assess costs at early stages of systems development, advances along the development, etc. A number of software metrics have been geared to analyze software quality –e. g. Source Lines Of Code (SLOC)– that have shown to be good metrics to predict defects in software –an important aspect of software quality since good quality is obviously linked to very few if none defects. The aggregation of different metrics to obtain a single value helps in the global evaluation of a task, project, etc. This need also arises when different metrics are used. The more traditional aggregation techniques are additive or similar, namely mean, median, or sum. Sometimes these techniques are too crude to be entirely useful. We think that the aggregation methodology should be clear to the analyst, but at the same time sophisticated enough to represent the different aspects of the underlying metrics used and flexible enough so the model can be easily adapted to new quality assurance requirements. Let us note that there are two sides to software metrics aggregation. One is when applying different metrics –or the same metric– at different levels of granularity of a given piece of software. The other is when applying different metrics –or the same metric– to different software artifacts intended for comparison purposes. In general all aggregation techniques apply to both. 13th Argentine Symposium on Software Engineering, ASSE 2012 41 JAIIO - ASSE 2012 - ISSN: 1850-2792 - Page 312
Transcript of Software Quality Metrics Aggregation - 41...

Software Quality Metrics Aggregation
Aristides Dasso, Ana Funes
Software Engineering Group
Universidad Nacional de San Luis
Ejército de los Andes 950
San Luis, Argentina {arisdas, afunes}@unsl.edu.ar
Abstract. Evaluating Software Quality is a critical and very important aspect of
software development. There are several metrics developed to assess different
characteristics of a software system so as to evaluate its overall quality. One
international standard for Software Quality is the ISO/IEC 9126 International
Standard; this standard is “proposed to make sure the ‘quality of all software-intensive
products’ including safety-critical systems where lives will be at jeopardy if software
components fail to succeed.” However, there is no provision to integrate/aggregate
different metrics into one value allowing the developer to comprehend rapidly the
quality of a software product without having to refer to several different metrics. We
propose in this work a way to aggregate different metrics into a single value using a
Continuous Logic –the one proposed in Logic Score of Preference (LSP) method.
Keywords: Software Engineering. Continuous Logic. Logic Score of Preferences.
LSP Method. Software Quality Metrics. ISO/IEC 9126 Standard.
1 Introduction
In every science and in every engineering branch, quantitative assessment is recognized to
be an essential task. Software Engineering is no exception. Software metrics exist
practically since the dawn of the area. They are measures of different aspects of software
systems, namely size, complexity, quality, etc. The objectives of these metrics are multifold
–they are used to assess costs at early stages of systems development, advances along the
development, etc.
A number of software metrics have been geared to analyze software quality –e. g. Source
Lines Of Code (SLOC)– that have shown to be good metrics to predict defects in software
–an important aspect of software quality since good quality is obviously linked to very few
if none defects.
The aggregation of different metrics to obtain a single value helps in the global
evaluation of a task, project, etc. This need also arises when different metrics are used.
The more traditional aggregation techniques are additive or similar, namely mean,
median, or sum. Sometimes these techniques are too crude to be entirely useful. We think
that the aggregation methodology should be clear to the analyst, but at the same time
sophisticated enough to represent the different aspects of the underlying metrics used and
flexible enough so the model can be easily adapted to new quality assurance requirements.
Let us note that there are two sides to software metrics aggregation. One is when
applying different metrics –or the same metric– at different levels of granularity of a given
piece of software. The other is when applying different metrics –or the same metric– to
different software artifacts intended for comparison purposes. In general all aggregation
techniques apply to both.
13th Argentine Symposium on Software Engineering, ASSE 2012
41 JAIIO - ASSE 2012 - ISSN: 1850-2792 - Page 312

Apart from the simplest strategies of metric aggregation, there are also a number of other
methods for aggregation using different techniques, such as those using indexes or
coefficients employed in other areas such as econometrics, e.g. Gini [18], Theil [2],
coefficients or even the Paretto principle [16].
Other approaches can be found in the literature that propose different methods to
aggregate metrics, either using a standard, such as ISO/IEC 9126 or other methodologies.
We summarize some of them below.
B. Vasilescu [3] analyzes several aggregation methods for the aggregation of software
metrics to measure software quality. This is done from two points of view –first a
theoretical analysis is done and then an empirical one is carried out.
In [14] Mordal-Manet et al present not only the problem that metrics alone are not
enough to characterize software quality but also an empirical model –the Squale model
[19]– for metric aggregation. This model has four levels adding practices as an intermediate
level between criteria and metrics that are the levels suggested in ISO 9126. For assessment
purposes Squale uses an evaluation scale that falls in the interval [0:3], it uses a weighted
average, and the function uses a constant to define hard, medium, or soft weighting.
L. Etaati et al in [15] employ a Fuzzy Group Analytical Network Process method to
integrate metrics to evaluate e-learning systems. This is a similar method to our proposal
however it does not use Continuous Logic functions; moreover the network is not as easy to
comprehend as the models obtained from the application of the LSP method.
Bearing the above in mind we have as a main goal to aggregate the data obtained from
different quality evaluation metrics in coherent groupings so as to get new singular values
that can in turn be aggregated again. The aggregation ends getting a single global indicator
for the software object under evaluation, being this object a software unit or an entire
software project.
To achieve this process we use operators from a Continuous Logic, specifically the
Logic employed by the LSP method that proposes the aggregation of preferences by using a
group of logic functions called Generalized Conjunction Disjunction (GCD) operators. So
we show here a model –based on the ISO/IEC 9126 international standard [7]– to aggregate
software quality metrics employing a Continuous Logic. This standard establishes a number
of requirements to evaluate software quality, however there is no prescription for the
aggregation of the different measurements proposed. Therefore, there exists the need to
propose an aggregation model to obtain a single value out the evaluation with different
metrics.
The rest of the article is organized as follows. In Section 2 we give an overview of both
the ISO/IEC 9126 standard and of the LSP method. In Section 3 we describe our proposal
and illustrate it with some examples. A discussion on the approach, conclusions and future
directions for research are given in Section 4.
2 The ISO/IEC 9126 Standard and the LSP Method
To develop our model for software quality evaluation we employ, on the one hand, the
ISO/IEC 9126 International Standard for Software Product Quality. On the other hand, to
aggregate the metrics proposed in the above mentioned standard, we use a Continuous
Logic –the Logic proposed in the Logic Score of Preference (LSP) method. Subsections 2.1
and 2.2 below give an overview of both.
13th Argentine Symposium on Software Engineering, ASSE 2012
41 JAIIO - ASSE 2012 - ISSN: 1850-2792 - Page 313

2.1 The ISO/IEC 9126 International Standard
The ISO/IEC 9126 [7] is an international standard that establishes a set of characteristics to
evaluate Software Quality. The standard is developed by the International Organization for
Standardization (ISO) and the International Electrotechnical Commission (IEC).
Table 1. ISO/IEC 9126 Internal Metrics
1. Functionality metrics 4. Efficiency metrics
1.1. Suitability metrics 4.1. Time behavior metrics
1.2. Accuracy metrics 4.2. Resource utilization metrics
1.3. Interoperability metrics 4.3. Efficiency compliance metrics
1.4. Security metrics 5. Maintainability metrics
1.5. Functionality compliance metrics 5.1. Analyzability metrics
2. Reliability metrics 5.2. Changeability metrics
2.1. Maturity metrics 5.3. Stability metrics
2.2. Fault tolerance metrics 5.4. Testability metrics
2.3. Recoverability metrics 5.5. Maintainability compliance metrics
2.4. Reliability compliance metrics 6. Portability metrics
3. Usability Metrics 6.1. Adaptability metrics
3.1. Understandability metrics 6.2. Installability metrics
3.2. Learnability metrics 6.3. Co-existence metrics
3.3. Operability metrics 6.4. Replaceability metrics
3.4. Attractiveness metrics 6.5. Portability compliance metrics
3.5. Usability compliance metrics
The standard is divided into four parts: quality model, external metrics, internal metrics
and quality in use metrics. The ISO/IEC 9126 quality model sets out six items for the
characteristics to be measured. Table 1 shows the six items and their corresponding sub
items that corresponds to the characteristics that the standard has defined for internal
metrics. An internal metric is one that do not rely on software execution (i.e. static
measure). It is to be noted that the standard also establishes a list of characteristics for
external metrics. External metrics are applicable to running software. Here we have chosen,
for illustrating our approach, only internal metrics, although our methodology can be
applied to both internal and external metrics.
ISO/IEC 9126 defines these six main characteristics as follows [7]:
Functionality metrics are used for predicting if the software product in question will satisfy
prescribed functional requirements and implied user needs. It involve the following
characteristics:
- Suitability that refers to the capability of the software product to provide an
appropriate set of functions for specified tasks and user objectives.
- Accuracy that refers to the capability of the software product to provide the right
or agreed results or effects with the needed degree of precision.
- Interoperability that concerns the capability of the software product to interact
with one or more specified systems.
13th Argentine Symposium on Software Engineering, ASSE 2012
41 JAIIO - ASSE 2012 - ISSN: 1850-2792 - Page 314
- Security that refers to the capability of the software product to protect information
and data so that unauthorised persons or systems cannot read or modify them and
authorised persons or systems are not denied access to them.
- Functionality Compliance that addresses the capability of the software product to
adhere to standards, conventions or regulations in laws and similar prescriptions
relating to functionality.
Reliability metrics are used for measuring the capability of software to maintain its level of
performance under stated conditions. Reliability is defined by:
- Maturity that concern to the capability of the software product to avoid failure as a
result of faults in the software.
- Fault Tolerance that is the capability of the software product to maintain a
specified level of performance in cases of software faults or of infringement of its
specified interface.
- Recoverability that is the capability of the software product to re-establish a
specified level of performance and recover the data directly affected in the case of
a failure. - Reliability Compliance that is the capability of the software product to adhere to
standards, conventions or regulations relating to reliability.
Usability metrics are used for predicting the extent to which the software in question can be
understood, learned, operated, attractive and compliant with usability regulations and
guidelines. Usability comprises:
- Understandability that refers to the capability of the software product to enable the
user to understand whether the software is suitable, and how it can be used for
particular tasks and conditions of use. It determines the ease of which the systems
functions can be understood, relates to user mental models in Human Computer
Interaction methods.
- Learnability is the capability of the software product to enable the user to learn its
application; it relates to the learning effort for different users.
- Operability is the capability of the software product to enable the user to operate
and control it. - Attractiveness is the capability of the software product to be attractive to the user.
- Usability Compliance is the capability of the software product to adhere to
standards, conventions, style guides or regulations relating to usability.
Efficiency is the capability of the software product to provide appropriate performance,
relative to the amount of resources used, under stated conditions. It includes the following
characteristics:
- Time behavior is the capability of the software product to provide appropriate
response and processing times and throughput rates when performing its function,
under stated conditions.
- Resource utilization is the capability of the software product to use appropriate
amounts and types of resources when the software performs its function under
stated conditions.
- Efficiency compliance is the capability of the software product to adhere to
standards or conventions relating to efficiency.
Maintainability is the capability of the software product to be modified. Modifications may
include corrections, improvements or adaptation of the software to changes in environment,
and in requirements and functional specifications.
13th Argentine Symposium on Software Engineering, ASSE 2012
41 JAIIO - ASSE 2012 - ISSN: 1850-2792 - Page 315

- Analyzability The capability of the software product to be diagnosed for
deficiencies or causes of failures in the software, or for the parts to be modified to
be identified.
- Changeability The capability of the software product to enable a specified
modification to be implemented.
- Stability The capability of the software product to avoid unexpected effects from
modifications of the software.
- Testability is the capability of the software product to enable modified software to
be validated.
- Maintainability compliance is the capability of the software product to adhere to
standards or conventions relating to maintainability.
Portability is the capability of the software product to be transferred from one environment
to another.
- Adaptability The capability of the software product to be adapted for different
specified environments without applying actions or means other than those
provided for this purpose for the software considered.
- Installability The capability of the software product to be installed in a specified
environment.
- Co-existence The capability of the software product to co-exist with other
independent software in a common environment sharing common resources.
- Replaceability The capability of the software product to be used in place of
another specified software product for the same purpose in the same environment.
- Portability compliance The capability of the software product to adhere to
standards or conventions relating to portability.
2.2 The Logic Score of Preference Method
The LSP (Logic Score of Preference) method [10], [12], [11], [13], [8], [9] is a method for
the creation and use in the evaluation, optimization, comparison, and selection of all kinds
of complex systems and not necessarily those based on computers.
Figure 1 shows an overview of the LSP method and its different components.
The method proposes:
(a) The creation of a model of the user’s requirements that is called the Preference Tree.
On this tree, the Performance Variables –that are the main attributes of the system–
and their corresponding values are determined. Here the user’s requirements are
elicited so as to be incorporated into the Preference Tree.
(b) The definition of functions called Elementary Criteria. An Elementary Criterion
transforms values from the domain of values a Performance Variable can take into
values in the [0,100] interval. These values represent the percentage of compliance of
the corresponding requirement and are referred as Elementary Preferences.
(c) The creation of an Aggregation Structure. The input to this structure are the
Elementary Preferences obtained from the application of the defined Elementary
Criteria to the Performance Variables. This model is built by aggregating, in as many
levels as is deemed necessary, the Elementary Preferences and the intermediate
resulting preferences by means of Continuous Logic functions called Generalized
Conjunction Disjunction (GCD) operators [13]. The aggregation in intermediate levels
gives partial results corresponding to groups of requirements. The complete final
model of the Aggregation Structure, also called the LSP criterion function, returns a
unique value that is an indicator of the degree of compliance with respect to the total
13th Argentine Symposium on Software Engineering, ASSE 2012
41 JAIIO - ASSE 2012 - ISSN: 1850-2792 - Page 316

requirements of the system.
Figure 1. An overview of the LSP evaluation process.
So if we want to aggregate n elementary preferences E1,...,En in a single preference E, the
resulting preference E –interpreted as the degree of satisfaction of the n requirements– must
be expressed as a function having the following properties:
1. The relative importance of each elementary preference Ei (i = 1...n) can be expressed
by a weight Wi ,
2. min(E1,...,En) ≤ E ≤ max(E1,..., En) .
These properties can be achieved using a family of functions (the weighted power
means):
E(r) = (W1 Er1 + W2 E
r2 +...+ Wn E
r n )
1/r , where
0 < Wi < 100, 0 ≤ Ei ≤ 100, i = 1, ... , n, W1 + ...+Wn = 1, −∞ ≤ r ≤ +∞
The choice of r determines the location of E(r) between the minimum value
Emin=min(E1,...,En) and the maximum value Emax=max(E1,...,En) , giving place to a
Continuous Logic Preference (CPL). For r = −∞ the weighted power mean reduces to the
pure conjunction (the minimum function) and for r = +∞ to the pure disjunction (the
maximum function). The range between pure conjunction and pure disjunction is usually
covered by a sequence of equidistantly located CPL operators (also referred as GCD
operators) named: C, C++, C+, C+–, CA, C–+, C–, C– –, A, D– –, D–, D–+, DA, D+–, D+,
D++, D.
Once the Aggregation Structure has been calibrated using the different GCD operators
and the corresponding weights, then every system under analysis can be evaluated and a
single indicator for each can be obtained.
E0
Function LSP
(Logic
Aggregation
of
Preferences)
Performance
Variables
(Metric
values)
Elementary Criteria
Elementary
Preferences
X1
X2
•
•
•
Xn
E1
g1(X1)
Final
Global
Preference
E2
g1(X2)
En
g1(Xn)
Aggregation
of GCD Operators
13th Argentine Symposium on Software Engineering, ASSE 2012
41 JAIIO - ASSE 2012 - ISSN: 1850-2792 - Page 317

In our case we will obtain –from all the metrics employed– a single aggregated value
between 0 and 100 indicating the degree of quality the software under consideration has
reached. This value could be contrasted with previous values obtained for the different
versions of the same system to asses progress in software quality or against other
competing systems under evaluation.
3 The Aggregated Software Evaluation Model
In this section we show a partial aggregation structure illustrating the proposal with some
examples.
As we said before the LSP method starts by building a Requirement Tree –a structure
that holds all the user’s requirements. In this particular case we start building our
Requirement Tree from the ISO/IEC 9126 list of characteristics and sub characteristics as
shown in Table 1.
Let us note that the tree shown in Table 1 has only two levels: the first level corresponds
to the main software quality characteristics and the second level is where the sub
characteristics are. The Requirement Tree will contain at least three levels, being level three
where new sub characteristics or particular metrics are. We can found in the literature
several different metrics for each sub characteristic in level two, which can be aggregated to
obtain a single value.
To illustrate our approach we are going to suppose that a single value has been obtained
from the evaluation of each particular metric. In general, these values can be of different
data types: real, integer, nominal or categorical (i.e.: bad, poor, fair, good, excellent), etc.
They correspond, in the LSP terminology, to the Performance Variables. For each of them,
the LSP method proposes the definition of an Elementary Criterion function that takes as its
input the value of the corresponding Performance Variable and transforms it to a value in
the interval [0, 100]; these new values are referred in LSP as Elementary Preferences.
By using the GCD operators we combine these Elementary Preferences to construct an
evaluation model or LSP Aggregation Structure. This model corresponds with the user’s
needs –in this case the needs to perform a particular software quality evaluation.
Let us suppose that, according to the user’s needs, item 2 (Reliability) has a high
significance. This can be represented by penalizing those models whose sub items, namely
2.1, 2.2, 2.3 and 2.4, have values less than a given threshold u. Therefore the corresponding
Elementary Criteria (ec2.i) for items 2.1, 2.2, 2.3 and 2.4, could be defined as in equation
(1):
where:
ec2.i is the Elementary Criterion for the Performance Variable x2.i (1≤ i ≤ 4).
norm is a transformation function that returns a value in the interval [0,100].
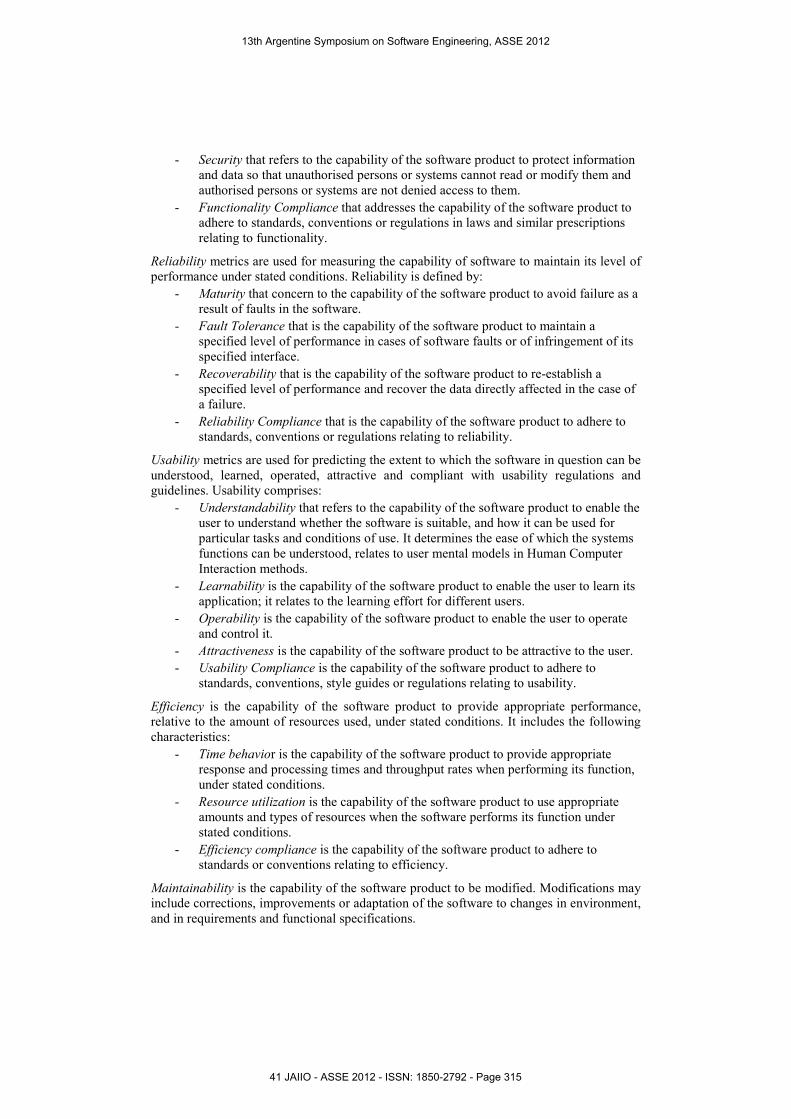
In Figure 2 we can see an Aggregation Structure where the Elementary Preferences
obtained from the application of the Elementary Criteria ec2.i(x2.i, ui) corresponding to the
sub characteristics 2.1 (Maturity), 2.2 (Fault tolerance), 2.3 (Recoverability) and 2.4
(Reliability compliance) have been aggregated using the GCD operator CA. CA is a
mandatory function meaning that if any of the Elementary Preferences that constitute item 2
is zero (i.e. the value given by the Elementary Criterion defined in equation (1) for each sub
characteristic 2.i) then the mandatory aggregation operator will return zero whichever value
the other variables have taken.
ec2.i (x2.i, ui) = 0 if x2.i < ui
norm(x2.i ) (1)
13th Argentine Symposium on Software Engineering, ASSE 2012
41 JAIIO - ASSE 2012 - ISSN: 1850-2792 - Page 318
Note that apart from being able to choose the GCD function, each of the inputs has an
associated weight that plays a part in the final value. In the case shown in Figure 2, item 2.2
has a greater weight than the other items therefore its value will have a bigger impact in the
total value of the CA function. This fact has been explained in Section 2.2.
In the example shown in Figure 2 we have chosen the CA function, but in case we
wanted to make it more conjunctive making at the same time the aggregated characteristics
more mandatory, then the functions C+ or even C could had been chosen.
Figure 2. The mandatory conjunctive GCD function CA returns 0 if any of the inputs 2.i is 0.
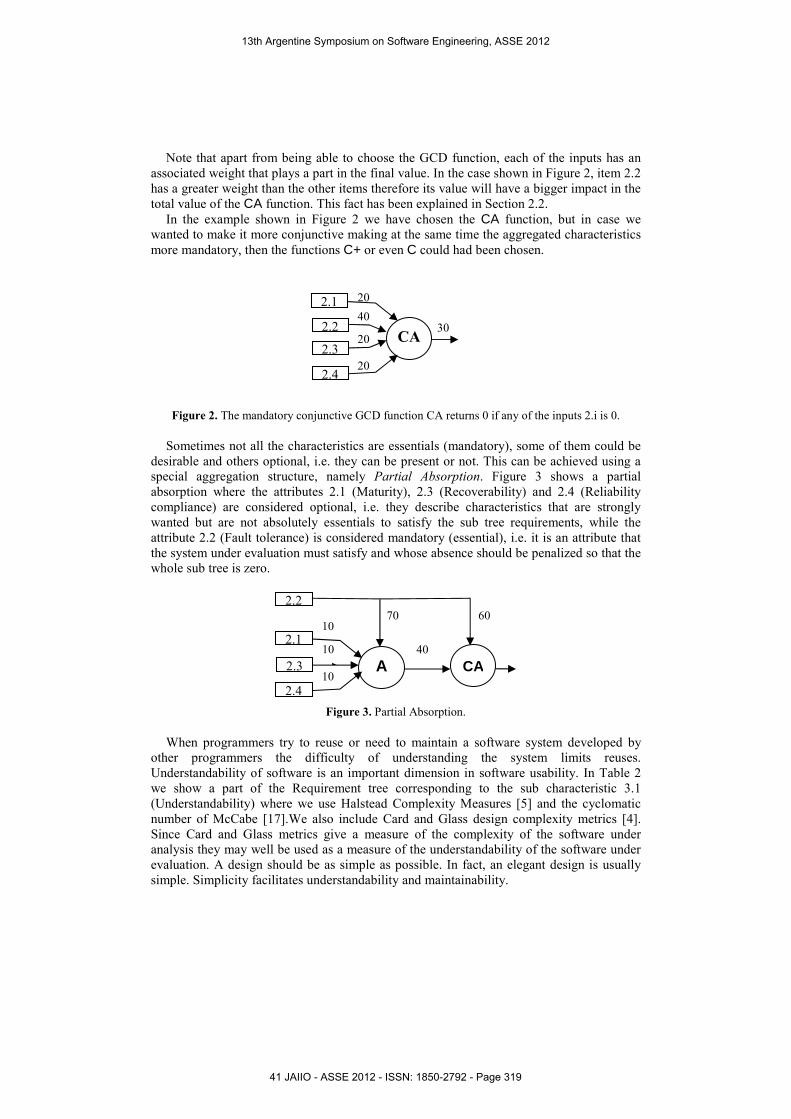
Sometimes not all the characteristics are essentials (mandatory), some of them could be
desirable and others optional, i.e. they can be present or not. This can be achieved using a
special aggregation structure, namely Partial Absorption. Figure 3 shows a partial
absorption where the attributes 2.1 (Maturity), 2.3 (Recoverability) and 2.4 (Reliability
compliance) are considered optional, i.e. they describe characteristics that are strongly
wanted but are not absolutely essentials to satisfy the sub tree requirements, while the
attribute 2.2 (Fault tolerance) is considered mandatory (essential), i.e. it is an attribute that
the system under evaluation must satisfy and whose absence should be penalized so that the
whole sub tree is zero.
Figure 3. Partial Absorption.
When programmers try to reuse or need to maintain a software system developed by
other programmers the difficulty of understanding the system limits reuses.
Understandability of software is an important dimension in software usability. In Table 2
we show a part of the Requirement tree corresponding to the sub characteristic 3.1
(Understandability) where we use Halstead Complexity Measures [5] and the cyclomatic
number of McCabe [17].We also include Card and Glass design complexity metrics [4].
Since Card and Glass metrics give a measure of the complexity of the software under
analysis they may well be used as a measure of the understandability of the software under
evaluation. A design should be as simple as possible. In fact, an elegant design is usually
simple. Simplicity facilitates understandability and maintainability.
2.1
CA
20
20
30 2.2
2.3
2.4
40
20
2.1
A
10
10
40
2.2
2.3
2.4
10
CA
70 60
13th Argentine Symposium on Software Engineering, ASSE 2012
41 JAIIO - ASSE 2012 - ISSN: 1850-2792 - Page 319

Table 2. Item 3.1 Understandability.
3.1.1. Halstead’s complexity.
3.1.1.1. Calculated length (n)
3.1.1.2. Volume (V)
3.1.1.3. Difficulty (D)
3.1.2. McCabe’s cyclomatic number (M)
3.1.3. Card & Glass’s complexity
3.1.3.1. Structural complexity (S(i))
3.1.3.2. Data complexity (D(i))
3.1.3.3. System complexity (C(i))
Halstead has proposed metrics for length and volume of a program based on the number
of operators and operands. Halstead’s metrics basically produces –among others– the
Program Vocabulary (n), the Program Length (0), the Volume (V) and the Difficulty (D).
The cyclomatic number of McCabe (M) represents the number of linearly independent
execution paths through the program. For a well structured module, the cyclomatic number
is simply one plus the number of branching statements in the module.
Card and Glass define three measures for design complexity: structural complexity
(S(i)), data complexity (D(i)) and system complexity (C(i)). Let us note that the software
architectural complexity increases at the same time that the complexity measures increase
as well. The complex architecture is inversely proportional to the software
understandability.
Figure 4. LSP Aggregation Structure for item 3.1.
Figure 4 shows a typical LSP aggregation for the sub structure corresponding to item 3.1
(Understandability). In this aggregation structure the characteristics have been classified in
three groups: essential, desirable and optional. Essential parameters are those that describe
aspects that the system under evaluation must satisfy and whose absence must be penalized
in such a way that the whole sub tree evaluates to zero. Desirable parameters are those that
describe features that are strongly desired but are not absolutely essential for satisfying the
requirements of the sub tree; therefore its absence does not cause the preference rating to be
zero. Optional parameters describe features of a system that are nonessential and whose
presence or absence impacts minimally on the overall preference rating of the sub tree.
CA
3.1.1.1 20
3.1.1.2
3.1.1.3
3.1.2.
3.1.3.3
3.1.3.2 A A
20
60
33
33
80
80
30
3.1.3.1
C-
70 33
A C- 20 20
70
30
13th Argentine Symposium on Software Engineering, ASSE 2012
41 JAIIO - ASSE 2012 - ISSN: 1850-2792 - Page 320

In this model, we can see that the item 3.1.1 (Halstead Complexity) is more mandatory
than the item 3.1.2 (McCabe’s cyclomatic number), which has been considered a desirable
requirement. At the same time item 3.1.3 (Card & Glass’s complexity) has been considered
optional. These differences are expressed not only through the corresponding weights but
also by the assignment of more conjunctive GCD operators as it is shown in the aggregation
shown in Figure 4.
Let us note that both the desirable preference (item 3.1.2) and the optional preference
(items 3.1.3.x) may be zero, but if the essential preference (item 3.1.1) is not zero, then the
aggregate preference will also be not zero. However, in some situations, it may be
reasonable to expect that the evaluated systems will have optional and desirable preference
that also evaluates to nonzero values. In these cases it is possible to use a simpler
aggregation structure as that shown in Figure 5.
In this new aggregation structure we have assumed that desired and optional items are
non zero. Under this assumption, the aggregation structure yields similar results as the
structure of Figure 4. Obviously, this is a critical assumption since otherwise the zero rating
of the desired and optional items would yield a zero rating for the whole structure.
Figure 5. An alternative LSP Aggregation Structure for item 3.1.
4 Discussion and Future Work
Being able to aggregate all the different metrics in one value is an important asset for
software quality analysts since it gives them the ability to compare quickly and simply not
only different implementations of the same kind of software –with the same functionality–
but it also gives the opportunity to compare different versions of the same software at
different development stages.
The aggregation of software quality metrics using the LSP method –presented here–
allows a complete aggregation of the desired characteristics but it also allows partial
aggregations, namely only one or more metrics of the software quality method chosen and
not necessarily the complete ISO/IEC 9126 standard. However, having the complete
aggregation model does not limit the capability of having partial results since the LSP
model permits the collection of these partial results through partial aggregation structures
that are part of the entire model.
Experimenting with different aggregation models is an easy task since, at the very least,
it only involves changing functions or weights, especially if a software tool is used to
construct and calibrate the model [1].
CA
3.1.1.1 20
3.1.1.2
3.1.1.3
3.1.2.
3.1.3.3
3.1.3.2 A A
20
60
33
33
80
80
30
3.1.3.1
C-
70 33
CA
20 20
13th Argentine Symposium on Software Engineering, ASSE 2012
41 JAIIO - ASSE 2012 - ISSN: 1850-2792 - Page 321

As part of future work we are considering applying the proposed approach in a more
industrial setting comparing different versions of a given software as well as a same kind of
software product developed by different software development teams.
We also believe that the approach presented here can be further explored extending it to
other standards such as ISO/IEC 14598 [6] that is sometimes used in conjunction with
ISO/IEC 9126 amongst others.
References
[1] A. Dasso, A. Funes, M. Peralta, C. Salgado, “Una Herramienta para la Evaluación de
Sistemas”, Proceedings de WICC 2001, San Luis, Argentina, 22 de Mayo de 2001.
[2] A. Serebrenik, M. van den Brand, “Theil index for aggregation of software metrics values”. In
ICSM, pages 1–9, IEEE Computer Society, 2010.
[3] B. Vasilescu, “Analysis of Advanced Aggregation Techniques for Software Metrics”. Master
thesis, Eindhoven University of Technology, Department of Mathematics and Computer
Science. Eindhoven, Netherlands, July 2011.
[4] Card, D., y N. R. L. Glass, Measuring Software Design Qualit-y, Prentice-Hall, 1990.
[5] Halstead, Maurice. “Elements of Software Science”. Elsevier North-Holland, Inc.
Amsterdam, 1977.
[6] ISO/IEC 14598 Information technology, Software product evaluation. URL: www.iso.org/
[7] ISO/IEC TR 9126, Software engineering - Product quality, Parts 1, 2, 3, 4. ISO/IEC 2001.
URL: www.iso.org/
[8] J. J. Dujmovic and A. Bayucan, “Evaluation and Comparison of Windowed environments”,
Proceedings of the IASTED Interna Conference Software Engineering (SE'97), pp 102-105,
1997.
[9] J. J. Dujmovic and R. Elnicki, “A DMS Cost/Benefit Decision Model: Mathematical Models
for Data management System Evaluation, Comparison, and Selection”, National Bureau of
Standards, Washington, D.C., No. NBS-GCR-82-374, NTIS No. PB82-170150 (155 pages),
1982.
[10] J. J. Dujmovic, “A Method for Evaluation and Selection of Complex Hardware and Software
Systems”, The 22nd International Conference for the Resource Management and Performance
Evaluation of Enterprise Computing Systems. CMG96 Proceedings, vol. 1, pp.368-378, 1996.
[11] J. J. Dujmovic, “Continuous Preference Logic for System Evaluation”, IEEE Transactions on
Fuzzy Systems, Vol. 15, Nº 6, December 2007.
[12] J. J. Dujmovic, “Quantitative Evaluation of Software”, Proceedings of the IASTED
International Conference on Software Engineering, edited by M.H. Hamza, pp. 3-7,
IASTED/Acta Press, 1997.
[13] J.J. Dujmovic, “Characteristic forms of generalized conjunction/disjunction”; En Fuzzy
Systems, 2008 (FUZZ-IEEE 2008). (IEEE World Congress on Computational Intelligence).
1-6 June 2008, pp. 1075 – 1080, ISSN: 1098-7584, E-ISBN: 978-1-4244-1819-0, Print ISBN:
978-1-4244-1818-3.
[14] K. Mordal-Manet et al., “An empirical model for continuous and weighted metric
aggregation”. 2011 15th European Conference on Software Maintenance and Reengineering.
March 1–4, 2011, Oldenburg, Germany
[15] L. Etaati, S. Sadi-Nezhad, A, Makue, “Using Fuzzy Analytical Network Process and ISO
9126 Quality Model in Software Selection: A case study in E-learnig Systems”. Journal of
Applied Sciences 11 (1): 96-103, 2011, ISSN 1812-5654 / DOI: 10.3923/jas.2011.96.103
13th Argentine Symposium on Software Engineering, ASSE 2012
41 JAIIO - ASSE 2012 - ISSN: 1850-2792 - Page 322

[16] M. Goeminne, T. Mens. “Evidence for the Pareto principle in Open Source Software
Activity”. Fifth International Workshop on Software Quality and Maintainability (SQM 2011)
Oldenburg, Germany, March 1, 2011.
[17] McCabe, T.H. A complexity measure. IEEE Trans. Softw. Eng. SE-2, 6 (Dec.1976). 308-320.
[18] R. Vasa, M. Lumpe, P. Branch, O. Nierstrasz. “Comparative Analysis of Evolving Software
Systems Using the Gini Coefficient”. Proceedings of the 25th International Conference on
Software Maintenance (ICSM 2009), pp. 179–188, IEEE Computer Society.
[19] Squale Model. http://www.squale.org/
13th Argentine Symposium on Software Engineering, ASSE 2012
41 JAIIO - ASSE 2012 - ISSN: 1850-2792 - Page 323